1
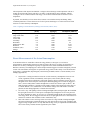
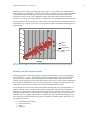
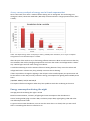
Night Hawks deliverable 2.2, 21 Sep 2013 Survey of Existing Relevant Material and Tools Jan Jantzen and Michael Kristensen Samso Energy Academy, Strandengen 1, 8305 Samso, Denmark [email protected] Abstract. This project report collects and summarises the existing material concerning energy checks among the eight partners of the Night Hawks project. The report approaches energy advices from a physics oriented point of view in order to create a solid foundation. The goal is to arrive at a fairly short checklist that can be applied by energy advisors in shops, shopping centres, and retail parks. The report provides a list of 22 advices with proposals for calculating the savings in terms of energy units and relative saving factors in percent. These advices will be the basis for an upcoming course for energy advisors. Contents Introduction ................................................................................................................................................ 2 Energy Saving Advices Based on Physics .................................................................................................. 3 Night Walks May Reveal Unnecessary Energy Loads ............................................................................... 6 Checklist Approaches and Saving Factors ................................................................................................. 7 What is the Normal Consumption?............................................................................................................. 8 Direct Measurement of the Actual Consumption ......................................................................................10 Summary and Recommendations ..............................................................................................................12 Acknowledgement and Disclaimer ............................................................................................................14 Bibliography ..............................................................................................................................................15 Appendix A. Field Report by Peter Karlsson, Linköping University, Visit to Samso 2-5 Jul 2013 ..........17 1 Night Hawks deliverable 2.2, 21 Sep 2013 Introduction The Night Hawks project concerns energy savings in shops and shopping centres as opposed to households or industries. Some Night Hawks partners already have material and experience within energy savings, and this report surveys the existing practices among the partners in order to create a starting point. The Night Hawks project description defines the objective for this report, as follows: o Objective. To identify already existing tools and material developed internationally or nationally in order to share them and implement them into the Night Hawks project (Night Hawks, 2013). Thereafter, in a following task, the Samso Energy Academy (SE) will extract the essential material, create an online handbook, and disseminate the outcome to the other partners by distance teaching. There is a German example of a virtual enterprise on the Web, which is useful for self-study (Energieagentur.NRW, 2013b). Shopping centres, retail parks, and shops are the target energy consumers of the project, because they are large consumers and very visible (Night Hawks, 2013). Lighting, air conditioning, heating, hot water, elevators, and escalators all consume energy, most of it electric. The cooling demand can be higher than the heating demand, even in colder climates, because the lights and the occupants emit more heat than needed in the building. Lighting is the largest and most visible part of the energy consumption. The heat produced by lights is rarely recycled into the heating system; instead the lights cause a higher demand for cooling. Energy advisors will visit volunteer enterprises from the target group and perform energy checks. The advisors will employ night walks as a method for discovering potential savings. A night walk is an energy check of the site after hours (evening, night, morning, weekend), in order to identify the idle consumption and potential sources of energy loss. It is a Swedish concept, which has existed for some years (Energimyndigheten, 2010). A shop owner may be motivated to accept an energy check by the prospect of saving money, but energy savings are also aligned with the legislation (Fig. 1). The European directive for energy efficiency establishes a common framework of measures in order to achieve the 2020 20 % headline target on energy efficiency (European Parliament, 2012). Quoting from the directive, energy savings means an amount of saved energy determined by measuring and/or estimating consumption before and after implementation of an energy efficiency improvement measure. The Night Hawks energy check is less detailed than an energy audit. The latter is 'a systematic procedure with the purpose of obtaining adequate knowledge of the existing energy consumption profile (...), identifying and quantifying cost-effective energy savings opportunities, and reporting the findings' (European Parliament, 2012). On the contrary, our energy check will be performed in a few hours by an energy advisor, and the result is a rough estimate. The energy check should thus be viewed as a precursor, which promotes an energy audit — it is not meant to be a competitive action. The energy efficiency area is large, and in order to limit the scope of this report, the project partners were asked to point to certain types of material only. Consequently, a large part of the area is excluded from this report, such as: waste management, sustainability, environmental impact assessment, life cycle cost calculations, and project management. Although economic appraisal (payback period, return on investment) is an important part of official energy audits, it is also excluded from this report, because it will be too time consuming within Night Hawks to find prices for refurbishment in each participating country. The partners were instead asked to report back on the following topics of interest: energy audits and standards; performance indicators, statistics, catalogues of saving factors; checklists, guidelines, procedures; engineering calculations; software tools, including simulation; hardware tools; and training material. 2 Night Hawks deliverable 2.2, 21 Sep 2013 We have some requirements that define the scope of our approach. It should be simple enough that an energy advisor will be able to perform an energy check after a little practice. The result should be presented quickly to the shop owner showing our estimate of the savings in terms of energy (kilowatt-hours) and money (euro or the local currency); the energy check may include payback periods, if available, but to make a cash flow calculation from scratch is not a requirement. The energy check should be over in a short time. The energy check gives just a first estimate of the savings at that particular point in time; it is thus far from a certified energy audit, but rather an inspiration to perform such an energy audit. The calculations must be as relevant as possible, allowing for the local climate and local prices. The following sections summarise the findings with an eye to what is necessary and sufficient for the upcoming handbook and training. Figure 1. Why should I save energy? If a consumer wishes to save energy (left), it is in agreement with national and EU goals (right). Energy savings are a 'playground' for energy agencies. Energy Saving Advices Based on Physics "Close the door!" is a common energy saving advice in Denmark. Obviously, closing the front door in the winter time will save some heating energy, and most people, even children, will abide by the advice. Two other examples of climate independent advices are the following: (1) to only use the dishwasher if it is full, and (2) to shut the tap when running water is unnecessary. These advices arise from common sense or, let us say, folk wisdom. There are many folk wisdom advices on the World Wide Web, also relevant for shops and industries (Energimyndigheten, 20xxb). The following lists three good advices (adapted from Energimyndigheten, 20xxe): Insulate the heating installation Make the portal air tight Close the portal when possible However educational these advices may be, they lack numerical information about how much is saved, in terms of kilowatt-hours of electricity, litres of oil, or megawatt-hours of district heating. Night Hawks promises, in a performance indicator, a number of savings in kilowatt-hours (Night Hawks, 2013). Furthermore, the energy efficiency directive, quoted earlier, speaks of the energy consumption before and 3 Night Hawks deliverable 2.2, 21 Sep 2013 after implementing an energy efficiency measure. Night Hawks must, accordingly, associate numerical measurements or estimates with the saving advices. Advices based on physics are more difficult to devise, but they are on a more solid foundation than folk wisdom, and they have broader scope. The diagram in Figure 2 portrays the physics of a general energy flow. The diagram indicates three major saving advices (Klaesener, et al., 2013), as follows: 1. 2. 3. Reduce the end-use consumption. Improve the efficiency of fossil fuel conversion. Increase the share of renewable energy in the fuel. Advice (1) is related to behaviour, and reducing the consumption is usually costless or inexpensive. Advice (2) is related to the building envelope, the efficiency of the energy conversion units, and the reduction of losses. Advice (3) is related to free energy; an investment is required to access a source of renewable energy, but the investment can be economically viable. The three items even form steps in a Swedish fourstep procedure for finding energy savings (Energimyndigheten, 2010) — their fourth step concerns CO2 quota compensation. Figure 2. Elementary energy flow. The physical relationship between the indoor and the outdoor temperature in a building is simple, in the sense that it is a linear relationship (Klaesener, et al., 2013). Figure 3 illustrates a heated building with indoor temperature Ti, heat loss Q, and an outdoor temperature To, which is assumed lower than the indoor temperature for the case of illustration. However, the following is also valid in the case of cooling (To > Ti). One model is to view the wall as a resistor: The higher the resistance R, the less heat flows out of the house. The heat flow is proportional to the temperature difference, as described by the following fundamental law: Q Ti To R (1) It is thus the temperature difference that drives the flow of heat through the wall, depending on the degree of insulation expressed as R. The corresponding energy consumption is the flow of heat Q accumulated over time. Equation (1) indicates two ways to reduce the heat loss: (1) to decrease the difference between the indoor and outdoor temperatures by adjusting the indoor temperature and (2) to increase the resistance R by adding more insulation. The same reasoning can be applied to a hot water tank. 4 Night Hawks deliverable 2.2, 21 Sep 2013 Figure 3. Heat transfer. Definition of variables. Since the partners of Night Hawks come from eight different countries, it is necessary to consider the local climate. The local climate affects the average outdoor temperature and the average temperature of the main supply of water (groundwater). An overview of the energy flow helps to identify savings or the saving potential. Figure 4 shows a map of the energy flow of a whole enterprise (Energimyndigheten, 2010). For example, if it is known that lowering the temperature inside the offices from 22 °C to 21 °C saves 8 % energy, the diagram helps to calculate the saved megawatt-hours (MWh). According to the diagram, the consumed energy is 566 MWh for indoor comfort. The energy saved would be 8 % of that, or 45 MWh. The map requires measurements by means of various kinds of hardware devices (ampere meters, watt meters, smart meters, calorimeters). Furthermore, it requires access to statistics, characteristic key figures, and engineering calculators. Unfortunately, it is prohibitively time consuming to map everything 100 % correct, but less accuracy is usually sufficient for all practical purposes. There are software tools that can draw such a diagram (PINE, 2012) (PINE, 20xxb), for example in the form of a Sankey diagram, which is an energy flow diagram with some diagrammatic constraints. An energy flow diagram can also be part of an energy performance certificate (SAENA, 2011). It is most relevant for the EU, and also the most difficult, to consider the so-called primary energy in connection with energy savings and emissions (primarily CO2). The term primary energy consumption refers to the gross inland consumption (European Parliament, 2012). That is, primary energy is energy found in nature that has not been converted to other forms of energy. Evidently, it is the primary energy that the EU and national governments wish to protect. A part of the primary energy is converted into secondary energy, which is more convenient for the consumers, for instance: electricity, petrol, or hydrogen. Secondary energy is converted by machinery to end-use energy, for instance: heating, cooling, or hot water. As a rule of thumb, a saved kilowatt-hour of electricity is equivalent to 2.5 kilowatt-hours of primary energy (IEE, 2013), since electricity is formed from primary energy with an overall efficiency of roughly 40 %. Again, it is difficult to back-propagate a saving of end-use energy to find the exact composition of the primary energy. In order to calculate the amount of fossil fuel that was used to produce electricity (coal, oil, gas), the local electricity provider must supply the emission factors. They will always be approximate, since nobody knows exactly where the electricity is produced. It is easier, and more relevant for a shop owner, to calculate the savings of end-use energy. That is, the saved end-use fuel in terms of its own energy content in kilowatt-hours. In order to find that energy, the saved amount of fuel (oil, natural gas, liquid pressurised gas) must be multiplied by its heating value (Energistyrelsen, 2012). The situation is the same in the case of emissions. We can calculate the saved emissions as a factor times the saved amount of end-use fossil fuel (IPCC, 2013). This will be an approximation, since we disregard the losses from converting primary energy to secondary energy. In the case of electricity, we could multiply 5 Night Hawks deliverable 2.2, 21 Sep 2013 by the factor 2.5 mentioned earlier to find the equivalent amount of fossil fuel saved in tonnes of oil equivalents (toe). The calculations easily become rather complex. We may conclude, however, that it is a good idea to keep a separate account of the electricity saved, owing to the gain of 2.5 from electricity to equivalent fossil fuel. Figure 4. Energy flow diagram of an enterprise (adapted from Energimyndigheten, 2010). Night Walks May Reveal Unnecessary Energy Loads The night walk is a simple, understandable and attractive way for the shopping centres, retail parks and shops to start to work with energy efficiency. It works as an eye opener for the energy efficiency potential (Night Hawks, 2013) (Energimyndigheten, 2011). A night walk is a check of the shopping area after hours, when nobody is present (evening, night, weekend, or holidays). The energy advisor may discover open freezer compartments, running ventilation, lights that are on, and computers in standby mode. Sometimes the lights are turned on early in the morning, although it could be sufficient to switch on only parts of it (zones) before the shop opens (Rydqvist, 2010). The idle consumption is the energy consumption when the shop is idle (empty), and this is sometimes unnecessarily high. An energy advisor performs the walk together with a staff member, and the walk can be used as a natural introduction to the energy check at the site. Nightly setback of the room temperature fits well into the night walk concept. If the room temperature is decreased by 1 degree, some energy losses through the building envelope will be saved, in accordance with Equation (1). It is therefore useful if the energy advisor uncovers the thermostatic device that controls the temperature, if there is one, and to discuss with the staff member if it would be acceptable to reduce the heating during the night, weekends, and holidays. Ventilating the room or the building with cool outdoor air during the night will increase the cooling, so this is an advice to be aware of. 6 Night Hawks deliverable 2.2, 21 Sep 2013 Example. Given that the average outdoor temperature at Samso is To = 9 deg celsius, and the heating unit keeps the indoor temperature at Ti = 21 degrees, then the temperature difference is on average To – Ti = 21 – 9 = 12 degrees. Lowering the indoor temperature by 1 degree saves 1 out of the 12 degrees difference, that is, 1/12 of the energy spent to balance the losses through the walls. Limiting to 8 hours during the night saves just 8/24. The total saving is thus (8/24)×(1/12) = 1/36. This is equivalent to about 3% saved for every degree that the night temperature can be lowered. If the room contains food coolers, the same action even saves cooling. End of example. The example shows that significant amounts, depending on the climate, could be saved by nightly setback. It is therefore useful to measure the indoor temperature during the night, or even log the temperature during a longer period (24 hours, one week, one month, or a whole year). Equation (1) indicates that saving advices related to changes to the indoor (or hot water) temperature depend on climate, through the outdoor temperature To. For a given location, it is thus necessary to estimate the average outdoor temperature on a monthly basis, the average main water supply temperature in the case of hot water, as well as heating and cooling degree days on a monthly basis. These are all available in the RETScreen software package, which is downloadable and free of charge (RETScreen International, 2005). Figure 5 shows a simulation of a hot water tank before and after introducing nightly setback. Before, the temperature is steady just below 55 °C. After introducing setback, the temperature starts to drop when the setback kicks in. At the end of the setback period, the temperature rises fairly quickly to its operational level. The temperature drop has the shape of a downward triangle, and thus the average temperature during this period is lower; the losses are proportional to temperature and therefore lesser. For simplicity, there is no consumption of water during the simulation period (tank volume is 110 litres, losses are 9.7 W/K corresponding to no insulation, ambient temperature is 21 °C). Figure 5. Nightly setback in a hot water tank. The power (a) is off for 12 hours every night, and the temperature (b) dips during those hours. The dash-dotted line shows the situation before introducing setback. Horizontal axes indicate time (hours). Checklist Approaches and Saving Factors The ideal situation for the energy advisor is to have a checklist to follow, which also gives quantities of energy saved. The Swedish Energy Agency promotes a checklist for enterprises (Energimyndigheten, 20xxc) (Energimyndigheten, 20xxe). There are eight pages of questions to consider, with the following headings: general questions, heating, building envelope, cooling, hot water, lights, ventilation, electricity, compressed air, machinery, and transportation. Since Night Hawks concerns shops, only a subset of categories will be relevant, that is: heating, cooling, lights, and ventilation. The Swedish Energy Agency even published a similar checklist specifically for night walks (Energimyndigheten, 2010) as well as other checklists (Energimyndigheten, 2013). There is a German checklist regarding lights (SAENA, 2013) and an Italian questionnaire for self-assessment of the energy consumption1. 1 http://www.unioncameredelveneto.it/content.asp?ID=429 7 Night Hawks deliverable 2.2, 21 Sep 2013 8 Those checklists contain yes/no boxes to be filled and areas for free text comments, but there are no indications of the magnitude of the savings. Quite oppositely, the Danish Energy Agency publishes and maintains a long list of official saving factors related to replacements (Teknologisk Institut, 2013). For example, replacing a circulation pump with three speeds by a continuously controlled 'class A' pump saves 280 kilowatt-hours per year. The actual savings could be higher, but this is the officially approved factor (in Denmark). The list contains similar factors concerning lights, district heating, gas boilers, building envelope, coolers/freezers, office equipment, cooking, oil boilers, PV panels, solar hot water panels, heat pumps, and washing devices. It is straight forward to use, and the saving factors are officially approved ratings. The list is limited, however, to equipment replacements in households. In a similar manner, the PINE project provides saving factors for the best available technological solutions for a range of (industrial) components (PINE, 20xxa). There are many advices in a Swedish publication specifically for shops; it estimates saving factors within a range of uncertainty (EEF, 20xx). The Nordic Ecolabel organisation provides an online tool (Svanen, 2010). It summarises the energy usage of a shop and shows the climate impact in terms of emissions. The user inputs data about the energy consumption and fuel types, information about refrigerators and freezers, coolants and cooking. The result is the number of tonnes of CO2 emitted and the amount of primary energy consumed in kWh/year. The Danish Energy Service issues a certificate, Green Shop, if the shop fulfils a certain set of criteria that include some energy measures (Energitjenesten, 2010)(Energitjenesten, 2013). There exists a spreadsheet tool with a short list of advices (Klaesener, et al., 2013). The spreadsheet calculates the savings once the number of items has been agreed with the owner; see the example in Table 1. It is clear that the savings owing to a replacement of an electric device is easier to calculate than savings owing to heating/cooling advices. Table 1 includes the heating advice: Lower the temperature by 1 degree. In this case, the saving factor is a relative factor, in percent, of the observed consumption for heating. For example, given that advice number i (i in 1, 2, …) saves xi kilowatt-hours on heating, the relative saving factor is defined as follows: fi xi 100 X (2) In our case it is possible to estimate fi, as shown earlier, but it is necessary to measure, or estimate, that part X of the total energy consumption which concerns heating in order to find xi. This can be difficult in the case of electric heating, for example, if all electric consumption, including lights, is measured altogether by a single meter. The spreadsheet is built for households, though, and some of the advices do not fit shops. Table 1. Simple checklist. The advisor inputs the number of items, and an underlying spreadsheet calculates the savings of energy and money. Advice Saving per item Unit Items (input) Saved energy [kWh] Energy price [EUR/kWh] Saved money [EUR] Replace 1 old circulation pump by a class A pump 280 kWh 2 560 0.18 101 Lower the indoor temperature 1 degree to save heating 4.5 % 1 636 0.12 74 What is the Normal Consumption? We would like to uncover whether a shop spends little or much energy. A norm would be ideal as a reference, but there is only little consensus about this. Building regulations provide threshold values that could be used as a guide (BELOK, 2011a). These values apply to new buildings, however. There are other lists of target values and benchmark figures (Energieagentur.NRW, 2013a). Night Hawks deliverable 2.2, 21 Sep 2013 The energy consumption depends, among other things, on the heated floor space, what kind of shop it is, the climate, and the number of occupants. The Night Hawks partners have nevertheless delivered a little guidance (Night Hawks, 2013). Sweden. The largest potential is within lighting, ventilation and cooling systems for food storage. The specific usage of electricity is very different in different kind of shops, but the largest share of electricity usage is lighting (41% of the total electricity consumption). France. Lighting represents 48% of the total energy consumption of a shopping centre, ventilation accounts for 16%, heating for 4%, and air conditioning for 5%. German, Austrian, Swiss retail trade. In the retail sector, lighting needs 25.9 % (food trade), or even 57 % (non-food trade) of the total electricity consumption. Thus, lighting is the largest electricity consumer in the non-food trading sector. In the food-trading sector, this is cooling with 45.2 % and therefore ahead of lighting and air conditioning with a share of 10.9 % of an enterprises’ power consumption. The three statements agree that lights account for a large share of the electricity consumption. In Denmark a shopping centre consumes electricity at an average rate of 50 kWh per m2 annually, and a retail shop with food consumes four to five times as much (Energiforum, 2013a). At the EU level, the trade sector consumes 30% of the total electricity. For almost all countries, the trade sector represents the largest share of electricity consumption (Odyssee, 2013). Lighting is well understood, and there are very good detailed descriptions concerning light quality and quantity (SAENA, 2013) (SAENA, 2013b) (Energimyndigheten, 2012) (Energimyndigheten, 20xxa). It is common practice to estimate the installed power, simply by counting the number of lamps and multiply by their rated power. One key figure is the installed power per square metre, and it is straightforward to compare the observed number with a recommendation (Table 2). Often the easiest action is to reduce excessive lighting. A European standard (EN 12464-1) recommends the following values, among others: 100 lux for corridors, 300 lux for a sales area or a reception desk, and 500 lux for a till area or for reading, typing, and data processing in an office. There are many such standard values for lighting of indoor workplaces (Zumtobel, 2011). Example. A handheld lux meter measures 750 lux in an office workplace with a computer. The European recommendation is to have 500 lux. The relative saving factor is thus (750 – 500)/750 = 250/750, which is equivalent to 33%. It is thus possible to save 33% of the energy spent on lights just by removing enough light bulbs to reach the target value (assuming that the energy is proportional to the lux values). End of example. Many ventilation systems consume more than 100 000 kWh per year counting both electricity and heating. The following three general advices reduce the energy consumption (Poulsen, 20xx): Decrease the operating hours of the ventilation Decrease the temperature of the air injected into the room Decrease the air flow It is not necessary to start the ventilation when the first person arrives in the morning, because one person makes only a little difference to the air quality. Instead, it is reasonable to start the ventilation when 50 % of the occupants have arrived, and to stop it again after 50 % of the occupants have left the building. This scheme is recommended by the Copenhagen municipality in Denmark, but other countries may have stricter regulations or recommendations that disqualify such a scheme. 9 Night Hawks deliverable 2.2, 21 Sep 2013 10 The temperature of the injected air should be 1-2 degrees below the target room temperature. The air is usually injected from the ceiling, and since it is colder, it will fall and get mixed, naturally, with the existing air. The air contains moisture and energy is saved when air and moisture is heated to a lesser temperature. If possible, one should try to lower the air flow, because it saves both electricity and heating. Many ventilation plants have a choice between two air flow speeds. Switching to 1/2 of the air flow will often result in 1/8 of the electricity consumption. Table 2. Lighting recommendations by Minergie, Switzerland (SAENA, 2013). Application Single or group office Large-room office Class room Lecture hall Food shop Restaurant Multi-purpose hall Bedroom Production (fine) Storage Installed power [W/m2] 19.4 11.0 14.4 11.1 13.6 5.9 9.4 3.9 13.4 10.0 Usage [h][target] 580 1610 730 1460 4250 1600 2260 2640 2180 2510 Specific energy consumption [kWh/m2] 11.25 17.75 10.5 16.25 58.0 9.5 21.25 10.25 29.25 25.0 Direct Measurement of the Actual Consumption As mentioned earlier we would like to know the energy balance, as in Figure 4, or at least an approximation. Assuming that electricity accounts for most of the energy in a shop, one approach is to measure the electricity consumption of groups of equipment at the electric distribution board. Peter Karlsson (University of Linköping) uses current clamps with data loggers to measure strategically selected circuits. He visited Samso, and together we performed energy checks in three shops: a TV and electronics shop (Expert), a supermarket (Superbrugsen), and a bank (Jyske Bank). Below is a short summary of our findings (Appendix A). Supermarket. Cooling accounts for at least 44 % of the electricity consumption. There are cool rooms (vegetables, butcher) surrounded by warm spaces, and it is likely that the cooling equipment is driven into saturation (it runs at full speed) by the heat exchange between the cool and warm rooms. In an older part of the shop the installed lighting power is relatively high (18.5 W/m2), and it is likely that it could be brought down to the level of the new part (10 W/m2). We shall investigate whether it is possible to apply nightly setback of the temperature in the shop (21 C) and the butcher (14 C). Furthermore, we will ask the manager if he will install a removable partition, at least during night time, to insulate the cold rooms. Electronics shop. The lighting consists of background lights (tubes) and spot lights. We found that the spot lights account for 1/3 of the power consumption by turning them off for a test period of two hours. Furthermore, many TV sets were on, consuming around 100 W each according to their own energy labels. We will suggest to decrease the use of spot lights and to use a motion sensor to start the TV monitors when customers wish to watch them, only. Bank. The entrance room is one large office room. There is a large amount of background lights and some inefficient large round table lamps. We will measure the lux level at the workplaces and suggest savings of light. Even if we only find small savings, it may be implemented in all branches all over the country, and thus become significant by the volume. Night Hawks deliverable 2.2, 21 Sep 2013 11 Since all Samso consumers have smart-meters, we asked for access to the meter readings of the electronics shop. Figure 6 shows the effect of turning the spot lights off. The plot also revealed a periodic consumption during night time (for 1.5 hours after 22:00 hours). We discovered by means of a night walk that the outdoor parking lights and the shop signs were turned on automatically, and this may be unnecessary. The smart-meter readings cover a long period, and it may be possible to read the idle consumption after hours, the variation during the week, and the seasonal variation. Furthermore, it may be possible to subtract the summer consumption from the winter consumption in order discover the climate dependent component and the climate independent component. Figure 6. Smart-meter readings from the electronics shop (Expert). The graph spans one week, where the last day is the day of our visit. During our visit we asked to turn the spot lights off for two hours, and this is visible in the last day (arrow). It is clear that the shop is closed on Sundays. There is a minor load every day late in the evening for a short period (square). For some partners, including the Samso Energy Academy, it is only possible to apply current clamps on high voltage equipment if we engage an expensive electrician. In those cases it will be necessary to lower the level of ambition and find easier ways to make measurements. Table 3 shows a selection of tools available for the Samso Energy Academy. With an air flow meter (anemometer) we can measure the ventilation flow and compare it with recommendations (such as 'exchange all air in 2 hours'). The infrared thermometer measures room temperatures and temperatures inside coolers and freezers. It is then easy to estimate a relative saving factor using Equations (1) and (2). It is also easy to estimate a similar saving factor regarding lights using the lux meter. The last instrument in the table is a small data logger that measures temperature and humidity. It contains a battery and can be left in a strategic place for a day, a week, or a month. After the experiment, the measurement data can be downloaded to a computer. Table 3. Handheld instruments available to the Samso Energy Academy. They are relatively inexpensive (Conrad, http://www.conrad.de). Anemometer (Testo 405, € 133) Infrared thermometer (Testo 810, € 109) Lux meter (Testo 540, € 137) Temperature and humidity data logger (Lascar EL-USB-2, € 96) Regarding heating (and cooling) it is useful to construct the energy signature of the building (Energiforum, 2013b) (Lindholm and Jensen, 2008). It is a plot of the energy consumption relative to the outdoor Night Hawks deliverable 2.2, 21 Sep 2013 12 temperature in terms of heating (cooling) degree days. Figure 7 is an example from a household which shows an almost linear dependency. The intersection of the curve and the y-axis is the climate independent consumption, that is, the heating of hot water. The curve approximates the data points. If the current consumption is above the curve, the consumption is higher than usual, and the plot thus provides an incentive to save energy. The energy signature is a characteristic of the building and its state of insulation. The energy signature is very useful to have, but it requires many measurements; the example contains one measurement every week for several years. It is well suited for janitors who maintain the heating units of larger buildings. 700.0 600.0 kWh/wk 500.0 400.0 Weekly Last data 300.0 Poly. (Weekly) 200.0 y= 0.0005x2 + 2.542x + 40.989 R² = 0.8624 100.0 0.0 0 20 40 60 80 100 120 140 160 HDD/wk Figure 7. Energy signature of a household. Each square is a weekly measurement of energy (kWh) against heating degree days (HDD). The curve is characteristic for the house and the behaviour of the occupants. Summary and Recommendations Our target group spans a rather large spectrum of skills, and it is a challenge to settle on an appropriate level of difficulty — or ease — for the training material. The Night Hawks project consortium contains skilled energy experts capable of performing energy audits (SAENA, 2009). At the other end of the spectrum we have shop owners, with a minor knowledge of energy, that we wish to educate. Furthermore, an energy advisor should be able to perform an energy check in a swift manner. We therefore look for a suitable level of saving advices, which is between expert knowledge and folk wisdom. We can limit the scope in order to exclude some technical detail and some work. For Night Hawks, it is probably sufficient to focus on just four areas: heating, cooling, lights, and ventilation. An additional limitation is to focus primarily on behaviour related savings, that is, a reduction of end-use energy, rather than improving the efficiency of the equipment or switching to renewable energy. We can allow a few exceptions, however, regarding replacements. For example, replacing an old circulation pump by a new 'class A' pump is a rather inexpensive action, and the investment is paid back quickly. We thus arrive at five categories to focus on: 1. 2. 3. 4. Comfort heating and cooling Coolers and freezers Lights Ventilation Night Hawks deliverable 2.2, 21 Sep 2013 5. 13 Equipment replacements that are inexpensive The next task is then to devise saving advices within the five categories. These should be easy to check, but we also must give estimates on how much each advice saves, which is difficult. The saving factors can be either direct savings of kilowatt-hours or a percentage of the observed consumption. In the latter case, we have to measure or estimate the actual consumption. Finally, we must collect the prices of end-use energy (electricity, oil, district heating, gas) in each location. These prices should reflect the direct cost of the last energy unit spent, ideally, as this will be the first energy unit saved. We must therefore exclude subscription charges and other fixed or indirect costs; even tax (VAT), if the shop is able to recover it. Table 4 is a proposal for a preliminary list of advices that are fairly easy to check. The table also suggests how to calculate the savings. Saving factors, that are simple fractions of the observed consumption, look persuasively simple to apply, but it may be difficult to measure or estimate the 'observed consumption' in practice. This problem remains to be solved in detail. The Night Hawks partners are asked to scrutinize Table 4 and provide their comments, such that we can arrive at a practical solution, preferably in the form of a spreadsheet program. Table 5 is a list of advices that are easy to suggest, but difficult to quantify. They are qualitative advices that may be appropriate in a discussion with the owner. In comparison, Table 4 attempts to go one step further by quantifying the savings. Table 4. Sketch of a checklist for energy advisors. It has 22 advices. Category Comfort heating / cooling Advice Lower/raise the room temperature 1 degree Lower/raise the room temperature 1 degree every night Similarly for weekends and holidays Install thermostatic valves on radiators Use one litre less of hot water Seal air leaks Coolers, freezers, hot water tanks Insulate cool rooms from surrounding warm spaces Raise the temperature 1 degree (target -18 C in a freezer, and +5 C in a cooler) Switch off bottle coolers after hours (12 hours) Nightly setback (8 hours) of the room temperature by 1 degree Setback of the room temperature by 1 degree during d days of the year Lights Ventilation Lower the temperature of the hot water tank 1 degree (target is 55 deg C) Reduce the illuminance by 1 lux. Find target values in the European standard. Replace a T8 tube by a T5 tube Reduce the operating time by 1 hour per day Reduce the temperature of the injected air by 1 degree (target is 1 or 2 degrees below room temperature) Reduce the air flow to 1/n Saving 1/(Ti – To), where Ti is the indoor temperature and To the average outdoor temperature 8/24 of the previous advice d/365 times the initial advice, where d is the number of days in a year with a lower temperature 20% on each radiator 1/V where V is the volume of hot water spent per year. 1/(Ti – To), equivalent to lowering/raising the room temperature by 1 degree Equivalent to x times the advice to lower/raise the room temperature 1 degree 1/(Tc – Ti) where Tc is the cold temperature and Ti is the average indoor temperature (12/24) ×1/(Tc – Ti) (8/24)×1/(Tc – Ti) where Tc is the cold temperature and Ti is the current room temperature (d/365)×1/(Tc – Ti) where Tc is the cold temperature and Ti is the current room temperature 1/(Th – Ti) where Th is the hot water temperature and Ti is the indoor temperature. 1/L where L is the current illuminance in lux Up to 35 W per tube 1/H where H is the current number of operating hours 1/(Ta – To) where Ta is the current air temperature and the To is the average outdoor temperature 1 – (1/n)3 on electricity, 1 – 1/n on heating Night Hawks deliverable 2.2, 21 Sep 2013 Other Replace 1 halogen lamp (35 W) by an LED lamp (5.1-7 W) Replace a 3-speed circulation pump by a continuous class A pump Install a timer to switch off the circulation pump for hot water. Replace an old hot water tank (with jacket), size 100 litres, by a new standard tank Bi-annual service check of an oil boiler Bi-annual service check of district heating unit Install a standby switch on IT devices 14 the air 27 kWh, usage 1000 h / yr 280 kWh 58 kWh 1206 kWh (~ save 4 W/K) 935 kWh 815 kWh (small), 1358 kWh (large) 90 kWh Table 5. Additional checklist with qualitative advices. Category Comfort heating / cooling Coolers, freezers, hot water tanks Lights Ventilation Advice Set thermostatic valves in the same room at the same setting. Saving Replace broken valves. Introduce setback when the building is unoccupied, for example: Lower the feed temperature by 10 °C, or stop the circulator pump. Lower the morning temperature (20 °C in offices). Insulate pipes, valves and tanks. Install "night curtains" for the freezers and fridges. Defrost the freezers and fridges on regular basis. Set thermostatic valves correctly (food 5 °C, frost –18 °C). Introduce setback when the building is unoccupied, for example: Shut bottle coolers off. Lower the temperature of the hot water tank to 55 °C. Lower the humidity in rooms with display coolers and freezers. Reduce unnecessary lighting (overloaded spots etc). Ensure all outdoor lighting is lit only when needed (light and motion sensors). Install day light sensor indoors. Install motion sensors in corridors, changing rooms and toilets. Replacements. Replace incandescent lamps by class A lamps. Replace spotlights by LED lamps. Removals. Remove lamps, for instance incandescent lamps or old T8 tubes. Choose bright colours. Paint the room in bright colours next time. Use solar light. Install skylight windows and channels. Adjust the operation time according to 50 % occupancy. That is, start it when 50 % of the occupants have shown up in the morning, and shut it down after 50 % have left in the evening. Set the temperature of the injected air to 1 degree below the desired morning temperature. Lower the airflow, if possible; the fans may allow two speed settings. Use solar powered ventilation. Acknowledgement and Disclaimer This report is a deliverable of the Night Hawks project, which is co-funded by the Intelligent Energy Europe programme of the European Union (grant agreement IEE/12/671/SI2.644734). The sole responsibility for the content of this deliverable lies with the authors. It does not necessarily reflect the opinion of the European Union. Neither the EACI nor the European Commission are responsible for any use that may be made of the information contained therein. Night Hawks deliverable 2.2, 21 Sep 2013 Bibliography BELOK, 2011a. Energikrav för lokalbyggnader (Energy specifications for office buildings). Sweden: BELOK. EEF, 20xx. Spara energi i din butik (Save energy in your shop). Sweden: EEF. Energieagentur.NRW, 2013a. Energieeffizienz im Lebensmittel-Einzelhandel (Energy efficiency in food stores - retail). [Online] Available at: http://www.energieagentur.nrw.de/unternehmen/energieeffizienz-im-lebensmitteleinzelhandel-3743.asp [Accessed 21 Jun 2013]. Energieagentur.NRW, 2013b. Virtuelles Unternehmen (Virtual enterprise). [Online] Available at: http://www.energieagentur.nrw.de/unternehmen/themen/virtuelles-unternehmen-12423.asp [Accessed 21 Jun 2013]. Energiforum, 2013a. Nøgletal for bygninger (Key figures for buildings). [Online] Available at: http://energiwiki.dk/index.php/N%C3%B8gletal_for_bygninger_-_ELO_n%C3%B8gletal [Accessed 20 Jun 2013]. Energiforum, 2013b. Graddage, energisignatur (Degree days, energy signature). [Online] Available at: http://energiwiki.dk/index.php?title=Graddage,_energisignatur&redirect=no [Accessed 21 Jun 2013]. Energimyndigheten, 2010. Energikoll i små och medelstora företag (Energy checks in small and medium size enterprises). Eskilstuna, Sweden: Energimyndigheten. Energimyndigheten, 2011. Nattvandring (Night walk). [Online] Available at: http://energimyndigheten.se/sv/Foretag/Energieffektivisering-i-foretag/Kartlaggenergianvandningen/Nattvandring/ [Accessed 21 Jun 2013]. Energimyndigheten, 2012. Belysning (Lighting). [Online] Available at: http://www.energimyndigheten.se/sv/Foretag/Energieffektivisering-i-foretag/Belysning/ [Accessed 2013 Jun 2013]. Energimyndigheten, 2013. Checklista över energieffektiviseringsåtgärder inom handeln (Checklist for energy efficiency actions within commerce). [Online] Available at: http://www.energimyndigheten.se/sv/Foretag/Energieffektivisering-iforetag/Handel/Checklista-for-handeln/ [Accessed 20 Jun 2013]. Energimyndigheten, 20xxa. Vägledning för energieffektiv och god belysning (Guide to energy efficient and good lighting). Eskilstuna, Sweden: Energimyndigheten. Energimyndigheten, 20xxb. Minska företagets energianvändning (Reduce the energy consumption of the enterprise). Eskilstuna, Sweden: Energimyndigheten. Energimyndigheten, 20xxc. Minska företagets energikostnader nu! (Reduce the energy costs of the enterprise now!). Eskilstuna, Sweden: Energimyndigheten. Energimyndigheten, 20xxe. Checklista vid företagsbesök (Checklist for visits to enterprises). Eskilstuna, Sweden: Energimyndigheten. Energistyrelsen, 2012. Standardfaktorer for brændværdier og CO2-emissioner (Standard factors for heating values and CO2 emissions). Copenhagen: Klima- og Energiministeriet. Energitjenesten, 2010. Indsatskatalog til Grøn Butik (Action catalogue for Green Shop). Denmark: Energitjenesten. Energitjenesten, 2013. Grøn Butik (Green shop). [Online] Available at: http://www.energitjenesten.dk/gron-butik.html [Accessed 21 Jun 2013]. European Parliament, 2012. Directive 2012/27/EU on energy efficiency, OJ L 315. OJ, 25 Oct.p. 1–56. IEE, 2013. Guide for Proposers, WWW: Intelligent Energy Europe, [http://ec.europa.eu/energy/intelligent/index_en.htm]. 15 Night Hawks deliverable 2.2, 21 Sep 2013 IPCC, 2013. EFDB, Emission Factors Database. [Online] Available at: http://www.ipcc-nggip.iges.or.jp/EFDB/main.php [Senest hentet eller vist den 22 Jun 2013]. Klaesener, A. et al., 2013. Energy Efficiency in Households. Proc. 7th Int. Conf. on Energy Efficiency in Domestic Appliances and Lighting, Coimbra, Portugal, Sep 2013 (in print), Sep. Lindholm, D., Jensen, J. & (Eds), 2008. Den lille blå om varme (The Little Blue on Heating). 1st red. Denmark: Dansk Energi. Night Hawks, 2013. Grant Agreement: Annex I, Description of the Action, Sweden: Night Hawks. Odyssee, 2013. Energy Efficiency Indicators in Europe. [Online] Available at: http://www.odyssee-indicators.org/ [Accessed 21 Jun 2013]. PINE, 2012. User's Manual: Computer tool for the diagnosis, characterization and improvement of energy efficiency in industrial sectors. Scouting phase., WWW: Promoting Industrial Energy Efficiency, PINE, http://www.pineaudit.eu/eng/resources.aspx. PINE, 20xxa. D 2.5 - Benchmark Analysis Report on Best Performing Available Technologies, WWW: Promoting Industrial Energy Efficiency, PINE, http://www.pineaudit.eu/eng/resources.aspx. PINE, 20xxb. User Guide: Audit Tool, WWW: Promoting Industrial Energy Efficiency, PINE, http://www.pineaudit.eu/eng/resources.aspx. Poulsen, P., 20xx. Energirigtig Drift (Energy Conscious Operation). Copenhagen, Denmark: Copenhagen municipality. RETScreen International, 2005. Clean Energy Project Analysis (3rd ed. ), Ottawa: Natural Resources Canada [www.retscreen.net]. Rydqvist, M., 2010. Så spar du energi: Handelslokaler (This is how you save energy: commercial premises). Sweden: Energimyndigheten. SAENA, 2009. Der Sächsische Gewerbeenergiepass: für Industrie, Gewerbe und Handwerk (The Saxon energy certificate: for industry, commerce and crafts), Dresden: Sächsischer Energieagentur (SAENA). SAENA, 2011. Sächsischer Gewerbeenergiepass für Bäckereien (Saxon commercial energy certificate for bakeries). Dresden: Sächsische Energieagentur (SAENA). SAENA, 2013b. Vorlage_Antragsnummer_SN_Innenbeleuchtung_Antragssteller_2013-02-07 (Excel). Dresden: Sächsische Energieagentur (SAENA). SAENA, 2013. Energiekennzahlen für Betriebsvergleiche (Energy key figures for company comparisons). [Online] Available at: http://www.gewerbeenergiepass.de/SaeGEP/Energiekennzahlen2.html [Accessed 20 Jun 2013]. Svanen, 2010. Nordic Ecolabelling's Energy Tool. [Online] Available at: http://energytool.svanen.se/ [Accessed 20 Jun 2013]. Teknologisk Institut, 2013. Standardværdikatalog for energibesparelser (Catalogue of standard values for energy savings). [Online] Available at: 2013 [Accessed Jun 21 2013]. Zumtobel, 2011. The Lighting Handbook. 3rd ed. Dornbirn, Austria: Zumtobel Lighting GmbH. 16 Night Hawks deliverable 2.2, 21 Sep 2013 Appendix A. Field Report by Peter Karlsson, Linköping University, Visit to Samso 2-5 Jul 2013 Hello Jan and Michael! Thank you for the visit on Samsö it was very nice. We have tried to summarize what we found during the course of our work. I enclose a summary of energy use at the supermarket and a summary of the lighting on the Bank's entrée plan. (It was probably a misunderstanding I thought that we would only look at the lighting on entrée plan but if I understand correctly, we would have looked at all the lights). You can count the lights in the rest of the Bank and add it. Then, of course, also the energy saving will increase if they remove a light bulb in every armature. When it comes to Expert, there is something which is not matching with the measurement. Most likely there are additional supplies to the lighting that we did not found. So we count for manually. There were 52 halogenspotts on 35 W each. Installed effect : 52*1,2*35W=2184W Annual energy use: 2,184kW*2500h/år=5460kWh/år Om de investerar i LED Installed effect: 52*4W=208 W Annual energy use: 0,208kW*2500h/år=520kWh/år Reduced energy use: 5460kWh/år-520kWh/år=4940kWh/år Reduced cost: 4940kWh/år’2kr/kWh=9880kr/år Investment for LED: about 3500kr*52=182000kr Pay off 182000kr/9880kr/år=18 år It's a long payback period so maybe they'll see if they can reduce the number of ads instead. The second proposal to turn off the television set when it is not in the store, they should try to implement, for example, with presence sensors. I think we came to the conclusion that it would reduce costs by 4-5000 kr per year. If there is something you wonder or if we missed something so just give us a message. Have a nice summer Peter and Eva 17 Night Hawks deliverable 2.2, 21 Sep 2013 <The bank.pdf> <Supermarket.pdf> 18 The lighting in the Bank's ground floor consists of: 41 armatures 4W LED-spottar (effekten är antagen) 44 armatures med 2*18W low energy light bulbs in each armature (1,1*2*18W inclusive drivdon) 4 stycken halogenspotlights on either 35 W (1,2*35W inklusive drivdon) 32 armatures 18 W T5-lysrör (1,1*18W inclusive drivdon) above the ramp with LED-spottar. 6 armatures 36 W halogen- ceiling lights (1,2*36 W inclusive drivdon) above the tables with pamphlets. 3 round lights that contain 4 light source each. The effect could not be seen but is assumed to 18 W per light source. These lamps are not energy efficient. Light exchange was very bad. Total installed power on the ground floor is ca 3,4 kW (se ekv [1]) Annual energy use for entrance floor is about 9300 kWh/år provided that the operating time is the right. (se eqv [2]) (41*4W)+( 44*1,1*2*18W)+(4*1,2*35W)+(32*1,1*18W)+(6*1,2*36W)+(12*18W)=3347W [1] 0,16 kW*8760h/år+3,18 kW*2500h/år=1402kWh/år+7950kWh/år=9352kWh/år [2] Possible energy efficient operation: The light fittings on the roof contains 2st 18W lights. One suggestion is to delete one of each. The operation reduces energy usage by 2178 kWh/år if the operating time is 2500h/year. 1,1*44*18W*2500h/år=2178kWh/år A very cursory analysis of energy use in Samsö supermarket Here is the result of our work. I made a balance during 24 h as we agreed. The total energy use during 24 h the 4/7 2013 was 1453 kWh. (Normally we measured over a longer period of time, often a week). Under “not defind energy” there are all plug in coolers, probably more ventilation, m.m. To get a complete energybalans a more detailed analysis is needed. After this part of the work we try to find energy efficient measures. What we saw here was that they can streamline the cold by changing temperatures and cover the coolers and refrigerated in a better way. Hard to figure out how much energy use reduces. It could be interesting to see the amount of district heating because if they cover the coolers and refrigerated area in a better way they probably save even district heating. If there is possible to change the lighting in the old part so the installed power per square meter will be the same as in the new part they reduce the energy consumption for lighting with 119 kWh per 24 hours. (18,5kWh-10kWh)*14h/d=119 kWh/d This requires further investigation when they have problems with color rendering in the meat. Energy consumption during the night Average power draw during the night is 37 kW Based on measurements, inventory of lighting and some assumptions the distribution is: Central cooling 25 kW, plug in coolers 3kW, circulation pumps 2kW, night lighting 2 kW and other non defined processes 7 kW. To get a more accurate distribution, one can visit the store when it is closed, then you see even if there is something that does not need to be on. Attachments Inventory of lighting in the Supermarket Storage Area: (13m*15 m)+(15m*5m)= 270 m2 The lighting in the inventory consists of: 13 armatures with 2*58W T8 fluorescent in each armatures (1,2*13*2*58W including drivdon) 7 stycken armaturer med 1*36W T8 fluorescent i varje armatur (1,2*7*36W including drivdon) Total installed power in the layer is ca 2,1 kW (se bilaga ekv [1]) Energy use during a weekday is ca 29,4 kWh If the operating time is 14h se ekv [2] ( 13*1,2*2*58W)+(7*1,2*36W)=2112W [1] 2,1 kW*14h/d=29,4 kWh/d [2] Power/m2=2112W/270m2=7,8W/m2 Butchery section Area: 50 m2 The lighting in the butchery section consists of: 14 armatures with 4*14W T5 fluorescent in each armature (14*1,1*4*14W including drivdon) Total installed power in the butchery section is ca 0,8 kW (se bilaga ekv [1]) Energy use during a weekday is about 12 kWh If the operating time is 14h se ekv [2] (14*1,1*4*14W)=862,4W [1] 0,86kW*14h/d=12kWh/d [2] Power/m2=862,4W/50=17W/m2 Butik Old part Area: 783 m2 The lighting in the old part of the store consists of: 90 armatures with 2*58W T8 fluorescent in each armature (1,2*90*2*58W including drivdon) 47 stycken halogenspotlights on either 35 W (1,2*47*35W including drivdon) Total installed power in the butchery section is ca 14,5kW (se bilaga ekv [1]) Energy use during a weekday is about 203 kWh if the operating time is 14h se ekv [2] ((1,2*90*2*58W)+( 1,2*47*35W ))=14502W [1] 14,5 kW*14h/d=203 kWh/d [2] Power/m2=14502W/783m2=18,5W/m2 Butik New part Area: 330 m2 The lighting in the butik new part consists of: 31 armatures with 2*49W T5 fluorescent in each armature (1,1*31*2*49W including drivdon) Total installed power in the new part is ca 3,3 kW (se bilaga ekv [1]) Energy use during a weekday is about 46 kWh if the operating time is 14h se ekv [2] 1,1*31*2*49W =3342W [1] 3,3kW*14h/d=46 kWh/d [2] Power/m2=3342W/330m2=10W/m2 Total energy use during a weekday for the lighting is 290 kWh Measurement Supermarket Total Enhet kW Benämning Effekt Med 70,66 Min 25,87 Total energy use during 24 hours 70,66kW*24h=1695 kWh I add 3 hours because the measurement was only 21 hours. Max 143,75 'Energi kWh' 1 452,52 Coolingcentral Enhet kW Benämning Effekt Med 31,52 Energy use during 24 hours 745 kWh Min 11,82 Max 50,98 'Energy kWh' 743,84 New cooling (Probably the heating pump) Enhet kW Benämning Effekt Med 1,12 Energy use during 24 hours: 27kWh Min 0,00 Max 3,74 'Energi kWh' 26,79 Ventilation store Enhet kW Benämning Effekt Med 1,93 Energy use during 24 hours: 46 kWh Min 0,00 Max 2,84 'Energi kWh' 45,56 Ventilation Slauter Enhet kW Benämning Effekt Med 1,80 Energy use during 24 hours: 43 kWh Min 0,00 Max 8,52 'Energi kWh' 42,60 Pictures