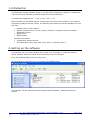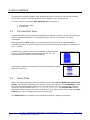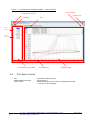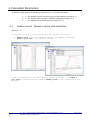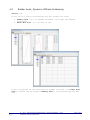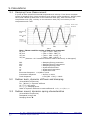
1
Elastomer Analysis Module
Version 2.00
User Manual
DRAFT COPY
Index
1.
INTRODUCTION ................................................................................................. 2
2.
SETTING UP THE SOFTWARE .............................................................................. 2
3.
USER INTERFACE ............................................................................................... 3
3.1
3.2
3.3
4.
4.1
4.2
4.3
5.
5.1
5.2
5.3
FILE SELECTION PANE ............................................................................................3
FORMS PANE .......................................................................................................3
PULL-DOWN MENUS ...............................................................................................4
CALCULATED PARAMETERS ................................................................................ 5
RUBBER MOUNT, DYNAMIC SPRING CHARACTERISTICS ........................................................5
RUBBER BUSH, DYNAMIC STIFFNESS & DAMPING .............................................................6
DAMPER FORCE MEASUREMENTS .................................................................................7
CALCULATIONS .................................................................................................. 8
DAMPING FORCE MEASUREMENT ................................................................................8
RUBBER BUSH, DYNAMIC STIFFNESS AND DAMPING ...........................................................8
RUBBER MOUNT, DYNAMIC SPRING CHARACTERISTICS ........................................................8
1. Introduction
The Elastomer Analysis Module (EAM) is a stand-alone programme capable of reading test
runs from file and calculating material properties and test statistics.
The data files supported are: *.cvp; *.pvp; *.mcr; *.ctr
Other formats can be added without changing the structure of the software. To be able to
successfully analyse the test results, the following information should be available from the
test files:
•
•
•
•
Sample rate for each channel
Signals (Displacement, Force & velocity) at least 3 complete cycles at constant
amplitude/velocity.
Signal units
Signal names
Optional information:
• Temperature measurements
• Test descriptors (Rig, date, part name, part no, operator name…)
2. Setting up the software
The software can run under Window XP or Vista. It is necessary to install the Roehrig
Shock software which will install all the necessary DLL’s and dongles.
From the supplied EAM zip file run setup.exe.
The programme is stored in the C:\Program Files\EAM directory.
The software can be started from the Windows Start Programs : Elastomer Analysis
Module
B:\_CP3 - Software\Design\Modules\M23 - Elastomer\MANUAL - M23 Elastomer Analysis Module.doc
Page 2 of 8
3. User interface
The Elastomer Analysis Module uses standard Windows drop-down menus and toolbars.
The window can be stretched to best fit the available screen viewing area.
The user interface comprises two main panes (See Figure 1).
1. File Selection pane
2. Forms pane
3.1
File Selection Pane
Suitable data files can be drag and dropped from Windows Explorer into the File Selection
pane or loaded individually or in groups from the tool bar or pull-down File Open
commands.
When opened the files appear in the File Selection pane and each individual run is
automatically listed. This tree structure can be contracted and expanded by clicking the +
and – controls.
A consecutive group of runs can be selected by selecting the
first run, hold down SHIFT and selecting the last run. All
selected tabs will have a blue back backing.
Alternatively separate individual files can be selected by holding
down the CTRL key.
3.2
Forms Pane
When the required analysis option is selected (see Section Error! Reference source not
found.: Calculated Parameters) the analysis results will appear in the Forms Pane. Each
form has a standard Window tab at the top that allows them to be individually selected.
The forms can be scrolled with CTRL-Tab or CRTL-SHIT-Tab. The Scroll forms arrows
allow tabs off the current view to be scrolled into view. Tabs can be closed with the Close
form button. Up to 28 Tabs can be open at one time.
The Status bar at the bottom of the Window records file specific information.
B:\_CP3 - Software\Design\Modules\M23 - Elastomer\MANUAL - M23 Elastomer Analysis Module.doc
Page 3 of 8
Figure 1 : The Elastomer Analysis Module – User Interface
Scroll forms
Drop-down menus
Toolbar
Close form
Tab
File 1
..Run(s)
File 2
..Run(s)
FILE SELECTION PANE
3.3
STATUS BAR
FORMS PANE
Pull-down menus
File
Calculated parameters
Tools>Units
– standard window options
– see Section 4
- Allows displayed units of Force, Displacement and
Velocity to be changed.
B:\_CP3 - Software\Design\Modules\M23 - Elastomer\MANUAL - M23 Elastomer Analysis Module.doc
Page 4 of 8
4. Calculated Parameters
To perform data analysis selected the required run or runs and then press:
1. F10 for Rubber mount, Dynamic spring characteristics (Section 4.1)
2. F11 for Rubber bush, Dynamic stiffness & damping (Section 4.2)
3. F12 for Damper force measurements (Section 4.3)
4.1
Rubber mount, Dynamic spring characteristics
Shortcut - F10
If any run in a file is selected the F10 will produce two forms.
1. Summary form – plot of dissipated energy and damping coefficient
2. Table & plot form – for all data in file
If F10 is selected for any other runs in another file then a new Table &
plot form is created and the original Summary form is over plotted with the
new data.
B:\_CP3 - Software\Design\Modules\M23 - Elastomer\MANUAL - M23 Elastomer Analysis Module.doc
Page 5 of 8
4.2
Rubber bush, Dynamic stiffness & damping
Shortcut - F11
If any run in a file is selected the F11 will produce two forms.
1. Summary form – plot of dynamib stiffness, loss angle and damping
coefficient
2. Table data form – for all data in file
If F11 is selected for any other runs in another file then a new Table data
form is created and the original Summary form is over plotted with the new
data.
B:\_CP3 - Software\Design\Modules\M23 - Elastomer\MANUAL - M23 Elastomer Analysis Module.doc
Page 6 of 8
4.3
Damper force measurements
Shortcut - F12
For whatever runs are selected in a file the table data is populated and plot shown in the
Damper force form.
A group of all runs can be selected then F12, or each run individually and F12.
Data is always sorted in increasing velocity.
If a run or runs in a separate file are selected then a new Damper force form is created.
B:\_CP3 - Software\Design\Modules\M23 - Elastomer\MANUAL - M23 Elastomer Analysis Module.doc
Page 7 of 8
5. Calculations
5.1
Damping Force Measurement
5 cycles at each specified sinusoidal amplitude and velocity. From three complete
waves of damping force (time waveform) and velocity (time waveform), identify each
three peak values of axial force on the extension side (FR), axial forces on the
compression side (FB), velocity on the extension side (VR) and velocity on the
compression side (VB).
Note : These need five cycles of data to be computed.
FR_ave
= (FR1 + FR2 + FR3) / 3
FB_ave
= (FB1 + FB2 + FB3) / 3
VR_ave
= (VR1 + VR2 + VR3) / 3
VB_ave
= (VB1 + VB2 + VB3) / 3
(assume 1.4.2 intended velocities CAN be achieved, so disregard)
DEt
= Damping Energy extension
DEc
= Damping Energy contraction
Det
= Damping Energy Total
Ht
= Hysteresis Extension
Hc
= Hysteresis Contraction
Ht
= Hysteresis Total
Extension Response = Ht/DEt x 100%
Contraction Response
= Hc/Dec x 100%
Total Response
= Htc/(DEt + Dec) x 100%
5.2
Rubber bush, dynamic stiffness and damping
(at available frequencies)
Kdyn [N/mm] = dynamic stiffness
LA [°] = Loss angle
Cdyn [-] = damping factor
Ratio of dynamic stiffness to static stiffness R = Cdyn, 100 hz/Cdyn, 1Hz
5.3
Rubber mount, dynamic spring characteristics
(at available frequencies)
Dissipated energy Wd
Damping factor Ψ
B:\_CP3 - Software\Design\Modules\M23 - Elastomer\MANUAL - M23 Elastomer Analysis Module.doc
Page 8 of 8