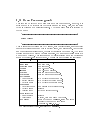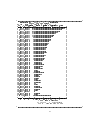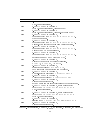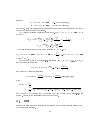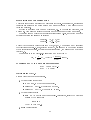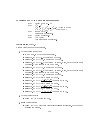
1
GRACE User's manual
version 2.0
MINAMI-TATEYA collaboration
T.Ishikawa, S.Kawabata, Y.Kurihara, Y.Shimizu
National Laboratory for High Energy Physics(KEK),
Tsukuba, Ibaraki 305, Japan
T.Kaneko
Faculty of general education, Meiji-gakuin University,
Totsuka, Yokohama 244, Japan
K.Kato
Department of physics, Kogakuin University,
Tokyo 160, Japan
H.Tanaka
Faculty of general education, Rikkyo University,
Tokyo 171, Japan
August 1, 1994
Acknowledgements
On the way to develop the program system GRACE we have received much encouragement and support from many people. We would like to thank our colleagues in
TRISTAN theory group, particularly T. Munehisa, N. Nakazawa and J. Fujimoto for
discussions which were helpful for getting the system better. We are also grateful to
express our sincere gratitude to Professors H. Sugawara, S. Iwata and J. Arafune for
the encouragement. Discussions with colleagues in Nuclear Physics Institute of Moscow
State University and LAPP, Laboratoire d'Annecy-le-Vieux de Physiques des Particules, with whom we have been collaborating on the automatic calculation of Feynman
amplitudes during these years, were very fruitful and useful for this work.
We are indebted to companies Fujitsu limited, Intel Japan K.K., KASUMI Co. Ltd
and SECOM Co. Ltd. for their kind supports and understanding our work. A part
of the calculations was performed on FACOM M1800, AP1000, VP series, S series,
HITAC S820, M880, 3050, HP 9000 and Intel iPSC/860.
This work was supported in part by Ministry of Education, Science and Culture,
Japan under Grant-in-Aid for International Scientic Research Program No.03041087
and No.04044158.
Notice
This document is the revision of the Ref.[8] which also includes the theoretical
background of GRACE system. For the method to calculate the cross section, there
is no dierence between this version and the version 1.0 in Ref.[8]. However, the
user interface is much upgraded here, so that the generation of code for kinematics is
possible.
We expect the user who will make publication by use of the system refers to the
GRACE system.
E-mail address : [email protected]
ftp location : /kek/minami/grace at ftp.kek.jp
i
Contents
1 Introduction
1.1 What is the problem ?
1.2 What we can do with GRACE ?
1.2.1 What GRACE provides us?
1.2.2 What structure GRACE has ?
1.2.3 How to do with kinematics ?
1
: : : : : : : : : : : : : : : : : : : : : : : : : : :
: : : : : : : : : : : : : : : : : : : : : : :
: : : : : : : : : : : : : : : : : : : : :
: : : : : : : : : : : : : : : : : : : :
: : : : : : : : : : : : : : : : : : : :
2 How to use GRACE system
2.1 Environment
2.2 Generate Feynman graph
2.2.1 Denition of physical process
2.2.2 Execute graph generation
2.3 Draw Feynman graph
2.4 Generate source code
2.5 Editing FORTRAN source codes
2.6 Makele
2.7 Test of the gauge invariance
2.8 Integration
2.9 Event generation
9
: : : : : : : : : : : : : : : : : : : : : : : : : : : : : : : : :
: : : : : : : : : : : : : : : : : : : : : : : : : :
: : : : : : : : : : : : : : : : : : :
: : : : : : : : : : : : : : : : : : : : :
: : : : : : : : : : : : : : : : : : : : : : : : : : : :
: : : : : : : : : : : : : : : : : : : : : : : : : : : :
: : : : : : : : : : : : : : : : : : : : :
: : : : : : : : : : : : : : : : : : : : : : : : : : : : : : : : : : :
: : : : : : : : : : : : : : : : : : : : : : : :
: : : : : : : : : : : : : : : : : : : : : : : : : : : : : : : : : :
: : : : : : : : : : : : : : : : : : : : : : : : : : : : : :
3 Details of GRACE system
3.1 Graph generation
3.1.1 Denition of the physical process
3.1.2 Drawn Feynman graph
3.2 Generated source code
3.2.1 Initialization of amplitude calculation
3.2.2 Amplitude calculation
3.3 Specication of the kinematics routines
3.3.1 Subroutine USERIN
3.3.2 Subroutine KINIT
3.3.3 Subroutine KINEM
3.4 Test of generated source code
3.5 Numerical integration
9
10
10
11
12
13
13
15
17
18
19
20
: : : : : : : : : : : : : : : : : : : : : : : : : : : : : :
: : : : : : : : : : : : : : : : :
: : : : : : : : : : : : : : : : : : : : : : :
: : : : : : : : : : : : : : : : : : : : : : : : : : :
: : : : : : : : : : : : : : :
: : : : : : : : : : : : : : : : : : : : : : :
: : : : : : : : : : : : : : : : : :
: : : : : : : : : : : : : : : : : : : : : : : : :
: : : : : : : : : : : : : : : : : : : : : : : : : :
: : : : : : : : : : : : : : : : : : : : : : : : : :
: : : : : : : : : : : : : : : : : : : : : : :
: : : : : : : : : : : : : : : : : : : : : : : : : : : :
ii
1
2
3
4
6
24
24
26
28
30
41
46
46
46
52
60
62
3.5.1 Program structure of BASES
3.5.2 Initialization subprogram KINIT
3.5.3 Function program of the integrand
3.5.4 Histogram package
3.5.5 Output from BASES
3.6 Event generation
3.6.1 Input for SPRING
3.6.2 Program structure of SPRING
3.6.3 Subprograms to be prepared
3.6.4 Output from SPRING
: : : : : : : : : : : : : : : : : : : :
: : : : : : : : : : : : : : : : : :
: : : : : : : : : : : : : : : :
: : : : : : : : : : : : : : : : : : : : : : : : :
: : : : : : : : : : : : : : : : : : : : : : : : :
: : : : : : : : : : : : : : : : : : : : : : : : : : : : : :
: : : : : : : : : : : : : : : : : : : : : : : : : :
: : : : : : : : : : : : : : : : : : : :
: : : : : : : : : : : : : : : : : : : :
: : : : : : : : : : : : : : : : : : : : : : : :
A Kinematics
A.1 2001
A.2 2002
A.3 2003
A.4 3001
A.5 3002
A.6 3003
A.7 3004
A.8 3005
A.9 3006
A.10 3007
A.11 3008
A.12 3009
A.13 4001
A.14 4002
A.15 4003
62
64
66
71
72
80
80
81
82
84
88
: : : : : : : : : : : : : : : : : : : : : : : : : : : : : : : : : : : : :
: : : : : : : : : : : : : : : : : : : : : : : : : : : : : : : : : : : : :
: : : : : : : : : : : : : : : : : : : : : : : : : : : : : : : : : : : : :
: : : : : : : : : : : : : : : : : : : : : : : : : : : : : : : : : : : : :
: : : : : : : : : : : : : : : : : : : : : : : : : : : : : : : : : : : : :
: : : : : : : : : : : : : : : : : : : : : : : : : : : : : : : : : : : : :
: : : : : : : : : : : : : : : : : : : : : : : : : : : : : : : : : : : : :
: : : : : : : : : : : : : : : : : : : : : : : : : : : : : : : : : : : : :
: : : : : : : : : : : : : : : : : : : : : : : : : : : : : : : : : : : : :
: : : : : : : : : : : : : : : : : : : : : : : : : : : : : : : : : : : : :
: : : : : : : : : : : : : : : : : : : : : : : : : : : : : : : : : : : : :
: : : : : : : : : : : : : : : : : : : : : : : : : : : : : : : : : : : : :
: : : : : : : : : : : : : : : : : : : : : : : : : : : : : : : : : : : : :
: : : : : : : : : : : : : : : : : : : : : : : : : : : : : : : : : : : : :
: : : : : : : : : : : : : : : : : : : : : : : : : : : : : : : : : : : : :
References
90
92
93
93
96
97
98
99
101
105
105
105
107
110
111
115
iii
Chapter 1
Introduction
1.1 What is the problem ?
During the last two decades, it has been established that the gauge principle governs the interactions between elementary particles. In electroweak theory, leptons and
quarks are interacting through exchange of three kinds of gauge bosons, photon, 0
and 6. The assumed gauge group is (2)L 2 (1) and the original gauge symmetry is broken by the non-zero vacuum expectation value of Higgs eld.[1] On the other
hand strong interaction between quarks is described by color (3) gauge group. [2]
All the experimental facts seem to support these theories at present. Though it is still
an open question how these dierent kinds of forces are unied into more fundamental
theory, it is now of no doubt that these theories contain some truths and will remain
as eectively correct ones.
This success of gauge theories or standard models of elementary particles, implies
that we have denite Lagrangians and thus we can, in principle, predict any process
based on these Lagrangians in perturbation theory. When one wants to perform calculation in this way, however, one meets a technical diculty due to the complexity
of the interaction Lagrangian. This is particular to non-abelian gauge theory in which
we have three- and four-point self-couplings of gauge bosons as well as interactions of
unphysical particles such as Goldstone bosons or ghost particles in general covariant
gauge xing. Hence even in the lowest order of perturbation, that is, in tree level,
one nds a number of diagrams for a given process when the number of nal particles
increases. For example, we have only 3 diagrams for + 0 ! + 0 , but when one
photon is added, + 0 ! + 0 , then 18 diagrams appear even after omitting the
tiny interaction between 6 and scalar bosons( Higgs and Goldstone bosons ). Addition of one another photon, + 0 ! + 0 , yields 138 diagrams. Further if one
wants to make more realistic calculation around the threshold of 6 pair production,
taking into account the decay of 6 , say, 0 ! 0 e and + ! , then one has
to consider 24 diagrams for + 0 ! 0 e and 202 for + 0 ! 0 e . In unitary
gauge, as only physical particles appear in the Lagrangian, the numbers of diagrams
are less than those mentioned above.
Z
W
SU
U
SU
e
e
e
W
W
e
W
W
e
e
e
W
W
W
W
e
e
W
e
ud
1
e
W
e
e
ud
e
ud
One may think that it is enough to select several diagrams which dominate the cross
section. Even if one can nd such dominant diagrams, one has to respect the gauge
invariance among this subset of diagrams. Usually number of diagrams in the gauge
invariant subset is not so small. For example, for the process + 0 ! e e + 0,
we have 60 diagrams in all. Among them 30 diagrams form one gauge invariant set
and the rest does another one. Hence still we meet the same diculty to handle with
many diagrams. In addition, there remains a possibility that the experimental cuts
imposed on the nal particles renders the dominant diagrams to be less prominent and
all diagrams give somehow the same order of magnitude to the cross section. If this is
the case, one has to keep whole the diagrams in the calculation after all.
Through the numerous experiments done at + 0 colliders, we have learned that
higher order corrections should be included when we want to compare theories with
experimental data in detail. This implies that we have to calculate at least one-loop
corrections to a given process. As an example, consider the process + 0 ! + 0 .
To regularize the infrared divergence due to soft photon emission, we have to include
loop diagrams for + 0 ! + 0 beyond the tree level, which contain virtual photon exchange and remove the divergence when combined with real photon emission
process. The requirement of gauge invariance among one-loop diagrams demands, in
turn, inclusion of other one-loop diagrams with exchanges of 0 , 6 or other possible particles. Then it is clear that the total number of diagrams becomes very huge
and it is almost impossible even to enumerate all diagrams. In many cases it seems
out of ability of mankind. For simple -pair production, in general covariant gauge,
the number is around 200 diagrams in the same approximation stated above, but for
0 e it amounts more than 3,700.
Facing to the diculty described above, we cannot help to nd some ways to get rid
of. As a solution we can choose the following one: As diagrams are constructed based
on a set of denite rules, Feynman rules, it is natural to develop a computer code which
can generate all the diagrams to any process, once initial and nal particles are given.
It should be able not only to enumerate diagrams but also generate automatically
relevant amplitudes to be evaluated on computers, in other words, create a FORTRAN
source code ready for amplitude calculation. GRACE (Ref.[3]) is such a system that
realizes this idea and help us to reduce the most tedious part of works.
e
e
e
e
W
W
e
e
e
W
e
W
W
W
Z
W
W
e
ud
1.2 What we can do with GRACE ?
Before introducing what GRACE system can provide, let us remind the standard way
to calculate cross sections at the tree level. Usually it consists of the following several
dierent steps:
1) Specify the process.
2) Choose appropriate models.
3) Fix the order of perturbation( at the tree level, this is unique ).
2
4)
5)
6)
7)
Enumerate all possible diagrams.
Write down amplitudes.
Prepare the kinematics for nal particles.
Integrate the amplitude squared in the phase space of nal particles, including
experimental cuts, if necessary.
8) Generate events so that the simulation of the process in a detector is available.
9) Check the results.
Among these steps the rst three, 1), 2) and 3), are trivial matter. For the step 7)
one can rely on well established programs which are designed to make integration of
multi-dimensional variables. This is of no problem, except for CPU-time, once the
kinematics, step 6), is written so that the estimate of the integral is reliable within
required accuracy. The step 8) is related with the preceding step. The last step 9)
could be done to compare the results with other calculations or with approximated one.
Hence the most tedious steps are 4) and 5). GRACE is a system of program packages for
this purpose, namely, it carries out these most tedious steps on computers to save our
elaboration.
1.2.1
What GRACE provides us?
The present version of GRACE generates:
All the tree diagrams for a given process when the order of perturbation is xed.
Diagrams on X-window and its print-out.
FORTRAN source code which contains helicity amplitude of the process.
Default values of all physical constants, except for the strong coupling constant.
Interface routines to the program package CHANEL (Ref.[4],[5]), which contains
subroutines designed to evaluate the amplitude.
Default code for kinematics.
Interface routines to the multi-dimensional integration package BASES (Ref.[6]).
Interface routines to the event generation package SPRING (Ref.[6]).
Test program for gauge invariance check of the generated amplitude.
Any diagram and its amplitude can be omitted in the calculation by setting the
appropriate ags o. In the integration step the unitary gauge is the default( see
section 3.2.1 ).
3
What the user should do rst is to tell GRACE a set of parameters which species
the process considered. It should include
1) names of initial particles,
2) names of nal particles,
3) order of perturbation in QED, electroweak and/or QCD.
4) code number of kinematics.
in the given format explained later. For 4), the list of available built-in kinematics is
provided with the system.
When GARCE is initiated with the data le containing these inputs, it constructs
all possible diagrams and creates an output le to draw all Feynman diagrams for the
convenience of the user to look them by eyes. At the same time a set of FORTRAN
subprograms is generated. These include those which are needed to calculate the
amplitude with the help of CHANEL, to integrate over phase space by BASES and to
generate events by SPRING.
After all the programs are successfully generated, the remaining tasks for user are
1) to examine the kinematics,
2) to check and to edit some parameters in a few subroutines,
3) to check the gauge invariance of the amplitude,
4) to supply the value of strong coupling constant.
For the item 1) and 2), the system generates default code. However, it may not give
the best solution. If the convergence of integral is not good, the user must switch to the
other kinematics sample, or the user must write it by oneself. Also, some important
parameters, e.g., the center-of-mass energy, are written in the generated source code,
so that the user would change them by editor. The variety and the location of these
parameters are given in the document in the Appendix. The item 3) can be done by a
sequence of command as will be described later. If colored quanta exists in the process,
one must edit the source to add an multiplicative factor since s = 1 in the generated
code (item 4) ) while the color factors are properly included in the code.
g
1.2.2
What structure GRACE has ?
In this subsection we show how the whole system of GRACE is constructed and how each
step proceeds. The system consists of the following four subsystems, whose interrelation
is depicted in Fig.1.1.
4
(1)
(2)
(3)
(4)
Graph generation subsystem
When initial and nal states of the elementary process are given as the input as
well as the orders of couplings, a complete set of Feynman graphs is generated
according to the theoretical model dened in a model denition le. ([1],[2],[7])
For the time being QED, Electroweak and QCD models in the tree level are
supported. The information of generated graphs is stored in a le as an output.
Reading the graph information from the le, the graph drawer displays the Feynman graphs on the screen under the X-Window system or prints them on a paper.
Source generation subsystem
From the graph information produced by the rst subsystem, a FORTRAN source
code is generated in a form of program components suited for the numerical
integration package BASES and the event generation package SPRING.
The source code is constructed based on our helicity amplitude formalism, which
consists of many calling sequences of subprograms given in CHANEL and its interface routines.
In addition to these program components, the subsystem generates a main program, by which the gauge invariance of the generated amplitudes can be tested.
Numerical integration subsystem
Combining the generated source code together with the kinematics routines and
the GRACE library, the numerical integration is performed by BASES to obtain the
total cross section. For this, however, in general, one may have to prepare the
kinematics routines when the default one is not appropriate. As the output of
integration, the numerical value of total cross section, the convergency behavior
of integration, one and two dimensional distributions of the cross section are given
besides the probability information in a le, which is used in the event generation.
Looking the convergency behavior carefully one can judge if the resultant value
is reliable or not.
Event generation subsystem
Using almost all the same subprograms in the integration, events with weight one
are generated by the event generation program SPRING. To achieve a high generation eciency, it uses the probability information produced by BASES. Conceptually, SPRING samples a point in the integration volume according to the
probability. If the probability information is a complete one, the sampled point
is exactly corresponding to a generating event. Since, however, it is impossible to
get a complete information numerically, the sampled point is tested whether it is
accepted or not. The user can record and analyze the generated events according
to the information in the following chapters.
5
1.2.3
How to do with kinematics ?
In order to get the numerical value of cross section, we integrate the dierential cross
section over the phase space of nal particles. As the integral is multi-dimensional, 4
for 3-body, 7 for 4-body and 10 for 5-body process( if the cylindrical symmetry is assumed around the initial beam axis ), we usually use adaptive Monte Carlo integration
packages. ( In our system BASES is assumed. ) We have to express all momenta ( or
equivalently invariants composed of them ) of nal particles by independent integration
variables. Generally speaking, the integration routine feeds a set of random numbers
in the space of given dimension. Let us denote these random numbers as
X(I) I = 1 1 1 1 NDIM
and assume their values are normalized in, say, [0 1]. ( In BASES, the upper and
lower bounds for X(I) can be arbitrary numbers. ) Then we have to translate these
variables into four-momentum of nal particle, say J-th particle, P(1,J), P(2,J),
P(3,J), P(4,J) of total N particles ( in GRACE, P(4,J) is the energy ),
X(I) =) P(K J) K = 1 1 1 1 4 J = 1 1 1 1 N
This is known as kinematics for the given process. This mapping is not always unique
and in some cases a single value of X(I) may correspond to multi-value of particle
momenta.
GRACE, unfortunately, only can give a candidate of the kinematics. The reason
is that the present popular integration packages, such as BASES or VEGAS, utilize a
special algorithm to search for the singularities of the integrand. The matrix element
squared, the integrand, becomes singular when the denominators of propagators of
internal particles become very small compared with the typical energy of the process
considered. This happens when a mass of an internal line is very small. As is well
known, if a singularity is running along the diagonal in a plane of two integration
variables, these programs cannot give reliable estimate of the integral, because they
fail to catch the singularity at all. In order to get good convergence of the integration
over many iterations, all the singularities must be parallel to the integration axes. This
means that these peaks located in the space of kinematical variables, are mapped onto
the line of constant value of some X(I). In order to do this, we have to choose very
carefully the transformation between random numbers and kinematical variables. The
typical kinds of singularities we meet in real calculation are as follows;
;
;
;
;
;
;
:
;
;
;
mass singularity
infrared singularity
-channel photon exchange
resonance formation( decay of heavy particles )
t
6
;
;
(Precise description of how to deal with these singularities will be found in section 2.6
in Ref.[8]).
In some processes the number of independent variables is greater than that of
singularities, and one can easily nd a kinematics which is suitable to make them
smooth. If this is not the case, however, one may not be able to nd such good
kinematics to avoid diagonal singularity even after much eorts. Hence it is quite
dicult to give the general kinematics which is capable of dealing with all kinds of
singularities at once, or a single set of transformations.
Considering the situation described above, GRACE only provides some sample of
kinematics to users. So the following points are left for the users:
Select the ordering of particles to use kinematics.
Select the kinematics among the candidates.
Set physical parameters, e.g., p .
Change the parameters for the integration, e.g., the number of iteration, number
of required accuracy and so on.
Revise or write the source code by the user when all candidates provided by the
system are no good.
As was stressed before, the nature of singularity is related to the physical problem at
hand, so that the user knows best about the tuning of kinematics.
s
7
User input
Theory(Lagrangian)
Process(particle, order)
?
?
Particles and interactions
?
Diagram generator
?
-
Diagram description
?
Drawer
?
Feynman diagrams
Kinematics database
?
Matrix element generator
? Function for matrix element
?
kinematics
code
convergence information
Cross section
Distributions
Distribution
Parameters
generated
code
(FORTRAN)
CHANEL
library
?
BASES(Monte-Carlo integral)
?
?
?
SPRING(event generator)
-
?
Specied number of
generated events
Figure 1.1: GRACE system ow
8
Chapter 2
How to use GRACE system
The GRACE system was developed on a main frame computer FACOM, but now it is
available on UNIX system. The usage of GRACE on FACOM is basically to use JCL in the
Batch Job environment. Although an interactive mode is available on an UNIX system,
the interpreter of GRACE on UNIX system is still very primitive. It will be improved in
near future. We suppose the X-Window system is available on UNIX system, which is
used for drawing Feynman graphs on the screen. The UNIX systems, where we have
installed and tested GRACE, are SUN SPARC and HP9000/750. Here we only describe
the usage on UNIX machine. The description for FACOM and that to run on a parallel
processor is given in Ref.[8].
2.1 Environment
At rst user should add the following statement in the le \.cshrc". 1
set path = ($path /usr/local/grace )
setenv GRACEDIR
/usr/local/grace
setenv GRACETABLE /usr/local/grace/data/particle.table
Here /usr/local/grace is the directory where GRACE system is installed. It depends
on the way how the system is installed. The directory is connected the the name
GRACEDIR.
Also, the name GRACETABLE is dened and it species the physical model. Two
model denition les, \particle.table" and \particle.table0", are prepared in
GRACE system as the standard. Both les represent the standard model, i.e., electroweak
theory and the QCD. In \particle.table0", the couplings between Higgs and light
fermions are suppressed in order to reduce the number of unimportant graphs. 2 As
the default the le $GRACEDIR/data/particle.table is used for the model denition
le. If user wants to use his own model denition le instead of this default le, then
1 We assume user uses C shell.
2 Detailed description is given in chapter 6 in Ref.[8].
9
user should connect the input le name ( for example \myparticle.table" ) with the
environment parameter \GRACETABLE" by setenv.
2.2 Generate Feynman graph
It is recommended to create a new directory for the calculation of one physical process.
For the process + 0 ! + 0 , as an example, we create a directory eewwa and
move to the directory as below: 3
e
e
W
W
::::::::::::::::::::::::::::::::::::::::::::::::::::::::::::::::::::::
grace% mkdir eewwa
grace% cd eewwa
2.2.1
::::::::::::::::::::::::::::::::::::::::::::::::::::::::::::::::::::::
Denition of physical process
For the graph generation the following input le to dene the physical process is necessary. As an example, we consider the process + 0 ! + 0 . We can use the le
/data/d5120, where the following parameter is saved.
e
W
W
::::::::::::::::::::::::::::::::::::::::::::::::::::::::::::::::::::::
* 5120
E+E- => W+ W- A
WORDER
3
INITIAL EL 1
INITIAL ELB 1
FINAL AB 1
FINAL WB 1
FINAL WBB 1
KINEM 3002
END
Fig. 2.1 Input le
e
TREE
eewwa.input for
0 ! W +W 0
the process e+ e
::::::::::::::::::::::::::::::::::::::::::::::::::::::::::::::::::::::
3 In this section
grace%
stands for the
UNIX prompt.
10
Specication of dening physical process is described in subsection 3.1.1. When
there is the target process in the le $GRACEDIR/data/Index, the input parameters for
the process can be found in a le dnnnn, where the number nnnn is the process number
dened in the le Index. When there is no candidate for input-parameter le, the user
has to write it by oneself according to the specication described in subsection 3.1.1.
One must specify the kinematics code number after the keyword KINEM in the input
le. Short list of these built-in kinematics is found in subsection 3.1.1. When KINEM
line is omitted, the system only generates the template code for kinematics, so that the
user should complete it according to the details in the next chapter. There is an index
le $GRACEDIR/kinem/Index which shows the list of available kinematics provided by
the system.
The ordering of the particles in the input le is important since the kinematics
assigns particles according to the order that they appear in this le. Each kinematics
is dened like
1+ 2 ! 3+ 4+ 5
if it is a 2-body to 3-body reaction. In the example in Fig.2.1, is assigned to 3 and so
on. For instance, let's suppose that the kinematics specied by KINEM line has feature
to catch the singularity for the case where particle 3 is emitted along the beam axis.
4
Then if there is such particle in the process to be studied, the user must write the
input le so that the particle corresponds to 3 . The description of each kinematics is
found in the corresponding section in the Appendix.
p
p
p
p
p
p
p
p
2.2.2
Execute graph generation
Suppose a le eewwa.input (like Fig.2.1) is created in the current directory eewwa as
the input le dening the physical process, then the graph generation procedure starts
by typing the command gengraph and the name of input le:
::::::::::::::::::::::::::::::::::::::::::::::::::::::::::::::::::::::
grace% gengraph eewwa.input
It reports some information on the generation including the total number of generated graphs. Also the graph generator creates les \INTBL" , \OUTDS" , and \out.grf"
in the current directory.
::::::::::::::::::::::::::::::::::::::::::::::::::::::::::::::::::::::
4 This is the case for
KINEM 3002.
11
2.3 Draw Feynman graph
This step can be skipped if the user does not want to see graphs. However, it is
recommended to do this step for the conrmation of the input. Also, one can print
Feynman diagrams at a postscript printer. A Feynman graph drawer is initiated by
the command:
::::::::::::::::::::::::::::::::::::::::::::::::::::::::::::::::::::::
grace% treegrf
Then it shows rst 16 diagrams in 4 by 4 format, a few control buttons, number of total
graphs in covariant gauge and that in unitary gauge, and status ags. (If the total
number of diagrams is less than 10, the format is adjusted to the number.) The set of
diagrams shown in the window is called as 'page'. The number of diagrams shown in
a page can be changed. This drawer uses OSF/Motif interface and a few buttons are
shown at the right-hand side of window. The user can use the following functions:
Button / Sub-menu Function
Quit
Exit from the drawer.
Next Page
Show next page.
Previous Page
Show last page.
+5Page
Show 5-th page next.
-5Page
Show 5-th page previous.
Scale up
Make the size of graph larger.
Scale down
Make the size of graph smaller.
::::::::::::::::::::::::::::::::::::::::::::::::::::::::::::::::::::::
Option menu
/ Graph number
/ Vertex number
/ Particle name
Graph menu
On/O display of graph number.
On/O display of vertex number.
On/O display of particle name.
/ Covariant gauge Show diagrams in covariant gauge.
/ Unitary gauge
(Default)
/ Selected graph
Only show selected graphs.
Mode Selection
/ Drawing mode
/ Select mode
(Default)
To select, click on a graph you choose.
EPS output
Create a le named treegrc*.eps which saves
the graphic image of the page shown
in eps format. (*=0,1,2,..)
The drawer refers le out.grf created by gengraph.
12
2.4 Generate source code
After the graph generation, FORTRAN source code is generated by typing the command:
::::::::::::::::::::::::::::::::::::::::::::::::::::::::::::::::::::::
grace% genfort
The procedure genfort uses the les INTBL and OUTDS as input, which should not be
changed. The les xxxxxx.f and Makefile are created as the output in the current
directory, where xxxxxx corresponds to a name of program components described in
section 3.2. For instance, subprogram SETMAS appeared in section 3.2 is created in a
le setmas.f.
::::::::::::::::::::::::::::::::::::::::::::::::::::::::::::::::::::::
2.5 Editing FORTRAN source codes
When the result of the program generated automatically is not satisfactory, the user
might edit the following components. Also, when the user wants to make histograms,
one must edit source code to call XHINIT, DHINIT, XHFILL, DHFILL. Here, *HINIT's are
to be called for initialization of histogram, and *HFILL lls a value on the histogram.
The rst character X and D specify the 1{dimension histogram and the 2-dimensional
scatter plot, respectively.
1) Initialization routine KINIT
One can choose options and parameters by editing KINIT as follows: (See next
chapter for technical details.)
{ Modication of physical parameters
Some physical parameters are to be modied according to the user's will.
For instance, the value of center-of-mass energy, the value of the angle cut-o
etc. are given in KINIT. Further, the kinematics may have some options. For
instance, if there is an integration variable corresponds to an invariant mass,
2
, then one may choose to use either 2 or log 2 in the kinematics by
setting a ag in KINIT. Another possible example is the ag to suppress the
integration over rotation around beam axis. The variety of these parameters
depends on the nature of kinematics at hand. The list of such parameters
is also described in the Appendix.
{ Integration parameters which control the action of BASES.
M
M
13
M
The number of dimensions of integral
The number of wild variables
The lower and upper bounds of integration variable X(i)
The grid optimization ag for i-th variable
The number of sampling points per iteration
The expected accuracy for the grid optimization step
The maximum iteration number for the grid optimization
The expected accuracy for the integration step
The maximum iteration number for the integration step
{ Initialization of histograms and scatter plots
If the user needs histograms for some distributions, the initialization routines XHINIT and DHINIT should be called for each histogram and scatter
plot, respectively. The system automatically generates source code to call
these so as to make histograms with respect to each integration variables,
X(I), I=1..NDIM and the energies and angles of nal particles. The meaning of each X(I) is given in the corresponding section in the Appendix where
section name is the code number of kinematics.
If the user does not need these default histograms, one deletes the corresponding lines. Or if the user wants to make histograms for some distributions, one appends lines to call XHINIT or DHINIT according to the
specication in subsection 3.5.4.
Filling histograms and scatter plots in KFILL
In the generated KFILL by GRACE, histograms for all integration variables and
scatter plots for all combinations of them are to be lled by calling XHFILL and
DHFILL, respectively. If one has changed the initialization of histograms and
scatter plots in KINIT, their lling parts should be also changed (see subsection
3.5.4).
If colored particles are included in the process, one must include the strong coupling constant as a multiplicative factor in the function. The generated function
properly includes the color factors while it assumes s = 1. This is because the
argument of s( 2) cannot be determined uniquely in general. There is a line in
the subroutine KINEM to dene a variable YACOB. One can multiply sn as
YACOB = YACOB3 1 1 1
below that line.
Masses and widths.
They are dened in SETMAS subroutine. If one wants to change the value of top ,
Higgs and so on, the user should edit this le.
Selection of graphs.
This can be done by setting ags JSELG dened in SETMAS.
NDIM
NWILD
XL(i),XU(i)
IG(i)
NCALL
ACC1
ITMX1
ACC2
ITMX2
2)
3)
g
g
4)
m
m
5)
14
2.6 Makele
The command \genfort" also generates the makele Makefile. The user creates three
executable modules, gauge, integ, and spring by this makele:
::::::::::::::::::::::::::::::::::::::::::::::::::::::::::::::::::::::
grace% make
An example of Makefile is shown below. The libraries BASES/SPRING, interface to
CHANEL and CHANEL are stored in the directory GRACELDIR. The objects commonly used
both in BASES and SPRING are dened by macro name OBJS. The macro names INTEG
and INTOBJ dene the executable and the object of the main program for the integration, respectively. Similarly the macro names SPRING, SPOBJS, GAUGE and GAUGEOBJ
are dened.
::::::::::::::::::::::::::::::::::::::::::::::::::::::::::::::::::::::
::::::::::::::::::::::::::::::::::::::::::::::::::::::::::::::::::::::
# FILE "Makefile.f" is generated by GRACE System (Minami-Tateya Group)
# Grace Version
1. 1
10-Aug-94
#
# Makefile for HP
#
SHELL
= /bin/csh
FC
= fort77
#
GRACELDIR
= ........
BASESLIB
CHANELLIB
KINEMLIB
BDUMMLIB
#
OBJS
INTEG
INTOBJ
SPRING
=
=
=
=
bases
chanel
kinem
bdummy
= userin.o
func.o
usrout.o
am0001.o
am0005.o
am0009.o
am0013.o
am0017.o
am0021.o
am0025.o
= integ
= mainbs.o
= spring
amparm.o \
amptbl.o ampsum.o ampord.o \
kinit.o kinem.o kfill.o setmas.o\
am0002.o am0003.o am0004.o \
am0006.o am0007.o am0008.o \
am0010.o am0011.o am0012.o \
am0014.o am0015.o am0016.o \
am0018.o am0019.o am0020.o \
am0022.o am0023.o am0024.o \
am0026.o am0027.o am0028.o
15
SPOBJS
GAUGE
GAUGEOBJ
all:
= mainsp.o spevnt.o spinit.o spterm.o
= gauge
= gauge.o
$(INTEG) $(GAUGE) $(SPRING)
$(INTEG): $(INTOBJ) $(OBJS) $(GRACELDIR)/lib$(BASESLIB).a \
$(GRACELDIR)/lib$(CHANELLIB).a \
$(GRACELDIR)/lib$(KINEMLIB).a
$(FC) $(INTOBJ) $(OBJS) -o $(INTEG) -L$(GRACELDIR) \
-l$(BASESLIB) -l$(CHANELLIB) -l$(KINEMLIB) $(FFLAGS)
$(SPRING): $(SPOBJS) $(OBJS) $(GRACELDIR)/lib$(BASESLIB).a \
$(GRACELDIR)/lib$(CHANELLIB).a \
$(GRACELDIR)/lib$(KINEMLIB).a
$(FC) $(SPOBJS) $(OBJS) -o $(SPRING) -L$(GRACELDIR) \
-l$(BASESLIB) -l$(CHANELLIB) -l$(KINEMLIB) $(FFLAGS)
$(GAUGE): $(OBJS) $(GAUGEOBJ) $(GRACELDIR)/lib$(BDUMMLIB).a \
$(GRACELDIR)/lib$(CHANELLIB).a \
$(GRACELDIR)/lib$(KINEMLIB).a
$(FC) $(GAUGEOBJ) $(OBJS) -o $(GAUGE) -L$(GRACELDIR) \
-l$(BDUMMLIB) -l$(CHANELLIB) -l$(KINEMLIB) $(FFLAGS)
clean:
\rm -f *.o $(INTEG) $(SPRING) $(GAUGE)
Source list 2.1 Makele for HP9000/750
::::::::::::::::::::::::::::::::::::::::::::::::::::::::::::::::::::::
16
2.7 Test of the gauge invariance
The main program gauge.f is used to check the generated amplitudes at a point in
the integration volume as described in section 3.4. In the main program subroutines
USERIN and FUNC are called, which call the histogram packages. Since the histogram
has no meaning in this test, we use dummy library for them stored in the directory
GRACELDIR. Thus it is not necessary to comment out the statements in the subprograms
FUNC and USERIN for this test, which call relevant histogram routines.
The executable gauge is already created and is executed by the following commands:
::::::::::::::::::::::::::::::::::::::::::::::::::::::::::::::::::::::
grace% gauge
This reports the value of matrix element at a point in the phase space in covariant
gauge and that in unitary gauge. If the two values are same, it passes the check here.
The comparison goes as follows:
::::::::::::::::::::::::::::::::::::::::::::::::::::::::::::::::::::::
::::::::::::::::::::::::::::::::::::::::::::::::::::::::::::::::::::::
. . . . .
ANS1
= .4577959455154742
. . . . .
............
ANS2
= .4577959455154741
. . . . .
............
ANS1/ANS2 - 1 = 2.220446049250313E-16
. . . . .
It also reports the relative magnitude of contribution by each graph.
An example of output from the test for the process + 0 ! + 0 is shown in
section 3.4, where the consistency with 14 digits is found between the covariant and
unitary gauges. 5
It should be noted that this test does not guarantee a complete gauge invariance
even though it could give consistency between the two gauges, since it tests only at a
specic point in the phase space. It is recommended to test the gauge invariance at
several points in the phase space.
::::::::::::::::::::::::::::::::::::::::::::::::::::::::::::::::::::::
e
e
W
W
5 However, it might not give long-digit accuracy when unstable gauge particles(W; Z ) have nite
width. One can check this eect by changing the values of width in
17
SETMAS.
2.8 Integration
After examination of the subprograms KINIT and KFILL and a successful test of gauge
invariance, we can proceed to the numerical integration by BASES. By make, we have
already made the executables integ for the integration and spring for event generation.
For integration the command integ is used.
::::::::::::::::::::::::::::::::::::::::::::::::::::::::::::::::::::::
grace% integ
The integration package BASES prints the result on the screen at every end of the
iteration, and also it writes the same lines together with the histogram output on the
le named bases.result at the end.
Normally, if one uses built-in kinematics, the cross section is given in unit of pb.
Before termination of the integration procedure, BASES writes the probability information on a binary le bases.data, which is used for the event generation.
After the integration, the system may issue WARNING messages, if the convergence
is not well established. However, this diagnostics message is not absolute, so that the
user must be careful for the check of the integration.
::::::::::::::::::::::::::::::::::::::::::::::::::::::::::::::::::::::
It is recommended to look at the integration result carefully, especially
over the convergency behaviors both for the grid optimization and integration steps. When the accuracy of each iteration uctuates, iteration by iteration, and,
in some case, it jumps up suddenly to a large value compared to the other iterations,
the resultant estimate of integral may not be reliable. There are two possible origins of
this behavior; one is due to too small sampling points and the other due to an unsuitable choice of the integration variables for the integrand (see subsection 3.5.5 and also
subsection 2.7.4 in Ref.[8]). An example of output for the process + 0 ! + 0 is
given in subsection 3.5.5.
e
18
e
W
W
2.9 Event generation
Since the executable spring is created by the make command already, the event generation starts by typing
::::::::::::::::::::::::::::::::::::::::::::::::::::::::::::::::::::::
grace% spring
::::::::::::::::::::::::::::::::::::::::::::::::::::::::::::::::::::::
Then SPRING reads the probability information from the binary le bases.data and
asks the number of events with the following prompt:
::::::::::::::::::::::::::::::::::::::::::::::::::::::::::::::::::::::
Number of events ?
Here, the user must type the number of events to be generated. The event generation
will run until a given number of events are generated or the number of failure for the
generation exceeds its given maximum. The reason why we have the maximum number
for the failed generation in the event generation is that the generation loop may have a
possibility to get into an innite loop when some mistakes were made (see subsections
3.5.5 item 8, subsections 3.6.1 and 3.6.2).
When the four vectors of generated events are to be written on a le, then this
le should be opened in MAINSP and the four vectors should be written on the le in
MAINSP.
In order to estimate the computing time for the event generation, it is recommended
to use the expected generation time given in the computing time information of BASES
output.( see section 3.5.5 item 5 )
When the kinematics is made of a single-valued function, the subprogram FUNC
should be identical both in the integration and event generation. But if it is not the
case, FUNC in the event generation should be modied from that in the integration as
described in subsection 3.6.1.
The output from SPRING is written on the le named spring.result, which consists of the general information, original and additional histograms, scatter plots, and
number of trials distribution. From the original histograms we can see how the generated events reproduce those distributions produced by the integration. In the number
of trials distribution we can see the generation eciency.
::::::::::::::::::::::::::::::::::::::::::::::::::::::::::::::::::::::
19
Chapter 3
Details of GRACE system
In this chapter, we present technical details of the system. Before coming into the
details, it may be useful to summarize briey here.
Graph generation subsystem
:
1)
Input
2)
Denition of physical process
Specication method of the physical process is described in subsection
3.1.1.
The model denition le
Specication of model is rather complicated, and it is found in chapter
6 in Ref.[8]. We provide a default standard model following Ref.[1], [2]
and we recommend to use this model for the rst use of this system.
Output :
1) System les OUTDS, INTBL
2) Graph information le out.grf
3) Drawn gures
Generated graphs are drawn on a graphic device by using the le
out.grf. They are described in section 3.1.2.
Source generation subsystem
:
1)
2)
Input
The model denition le
System le OUTDS
which is generated by the graph generation subsystem.
Output :
1) Generated FORTRAN source code
Number of les for FORTRAN source codes are generated by GRACE.
20
2)
Subprograms for amplitude calculation are described in section 3.2.
These subprograms use the CHANEL routines through the interface subprograms. Details of the interface subroutines and CHANEL routines will
be described in the chapter 7 of Ref.[8].
Also a main program for BASES (section 3.5) and that for SPRING (section 3.6) are generated.
Output of the testing program
The format of output of the generated test program is given in section
3.4.
Numerical integration subsystem
:
1)
Input
Generated FORTRAN source code
A part of the generated code might need edit. Also if the problem at
hand cannot be handled by the built-in kinematics, the user must write
it by oneself. The description of related subprograms is given in section
3.3.
Output :
1) Print out
The format of output of BASES is given in section 3.5. There may be
statistical error in the Monte Carlo integration and systematic error in
user's kinematic subroutines. So it is very important to see whether the
result is reliable or not.
2) Probability information le
As the result of integration, the probability information, contents of
histograms etc. are saved in this le bases.data, which is used for
event generation.
3) Output le
The results ( 1)Print out) is also written on th le bases.result for
later use.
Event generation subsystem
:
1)
2)
Input
Output
1)
Generated FORTRAN source code
Probability information le
bases.data
:
which is generated by BASES.
Print out
The print out format is given in subsection 3.6.4. This is very useful
to see whether the generated events reproduce really the distribution of
dierential cross section.
21
2)
3)
Output le for the generated events
Generated events are passed to detector simulator or simulator of particle decay. Section 3.6 describes how to deal generated events for this
purpose.
Output le
The results ( 1)Print out) is also written on th le spring.result for
later use.
The generated FORTRAN code uses default values of mass parameters, coupling
constants and other parameters, whose values are set in the subprograms SETMAS and
AMPARM. If one wants, one can change these values by modifying this subroutine.
Although many physical processes have been calculated for testing the GRACE system, it is still possible that a new error may occur in a new reaction. It is important
to check the result in a systematic way. Possible origin of error will be
(1)
(2)
(3)
(4)
Unsuited kinematical variables to the integrand,
Bugs in the kinematics,
Large numerical cancellation,
Bugs in the GRACE.
Numerical cancellation is the most dicult problem to control. Even if the program
is logically correct, it is possible to produce completely wrong result. Some of numerical
cancellation can be avoided by improving kinematics, but others require modication
of generated code.
Anyway one has to check the result intensively. Usual checking method is as follows:
(1)
(2)
(3)
(4)
(5)
Check gauge invariance of the result,
Check Lorentz frame invariance of the result,
Check numerical stability of the result,
Changing the number of sampling points in the numerical integration,
Comparison with other results.
Before the numerical integration, one should conrm that the generated FORTRAN
source code is correct one. GRACE system generates a test program, which provides
a gauge invariance test by comparing the resultant values on a phase space point for
dierent values of gauge parameters. One can check some kind of numerical cancellation
or inconsistency in the generated code. This is the easiest way of checking. However,
since this program checks only at one point, one may miss errors in the dierent region
of the phase space.
22
Since the amplitude is calculated by a numerical way in a special Lorentz frame, one
can test the program by changing reference frame. This method also checks numerical
cancellation partially, as the four components of momenta are changed.
Direct checking method of numerical cancellation is to change precision of the calculation. If your compiler has an option to change precision of oating point number,
it will be easy and powerful method.
The correctness of the kinematics subroutines and statistical reliability will be
checked by careful reading of output of BASES and changing parameters for BASES.
If kinematics subroutines fails to catch steep peeks of the dierential cross section, the
nal value may be completely wrong.
23
3.1 Graph generation
3.1.1
Denition of the physical process
In order to dene a physical process we give the order of coupling constants and names
of external particles as the input.
Below we show an example, which species the process + 0 ! + 0 .
e
e
W
W
::::::::::::::::::::::::::::::::::::::::::::::::::::::::::::::::::::::
* 5120
WORDER
INITIAL
INITIAL
FINAL
FINAL
FINAL
KINEM
END
E+ E3
EL 1
ELB 1
AB 1
WB 1
WBB 1
3001
=> W+ W-
A
TREE
Input le for dening physical process
The format of input is as follows:
1) Comment line
The rst line is a comment line, but it should never be omitted. It is copied to
output les as a header to indicate the process.
2) The order of coupling constants
The second line in the example indicates the order of coupling constants.
::::::::::::::::::::::::::::::::::::::::::::::::::::::::::::::::::::::
WORDER
3
implies that the order of electroweak interaction ( order of perturbation ) is 3.
When one want to restrict the process to pure QED,
EORDER
should be assigned. It is noted that WORDER and EORDER are not allowed to set
at the same time. For QCD one should give the order of QCD coupling by
CORDER.
Combination of WORDER and CORDER or that of EORDER and CORDER are allowed.
In that case the order of each interaction should be dened in dierent line.
24
3)
External particles
To dene the external particles, in the rst column one has to give whether the
current particle is in the INITIAL or FINAL state. Then name of this particle
follows. The list of names is shown in the table below. If it is an anti-particle,
B should be added to the end of the name. For the -boson, WB denes + , so
that 0 is written as WBB. In the last column the number of identical particles
is given by an integer.
Since the ordering of particles in the kinematics is important, the user must
carefully place the external particle lines so that the kinematics works eciently.
W
W
W
::::::::::::::::::::::::::::::::::::::::::::::::::::::::::::::::::
name of particle
WB
ZB
AB
XB
X3
PH
NE
NM
NT
EL
MU
TA
UQ
CQ
TQ
DQ
SQ
BQ
CP
CM
CZ
CA
GL
CG
W+
Z0
+
3
( Higgs boson )
e
e0
0
0
u-quark
c-quark
top-quark
d-quark
s-quark
b-quark
c+ ( ghost for W )
0
( ghost for W )
cZ ( ghost for Z )
c
cA ( ghost for photon )
gluon
cG ( ghost for gluon )
Table 3.1 Names of particles in the default model denition le
4)
::::::::::::::::::::::::::::::::::::::::::::::::::::::::::::::::::
Specication of kinematics
After the keyword KINEM, the user species the code number of the kinematics to
be used. The list of available kinematics provided by the system is found in the
Appendix. For each kinematics nnnn, there exists a section in the Appendix. The
user must consult this document for the usage of the kinematics. The information
in Appendix includes the feature of kinematics, the meaning of variables X(I),
the list of optional parameters, the hint for the assignment of external particles,
and so forth.
25
When the user does not give this line, a part of source code related to the kinematics are not generated and it is left for the user to complete the program.
The detailed information how to construct the code for kinematics is one of the
important task of this chapter.
Table 3.1 shows a list of particle names dened in the model denition le, whose
format is described in chapter 6 in Ref.[8].
In UNIX system, many les named like \dnnnn" are given under the directory
$GRACEDIR/data/ as examples of the input le, whose list is in the le
$GRACEDIR/data/Index. The contents of le \Index" is given in Table 3.2, where the
last three numbers of each line are the orders of perturbation, WORDER, EORDER and
CORDER. If there is the target process in this list, the rst number dnnnn indicate the
le name which contains the input parameters for that process. For example, if one
wants to calculate + 0 ! + 0 , one can use the le d5120. When one cannot
nd the process to be studied, it would be easy to make input le by copying a similar
process's le.
The le particle.table under the same directory contains all the information on
the model used in the graph generation and source generation subsystems.
e
e
W
W
::::::::::::::::::::::::::::::::::::::::::::::::::::::::::::::::::::::
*
*
*
*
*
*
*
*
*
*
*
*
*
*
*
*
5010
5020
5030
5040
5050
5060
5070
5080
5090
5100
5120
6010
6020
6030
6040
6050
E+
E+
E+
E+
E+
E+
E+
E+
E+
E+
E+
E+
E+
E+
E+
E+
EEEEEEEEEEEEEEEE-
=>
=>
=>
=>
=>
=>
=>
=>
=>
=>
=>
=>
=>
=>
=>
=>
NU_e NU_e Z
NU_e NU_e H
E+ E- H
Z Z H
W+ W- H
Z Z Z
W+ W- Z
t t-bar Z
t t-bar PH
H H Z
W+ W- A
NU_e NU_e W+ WMU+ MU- Gamma Gamma
NU_mu NU_mu B B-bar
E+ NU_e t-bar b
E- NU_e-bar u d-bar
Table 3.2 The list of processes in the le
3.1.2
TREE
TREE
TREE
TREE
TREE
TREE
TREE
TREE
TREE
TREE
TREE
TREE
TREE
TREE
TREE
TREE
$GRACEDIR/data/Index
::::::::::::::::::::::::::::::::::::::::::::::::::::::::::::::::::::::
Drawn Feynman graph
In the graph generation, a le out.grf is created under the current directory, where
the graph information is stored. By typing command \treegrf", Feynman graphs are
drawn on the screen when the OSF/Motif on X-Window system is supported.
26
In Fig.3.1, an example of the Feynman graphs drawn by treegrf is shown. The
process is + 0 ! + 0 whose input le is given in this section. Here, since unitary
gauge is selected, a part of graphs are not shown. If covariant gauge is selected by the
button Graph menu, the number of diagrams is 28. Also, by the use of the button
Scale down, the diagrams are shown in 5 by 5 format.
e
e
W
Graph 1
Graph 2
γ
e-
W-
γ
W
e+
γ
W-
Graph 26
ee+
γ
H
γ
γ
e+
e-
W-
e+
γ
W
Z
e+
W
Z
W-
Graph 20
W-
νe
W+
W
W - e+
e-
γ
e-
W+
W
γ
WW+
e-
γ
W
νe
W + e+
Graph 24
W + e-
γ
WW+
Graph 25
W + e-
γ
W + e-
γ
W+
W-
Z
W-
γ
W-
H
W-
γ
Graph 27
W+
W+
Graph 23
γ
γ
Graph 18
e-
W + e+
Graph 5
e-
W - e+
W-
Graph 22
W + e-
H
Graph 12
W
Z
e+
W
W - e+
e-
W + e+
e-
γ
W+
W-
Graph 21
Graph 4
e-
Graph 11
ee+
γ
Z
Graph 10
H
Graph 3
e-
W+
γ
e+
W
e+
γ
e+
e+
Graph 28
γ
W-
νe
W+
e-
Wνe
e+
γ
W+
Figure 3.1: An example of drawn graphs for
27
e
+
e
0 ! W +W 0 .
3.2 Generated source code
There are three kinds of program components. The rst is for the amplitude calculation,
the second is necessary for the integration by BASES and the third is for the event
generation by SPRING.
BASES
SPRING
MAINBS
MAINSP
BSINIT
USERIN
SETMAS
BSREAD
AMPARM
KINIT
KFILL
BASES
FUNC
SPRING
KINEM
BSINFO
AMPSUM
AMPTBL
BHPLOT
AMnnnn
SPINFO
AMPORD
BSWRIT
Interface and
CHANEL Library
SHPLOT
Figure 3.2: Relation among the generated subprograms
The interrelation among the subprograms generated by GRACE is depicted in Fig.3.2,
where those subprograms in the solid box are automatically generated by GRACE,
while those in the dashed box are already contained in other program packages
BASES/SPRING, interface program library to CHANEL, and program package CHANEL.
This gure omits a few minor modules. The modules located in the middle of the
28
gure are common to BASES and SPRING. 1 The program specications of the libraries
BASES/SPRING, the interface to CHANEL and program package CHANEL are described in
sections 3.5.
In the following these program components are summarized.
1) Main programs
MAINBS ( main ) is the main program for the integration.
MAINSP ( main ) is the main program for the event generation.
GAUGE ( main ) is the test main program for the check of gauge
invariance.
2) a set of program components for the integration by BASES
USERIN ( subroutine ) controls initialization.
SETMAS ( subroutine ) denes masses and decay widths of particles.
AMPARM ( subroutine ) denes coupling constants and others.
KINIT
( subroutine ) initializes BASES, kinematics and user's parameters.
FUNC
( function ) calculates the numerical values of dierential cross
section.
KINEM
( subroutine ) derives particle four momenta from the integration
variables.
KFILL
( subroutine ) lls values in histograms and scatter plots.
AMPTBL ( subroutine ) calls AMnnnn to calculate amplitudes.
AMPSUM ( subroutine ) sums matrix elements over the helicity
states. A matrix element is the square of
the sum of amplitudes.
AMnnnn ( subroutine ) calculates amplitude of the nnnn-th graph, where
the number nnnn of the routine name is equal to
the graph number.
AMPORD ( subroutine ) arranges amplitudes.
incl1.f ( include le ) denes the common variables for masses, amplitude tables etc.
incl2.f ( include le ) denes the work space for AMPTBL.
inclk.f ( include le ) transfers values of masses and a few constants.
USROUT ( subroutine ) prints the amplitude summary table. Only used by
gauge.
Although the program components KINIT, KFILL, FUNC and KINEM are created automatically by GRACE, they might need modications. Especially the kinematics routines KINIT and KINEM might need lling up by the user, when the built-in kinematics is not good for the problem at hand. Example of these routines for the process
+ 0
! + 0 are also given there.
e
e
W
W
1 If a multi-valued function appears in the kinematics,
in
SPRING
after the integration by
BASES.
29
FUNC
needs trivial modication for the use
The subprograms USERIN and FUNC are used both in the numerical integration by
BASES and the event generation by SPRING. In the routine USERIN, subroutines KINIT is
called to initialize kinematics and other parameters. The routines SETMAS and AMPARM
are called for the initialization of physical parameters and amplitude calculation.
The function subprogram FUNC is used for calculating the numerical value of differential cross section, where subroutine KINEM is called for calculating four vectors of
external momenta and subroutines AMPTBL and AMPSUM are called for the amplitude
calculation. Since specications for USERIN and FUNC are described in sections 3.5.2
and 3.5.3 respectively, in this section we mention the amplitude calculation part briey.
3.2.1
Initialization of amplitude calculation
Parameters for the amplitude calculation are set in subprograms SETMAS and AMPARM,
and are passed to the relevant subroutines through the several commons, which are
given in the include le incl1.f.
Subroutine SETMAS
The structure of subprogram SETMAS is shown in the source list 3.1. In SETMAS the
following fundamental parameters are dened.
1) Constants
Numerical constants , 2 , 180, GeV/pb and = 2 4 for the amplitude
calculation are set and some of them are passed for later use through the common
/AMCNST/ dened in inclk.f.
2) Selection of diagrams(1)
If one sets the i-th element of the array JSELG( ) to \zero", then one can omit
the corresponding i-th graph and skip the calculation of this amplitude. Each
element of the array correspond to the graph number which can be read o from
the drawn picture of graphs.
3) Masses and widths are dened. The user can modify the default values by
editing here.
4) Gauge parameter
The information about the gauge parameters is summarized in the include le
incl1.f.
Calculation either in covariant gauge( -gauge ) with an arbitrary gauge parameter or in unitary gauge is possible in GRACE system. The distinction between
them is given by integer variables in the common /SMGAUS/.
=
e = R
COMMON /SMGAUS/IGAU00, IGAUAB, IGAUWB, IGAUZB, IGAUGL
30
where IGAUAB, IGAUWB, IGAUZB and IGAUGL are the gauge selection ags for photon, 6, 0 and gluon, respectively. Unitary gauge is selected by setting ag
IGAUxx to 0 for xx boson. This is eectively equivalent to the case where the
gauge parameter of xx boson is set equal to innity.
For the covariant gauge, four dierent values of gauge parameters can be set by
using an array AGAUGE(i) (i runs from 1 to 4).
In the generated FORTRAN code, unitary gauge is taken as the default gauge.
W
Z
COMMON /SMGAUG/AGAUGE(0:4)
REAL*8 AGAUGE
AGAUGE(IGAUAB), AGAUGE(IGAUWB), AGAUGE(IGAUZB)
and AGAUGE(IGAUGL) represent the values of gauge parameters A , W , Z and G, respectively (see
Ref.[8]). To give dierent values of gauge parameters for each boson, the ags
IGAUAB, IGAUWB, IGAUZB and IGAUGL are to be set equal to 1, 2, 3, and 4, respectively, for example. Of course, the values should be set for the variables
AGAUGE(IGAUxx)s here.
5)
Spin summation
The components of spin and polarization vector are controlled by
Fermion
: 0 (helicity = 01), 1 (helicity = +1)
Vector boson : 0, 1 (transverse), 2 (longitudinal).
For each external particle I of non-zero spin, the spin summation is taken from
JHS(I) to JHE(I) as follows;
ANS = 0.0
DO 100 J = JHS(I), JHE(I)
ANS = ANS + table_of_amplitude(J)
100 CONTINUE
where
JHS(I) = 0
JHE(I) = LEPEXA - 1
and
LEPEXA = 2
for the external photon as an example. In the generated code, the spin summation
is originally arranged to give unpolarized cross section. The spin freedoms of
external particles are given in the include le incl1.f (see Source list 3.3.1) as
follows;
31
LEPEXA
LEPEXW
LEPEXZ
LEPEXG
LEXTRN
=
=
=
=
=
2
3
3
2
2
spin freedom of external photon
spin freedom of external 6 boson
spin freedom of external 0 boson
spin freedom of external gluon
spin freedom of external fermion
W
Z
The variable ASPIN is the normalization factor of spin average for initial bosons
and fermions.
6)
Selection of diagrams(2)
Also one can choose a class of diagrams by setting ags. If JWEAKB=0, only QED
diagrams are selected and if JHIGGS=0 all diagrams including Higgs particle are
excluded.
:::::::::::::::::::::::::::::::::::::::::::::::::::::::::::::::::::::::::::::::::
* FILE "setmas.f" is generated by GRACE System (Minami-Tateya Group)
* Grace Version 1. 1
1994-Aug-19
************************************************************************
SUBROUTINE SETMAS
IMPLICIT REAL*8(A-H,O-Z)
INCLUDE 'incl1.f'
INCLUDE 'inclk.f'
COMMON /AMSPIN/JHS(NEXTRN), JHE(NEXTRN), ASPIN
*----------------------------------------------------------------------* Constants
PI
= ACOS(- 1.0D0 )
PI2 = PI * PI
RAD = PI / 180.0D0
*
ref .Review of Particle Properties, Phy.Rev.D50(1994)1173
GEVPB = 0.38937966D9
*
ALPHA = 7.2973503D-3
ALPHA = 1.0D0/137.0359895D0
*
* Graph selection (1)
DO 10 NG = 1, NGRAPH
JSELG(NG) = 1
10 CONTINUE
*----------------------------------------------------------------------* ref. Review of Particle Properties, Phy.Rev. D50(1994)1173
*
* Mass
AMWB = 80.22D0
AMZB = 91.187D0
AMAB = 0.0D0
AMXB =
AMX3 =
AMWB
AMZB
32
AMPH = 2000.0D0
AMNE
AMNM
AMNT
AMLU
=
=
=
=
0.0D0
0.0D0
0.0D0
AMNE
AMEL
AMMU
AMTA
AMLD
=
=
=
=
0.51099906D-3
105.658389D-3
1.7771D0
AMEL
AMUQ
AMD0
AMJ
AMCQ
AMTQ
AMQU
=
=
=
=
=
=
2.0D-3
1864.6D-3
3.09688D0
1.0D0
174.0D0
AMUQ
AMDQ
AMSQ
AMB0
AMU
AMBQ
AMQD
=
=
=
=
=
=
5.0D-3
100.0D-3
5.375D0
9.46037D0
4.1D0
AMDQ
AMCP
AMCM
AMCZ
AMCA
=
=
=
=
AMWB
AMWB
AMZB
AMAB
AMGL = 0.0D0
AMCG = AMGL
*
* Width
AGWB = 2.08D0
AGZB = 2.490D0
AGAB = 0.0D0
AGXB = AGWB
AGX3 = AGZB
AGPH = 4000.0D0
. . . . .
* Masses of external
AMASS1( 1) =
AMASS1( 2) =
AMASS1( 3) =
AMASS1( 4) =
AMASS1( 5) =
particles
AMEL
AMEL
AMAB
AMWB
AMWB
33
AMASS2(
AMASS2(
AMASS2(
AMASS2(
AMASS2(
1)
2)
3)
4)
5)
=
=
=
=
=
AMASS1(
AMASS1(
AMASS1(
AMASS1(
AMASS1(
*
* Gauge parameters (default is
IGAUAB = 0
IGAUWB = 0
IGAUZB = 0
IGAUGL = 0
AGAUGE(IGAU00) = 1.0D0
AGAUGE(IGAUAB) = 1.0D0
AGAUGE(IGAUWB) = 1.0D0
AGAUGE(IGAUZB) = 1.0D0
AGAUGE(IGAUGL) = 1.0D0
*
* Spin average
ASPIN = 1.0D0
*
1: EL- INITIAL
JHS( 1) = 0
JHE( 1) = LEXTRN - 1
ASPIN = ASPIN/DBLE(JHE(
*
2: EL+ INITIAL
JHS( 2) = 0
JHE( 2) = LEXTRN - 1
ASPIN = ASPIN/DBLE(JHE(
*
3: AB
FINAL
JHS( 3) = 0
JHE( 3) = LEPEXA - 1
*
4: WB+ FINAL
JHS( 4) = 0
JHE( 4) = LEPEXW - 1
*
5: WB- FINAL
JHS( 5) = 0
JHE( 5) = LEPEXW - 1
*
* Graph selection (2)
JWEAKB = 1
JHIGGS = 1
1)**2
2)**2
3)**2
4)**2
5)**2
unitary gauge)
LPRTCL
MASS=AMEL
1)-JHS( 1)+1)
LANTIP MASS=AMEL
2)-JHS( 2)+1)
LPRTCL MASS=AMAB
LPRTCL MASS=AMWB
LANTIP MASS=AMWB
RETURN
END
Source list 3.1 subprogram
SETMAS
:::::::::::::::::::::::::::::::::::::::::::::::::::::::::::::::::::::::::::::::::
Subroutine AMPARM
In the source list 3.2 the structure of subprogram AMPARM is given, which prepares the
following items:
34
1)
2)
3)
Version number
The version number of GRACE system is compared with that of the interface
package to CHANEL in SMINIT. If they are not consistent, job is terminated for the
sake of safety.
Coupling constants
Coupling constants for various vertices are calculated.
Color factors
Color factors ( the array CF(i,j) ) for each combination of two graphs are calculated.
:::::::::::::::::::::::::::::::::::::::::::::::::::::::::::::::::::::::::::::::::
* FILE "amparm.f" is generated by GRACE System (Minami-Tateya Group)
* Grace Version 1. 1
1994-Aug-19
************************************************************************
SUBROUTINE AMPARM
IMPLICIT REAL*8(A-H,O-Z)
*----------------------------------------------------------------------INCLUDE 'incl1.f'
INCLUDE 'inclk.f'
*----------------------------------------------------------------------CALL SMINIT( 1, 1)
* Coupling constants
*----------------------------------------------------------------------AMWB2 = AMWB*AMWB
AMZB2 = AMZB*AMZB
AMPH2 = AMPH*AMPH
AMZW2 = AMZB2 - AMWB2
AMZW = SQRT(AMZW2)
RMZW = AMZB/AMWB
R2
= SQRT(2.0D0)
R2I = 1.0D0/R2
CCCC ALPHA = 1.0D0/137.0359895D0
CE2 = 4.0D0*PI*ALPHA
CE
= SQRT(CE2)
GW
= AMWB/AMZW
GZ
= AMZB/AMZW
GZW = AMZB/AMWB
GWZ = AMWB/AMZB
QL
= - 1.0D0
QU
= 2.0D0/3.0D0
QD
= - 1.0D0/3.0D0
*----------------------------------------------------------------------* VVV
CZWW
= CE*GW
CAWW
= CE
35
* VVVV
* FFW
* FFA
* FFZ
* SSV
* SVV
CWWAA
CWWZA
CWWZZ
CWWWW
= CE2
= CE2*GW
= CE2*GW*GW
= -CE2*GZ*GZ
GWFL
=
GWFR
=
. . . . .
CWEL(1,1) =
CWEL(2,1) =
CWEL(1,2) =
CWEL(2,2) =
. . . . .
CE*GZ*R2I
0.0D0
GWFL
GWFR
CONJG(CWEL(1,1))
CONJG(CWEL(2,1))
GAL
= QL*CE
. . . . .
CAEL(1) = GAL
CAEL(2) = GAL
. . . . .
GZA
=
GZC
=
GZLL
=
GZLR
=
. . . . .
CZEL(1) =
CZEL(2) =
. . . . .
0.5D0*CE*GZW*GZ
CE/GW
- QL*GZC - GZA
- QL*GZC
GZLL
GZLR
CWXP(1)
CWXP(2)
CWX3(1)
CWX3(2)
CZXX
CAXX
CZ3P
=
=
=
=
=
=
=
DCMPLX(0.0D0, 0.5D0*CE*GZ)
- CONJG(CWXP(1))
0.5D0*CE*GZ
- CONJG(CWX3(1))
CE*(0.5D0*GZW*GZ - GW)
- CE
DCMPLX(0.0D0, 0.5D0*CE*GZ*GZW)
CPWW
CPZZ
CXWZ(1)
CXWZ(2)
CXWA(1)
CXWA(2)
=
=
=
=
=
=
CE*AMWB*GZ
CE*AMZB*GZ*GZW
DCMPLX(0.0D0, CE*AMZW)
CONJG(CXWZ(1))
DCMPLX(0.0D0, -CE*AMWB)
CONJG(CXWA(1))
* SSVV
36
* SSS
* SSSS
* FFX
* FFP
* FF3
CPPWW
CPPZZ
CPXWZ(1)
CPXWZ(2)
CPXWA(1)
CPXWA(2)
C33WW
C33ZZ
C3XWZ(1)
C3XWZ(2)
C3XWA(1)
C3XWA(2)
CXXWW
CXXZZ
CXXAA
CXXAZ
=
=
=
=
=
=
=
=
=
=
=
=
=
=
=
=
0.5D0*CE2*GZ**2
0.5D0*CE2*(GZW*GZ)**2
DCMPLX(0.0D0, 0.5D0*CE2*GZW)
CONJG(CPXWZ(1))
DCMPLX(0.0D0, -0.5D0*CE2*GZ)
CONJG(CPXWA(1))
0.5D0*CE2*GZ**2
0.5D0*CE2*(GZW*GZ)**2
0.5D0*CE2*GZW
CONJG(CPXWZ(1))
- 0.5D0*CE2*GZ
CONJG(CPXWA(1))
0.5D0*CE2*GZ**2
0.5D0*CE2*(2*GW - GZ*GZW)**2
2.0D0*CE2
CE2*(2*GW - GZ*GZW)
GS
CPXX
CP33
CPPP
=
=
=
=
0.5D0*CE*AMPH2*GZ/AMWB
GS
GS
- 3.0D0*GS
GS2
C3333
CPPPP
CXX33
CXXPP
CPP33
CXXXX
=
=
=
=
=
=
=
GS*GS/AMPH2
- 3.0D0*GS2
- 3.0D0*GS2
GS2
GS2
GS2
- 2.0D0*GS2
GX
= CE*GZ/(R2*AMWB)
. . . . .
CXEL(1,1) = DCMPLX(0.0D0, AMNE*GX)
CXEL(2,1) = DCMPLX(0.0D0, -AMEL*GX)
CXEL(1,2) = CONJG(CXEL(2,1))
CXEL(2,2) = CONJG(CXEL(1,1))
. . . . .
G3
= CE*GZ/(2*AMWB)
. . . . .
CPEL(1)
= - AMEL*G3
CPEL(2)
= - AMEL*G3
. . . . .
. . . . .
C3EL(1) = DCMPLX(0.0D0, - AMEL*G3)
C3EL(2) = - C3EL(1)
37
. . . . .
*
* QCD coupling constant should be calculated in 'KINIT'.
CQCD = 1.0D0
CQCDSQ = 1.0D0
CQQG(1) = -1.0D0
CQQG(2) = -1.0D0
*
DO 100 I = 1, NGRAPH
IGRAPH(I) = 0
DO 100 J = 1, NGRAPH
CF(J, I) = 1.0D0
100 CONTINUE
RETURN
END
Source list 3.2 subprogram
AMPARM
:::::::::::::::::::::::::::::::::::::::::::::::::::::::::::::::::::::::::::::::::
Include le incl1.f
This le is prepared for passing the parameters for the amplitude calculation set in
the subroutines SETMAS and AMPARM to the relevant subroutines through the several
commons. In the source list 3.3.1 the structure of incl1.f for the process + 0 !
+
0 is shown.
1) Parameter statements
The parameters which dene the sizes of arrays are given by the parameter statement. LEPEXA, LEPEXW, LEPEXZ and LEPEXG are the spin freedoms of external
photon, W-boson, Z-boson and gluon, respectively. LEPINA, LEPINW, LEPINZ and
LEPING are those for internal lines. LEXTRN and LINTRN are the spin freedoms for
fermions of external and internal lines, respectively.
The parameters LOUTGO, LINCOM, LANTIP and LPRTCL are just the input constants
for the program package CHANEL.
2) Table of amplitude
The calculated amplitudes for all graphs are stored in an array AG( ). An array
APROP( ) is used to keep the numerical value of the denominators of propagators.
The arrays AV( ), LT( ) and INDEXG( ) in the common /SMATBL/ are for temporary use.
4) Coupling constants
The coupling constant for each type of vertex is in the common /AMCPLC/, which
is dened in AMPARM.
e
W
W
38
e
5)
6)
Four momenta of external particles
The four momenta of external particles are given in the arrays PEnnnn( ), where
the fourth components correspond to the energies. An array PPROD(i,j) gives
the inner products of particle momenta i and j. They are derived in KINEM and
copied to these arrays in FUNC.
CHANEL inputs for the external particles
The arrays PSnnnn, EWnnnn, CEnnnn and EPnnnn are the lists of light-like vectors,
weight factors, phase factors and list of polarization vectors, respectively, which
are dened in section 2.4.
:::::::::::::::::::::::::::::::::::::::::::::::::::::::::::::::::::::::::::::::::
PARAMETER (LOUTGO = 2, LINCOM = 1)
PARAMETER (LANTIP = -1, LPRTCL = 1)
PARAMETER (LSCALR = 1)
PARAMETER (LEPEXA = 2, LEPEXW = 3, LEPEXZ = 3, LEPEXG = 2)
PARAMETER (LEPINA = 4, LEPINW = 4, LEPINZ = 4, LEPING = 3)
PARAMETER (LEXTRN = 2, LINTRN = 4)
* Table of amplitudes
PARAMETER (NGRAPH =
28, NEXTRN =
5, LAG = 72)
PARAMETER (NGRPSQ = NGRAPH*NGRAPH)
COMMON /AMSLCT/JSELG(NGRAPH), JGRAPH, JHIGGS, JWEAKB
COMPLEX*16 AG, APROP
COMMON /AMGRPH/AG(0:LAG-1,NGRAPH), APROP(NGRAPH),
&
ANCP(NGRAPH), ANSP(0:NGRAPH),
&
CF(NGRAPH,NGRAPH), IGRAPH(NGRAPH)
* Coupling constants
COMMON /AMCPLC/CZWW
&
CWWZZ
...............
,CAWW
,CWWWW
,CWWAA
,CWWZA
,
,CWL
(2,2),CWEL (2,2),
* Momenta of external particles
COMMON /AMEXTR/PE0001(4),PE0002(4),PE0003(4),PE0004(4),
&
PE0005(4),
&
PPROD(NEXTRN, NEXTRN)
* Switch of gauge parameters
COMMON /SMGAUS/IGAU00,IGAUAB,IGAUWB,IGAUZB,IGAUGL
COMMON /SMGAUG/AGAUGE(0:4)
* Normalization
COMMON /SMDBGG/FKNORM,FKCALL,NKCALL
* Calculated table of amplitudes
COMMON /SMATBL/AV, LT, INDEXG
COMPLEX*16 AV(0:LAG-1)
INTEGER
LT(0:NEXTRN), INDEXG(NEXTRN)
* For external particles
COMMON /SMEXTP/
39
&
&
&
&
&
PS0001, EW0001, CE0001,
PS0002, EW0002, CE0002,
EP0003, EW0003,
EP0004, EW0004,
EP0005, EW0005
REAL*8
PS0001(4,2), EW0001(1)
COMPLEX*16 CE0001(2,2)
REAL*8
PS0002(4,2), EW0002(1)
COMPLEX*16 CE0002(2,2)
REAL*8
EP0003(4,LEPEXA), EW0003(LEPEXA)
REAL*8
EP0004(4,LEPEXW), EW0004(LEPEXW)
REAL*8
EP0005(4,LEPEXW), EW0005(LEPEXW)
Source list 3.3.1 Include le
incl1.f
:::::::::::::::::::::::::::::::::::::::::::::::::::::::::::::::::::::::::::::::::
Include le incl2.f
Here, working areas to be used in the computation of amplitudes are dened..
:::::::::::::::::::::::::::::::::::::::::::::::::::::::::::::::::::::::::::::::::
COMMON /AMWORK/ IDMM(
COMMON /AMWORI/ IDMI(
780)
17)
Source list 3.3.2 Include le
incl2.f
:::::::::::::::::::::::::::::::::::::::::::::::::::::::::::::::::::::::::::::::::
Include le inclk.f
1)
2)
Masses and widths
The variables in the commons /AMMASS/ and /AMGMMA/ are masses and widths of
particles, respectively, which are dened in SETMAS.
Physical constants
The variables in the common /AMCNST/ , and others, are dened in SETMAS.
3)
4)
Double-valued case
The variable MXREG in the common /AMCNST/ gives maximum multiplicity of the
indegrand.
External momenta
The variables in the common /KMMASS/ stores external masses dened in SETMAS
and they are expected to be referred in KINEM and KINIT.
:::::::::::::::::::::::::::::::::::::::::::::::::::::::::::::::::::::::::::::::::
40
* Masses and
COMMON
&
&
COMMON
&
&
COMMON
COMMON
width of particles
/AMMASS/AMWB,AMZB,AMAB,AMXB,AMX3,AMPH,AMLU,AMNE,AMNM,AMNT,
AMLD,AMEL,AMMU,AMTA,AMQU,AMUQ,AMCQ,AMTQ,AMQD,AMDQ,
AMSQ,AMBQ,AMCP,AMCM,AMCZ,AMCA,AMGL,AMCG
/AMGMMA/AGWB,AGZB,AGAB,AGXB,AGX3,AGPH,AGLU,AGNE,AGNM,AGNT,
AGLD,AGEL,AGMU,AGTA,AGQU,AGUQ,AGCQ,AGTQ,AGQD,AGDQ,
AGSQ,AGBQ,AGCP,AGCM,AGCZ,AGCA,AGGL,AGCG
/AMCNST/ PI, PI2, RAD, GEVPB, ALPHA
/AMREG / MXREG
*** Masses of external particles
COMMON /KMMASS/AMASS1( 5), AMASS2(
5)
Source list 3.3.3 Include le
inclk.f
:::::::::::::::::::::::::::::::::::::::::::::::::::::::::::::::::::::::::::::::::
3.2.2
Amplitude calculation
To calculate the numerical values of amplitudes, rst the values of integration variables are translated into the four momenta of external particles, which is done by the
subroutine KINEM. Then the subroutine AMPTBL is called to calculate the amplitudes.
Subroutine AMPTBL
The subroutine AMPTBL for the process + 0 ! + 0 is shown in the source list
3.4, whose functions are as follows;
1) External particles
At the beginning of AMPTBL all the information about the external fermions and
vector bosons are prepared in suitable form for the calculation of vertices as shown
in the source list 3.4. For the external fermion ( vector boson ) the subroutine
SMEXTF ( SMEXTV ) is called for this purpose, whose specications are given in
section 7.2 in Ref.[8].
e
e
W
W
::::::::::::::::::::::::::::::::::::::::::::::::::::::::::::::::::
* FILE "amptbl.f" is generated by GRACE System (Minami-Tateya Group)
* Grace Version 1. 1
1994-Aug-19
************************************************************************
SUBROUTINE AMPTBL
** 5120
E+ E- => W+ W- A
TREE
IMPLICIT REAL*8(A-H,O-Z)
INCLUDE 'incl1.f'
INCLUDE 'inclk.f'
INCLUDE 'incl2.f'
*----------------------------------------------------------------------JGRAPH = 0
41
*
External lines
CALL SMEXTF(LINCOM,AMEL,PE0001,PS0001,CE0001)
EW0001(1) = LPRTCL
CALL SMEXTF(LOUTGO,AMEL,PE0002,PS0002,CE0002)
EW0002(1) = LANTIP
CALL SMEXTV(LEPEXA,AMAB,PE0003,EP0003,EW0003,IGAUAB)
CALL SMEXTV(LEPEXW,AMWB,PE0004,EP0004,EW0004,IGAUWB)
CALL SMEXTV(LEPEXW,AMWB,PE0005,EP0005,EW0005,IGAUWB)
* Graph NO.
1 - 1 ( 1)
IF (JWEAKB.NE.0) THEN
IF (JSELG( 1).NE.0) THEN
JGRAPH = JGRAPH + 1
IGRAPH(JGRAPH) =
1
CALL AM0001
ENDIF
ENDIF
.............
* Graph NO. 28 - 1 ( 28)
IF (JWEAKB.NE.0) THEN
IF (JSELG( 28).NE.0) THEN
JGRAPH = JGRAPH + 1
IGRAPH(JGRAPH) = 28
CALL AM0028
ENDIF
ENDIF
RETURN
END
Source list 3.4 Example of subroutine
AMPTBL
The variables LEPEXW and LEPEXA represent the spin freedoms of external Wbosons and photon, respectively, and are set in the include le incl1.f by the
parameter statement as shown in the source list 3.3.1. For the fermion the variable EWnnnn(1) is set equal to \1" for particle or \01" for anti-particle. In
this example, EW0001(1) is set equal to \1" (electron) and EW0002(1) to \01"
(positron).
::::::::::::::::::::::::::::::::::::::::::::::::::::::::::::::::::
2)
Calculation of each amplitude
The subroutine AMnnnn is called to calculate the nnnn-th graph. Since there are
28 graphs in the process + 0 ! + 0 , there are 28 subroutines from AM0001
e
e
W
W
42
to AM0028. The ag JSELG(i) is used for selecting the graph. If it is set equal to
\zero" in the subroutine SETMAS the corresponding i-th graph is not included in
the calculation. This ag is to be set by the user for the time being, but it will
be implemented in near future.
Subroutine AMnnnn
e
+
7
4
7
4
7
4
7
4
7
4
6
5
6
5
6
5
6
5
6
5
p 1 ; h1
6
e
0
e
-
7
4
7
4
7
p
p
p
4p 7
p
p
p
6
5
6
5
6
5
p
p
p
p
p
p
p
p
p
p
p
p
4
7
4
6
5
6
p 2 ; h2
Figure 3.3: A Feynman graph for the process
e
+
e
p
W
+
;
k; 3
;
5
W
q1 ; 1
0;
q2 ; 2
0 ! W +W 0 .
A main part of amplitude calculation appears in subroutines AMnnnns. To describe
the amplitude generation (see section 2.4 in Ref.[8]), we take a Feynman graph as
an example in the process + 0 ! + 0 shown in gure 3.3. The corresponding
subroutine to the graph is AM0020, whose compositions are as follows;
1) Internal momenta
The internal momenta PE0141 and PE0143 are calculated from the external momenta, which correspond to those of internal neutrino and W-boson, respectively.
2) Propagators
The product of denominators of propagators is calculated by the subroutine
SMPRPD, where the inputs are the momentum transfer, mass square and mass
times width.
The numerator of each propagator is handled by the subroutines SMINTF and
SMINTV for the internal neutrino and W-boson, respectively.
3) Vertices
Numerical values of vertex amplitudes are calculated by subroutines SMFFV and
SMVVV. By SMFFV the vertices e 0 + and + e 0 are calculated and for the
vertex 0 + subroutine SMVVV is used. The calculated amplitudes of vertices
e 0 + and + e 0 and 0 + are saved in the arrays AV0092, AV0093 and
AV0094, respectively.
4) Connection of vertices
First the vertices e 0 + and + e 0 are connected by the routine SMCONF,
where the amplitudes AV0092 and AV0093 are combined by summing over all the
e
e
W
e
W
e
W
W
W
W
e
W
e
W
W
W
e
W
43
e
W
possible helicity states of the internal neutrino with weight EW0141. The resultant
amplitude is stored in an array AV0095.
Second the resultant amplitude AV0095 and 0 + amplitude AV0094 are connected by taking summation over all the possible polarization states of internal
W-boson with weight EW0143 using the routine SMCONV. The total amplitude is
saved in an array AV.
W
5)
W
Rearrange the internal structure of amplitude
In order to sum up all amplitudes, they have to have the same internal structure.
However, the internal structure of amplitude AV does strongly depend upon the
order of constructing the amplitude, which may be dierent graph by graph. A
subroutine AMPORD is used to change the amplitude AV in an individual structure
into the amplitude AG in an unied structure.
:::::::::::::::::::::::::::::::::::::::::::::::::::::::::::::::::::::::::::::::::
* FILE "am0020.f" is generated by GRACE System (Minami-Tateya Group)
* Grace Version 1. 1
1994-Aug-19
* Graph No. 20 - 1 ( 20)
************************************************************************
SUBROUTINE am0020
IMPLICIT REAL*8(A-H,O-Z)
INCLUDE 'incl1.f'
INCLUDE 'inclk.f'
*----------------------------------------------------------------------COMMON /AMWORK/
& PE0141, EW0141, PS0141, VM0141, CE0141,
& PE0143, EP0143, EW0143, VM0143,
& AV0092,AV0093,AV0094,AV0095
COMMON /AMWORI/
& LT0092,LT0093,LT0094,LT0095
*
2528+
68 bytes used.
REAL*8
COMPLEX*16
REAL*8
INTEGER
COMPLEX*16
INTEGER
COMPLEX*16
INTEGER
COMPLEX*16
INTEGER
COMPLEX*16
PE0141(4), EW0141(2), PS0141(4,3), VM0141
CE0141(2,4)
PE0143(4), EP0143(4,LEPINW), EW0143(LEPINW), VM0143
LT0092(0:3)
AV0092(0:LINTRN*LEXTRN*LEPEXW-1)
LT0093(0:3)
AV0093(0:LEXTRN*LINTRN*LEPINW-1)
LT0094(0:3)
AV0094(0:LEPINW*LEPEXW*LEPEXA-1)
LT0095(0: 4)
AV0095(0:LEXTRN*LEPINW*LEXTRN*LEPEXW-1)
*----------------------------------------------------------------------* Internal momenta
44
DO 100 I = 1, 4
PE0141(I) = -PE0002(I) +PE0004(I)
PE0143(I) = -PE0003(I) -PE0005(I)
100 CONTINUE
APROP(JGRAPH) = 1.0D0
VM0141 = - 2.0D0*PPROD( 2, 4) + 1.0D0*AMWB**2 + 1.0D0*AMEL**2
CALL SMPRPD(APROP(JGRAPH),VM0141,AMNE**2,AMNE*AGNE)
VM0143 = + 2.0D0*PPROD( 3, 5) + 1.0D0*AMWB**2 + 1.0D0*AMAB**2
CALL SMPRPD(APROP(JGRAPH),VM0143,AMWB**2,AMWB*AGWB)
*
Internal lines
CALL SMINTF(AMNE,PE0141,VM0141,EW0141,PS0141,CE0141)
CALL SMINTV(LEPINW,AMWB,PE0143,EP0143,EW0143,VM0143,IGAUWB)
*
Vertices
CALL SMFFV(LINTRN,LEXTRN,LEPEXW,EW0141,EW0002,AMNE,AMEL,
&
CWEL (1,2),CE0141,CE0002,PS0141,PS0002,EP0004
&
,LT0092,AV0092)
CALL SMFFV(LEXTRN,LINTRN,LEPINW,EW0001,EW0141,AMEL,AMNE,
&
CWEL (1,1),CE0001,CE0141,PS0001,PS0141,EP0143
&
,LT0093,AV0093)
CALL SMVVV(LEPINW,LEPEXW,LEPEXA,-1,-1,-1,CAWW ,PE0143,PE0005,
&
PE0003,EP0143,EP0005,EP0003,LT0094,AV0094)
*
Connect vertices.
CALL SMCONF(LT0093,LT0092, 2, 1,EW0141,AV0093,AV0092,
&
LT0095,AV0095)
CALL SMCONV(LT0094,LT0095, 1, 2,EW0143,AV0094,AV0095,
&
LT,AV)
APROP(JGRAPH) = +1.0D0/APROP(JGRAPH)
INDEXG( 1) =
5
INDEXG( 2) =
3
INDEXG( 3) =
1
INDEXG( 4) =
2
INDEXG( 5) =
4
CALL AMPORD(LT, AV, INDEXG, AG(0,JGRAPH))
RETURN
END
Source list 3.5 Subroutine
AM0020
for e+ e
0 ! W +W 0
:::::::::::::::::::::::::::::::::::::::::::::::::::::::::::::::::::::::::::::::::
45
3.3 Specication of the kinematics routines
In general the choice of integration variables is highly dependent on the structure of
singularities in the amplitude squared, such as infrared divergence, mass-singularity
and -channel photon exchange. It is quite dicult to prepare a kinematics enough
general for any process. The user can write the kinematics most appropriate for the
process to be calculated based on the following description. The subroutines related
to this work are as follows:
KINIT Initialization of kinematics.
KINEM Calculate four-momenta of nal particles from
integration variables.
Convention used in GRACE for the 4-momentum is that it is stored in an array in
the order of x y z .
t
p ;p ;p ;E
3.3.1
Subroutine USERIN
3.3.2
Subroutine KINIT
After the initialization of BASES/SPRING, i.e., call of BSINIT for BASES or call of BSINIT
and BSREAD for SPRING, the subroutine USERIN is called for the initialization of amplitude calculation. The subroutine USERIN calls SETMAS and AMPARM.
makes the initialization of the kinematics and is called by USERIN.
In the source list 3.6 the subroutine KINIT for the process + 0 ! + 0
is shown. It is generated by KINEM 3002. Its program structure is shown below.
Among these items, items 5) and 6) are explained in detail related to the integration
stage(sectio 3.5.2).
1) Give center-of-mass energy. Here, S and W are stored in the common area
/KINAM1/.
2) Dene various cuto parameters.
3) Print values for 1) and 2), since they might be changed by the user by editing.
4) Prepare some variables which are referred in KINEM. Here, FACT in the common
area /KINAM1/ is dened.
5) Initialization of BASES parameters. Set the parameters for BASES. These parameters are transmitted to BASES through the commons /BPARM1/ and /BPARM2/.
6) Initialize histogram by calling XHINIT.
7) Set MXREG which represents the maximum multiplicity in case of malti-valued
kinematics. For simple kinematics, it is 1.
KINIT
e
46
e
W
W
:::::::::::::::::::::::::::::::::::::::::::::::::::::::::::::::::::::::::::::::::
SUBROUTINE KINIT
C--------------------------------------------------------------------C GRACE System Library File
C KINEM No. : 3002
C Date
: 1994.04.30
C Author
: Y.Kurihara
C--------------------------------------------------------------------C
IMPLICIT REAL*8(A-H,O-Z)
PARAMETER ( MXDIM = 50 )
COMMON / LOOP0 / LOOP
COMMON / BPARM1 / XL(MXDIM),XU(MXDIM),NDIM,NWILD,
&
IG(MXDIM),NCALL
COMMON / BPARM2 / ACC1,ACC2,ITMX1,ITMX2
COMMON / BASE3 / SI,SI2,SWGT,SCHI,SCALLS,ATACC,NSU,IT,WGT
CHARACTER XSTR*14
INCLUDE "inclk.f"
*----------------------------------------------------------------------COMMON/KMCNTL/IRESNS,ICOS3
COMMON/KINEM1/S,W,FACT
COMMON/CUT001/COSCUT(2,3),ENGYCT(2,3),AMASCT(2),ARESNS(2)
*----------------------------------------------------------------------* 3-body kinematics
*
* Integration variables
*
COS(the3),Phi3(=0)
*
Q2=(p4+p5)**2
*
COS(the4),Phi4
in particle 4,5 CM frame
*
*
/P4
*
/
*
p1\
/
*
\
q/\
*
***** / \
*
*******
\P5
*
***** \
*
/
\
*
/
\
*
p2/
\p3
*
*
*--- 1. Initialize constants for kinematics.
* S = (P1+P2)**2
* W = SQRT(S)
W =1000.D0
S = W*W
totmas=amass1(3)+amass1(4)+amass1(5)
47
if(totmas.gt.w) then
write(6,*)
.' CM energy is less than the sum of final particle masses.'
stop
end if
*******************************
* Angular cuts in Lab-frame. *
*******************************
* particle 3
* minimum cos cut
COSCUT(1,1)= -1
* maximum cos cut
COSCUT(2,1)= 1
* particle 4
* minimum cos cut
COSCUT(1,2)= -1
* maximum cos cut
COSCUT(2,2)= 1
* particle 5
* minimum cos cut
COSCUT(1,3)= -1
* maximum cos cut
COSCUT(2,3)= 1
*******************************
* Energy cuts in Lab-frame. *
*******************************
* particle 3
* minimum energy cut
ENGYCT(1,1) = AMASS1(3)
ENGYCT(1,1) = 0.1d-2
* maximum energy cut
ENGYCT(2,1) = W
* particle 4
* minimum energy cut
ENGYCT(1,2) = AMASS1(4)
* maximum energy cut
ENGYCT(2,2) = W
* particle 5
* minimum energy cut
ENGYCT(1,3) = AMASS1(5)
* maximum energy cut
ENGYCT(2,3) = W
*******************************
* Cut on invariant mass of 4-5*
*******************************
* minimum
AMASCT(1)= AMASS1(4)+AMASS1(5)
* maximum
AMASCT(2)= W-AMASS1(3)
48
*******************************
* Q2 singularity treatment
*
*******************************
* no-singularity
: IRESNS= 0
* narrow resonance
: IRESNS= 1
* 1/Q2 singularity
: IRESNS=-1
IRESNS = 0
IF(IRESNS.EQ.1) THEN
C If you want treat narrow resonance, you should set resonance mass
C and width.
C
ARESNS(1)=AM**
C
ARESNS(2)=AG**
ARESNS(1)=0
ARESNS(2)=0
END IF
*********************************
* mass singularity treatment
*
*********************************
* no-singularity
: ICOS3=0
* mass-singularity
: ICOS3=1
*
* If ICOS3=1, a particle 3 is assumed to be an initial state
* radiated photon (amass1(3)=0) and particle1 and particle2 have
* the same mass (AMASS1(1)=AMASS1(2)>0), and IRESNS is ignored.
*
ICOS3=1
if(icos3.eq.1 .and. amass1(3).gt.1.d-20) then
write(6,*)'If ICOS3=1, particle 3 should be photon.'
stop
endif
WRITE(6,*)'*'
WRITE(6,*)'* Kinematics initialization '
WRITE(6,*)'* CM Energy ',W
WRITE(6,*)'* COSCUT
'
WRITE(6,'(2F10.3)')COSCUT
WRITE(6,*)'* ENGYCT
'
WRITE(6,'(2F10.3)')ENGYCT
WRITE(6,*)'* AMASCT
'
WRITE(6,'(2F10.3)')AMASCT
WRITE(6,*)'* Singularity treatment '
if(icos3.eq.1) goto 10
WRITE(6,*)'* Q2'
IF
(IRESNS.EQ.-1) THEN
WRITE(6,*)'* 1/Q2 singularity '
ELSE IF(IRESNS.EQ. 0) THEN
WRITE(6,*)'* NO singularity '
ELSE IF(IRESNS.EQ. 1) THEN
WRITE(6,*)'* Narrow resonance '
WRITE(6,*)'* resonance mass and width'
WRITE(6,*) ARESNS
49
10
END IF
IF
(ICOS3.EQ.0) THEN
WRITE(6,*)'* NO mass-singularity '
ELSE
WRITE(6,*)'*
mass-singularity '
END IF
WRITE(6,*)'*'
* Following flux factor is for a particle-antiparticle collision
* at s/m**2 >> 1. For an e-gamma collision or low energy interactions
* you should use appropriate formulae.
VREL = 2
FLUX = VREL*S
FACT = GEVPB/FLUX
*----- BASES RELATED INITIALIZATIONS ----------------------------------*--- 2. Dimension of integration variables.
NDIM =
NWILD=
5
4
C----------------------------------------------------------------------*--- 3. Region of integration.
DO 1 I=1,NDIM
XL(I) = 0.D0
XU(I) = 1.D0
IG(I) = 1
1
CONTINUE
C----------------------------------------------------------------------*--- 4. Number of iterations
ITMX1 = 5
ITMX2 = 5
NCALL = 50000
*--- 5. Set MXREG : the maximum number of values which are returned
*
by FUNC for one phase space point
MXREG =
1
*--- 6. Set histograms
NX = 50
ND = 50
DO 100 I = 1, NDIM
WRITE(XSTR, 110) I
110
FORMAT('X(',I2,') SPECTRUM')
CALL XHINIT(I, XL(I), XU(I), NX, XSTR)
100 CONTINUE
CALL XHINIT(ndim+1, 0.d0, w, NX, 'Energy of Particle 3')
CALL XHINIT(ndim+2, 0.d0, w, NX, 'Energy of Particle 4')
50
CALL
CALL
CALL
CALL
XHINIT(ndim+3, 0.d0, w, NX, 'Energy of
XHINIT(ndim+4,-1.d0,1.d0, NX, 'cos_the
XHINIT(ndim+5,-1.d0,1.d0, NX, 'cos_the
XHINIT(ndim+6,-1.d0,1.d0, NX, 'cos_the
Particle 5')
of Particle 3')
of Particle 4')
of Particle 5')
RETURN
END
Source list 3.6
KINIT
for the process e+ e
0 ! W +W 0
:::::::::::::::::::::::::::::::::::::::::::::::::::::::::::::::::::::::::::::::::
51
3.3.3
Subroutine KINEM
In order to integrate the dierential cross section, BASES samples a point in the integration volume and calls the function subprogram FUNC, which calculates the numerical
value of integrand at the sampling point and returns it as the value of function. For
calculating the dierential cross section integration variables are to be translated into
four-momenta of external particles, which is done by the subprogram KINEM. Its program structure is as follows:
:::::::::::::::::::::::::::::::::::::::::::::::::::::::::::::::::::::::::::::::::
SUBROUTINE KINEM( NEXTRN, X, PE, PP, YACOB, NREG, IREG, JUMP )
IMPLICIT REAL*8
PARAMETER (MXDIM = 50)
INTEGER
NEXTRN,
NREG,
IREG,
JUMP
REAL*8
X(MXDIM), PE(4,NEXTRN), PP(NEXTRN,NEXTRN), YACOB
:::::::::::::::::::::::::::::::::::::::::::::::::::::::::::::::::::::::::::::::::
The meanings of the arguments are as follows;
NEXTRN input
Number of external particles
X
input Values of integration variables at the sampling point
PE
output Table of four momenta of external particles
PP
output Table of inner products of four momenta
YACOB output Normalization for converting the square of amplitude to the
cross section
NREG in/out Control ag in case of multi-valued kinematics. See 5) below.
IREG input
Control ag in case of multi-valued kinematics. See 5) below.
JUMP output Flag for the acceptance of the sampling point. For accepted
sampling, it returns 0. If the sampling point is out of kinematical boundary, JUMP is set to be a non zero integer value.
An example of KINEM for the process + 0 ! + 0 is shown in the source list
3.7. It is generated by KINEM 3002. The specication for writing KINEM is as follows:
e
1)
2)
e
W
W
Initialization
At the beginning of routine, variable JUMP is 0.
Calculation of four vectors of external particles
From the integration variables X(i), four vectors of external particles are derived
and are stored in the arrays PE(14,k), where PE(1,k), PE(2,k) and PE(3,k)
correspond to x y and z , respectively, and PE(4,k) is energy of the k-th
particle.
p ;p
p
E
52
3)
4)
Jump ag JUMP
During calculation of four vector, when the sampling point X(i) in the integration
volume is out of the kinematical boundary, then the jump ag JUMP should be
set equal to non-zero integer value. Otherwise, it must be kept zero.
Inner products of four momenta
The inner products, taking all combinations of the external four momenta, are
calculated and stored in the array PP(l,m), where the numbers l and m are
corresponding to the labels of momenta PE(14,l) and PE(14,m), respectively.
Namely,
PP(l; m)
5)
=
3
0
3
PE(4; l) PE(4; m) PE(1; l) PE(1; m)
PE(2; l) PE(2; m) PE(3; l) PE(3; m):
0
3
0
3
Control of multi-valued kinematics
When the kinematics is represented by a many valued function, namely, a sampling point in the integration volume corresponds to several points in the momentum phase space, the control is done by variables NREG and IREG. This is also
related to the function FUNC in section 3.5.3.
NREG is the multiplicity in the momentum space which corresponds to a point in
the integration volume. This value is set equal to one by FUNC for the rst call
at each sampling point.
IREG is a counter of calling KINEM at the same sampling point. Function FUNC
increments IREG for each call, and calls KINEM while IREG NREG.
In the subprogram FUNC, the variables NREG and IREG are set to \1" at the
beginning and subroutine KINEM is called.
The structure of KINEM for the multi-valued case is as follows:
SUBROUTINE KINEM(NEXTERN, XX, P, PP, YACOB, NREG, IREG, JUMP)
...
IF(IREG.EQ.1) THEN
NREG = (the number of multiplicity at the sampling point XX)
(Calculate four momenta P for the rst calculation)
(Calculate inner products of four momenta PP)
(Calculate Jacobian YACOB for the rst calculation)
...
ELSE IF(IREG.EQ.2) THEN
(Calculate four momenta P for the second calculation)
(Calculate inner products of four momenta PP)
(Calculate Jacobian YACOB for the rst calculation)
...
53
ELSE IF ...
...
ENDIF
RETURN
END
KINEM calculates the total number of multiplicity at the sampling point and store
it in NREG. If it is greater than \1", then the rst calculation of four momenta
is performed. From the second calculation, IREG is incremented with keeping
NREG unchanged and momenta are returned by calling KINEM. The same step is
repeated until IREG reaches NREG. The value of MXREG is dened in the subroutine
KINIT and is used to protect unexpected repeat. It is clear that NREG is the total
number of multiplicity at a sampling point given by KINEM and IREG plays the
role of counter which shows the number of KINEM calls.
In the example of 3.7 there is no such a structure, because the kinematics is
constructed by a single valued function.
6)
Notice
One should be careful not to loose the numerical accuracy by the cancellation
over many digits which may take place when the inner-product PP are calculated
from the four components of momenta. Use of invariants is recommended.
:::::::::::::::::::::::::::::::::::::::::::::::::::::::::::::::::::::::::::::::::
SUBROUTINE KINEM(NEXTRN,X,PE,PP,YACOB,NREG,IREG,JUMP)
C--------------------------------------------------------------------C GRACE System Library File
C KINEM No. : 3002
C Date
: 1994.04.30
C Author
: Y.Kurihara
C--------------------------------------------------------------------IMPLICIT REAL* 8(A-H,O-Z)
************************************************************************
INTEGER NEXTRN
PARAMETER ( MXDIM = 50 )
COMMON / BASE1 / XL(MXDIM),XU(MXDIM),NDIM
REAL*8 X(MXDIM)
REAL*8 PE(4,NEXTRN), PP(NEXTRN,NEXTRN)
REAL*8 YACOB
INTEGER NREG, IREG
INTEGER JUMP
INCLUDE "inclk.f"
*-------------------------------------------------------------------COMMON/KMCNTL/IRESNS,ICOS3
COMMON/KINEM1/S,W,FACT
COMMON/CUT001/COSCUT(2,3),ENGYCT(2,3),AMASCT(2),ARESNS(2)
54
DIMENSION PBSTCL(4)
* BETA FUNCTION
BETA(Z1,Z2)=SQRT(1-2*(Z1+Z2)+(Z1-Z2)**2)
*----------------------------------------------------------------------NREG = 1
JUMP = 0
YACOB =
0.D0
AJACOB=
1
* Set integration variables
************
* PHI3
*
************
IF(NDIM.EQ.5) THEN
PHI3=X(5)*2*PI
ELSE
PHI3=0
END IF
AJACOB = AJACOB*2*PI
if(icos3.eq.0)then
*************
* Q2
*
*************
Q2MIN=MAX((AMASS1(4)+AMASS1(5))**2 , AMASCT(1)**2)
Q2MAX=MIN(S+AMASS2(3)-2*W*ENGYCT(1,1), AMASCT(2)**2)
IF(Q2MIN.GE.Q2MAX) GOTO 999
IF
(IRESNS.EQ. 0) THEN
Q2 = Q2MIN+(Q2MAX-Q2MIN)*X(4)
AJACOB = AJACOB*(Q2MAX-Q2MIN)
ELSE IF(IRESNS.EQ.-1) THEN
Q2 = Q2MIN*(Q2MAX/Q2MIN)**X(4)
AJACOB = AJACOB*Q2*LOG(Q2MAX/Q2MIN)
ELSE IF(IRESNS.EQ. 1) THEN
AM
= ARESNS(1)
AM2 =AM*AM
AMG =ARESNS(1)*ARESNS(2)
THEMIN=ATAN((Q2MIN-AM2)/AMG)
THEMAX=ATAN((Q2MAX-AM2)/AMG)
THE =THEMIN+(THEMAX-THEMIN)*X(4)
Q2
=AMG*TAN(THE)+AM2
AJACOB=AJACOB*(THEMAX-THEMIN)
.*
((Q2-AM2)**2+AMG**2)/AMG
ELSE
GOTO 999
END IF
*************
* ENERGY3 *
*************
E3 = max(0.d0,(S+AMASS2(3)-Q2)/2.D0/W)
IF(E3.GT.ENGYCT(2,1)) GOTO 999
IF(E3.LT.ENGYCT(1,1)) GOTO 999
P3 = SQRT( (E3-AMASS1(3))*(E3+AMASS1(3)) )
else if(icos3.eq.1) then
55
*************
* ENERGY3 *
*************
e3min=MAX(AMASS1(3),ENGYCT(1,1)
. ,(S+AMASS2(3)-AMASCT(2)**2)/2.D0/W)
E3MAX=MIN(ENGYCT(2,1)
. ,(S+AMASS2(3)-(AMASS1(4)+AMASS1(5))**2)/2.D0/W
. ,(S+AMASS2(3)-AMASCT(1)**2)/2.D0/W)
E3=E3MIN*(E3MAX/E3MIN)**X(4)
AJACOB = AJACOB*E3*log(E3max/E3min)*2.D0*W
P3 = SQRT( (E3-AMASS1(3))*(E3+AMASS1(3)) )
*************
* Q2
*
*************
q2=s+amass2(3)-2*w*e3
ELSE
GOTO 999
end if
*************
* ENERGY1 *
*************
E1 = (S+AMASS2(1)-AMASS2(2))/2.D0/W
P1 = SQRT( (E1-AMASS1(1))*(E1+AMASS1(1)) )
*************
* ENERGY2 *
*************
E2 = (S+AMASS2(2)-AMASS2(1))/2.D0/W
*************
* C0S(the3) *
*************
IF
(ICOS3.EQ.0) THEN
COS3=COSCUT(1,1) + (COSCUT(2,1)-COSCUT(1,1))*X(3)
SIN3=SQRT( (1-COS3)*(1+COS3) )
D1 = 2.D0*(E1*E3-P1*P3*COS3)
D2 = 2.D0*(E2*E3+P1*P3*COS3)
AJACOB = AJACOB*(COSCUT(2,1)-COSCUT(1,1))
ELSE IF(ICOS3.EQ.1) THEN
XI = (E1+P1)/AMASS1(1)
ABDB = 1+AMASS2(1)/P1/(E1+P1)
TEMAX= (ABDB+COSCUT(2,1))/(ABDB-COSCUT(2,1))
TEMIN= (ABDB+COSCUT(1,1))/(ABDB-COSCUT(1,1))
YMAX = (LOG(TEMAX)/LOG(XI)+2)/4.D0
YMIN = (LOG(TEMIN)/LOG(XI)+2)/4.D0
if(coscut(1,1).lt.-1.d0+1.d-10)ymin=0
if(coscut(2,1).gt. 1.d0-1.d-10)ymax=1
Y
= YMIN+(YMAX-YMIN)*X(3)
AJACOB = AJACOB*(YMAX-YMIN)
TETA = XI**(4*Y-2)
COS3 = ABDB*(TETA-1)/(TETA+1)
c
IF(ABS(COS3).GT.1) COS3=SIGN(1.D0,COS3)
SIN3 = SQRT( (1-COS3)*(1+COS3) )
D1 = 4*E3*E1/(TETA+1)
56
D2 = TETA*D1
D13 = 4 *E1/(TETA+1)
D23 = TETA*D13
AJACOB = AJACOB*LOG(XI)/2.D0/E1/P1
.*
D13*D23
ELSE
GOTO 999
END IF
************************
* PHI4 in 4-5 CM frame *
************************
PHI4=X(2)*2*PI+PHI3
AJACOB = AJACOB*2*PI
************************
* COS4 in 4-5 CM frame *
************************
COS4=-1+2*X(1)
SIN4=SQRT( (1-COS4)*(1+COS4) )
AJACOB = AJACOB*2
* Set four-vectors
*Particle 1
PE(1,1) = 0
PE(2,1) = 0
PE(3,1) = P1
PE(4,1) = E1
*Particle 2
PE(1,2)
PE(2,2)
PE(3,2)
PE(4,2)
= 0
= 0
=-P1
= E2
*Particle 3
PE(1,3)
PE(2,3)
PE(3,3)
PE(4,3)
=
=
=
=
P3*SIN3*COS(PHI3)
P3*SIN3*SIN(PHI3)
P3*COS3
E3
*Particle 4 in 4-5 CM frame
E4
= (Q2+AMASS2(4)-AMASS2(5))/2.D0/SQRT(Q2)
P4
= SQRT( (E4-AMASS1(4))*(E4+AMASS1(4)) )
PE(1,4) = P4*SIN4*COS(PHI4)
PE(2,4) = P4*SIN4*SIN(PHI4)
PE(3,4) = P4*COS4
PE(4,4) = E4
*Particle 5 in 4-5 CM frame
E5
= (Q2+AMASS2(5)-AMASS2(4))/2.D0/SQRT(Q2)
PE(1,5) =-PE(1,4)
PE(2,5) =-PE(2,4)
57
PE(3,5) =-PE(3,4)
PE(4,5) = E5
* boost from 4-5 CM frame to 1-2 CM frame (Lab-frame)
PBSTCL(1)=-PE(1,3)
PBSTCL(2)=-PE(2,3)
PBSTCL(3)=-PE(3,3)
PBSTCL(4)= SQRT(P3*P3+Q2)
CALL WTOLAB(PE(1,4),PE(1,5),PBSTCL, PE(1,4),PE(1,5))
c
call pboost(pe(1,4),pbstcl, pe(1,4))
c
call pboost(pe(1,5),pbstcl, pe(1,5))
* cuts in Lab-frame
COS4LB=PE(3,4)/SQRT(PE(1,4)**2+PE(2,4)**2+PE(3,4)**2)
IF(COS4LB.LT.COSCUT(1,2) .OR. COS4LB.GT.COSCUT(2,2)) GOTO
COS5LB=PE(3,5)/SQRT(PE(1,5)**2+PE(2,5)**2+PE(3,5)**2)
IF(COS5LB.LT.COSCUT(1,3) .OR. COS5LB.GT.COSCUT(2,3)) GOTO
IF(PE(4,4).LT.ENGYCT(1,2).OR.PE(4,4).GT.ENGYCT(2,2)) GOTO
IF(PE(4,5).LT.ENGYCT(1,3).OR.PE(4,5).GT.ENGYCT(2,3)) GOTO
*Set invariants
PP(1,1) = AMASS2(1)
PP(1,2) = (S-AMASS2(1)-AMASS2(2))/2.D0
PP(1,3) = D1/2.D0
PP(1,4) = PE(4,1)*PE(4,4)-PE(1,1)*PE(1,4)
.
-PE(2,1)*PE(2,4)-PE(3,1)*PE(3,4)
PP(1,5) = PE(4,1)*PE(4,5)-PE(1,1)*PE(1,5)
.
-PE(2,1)*PE(2,5)-PE(3,1)*PE(3,5)
PP(2,1)
PP(2,2)
PP(2,3)
PP(2,4)
= PP(1,2)
= AMASS2(2)
= D2/2.D0
= PE(4,2)*PE(4,4)-PE(1,2)*PE(1,4)
.
-PE(2,2)*PE(2,4)-PE(3,2)*PE(3,4)
PP(2,5) = PE(4,2)*PE(4,5)-PE(1,2)*PE(1,5)
.
-PE(2,2)*PE(2,5)-PE(3,2)*PE(3,5)
PP(3,1)
PP(3,2)
PP(3,3)
PP(3,4)
= PP(1,3)
= PP(2,3)
= AMASS2(3)
= PE(4,3)*PE(4,4)-PE(1,3)*PE(1,4)
.
-PE(2,3)*PE(2,4)-PE(3,3)*PE(3,4)
PP(3,5) = PE(4,3)*PE(4,5)-PE(1,3)*PE(1,5)
.
-PE(2,3)*PE(2,5)-PE(3,3)*PE(3,5)
PP(4,1)
PP(4,2)
PP(4,3)
PP(4,4)
PP(4,5)
=
=
=
=
=
PP(1,4)
PP(2,4)
PP(3,4)
AMASS2(4)
(Q2-AMASS2(4)-AMASS2(5))/2.D0
PP(5,1) = PP(1,5)
PP(5,2) = PP(2,5)
58
999
999
999
999
PP(5,3) = PP(3,5)
PP(5,4) = PP(4,5)
PP(5,5) = AMASS2(5)
*Set jacobian
YACOB=FACT*AJACOB
./(2*PI)/(32*PI2)/(32*PI2)
.*BETA(Q2
/S ,AMASS2(3)/S )
.*BETA(AMASS2(4)/Q2,AMASS2(5)/Q2)
c
c
c
c
c
c
c
c
c
c
c
999
write(6,*)pe(4,1)+pe(4,2)
write(6,*)pe(4,3)+pe(4,4)+pe(4,5)
write(6,*)pe(1,3)+pe(1,4)+pe(1,5)
write(6,*)pe(2,3)+pe(2,4)+pe(2,5)
write(6,*)pe(3,3)+pe(3,4)+pe(3,5)
write(6,*)amass1
write(6,*)amass2
write(6,*)pbstcl
write(6,*)sqrt(pe(4,3)**2-pe(1,3)**2-pe(2,3)**2-pe(3,3))
write(6,*)sqrt(pe(4,4)**2-pe(1,4)**2-pe(2,4)**2-pe(3,4))
write(6,*)sqrt(pe(4,5)**2-pe(1,5)**2-pe(2,5)**2-pe(3,5))
RETURN
CONTINUE
JUMP=1
YACOB=0
RETURN
END
Source list 3.7 An example of
KINEM
:::::::::::::::::::::::::::::::::::::::::::::::::::::::::::::::::::::::::::::::::
59
3.4 Test of generated source code
The main program gauge.f to check gauge invariance at one point in the integration
volume is produced by GRACE.
After the execution, as shown in the output 3.1, the squared values of the amplitude
at a point in the phase space in dierent gauges, covariant gauge and unitary gauge are
shown, which is the output of the test program. The number of calculated Feynman
graphs is dierent in these gauges. The relative error is printed in the output. We
usually require about 14 digits agreement in double precision and about 32 digits in
quadruple precision 2 . In the output one can also see contribution of each graph to the
result. 3
:::::::::::::::::::::::::::::::::::::::::::::::::::::::::::::::::::::::::::::::::
GRACE
* 5120
Ver.
1.0
E+ E- => W+ W- A
W = 1000.00
EM =
RMN = .100E-02
.511E-03
TREE
IN GEV
(1) KINEMATICAL CUTS :
ETH =
CSMX =
CSMN =
80.0
1.000
-1.000
GEV
WHERE ETH = THRESHOLD ENERGY FOR Q20 AND Q10
CSMN AND CSMX ARE ANGLE CUT FOR CS AND CSQ
X
= .45 .45 .45 .45
JSELG = 1 1 1 1 1 1 1 1 1 1 1 1 1 1 1 1 1 1 1 1 1 1 1 1 1 1 1 1
IGAUAB = 0 AGAUGE = 1.000000000000000E+20
IGAUWB = 0 AGAUGE = 1.000000000000000E+20
IGAUZB = 0 AGAUGE = 1.000000000000000E+20
IGAUGL = 0 AGAUGE = 1.000000000000000E+20
ANS1
= 1.34979414428365
# GRAPHS = 18
X
= .45 .45 .45 .45
JSELG = 1 1 1 1 1 1 1 1 1 1 1 1 1 1 1 1 1 1 1 1 1 1 1 1 1 1 1 1
IGAUAB = 1 AGAUGE = 2.0
IGAUWB = 2 AGAUGE = 3.0
IGAUZB = 3 AGAUGE = 4.0
IGAUGL = 4 AGAUGE = 5.0
ANS2
= 1.34979414428364
# GRAPHS = 28
ANS1/ANS2 - 1 = 5.551115123125782E-15
INTEGRATED VALUE OF SQUARE OF EACH GRAPH
GRAPH
ABSOLUTE
RELATIVE
1 :
.23935707E-04
.17732857E-04
2 In quadruple precision, we have checked it on FACOM mainframe computer, Sun sparc workstation
and HITAC 3050 workstation
3 See also the footnote in 2.6 for this test and the width of particle.
60
2
3
4
5
6
7
8
9
10
11
12
13
14
15
16
17
18
19
20
21
22
23
24
25
26
27
28
TOTAL
:
:
:
:
:
:
:
:
:
:
:
:
:
:
:
:
:
:
:
:
:
:
:
:
:
:
:
:
.29254454E-04
.30405158E-10
.24923917E+02
.30462254E+02
.16871906E-06
.33536397E+02
.40988511E+02
.14039649E+01
.11486965E+01
.34248206E+02
.50292151E+03
.37723272E+03
.18116921E-07
.30004545E+02
.82173348E+02
.42105481E+01
.92509178E+03
.14010416E-11
.46106302E+03
.37723271E+03
.46034419E-09
.10452751E-13
.31070077E+02
.10159998E-13
.83905907E+02
.28065832E+01
.92394308E+03
.13497941E+01
.21673271E-04
.22525774E-10
.18464976E+02
.22568074E+02
.12499614E-06
.24845564E+02
.30366490E+02
.10401326E+01
.85101606E+00
.25372910E+02
.37259127E+03
.27947426E+03
.13421988E-07
.22228978E+02
.60878430E+02
.31194002E+01
.68535767E+03
.10379669E-11
.34158025E+03
.27947426E+03
.34104770E-09
.77439594E-14
.23018382E+02
.75270725E-14
.62162002E+02
.20792676E+01
.68450666E+03
Output 3.1 Result from the gauge invariance check
:::::::::::::::::::::::::::::::::::::::::::::::::::::::::::::::::::::::::::::::::
61
3.5 Numerical integration
The GRACE system generates a set of FORTRAN subprograms, MAINBS, USERIN, and
FUNC, which are necessary for the Monte Carlo integration program package BASES.
4
In this section a description of the integration program package BASES and these
subprograms generated by GRACE are given in the following order:
(1) Program structure of BASES
Relation among BASES and those subprograms generated by GRACE is described
in section 3.5.1.
(2) Initialization subprogram USERIN in section 3.5.2.
(3) Function program of integrand FUNC in section 3.5.3.
(4) Histogram package in 3.5.4.
(5) Output from BASES in 3.5.5.
3.5.1
Program structure of BASES
In Fig.3.2 is shown the structure of program BASES. Among them, MAINBS, KINIT,
and KFILL generated by GRACE might need modication by user.
KINEM
Program ow
The main program MAINBS controls the program ow of integration as follows:
(A) Initialization In subprogram BSINIT, the parameters to control BASES are
set to the default values. After that, in the subprogram KINIT called by
USERIN, they are initialized to those dened by the user. If some fundamental parameters, like number of dimensions of integral, are not set in KINIT,
the program will terminate.
An example of KINIT is already given in section 3.3, and details is given in
section 3.5.2.
(B) The grid optimization and integration steps
(1) For each hypercube, trial points are sampled in the following way;
(a) Sample a small region in the hypercube and sample a point in the
small region for each variable.
(b) Call function subprogram FUNC to calculate the dierential cross
section at the sampled point.
and the estimate and variance of the integral are calculated.
N
4 Here and in the followings, the names
USERIN and/or FUNC sometimes refer to the group of modules
called from them.
62
(2) Sums of the estimates and variances over all hypercubes are taken to
calculate the estimate and error of the integral.
(3) If the integration converges, then go to step (C).
(4) If the integration does not yet converge, then;
For the grid optimization step,
call the subprogram BSGDEF to adjust each width of grids and then
go to step (B.1).
For the integration step,
go to step (B.1).
(C) Termination of task
Print out the result.
Main program MAINBS
If the user wants to calculate the cross section for a set of parameters, i.e., for a
set of energies, one can do it by modifying MAINBS. To do this, one introduces a
loop in MAINBS and denes the parameter in the KINIT for each loop iteration.
Such a parameter dependent on the loop would be transferred through a common
block coded by the user.
A binary le bases.data is created by invoking integ which saves the probability
information as the output to the unit 23. This le bases.data is used in the
event generation stage. It should be noted that the parameter le stores the last
results if one has introduced loop control in MAINBS.
In the program MAINBS, the name of function program should be given by an
external statement and subprogram BSMAIN is called, which is a steering routine
of the integration. If the name of function program diers from FUNC, it should
be declared with the real name and substituted as the rst argument at the call
of subroutine BASES.
The results of integration and the produced histograms are stored in le
bases.result by calling BSINFO and BHPLOT.
Subroutine BASES
The subroutine BASES called in MAINBS executes the Monte-Carlo integration. It
is called as follows:
:::::::::::::::::::::::::::::::::::::::::::::::::::::::::::::::::::::::::::
CALL BASES( FUNC, ESTIM, SIGMA, CTIME, IT1, IT2 )
:::::::::::::::::::::::::::::::::::::::::::::::::::::::::::::::::::::::::::
63
The meaning of arguments is shown below. If the user wants to make summary
table of the results and so on, one edits MAINBS by referring these arguments.
FUNC input
The name of a function program.
ESTIM output A cumulative estimate of the integral.
ERROR output The standard deviation of the estimate of the
integral.
CTIME output The computing time used by the integration step
in seconds.
IT1
output The number of iterations made in the grid optimization step.
IT2
output The number of iterations made in the integration
step.
3.5.2
Initialization subprogram KINIT
At the beginning of the integration job, the subroutine KINIT is called by USERIN to
initialize the parameters both for the integration and calculating the integrand.
A sample of KINIT is shown in list 3.6 in the last section.
(1)
(2)
Initialization of kinematics
The denition of center-of-mass energy, the values of cuto, and so on are given
here. Also, some variables which are to be referred in KINEM would be computed
here (and are to be transferred to KINEM by common areas), since it can avoid
the same computation at every calling of FUNC.
Initialization of the integration parameters
The parameters for integration are summarized in the commons /BPARM1/ and
/BPARM2/, where all real variables are to be given by the double precision. Below,
we present these common areas and the meaning of variables in the common areas.
:::::::::::::::::::::::::::::::::::::::::::::::::::::::::::::::::::::::::::
PARAMETER ( MXDIM = 50 )
COMMON /BPARM1/ XL(MXDIM), XU(MXDIM), NDIM ,NWILD, IG(MXDIM), NCALL
:::::::::::::::::::::::::::::::::::::::::::::::::::::::::::::::::::::::::::
64
The lower bound of -th variable.
The upper bound of -th variable.
The dimension of the integral.
The number of wild variables ( at least one and at
most 15 ).
IG(i) (i = 1, NDIM) The ag for the grid optimization. If IG( ) = 1(0),
the grid for the -th variable is (not) optimized.
If the integrand is approximately constant for a
variable, it may give better convergence than varying widths to set the grid uniform for this variable.
The default ag is \1" (optimization).
NCALL
The number of sampling points per iteration.
The number of real sampling points diers from a given number NCALL, which is
automatically determined by the following algorithm. It is noticed that the order
of variables XU( ), XL( ) and IG( ) ( = 1 , NDIM), should start with the wild
variables.
XL(i) (i = 1, NDIM)
XU(i) (i = 1, NDIM)
NDIM
NWILD
i
i
i
i
(given)
Ncall
Nwild
1
2
3
4
5
6
7
8
9
10
(given)
Ncall
Nwild
1
2
3
4
5
6
7
8
9
10
i
i
=
1,000
Ns
Ncube
25
22
7
4
3
2
2
2
1
1
=
25
484
343
256
243
64
128
256
1
1
10,000
25
25
17
8
5
4
3
2
2
2
25
625
4,913
4,096
3,125
4,096
2,187
256
512
1,024
Ns
Ncube
i
Ng
50
44
49
48
48
50
50
50
50
50
Ng
50
50
34
48
50
48
48
50
50
50
i
(real)
Ncall
1,000
968
686
768
972
960
896
768
1,000
1,000
(given)
Ncall
Nwild
Ns
(given)
Ncall
Nwild
Ns
1
2
3
4
5
6
7
8
9
10
(real)
Ncall
10,000
10,000
9,826
9,182
9,375
8,192
8,448
9,984
9,728
9,216
1
2
3
4
5
6
7
8
9
10
The number of subregions per variable
which satises the two inequalities:
N
=
5,000
Ncube
Ng
(real)
Ncall
Ncube
Ng
(real)
Ncall
25
25
13
7
4
3
3
2
2
2
=
25
625
2,197
2,401
1,024
729
2,187
256
512
1024
20,000
25
25
21
10
6
4
3
3
2
2
25
625
9,261
10,000
7,776
4,096
2,187
6,561
512
1,024
50
50
39
49
48
48
48
50
50
50
50
50
42
50
48
48
48
48
50
50
5,000
5,000
4,394
4,802
4,096
4,374
4,374
4,864
4,608
4,096
20,000
20,000
18,522
20,000
15,552
16,384
19,693
19,683
19,968
19,456
s is determined by the maximum number
= ( 2call ) 25 and sN
32768
The number of hypercubes is given by cube = sN , then the number of
sampling points per hypercube is trial = call cube . Since the number trial
(real)
is an integer, the calculated number call
= trial 2 cube may dier from the
(given)
given number call .
s
N
N
1
Nwild
wild <
N
N
N
N
N
N
N
65
wild
=N
N
:
N
N
(real)
The table gives the numbers of real sampling points call
depending on the
(given)
given numbers of sampling points call and the numbers of wild variables
wild .
N
N
N
::::::::::::::::::::::::::::::::::::::::::::::::::::::::::::::::::
COMMON /BPARM2/ ACC1, ACC2, ITMX1, ITMX2
::::::::::::::::::::::::::::::::::::::::::::::::::::::::::::::::::
ACC1
ACC2
ITMX1
ITMX2
(3)
The accuracy (%) for the grid optimization step (default
0.2 %).
The accuracy (%) for the integration step (default 0.05 %).
The maximum iteration number of the grid optimization step
( default 15).
The maximum iteration number of the integration step (default 100).
Initialization of Histograms and Scatter plots
To make a histogram and a scatter plot, XHINIT and/or DHINIT are to be called
for the initialization. The meaning of arguments and details will be given in
section 3.5.4.
Normally, in the code generated automatically, the initialization of histograms is
done for each X( ) distribution, i distribution and cos i distribution where i
is the energy of nal -th particle and cos i is the nal -th particle's angle with
respect to the beam axis.
E
i
3.5.3
E
i
Function program of the integrand
The function program calculates the value of integrand at the sampling point fed by
BASES.
A set of numerical values of the integration variables at a sampling point is passed
through the argument of function program. A typical structure of the function program
is given in the source list 3.8 where the dimension of integration is ve.
1) Calculate the kinematical variables, by which the dierential cross section is
described, from the integration variables, X( ) for = 1, NDIM. This is done in
KINEM.
2) If, in the last step, a sampling point is found to be outside of the kinematical
boundary, set the value of function equal to zero and return.
3) If the point is inside the kinematical boundary, calculate the numerical value of
the dierential cross section and set the value of function equal to the calculated
value.
i
66
i
4) If a histogram or a scatter plot is required, call subprogram XHFILL or subprogram
DHFILL once. This is done in KFILL.
5) If the kinematics is multi-valued with respect to the input values of X( ), special
care is required for the communication between FUNC and KINEM. See an example
below.
i
::::::::::::::::::::::::::::::::::::::::::::::::::::::::::::::::::::::
DOUBLE PRECISION FUNCTION FUNC(X)
DOUBLE PRECISION X(5)
FUNC = 0.0
... Calculation of the kinematics ...
IF( the point is outside the kinematical boundary ) RETURN
FUNC = is calculated from X(i) for i = 1, 5.
CALL XHFILL( ID, V, FUNC )
CALL DHFILL( ID, VX, VY, FUNC)
RETURN
END
Source list 3.8 Typical structure of
FUNC
::::::::::::::::::::::::::::::::::::::::::::::::::::::::::::::::::::::
An example of FUNC for the process + 0 ! + 0 is given in the source list 3.9.
The interaction with KINEM is also described in section 3.3.3. The structure of this
example is as follows:
1) The array X stores the values of integration variables. Another array XX keeps its
values.
2) Total number of external particles NEXTRN and XX are transferred to subprogram
KINEM. The tables of momenta P and inner-products of them PP, and normalization factor YACOB are received from KINEM.
3) P and PP are copied to the common variables PExxxx and PPROD, respectively,
and they are used in the amplitude calculation.
4) Subprogram AMPTBL calculates the amplitudes and makes the tables of them.
5) Summation over the spin states by calling the subprogram AMPSUM.
e
e
W
67
W
6) Fill the histograms and scatter pots by calling KFILL in which the subprograms
XHFILL and DHFILL are called.
7) The variable JUMP
If the sampling point is out of the kinematical boundary, JUMP is set to a non
zero integer in KINEM. For this case, the amplitude computation is skipped.
8) The variables NREG and IREG
When the kinematics contains a multi-valued function, i.e. one sampling point
in the integration volume corresponds to several points in the phase space, the
variables NREG and IREG take the control as is described in section 3.3.3.
:::::::::::::::::::::::::::::::::::::::::::::::::::::::::::::::::::::::::::::::::
* FILE "func.f" is generated by GRACE System (Minami-Tateya Group)
* Grace Version
1. 1
1994-Aug-19
************************************************************************
FUNCTION FUNC(X)
IMPLICIT REAL*8(A-H,O-Z)
REAL*8
FUNC
PARAMETER ( MXDIM = 50 )
COMMON / LOOP0 / LOOP
COMMON / BASE1 / XL(MXDIM),XU(MXDIM),NDIM,NWILD,
&
IG(MXDIM),NCALL
COMMON / BASE2 / ACC1,ACC2,ITMX1,ITMX2
COMMON / BASE3 / SI,SI2,SWGT,SCHI,SCALLS,ATACC,NSU,IT,WGT
REAL*8
X(MXDIM)
INCLUDE 'incl1.f'
INCLUDE 'inclk.f'
COMMON /AMSPIN/JHS(NEXTRN), JHE(NEXTRN), ASPIN
REAL*8
ANS0, ANS
* P : Table of four momenta
* PP : Table of inner products
REAL*8
XX(MXDIM),P(4,NEXTRN),PP(NEXTRN,NEXTRN)
COMMON /SP4VEC/ VEC(4,NEXTRN)
*=======================================================================
*
Initialization
*=======================================================================
ANSUM = 0.0D0
DO 5 I = 1, NDIM
XX(I) = X(I)
5 CONTINUE
68
NREG = 1
DFT = 0.D0
*=======================================================================
*
Kinematics
*=======================================================================
DO 1000 IREG = 1 , MXREG
IF( IREG .GT. NREG ) GO TO 1000
CALL KINEM(NEXTRN, XX, P, PP, YACOB,NREG,IREG,JUMP)
*----------------------------------------------------------------------*
Reset the temporal buffer for the region 1
*----------------------------------------------------------------------IF( IREG .EQ. 1 ) THEN
DFT = 0.D0
DO 180 K = 1, NEXTRN
DO 180 J = 1, 4
VEC(J,K) = 0.D0
180
CONTINUE
ENDIF
IF( JUMP .NE. 0 ) GO TO 1000
*----------------------------------------------------------------------*
For user's cut
*----------------------------------------------------------------------C
C
CALL USRCUT(JUMP)
IF( JUMP .NE. 0 ) GOTO 1000
*----------------------------------------------------------------------*
Four momenta of external particles
*----------------------------------------------------------------------*
*
*
*
*
DO 20 I = 1, 4
1: EL- INITIAL
PE0001(I) = P(I, 1)
2: EL+ INITIAL
PE0002(I) = P(I, 2)
3: AB
FINAL
PE0003(I) = P(I, 3)
4: WB+ FINAL
PE0004(I) = P(I, 4)
5: WB- FINAL
PE0005(I) = P(I, 5)
20 CONTINUE
LPRTCL
MASS=AMEL
LANTIP
MASS=AMEL
LPRTCL MASS=AMAB
LPRTCL MASS=AMWB
LANTIP MASS=AMWB
*----------------------------------------------------------------------*
Inner products of momenta of external particles
*-----------------------------------------------------------------------
69
DO 30 J = 1, NEXTRN
DO 30 I = 1, NEXTRN
PPROD(I, J) = PP(I, J)
30 CONTINUE
*=======================================================================
*
Amplitude calculation
*=======================================================================
*
=============
CALL AMPTBL
*
=============
*
===================
CALL AMPSUM(ANS0)
*
===================
FKNORM = YACOB*ASPIN
ANS
= ANS0*FKNORM
ANSUM = ANSUM + ANS
*----------------------------------------------------------------------CALL KFILL(NEXTRN, NDIM, X, P, PP, ANS)
*----------------------------------------------------------------------*
Save four momenta and probabilities of the region 1
*----------------------------------------------------------------------IF( IREG .EQ. 1 ) THEN
DFT = ANS
DO 420 K = 1, NEXTRN
DO 420 J = 1, 4
VEC(J,K) = P(J,K)
420
CONTINUE
ENDIF
*=======================================================================
*
Update summary table
*=======================================================================
60
ANSP(0) = ANSP(0) + WGT*ANS
DO 60 IGR = 1, JGRAPH
ANSP(IGR)=ANSP(IGR) + WGT*YACOB*ASPIN*ANCP(IGR)
CONTINUE
NKCALL = NKCALL + 1
IF(NKCALL.GT.10000) THEN
NKCALL = NKCALL - 10000
FKCALL = FKCALL + 10000
ENDIF
1000 CONTINUE
FUNC = ANSUM
70
*----------------------------------------------------------------------*
Put the final 4 vectors into the arrays VEC()
*----------------------------------------------------------------------*
IF( FUNC .GT. 0.D0 ) THEN
*
IF( DFT/FUNC .LT. DRN(DUM)) THEN
*
DO 850 K = 1, NEXTRN
*
DO 850 J = 1, 4
*
VEC(J,K) = P(J,K)
* 850
CONTINUE
*
ENDIF
*
ENDIF
RETURN
END
Source list 3.9 An example of
FUNC
:::::::::::::::::::::::::::::::::::::::::::::::::::::::::::::::::::::::::::::::::
3.5.4
Histogram package
The program package BASES/SPRING has its own histogram package, whose characteristics are as follows;
1) To initialize the histograms and scatter plots, the following routines are to be
called in KINIT.
CALL XHINIT( ID#,
.
lower_limit, upper_limit, # of bins, ' Title '),
and
CALL DHINIT( ID#,
.
x_lower_limit, x_upper_limit, # of x bins,
.
y_lower_limit, y_upper_limit, # of y bins,
.
' Title '),
respectively.
The ID and bin numbers are to be given by an integer value, and the lower and
upper limits are to be given by the double precision values. The maximum bin
number both for histograms and scatter plots is 50, which is dened by the paper
size. When too many histograms or scatter plots are initialized, the rst NHIST-1
histograms and NSCAT scatter plots are initialized and the others are neglected.
2) To ll the histograms or the scatter plots on a scalar computer the following
lling routines are called in the function KFILL which is called from FUNC:
71
CALL XHFILL( ID#, V, FUNC )
CALL DHFILL( ID#, VX, VY, FUNC)
for each histogram
for each scatter plot
3) The outputs of histograms and scatter plots can display even a negative function
as well as the positive denite function.
4) In GRACE the histograms are written on les bases.result and spring.result.
3.5.5
Output from BASES
The outputs consist of the following items.
1) Parameters for BASES
After returning from USERIN, the parameters given there are printed out, some of
which are numbers of the integration variables,
the wild variable and the sampling
(given)
points per iteration, dim, wild and call
. From these numbers, the number
of the small-regions per variable g , that of the sub-regions per variable s,
(real)
that of real sampling points per iteration call
, and that of hypercubes cube
are calculated and printed. Further, for each integration variable, the lower and
upper limits, XL(i) and XU(i), the grid optimization ag IG(i), and the kind of
variable (i.e. wild or not ) are printed. And nally the maximum iteration number
and the expected accuracy both for the grid optimization and the integration
steps are printed. An example of this output is given in the output 3.2.
N
N
N
N
N
N
N
:::::::::::::::::::::::::::::::::::::::::::::::::::::::::::::::::::::::::::
Date: 94/ 8/19 20:43
**********************************************************
*
*
*
BBBBBBB
AAAA
SSSSSS
EEEEEE
SSSSSS
*
*
BB
BB
AA AA
SS
SS EE
SS
SS
*
*
BB
BB AA
AA SS
EE
SS
*
*
BBBBBBB AAAAAAAA
SSSSSS
EEEEEE
SSSSSS
*
*
BB
BB AA
AA
SS EE
SS
*
*
BB
BB AA
AA SS
SS EE
SS
SS
*
*
BBBB BB
AA
AA
SSSSSS
EEEEEE SSSSSS
*
*
*
*
BASES Version 5.1
*
*
coded by S.Kawabata KEK, March 1994
*
**********************************************************
<<
Parameters for BASES
>>
(1) Dimensions of integration etc.
# of dimensions :
Ndim
=
# of Wilds
:
Nwild
=
# of sample points : Ncall
=
# of subregions
: Ng
=
# of regions
: Nregion =
# of Hypercubes
: Ncube
=
72
5
( 50 at max.)
4
( 15 at max.)
41472(real)
50000(given)
48 / variable
12 / variable
20736
(2) About the integration variables
------+---------------+---------------+-------+------i
XL(i)
XU(i)
IG(i)
Wild
------+---------------+---------------+-------+------1
.000000E+00
1.000000E+00
1
yes
2
.000000E+00
1.000000E+00
1
yes
3
.000000E+00
1.000000E+00
1
yes
4
.000000E+00
1.000000E+00
1
yes
5
.000000E+00
1.000000E+00
1
no
------+---------------+---------------+-------+------(3) Parameters for the grid optimization step
Max.# of iterations: ITMX1 =
5
Expected accuracy : Acc1 =
.2000 %
(4) Parameters for the integration step
Max.# of iterations: ITMX2 =
5
Expected accuracy : Acc2 =
.0100 %
Output 3.2 General information of the integration
2)
:::::::::::::::::::::::::::::::::::::::::::::::::::::::::::::::::::::::::::
Convergency behavior
issues some messages when the convergence is not well established.
However the logic to check the convergence is rather simple and the message
might not be always precise. More information can be obtained by reading the
output carefully when the print ag is set to issue details of integration steps.
According to the print ag the two kinds of convergency behaviors can be obtained, one is for the grid optimization step and another is for the integration
step. The print format consists of the result of each iteration and the cumulative
result and the computing time used.
In the result of each iteration, the sampling eciency ( the percentage of the
points inside of the kinematical boundary ), the ratio of the numbers of the
negative valued sampling points to the total number of sampling points in unit
of percent, the estimate of integral of the iteration and the estimated accuracy
in unit of percent are shown.
In the cumulative result, the cumulative estimates of integral and error are listed
up in addition to the accuracy in the unit of percent. The computing time in this
table is measured from the beginning of the grid optimization step till the end of
the current iteration, which does not contain the time of overhead but that used
for estimating integral.
In the convergency behavior for the grid optimization step, it should be checked
that the accuracy for each iteration does decrease iteration by iteration and converge to a stable value. If not the case, it is recommended to increase the number
of sampling points call and try again. When the increment of number of sampling points does not help to improve the behavior, the current choice of the
BASES
N
73
integration variables may not be suitable for the behavior of integrand. Examples of convergency behavior both for the grid optimization and integration steps
are given in the outputs 3.3 and 3.4, respectively.
:::::::::::::::::::::::::::::::::::::::::::::::::::::::::::::::::::::::::::
Date: 94/ 8/19 20:43
Convergency Behavior for the Grid Optimization Step
-----------------------------------------------------------------------------<- Result of each iteration -> <Cumulative Result
-> < CPU time >
IT Eff R_Neg
Estimate Acc % Estimate(+- Error )order Acc % ( H: M: Sec )
-----------------------------------------------------------------------------1 100
.00 4.203E+00 5.516 4.203258(+- .231843)E 00 5.516
0: 3:53.85
2 100
.00 3.907E+00 2.289 3.944922(+- .083419)E 00 2.115
0: 7:45.87
3 100
.00 3.966E+00 1.583 3.958399(+- .050164)E 00 1.267
0:11:39.86
4 100
.00 3.944E+00
.966 3.949475(+- .030344)E 00
.768
0:15:30.03
5 100
.00 4.014E+00 1.369 3.964637(+- .026563)E 00
.670
0:19:23.40
-----------------------------------------------------------------------------Output 3.3 Convergency behavior for the grid optimization step
:::::::::::::::::::::::::::::::::::::::::::::::::::::::::::::::::::::::::::
:::::::::::::::::::::::::::::::::::::::::::::::::::::::::::::::::::::::::::
Date: 94/ 8/19 20:43
Convergency Behavior for the Integration Step
-----------------------------------------------------------------------------<- Result of each iteration -> <Cumulative Result
-> < CPU time >
IT Eff R_Neg
Estimate Acc % Estimate(+- Error )order Acc % ( H: M: Sec )
-----------------------------------------------------------------------------1 100
.00 3.933E+00
.910 3.933202(+- .035802)E 00
.910
0:23:15.67
2 100
.00 3.978E+00 1.435 3.945768(+- .030331)E 00
.769
0:27: 7.03
3 100
.00 3.953E+00
.845 3.948889(+- .022452)E 00
.569
0:31: 0.03
4 100
.00 3.928E+00
.926 3.943177(+- .019106)E 00
.485
0:34:51.83
5 100
.00 3.942E+00
.849 3.942924(+- .016594)E 00
.421
0:38:42.65
-----------------------------------------------------------------------------Output 3.4 Convergency behavior for the integration step
:::::::::::::::::::::::::::::::::::::::::::::::::::::::::::::::::::::::::::
The accuracy of each iteration must be stable in the integration step. When the
integration variables does not suit for the integrand, it uctuates iteration by
iteration and may jump suddenly to a big value in the worst case.
In the interactive mode the convergency behavior is printed iteration by iteration,
while it is printed only for the nal 50 iterations in the batch mode. This mode
is to be selected at the installation time by setting the ag \INTV" in the routine
BSMAIN.
74
3)
Histograms and scatter plots
If histograms and scatter plots are initialized in KINIT and lled in KFILL, their
results are printed at each end of the grid optimization step and the integration
step according to the print ag. In the output 3.5 we show only the histogram
ID = 3 for saving the space of this manual.
The rst and the last bins of histogram represent values of the underow and the
overow bins, respectively. The rst column shows the lower edge value of each
histogram bin. The second column represents the estimated dierential value and
error after the characters \+-", both of which are to be multiplied by a factor
\E xx" shown as order. On the right hand side of these columns a histogram
of the dierential values is drawn both in the linear scale with \*" and in the
logarithmic scale with \O". If negative values exist in some bins only the linear
scale histogram is shown.
The scatter plot represents only the relative height of the function. The height
of the function value is described by ten characters; 1, 2, 3, ..., 8, 9 and *, while
the depth ( for the negative values ) is displayed by ten characters; a, b, c, d, ...,
h, i and #. The point which has a negative value but larger than the value of the
level \a" is indicated by \-". On the other hand, the point describing a positive
value but less than the level \1" is given either by \+" (if a negative value exists
somewhere) or by \." (if only the positive values exist). In the output 3.6 an
example of scatter plot is shown.
75
:::::::::::::::::::::::::::::::::::::::::::::::::::::::::::::::::::::::::::
Histogram (ID = 3 ) for X( 3) SPECTRUM
Linear Scale indicated by "*"
x
d(Sigma)/dx
0.0E+00
8.3E+00
1.7E+01
2.5E+01
+-------+------------------+------------+------------+-----------+-----------+
I E 0 I .000
E 0I
I
I .000 I 2.595+- .051 E 1I****************************************OOOOOOOOOI
I .020 I 8.402+- .279 E 0I*************OOOOOOOOOOOOOOOOOOOOOOOOOO
I
I .040 I 5.954+- .265 E 0I**********OOOOOOOOOOOOOOOOOOOOOOOOOO
I
I .060 I 4.817+- .229 E 0I********OOOOOOOOOOOOOOOOOOOOOOOOOO
I
I .080 I 3.415+- .171 E 0I******OOOOOOOOOOOOOOOOOOOOOOOOO
I
I .100 I 3.698+- .167 E 0I******OOOOOOOOOOOOOOOOOOOOOOOOOO
I
I .120 I 3.053+- .148 E 0I*****OOOOOOOOOOOOOOOOOOOOOOOOO
I
I .140 I 2.898+- .154 E 0I*****OOOOOOOOOOOOOOOOOOOOOOOOO
I
I .160 I 2.443+- .160 E 0I****OOOOOOOOOOOOOOOOOOOOOOOO
I
I .180 I 2.917+- .155 E 0I*****OOOOOOOOOOOOOOOOOOOOOOOOO
I
I .200 I 2.183+- .134 E 0I****OOOOOOOOOOOOOOOOOOOOOOO
I
I .220 I 1.874+- .127 E 0I***OOOOOOOOOOOOOOOOOOOOOOO
I
I .240 I 2.161+- .129 E 0I****OOOOOOOOOOOOOOOOOOOOOOO
I
I .260 I 1.924+- .123 E 0I***OOOOOOOOOOOOOOOOOOOOOOO
I
I .280 I 1.589+- .110 E 0I***OOOOOOOOOOOOOOOOOOOOOO
I
I .300 I 1.543+- .100 E 0I***OOOOOOOOOOOOOOOOOOOOO
I
I .320 I 1.387+- .107 E 0I***OOOOOOOOOOOOOOOOOOOO
I
I .340 I 1.316+- .086 E 0I**OOOOOOOOOOOOOOOOOOOOO
I
I .360 I 1.239+- .091 E 0I**OOOOOOOOOOOOOOOOOOOO
I
I .380 I 1.282+- .091 E 0I**OOOOOOOOOOOOOOOOOOOOO
I
I .400 I 1.021+- .069 E 0I**OOOOOOOOOOOOOOOOOOO
I
I .420 I 9.757+- .814 E -1I**OOOOOOOOOOOOOOOOOO
I
I .440 I 9.046+- .458 E -1I**OOOOOOOOOOOOOOOOOO
I
I .460 I 8.947+- .466 E -1I**OOOOOOOOOOOOOOOOOO
I
I .480 I 9.287+- .679 E -1I**OOOOOOOOOOOOOOOOOO
I
I .500 I 8.258+- .790 E -1I**OOOOOOOOOOOOOOOOO
I
I .520 I 9.083+- .589 E -1I**OOOOOOOOOOOOOOOOOO
I
I .540 I 9.549+- .668 E -1I**OOOOOOOOOOOOOOOOOO
I
I .560 I 9.718+- .739 E -1I**OOOOOOOOOOOOOOOOOO
I
I .580 I 9.076+- .840 E -1I**OOOOOOOOOOOOOOOOOO
I
I .600 I 1.193+- .088 E 0I**OOOOOOOOOOOOOOOOOOOO
I
I .620 I 1.401+- .093 E 0I***OOOOOOOOOOOOOOOOOOOO
I
I .640 I 1.428+- .119 E 0I***OOOOOOOOOOOOOOOOOOOOO
I
I .660 I 1.097+- .101 E 0I**OOOOOOOOOOOOOOOOOOO
I
I .680 I 1.947+- .123 E 0I***OOOOOOOOOOOOOOOOOOOOOOO
I
I .700 I 1.979+- .126 E 0I***OOOOOOOOOOOOOOOOOOOOOOO
I
I .720 I 2.099+- .122 E 0I****OOOOOOOOOOOOOOOOOOOOOOO
I
I .740 I 2.214+- .138 E 0I****OOOOOOOOOOOOOOOOOOOOOOO
I
I .760 I 1.784+- .125 E 0I***OOOOOOOOOOOOOOOOOOOOOOO
I
I .780 I 2.376+- .141 E 0I****OOOOOOOOOOOOOOOOOOOOOOOO
I
I .800 I 2.483+- .144 E 0I****OOOOOOOOOOOOOOOOOOOOOOOO
I
I .820 I 2.566+- .149 E 0I****OOOOOOOOOOOOOOOOOOOOOOOOO
I
I .840 I 2.883+- .152 E 0I*****OOOOOOOOOOOOOOOOOOOOOOOOO
I
I .860 I 2.803+- .150 E 0I*****OOOOOOOOOOOOOOOOOOOOOOOO
I
I .880 I 3.448+- .175 E 0I******OOOOOOOOOOOOOOOOOOOOOOOOO
I
I .900 I 3.906+- .176 E 0I******OOOOOOOOOOOOOOOOOOOOOOOOOO
I
I .920 I 4.146+- .196 E 0I*******OOOOOOOOOOOOOOOOOOOOOOOOOO
I
I .940 I 5.760+- .247 E 0I*********OOOOOOOOOOOOOOOOOOOOOOOOOOO
I
I .960 I 8.741+- .291 E 0I**************OOOOOOOOOOOOOOOOOOOOOOOOO
I
I .980 I 2.612+- .052 E 1I****************************************OOOOOOOOOI
I E 0 I .000
E 0I
I
+-------+------------------+-------------------+-------------------+---------+
x
d(Sigma)/dx
1.0E-01
1.0E+00
1.0E+01
Logarithmic Scale indicated by "O"
Output 3.5 An example of histogram
:::::::::::::::::::::::::::::::::::::::::::::::::::::::::::::::::::::::::::
76
:::::::::::::::::::::::::::::::::::::::::::::::::::::::::::::::::::::::::::
Scat_Plot (ID = 6 ) for X( 3)-X( 4) DISTRIBUTION
E 0
+--------------------------------------------------+
.980
I8212.1............... .. . ........1.1.....1..1137I
.960
I8332..1111.1.......... ....................11.114*I
.940
I832................... . .. .............1.1.212*I
.920
I821.11.1...................................1.1.13*I
.900
I722111.1.....1................... ........11.11236I
.880
I821..1.............. ...................1.....1118I
.860
I7111.........1.......... ..............1..1.1.1236I
.840
I821.11.1.1..1............ ...... .1....1.....11227I
.820
I831.11.1.....1......... ...... ....1.....1.1...117I
.800
I821211....11..... .......1 ....1.......111...1.227I
.780
I421.1.1..1...... ...............1. .....11.111.128I
.760
I711....111..1..........1..1...........1....1111124I
.740
I421.1.1..1............. ...........1........111116I
.720
I5212.1...11............. ..... ......1..........16I
.700
I811..211.............. .. ....... ...1.......11117I
.680
I5211.11.............................1.....1.....26I
.660
I8111..........1....... ... .....1......1..1.1..137I
.640
I41...1..1..................... .....1...1..1111216I
.620
I72.1.1............ ..........................11127I
.600
I7221.1.1...1....... ...... .. .. ...........1.1137I
.580
I7211.1.........1....... .. .........1.....1.111.15I
.560
I52...11.1........ ......................1....1.136I
.540
I52111........11..... ...... ..........1...1....116I
.520
I5112.....1......1.. ...... ..... .............1224I
.500 Y I5221....1.....1.. .......................11.1.1138I
.480
I72...1............... . . ....... .......1....1125I
.460
I5.21.11.....1...1......................1.......126I
.440
I611......1....... ..................11........2.17I
.420
I7111.11.11..............................1......126I
.400
I622...... .....1........
. .................1125I
.380
I73..1.11............ . . .... .........1....111114I
.360
I51111....1.......1.... . .........1......1..1.1.18I
.340
I8211..1... 1............ ...........1........21118I
.320
I4211.....1.......... .. ....... ........1.1111..26I
.300
I52111.11.......1........ . . .......1... ....1.227I
.280
I611..1...1...11..1........ .... ...1...1..1.111127I
.260
I8111.................................... 1...1.215I
.240
I62.1.1....1.... ..... ... . ..............1..1.234I
.220
I9111.12............. .....................1..11115I
.200
I63.111..1......... ... ...........11....1..1...128I
.180
I6211..1..1................... ...........1.1.1128I
.160
I512..1......1........1......... .....1.11...1.127I
.140
I8221.....1......1........1.... .........1..1.21217I
.120
I83111..1.1..1...........1... .1........1121.11139I
.100
I7122..11..... ........... ... . .....1...1...12127I
.080
I821.1....1.............
.....................237I
.060
I72121111.....1.......... .............1......11147I
.040
I93311111.1............... ... .....1..1...1.11.11*I
.020
I9211..1.......1.... .....................1.12.1238I
.000
I8232...1.1..1.......................1...1...1..327I
E 0
+--------------------------------------------------+
LowX
Edge
00000000000000000000000000000000000000000000000000
E 0
..................................................
00000011111222223333344445555556666777777888899999
Low01367923579245791457914580135791358014579235801367
Edge
09909909999009999099990900999999990090999099009909
Output 3.6 An example of scatter plot
77
5)
:::::::::::::::::::::::::::::::::::::::::::::::::::::::::::::::::::::::::::
List of computing time
As well as the message, a list of computing time is printed at the end of the job
as shown in a output 3.7.
When the integration has been achieved by a single job, the items (1) and (2)
are exactly the same. If the integration is performed by several jobs, the computing time is only for the current job, while that for total calculation includes
all computing time from the beginning. The expected event generation time is
printed at the item (3). From this value, the computing time limit for the event
generation will be evaluated.
:::::::::::::::::::::::::::::::::::::::::::::::::::::::::::::::::::::::::::
<<
Computing Time Information
(1) For BASES
Overhead
Grid Optim. Step
Integration Step
Go time for all
>>
:
:
:
:
H: M: Sec
0: 0: 0.05
0:19:23.40
0:19:19.25
0:38:42.71
(2) Expected event generation time
Expected time for 1000 events :
7.99 Sec
Output 3.7 Computing time information
6)
7)
:::::::::::::::::::::::::::::::::::::::::::::::::::::::::::::::::::::::::::
Final result of integration
The results of integration can be read from the output shown in the list 3.4. Since
the value of the integral and its error are given by the arguments of BASES, when
the user needs some formatted output for the results, one can make it by editing
MAINBS. For the reference to the arguments of BASES, one can nd information
in section 3.5.1.
Probability information
Before terminating the integration job, BASES generates a data le by the routine
BSWRIT, where
1) Probability information
Probability of each hypercube, according to which a hypercube is sampled
in the event generation.
2) The maximum values of integrand
The maximum value of integrand in each hypercube is stored, by which the
sampling point are tested by using a uniform random number.
78
3) Contents of histograms
In the event generation, those histograms are printed out comparing to
the distribution of generated events which are dened in the integration by
BASES. For this purpose, the contents of histograms taken in the BASES are
stored in this le.
Although there are several versions of BASES/SPRING, e.g. the original BASES
/SPRING, BASES25/SPRING25, and BASES50/SPRING50, the data format of this
le does depend on the version. The newest one is BASES50/SPRING50 and is
recommended to use. We call BASES50/SPRING50 as BASES/SPRING throughout
this manual. Be careful not to use the dierent versions for BASES and SPRING.
79
3.6 Event generation
An advantage of BASES/SPRING packages is that if a dierential cross section is integrated by BASES the four vectors of nal state particles are easily generated with
weight one by using SPRING. (See section 2.8 in Ref.[8].) In this section, a description
of SPRING is given in the following order.
(1) Input for SPRING
(2) Program structure of SPRING
(3) Specications of the subprograms to be prepared
(4) Output from SPRING
The event generation by SPRING is normally quite fast. But if calculation of the integrand requires much computing time, both the integration and the event generation
takes much time. For such a case we recommend to use a vector computer if available.
A vector version of SPRING will be described in Ref.[8].
3.6.1
Input for SPRING
There are two inputs for SPRING. One is a le of the probability information for each
hypercube, which is produced by the integration package BASES. In this le the following
data are saved:
(a) The probability of sampling each hypercube.
(b) The maximum value of integrand in each hypercube.
(c) The contents of histograms and scatter plots.
(d) The control data for BASES.
SPRING with a dierent version from that of BASES should not be used for the event
generation, since the data format of this le does depend on the version as mentioned
in the previous section. The most new one is BASES50/SPRING50 and is recommended
to use.
At the beginning of the generation job, the following parameters are read from the
logical unit 5:
(1) The number of events to be generated, which is stored in the variable MXEVNT.
The event generation loop is terminated not only by the generation of given numbers
of events, but also by too many failure of the generation.
80
3.6.2
Program structure of SPRING
In Fig.3.2, the program structure of SPRING is shown, where the subprograms in
the solid box are generated by GRACE automatically. Others are included in the
BASES/SPRING library or CHANEL library.
The parameter MXTRY denes the maximum number of trials for getting an accepted
event, which makes the event generation free from an innite loop described later in
this subsection.
The program ow in MAINSP is as follows;
(A) Initialization
(1) The subprogram BSINIT is called.
(2) By the subroutine BSREAD the probability information of all hypercubes and
the contents of histograms and scatter plots are read from a binary le.
(3) USERIN is called for initialization of histograms etc. and kinematics.
(4) The probability distribution read from the le is changed into the cumulative
distribution.
(B) Event generation loop
The loop is controlled by variables MXTRY and MXEVNT.
(1) A hypercube ( say the i-th hypercube) is sampled according to its probability
by a random number generated by a function DRN.
(2) A point is sampled in a small region in the i-th hypercube, sampled in the
step (B.1).
(3) The value of the integrand at the sampled point is calculated by calling
FUNC.
(4) If the sampled point satises the condition
()
( i) ] (= a uniform random number)
[
()
( i)
then this point is accepted as an event, and go out of the event generation
loop.
(5) If the sampled point is not accepted and the number of trials to get an event
is less than the given value of MXTRY, the histogram information for the point
is cleared by the subroutine SHCLER and go to the step (B.2).
(6) If the number of trials is larger than the given value, this hypercube is
abandoned, and go to the step (B.1).
(C) Record and analysis of generated events
When a point is accepted as an event, the user is responsible for the record and/or
f p =M ax:
f x
p x
< 81
;
the analysis of the generated events. If the four vectors of generated events are
going to be written on a le, the le should be opened and closed by the user
in MAINSP before and after the loop of event generation. It is recommended to
record the event inside the loop of generation. Just after the call of SPRING one
can access the four vectors of the event by referring the common area /SP4VEC/
which is lled in FUNC (List 3.8).
::::::::::::::::::::::::::::::::::::::::::::::::::::::::::::::::::
COMMON /SP4VEC/ VEC(4,NEXTRN)
This common area is explicitly given in MAINSP. Here, the variable VEC(i,j)
stores j-th particle's four vector where i= 1 2 3 4 correspond to x y z ,
respectively. The ordering of j is the same in the input le supplied at the graph
generation and it includes both initial and nal particles.
(D) Check the number of events
Increment the number of generated event and test the remaining computing time.
If the number of events is less than the given number or there remains enough
computing time for generating one event, go to the step (B.1).
(E) Termination
Before terminating the job, histograms and scatter plots are printed by SHPLOT.
As described in the step (B.5), the parameter MXTRY plays an important role. Without limiting the maximum number of trials to get an event, the generation loop may
come into an innite loop. This parameter is set in the main program MAINSP and
default number is equal to 50.
::::::::::::::::::::::::::::::::::::::::::::::::::::::::::::::::::
;
3.6.3
;
;
p ;p ;p ;E
Subprograms to be prepared
GRACE automatically generates main programs and subprograms for the integration by
BASES though a part of them might need modication by the user. These subprograms
are also necessary for the event generation by SPRING except for MAINBS. As their
specications can be found in subsections 3.5.1, 3.5.2 and 3.5.3. we will not repeat them
here unless there exist dierence between their specications in BASES and SPRING.
No change
Subprograms USERIN, KINIT and KINEM, used in BASES step, does not need to
be modied. Especially the subprogram USERIN should be identical to that used
in BASES.
82
MAINSP
Main program MAINSP is produced by GRACE in a complete form. The user sometimes needs to edit it for the record of events, denition of output le, or the
change of parameters MXTRY and/or MXEVNT. The user might touch it when the
name of parameter le created by BASES diers from the default.
FUNC
When the integrand is a single-valued function, it should not be changed. But if
it is a two-valued function, the last part of the function code must be activate,
which part is normally commented out just after the source generation by GRACE.
The example of this case is shown in the source list 3.14.
When the kinematics is described by a many-valued function, a sample point in
the integration volume corresponds to several distinct points in the phase space,
for each of which dierential cross section is calculated. In the integration the
values of dierential cross section at these points are simply summed and the
sum is given as the function value FUNC, while in the event generation a point
among these points must be sampled according to their probabilities.
The example in the source list 3.14 and 3.12 shows the two-valued function case.
For the rst point the four vectors and numerical value of the dierential cross
section are stored in an arrays VEC(j, k) and variable DFT at the do loop 420 in
the list 3.12. If the ratio of DFT and FUNC is less than a random number, the
second point in the phase space is taken as a sampled point, where FUNC is the
sum of the dierential cross section values at these two points. This method can
be easily extended to a many-valued function case.
::::::::::::::::::::::::::::::::::::::::::::::::::::::::::::::::::
1000 CONTINUE
FUNC = ANSUM
*-----------------------------------------------------------*
Put the final 4 vectors into the arrays VEC()
*-----------------------------------------------------------IF( FUNC .GT. 0.D0 ) THEN
IF( DFT/FUNC .LT. DRN(DUM)) THEN
DO 850 K = 1, NEXTRN
DO 850 J = 1, 4
VEC(J,K) = P(J,K)
850
CONTINUE
ENDIF
ENDIF
RETURN
END
Source list 3.10 The last part of
83
FUNC
3.6.4
::::::::::::::::::::::::::::::::::::::::::::::::::::::::::::::::::
Output from SPRING
The output from SPRING consists of the general information, histogram output, the
number of trials distribution and the four vector output. There are two kinds of
histogram output, one is the original histogram and other is the additional histogram.
General information
After generating events, the following information is printed:
:::::::::::::::::::::::::::::::::::::::::::::::::::::::::::::::::::::::::::
Date: 94/ 8/19 21:43
**********************************************************
*
*
*
SSSSS
PPPPPP
RRRRRR
IIIII N
NN GGGGG
*
*
SS
SS PP
PP RR
RR
III NN
NN GG
GG
*
*
SS
PP
PP RR
RR
III
NNN NN GG
*
*
SSSSS
PPPPPP
RRRRR
III
NNNN NN GG GGGG *
*
SS PP
RR RR
III
NN NNNN GG
GG
*
*
SS
SS PP
RR
RR
III
NN NNN GG
GG
*
*
SSSSS
PP
RR
RR IIIII NN
NN
GGGGG
*
*
*
*
SPRING Version 5.1
*
*
coded by S.Kawabata KEK, March 1994
*
**********************************************************
Number of generated events
Generation efficiency
Computing time for generation
for Overhead
for Others
GO time for event generation
Max. number of trials MXTRY
Number of miss-generation
=
=
=
=
=
=
=
=
10000
28.144
202.360
.340
.090
202.790
50
95
Percent
Seconds
Seconds
Seconds
Seconds
per event
times
Output 3.9 General information of the event generation
:::::::::::::::::::::::::::::::::::::::::::::::::::::::::::::::::::::::::::
When the number of trials to generate one event exceeds the number MXTRY,
this outbreak is counted as the number of mis-generation. If this number is
not negligible small, something happens in the event generation, e.g. mis-match
between the integrand and the probability information of the input le, or the
grids determined by BASES are not enough optimized. This can be also checked
by the number of trials distribution described later.
Histograms
There are two kinds of histograms.
84
One is the original histogram, which is dened in the integration stage by BASES.
The contents of these histograms produced in the integration are read from the
input le and are compared with the frequency distribution taken in the event
generation. This comparison is done in the logarithmic scale, where the statistical
error of each bin is represented by \< >". If error is smaller than the two character
space, only the frequency is shown by \O". The histogram obtained by BASES is
represented by \*". An example of the original histogram is shown in the output
3.10, which can be compared with the histogram shown in the output 3.5 of
section 3.5.5.
Another is to report the trial number distribution of SPRING shown is output
3.11.
Number of trials distribution
The number of trials distribution is printed out at the nal stage, by which we
can see how ecient the event generation was. The rst column represents the
number of trials to obtain one event and the number of events is shown in the
third column. An example for the process + 0 ! + 0 is shown in the
output 3.12, where about 80% of events are generated with the rst trial. If
this distribution has a long tail, this means generation eciency is low, then the
following points should be tested:
e
e
W
W
(1) The grids determined by BASES is not optimized well. If this is the case, try
integration again with more sampling points ( by setting NCALL larger than
the current number ).
(2) The integrand does not match for the probability distribution in the input
le. Check whether the subprograms USERIN and FUNC are exactly identical
to those used in the integration.
(3) The integration could not give a good answer due to unsuitable integration
variables for the integrand. In this case, improvement of the kinematics is
required.
85
:::::::::::::::::::::::::::::::::::::::::::::::::::::::::::::::::::::::::::::::::
Original Histogram (ID = 1 ) for X( 1) SPECTRUM
Total =
10000 events
"*" : Orig. Dist. in Log Scale.
x
d(Sig/dx) dN/dx 1.0E-01
1.0E+00
1.0E+01
+-------+----------+-------+----------------+----------------+---------------+
I E 0 I .000E 0I
0I
I
I .000 I 5.967E 1I
3116I**********************************************O I
I .020 I 9.278E 0I
495I********************************<>
I
I .040 I 5.512E 0I
284I****************************<>
I
I .060 I 3.640E 0I
178I*************************<>
I
I .080 I 2.779E 0I
137I***********************<>
I
I .100 I 2.201E 0I
132I**********************<O>
I
I .120 I 1.989E 0I
98I********************<O>
I
I .140 I 1.461E 0I
69I*****************<O>
I
I .160 I 1.293E 0I
56I****************<O>
I
I .180 I 1.147E 0I
58I****************<O>
I
I .200 I 1.039E 0I
46I**************<O>
I
I .220 I 9.586E -1I
50I***************<O>
I
I .240 I 7.552E -1I
33I************<O>
I
I .260 I 8.063E -1I
33I************<O>*
I
I .280 I 7.528E -1I
43I**************<O>
I
I .300 I 6.514E -1I
37I*************<O>
I
I .320 I 7.198E -1I
33I************<O>
I
I .340 I 6.336E -1I
27I**********<*O>
I
I .360 I 5.355E -1I
36I************< O>
I
I .380 I 4.975E -1I
21I********<*O>
I
I .400 I 5.382E -1I
23I*********<O*>
I
I .420 I 4.678E -1I
23I*********<O*>
I
I .440 I 5.533E -1I
25I*********<*O>
I
I .460 I 5.703E -1I
29I***********<O>
I
I .480 I 5.827E -1I
29I***********<O>
I
I .500 I 5.571E -1I
26I**********<O*>
I
I .520 I 5.209E -1I
30I***********<O >
I
I .540 I 9.908E -1I
34I************<O>**
I
I .560 I 5.112E -1I
23I*********<O*>
I
I .580 I 5.276E -1I
31I***********<*O>
I
I .600 I 4.570E -1I
30I***********<O >
I
I .620 I 6.059E -1I
32I***********<*O>
I
I .640 I 5.438E -1I
24I*********<*O>
I
I .660 I 5.402E -1I
29I***********<O>
I
I .680 I 6.301E -1I
44I**************<O>
I
I .700 I 8.053E -1I
25I*********<*O>***
I
I .720 I 6.336E -1I
26I**********<O*>
I
I .740 I 8.339E -1I
33I************<O>*
I
I .760 I 9.425E -1I
40I*************<O*>
I
I .780 I 9.959E -1I
43I**************<O>
I
I .800 I 1.144E 0I
66I*****************<O>
I
I .820 I 1.454E 0I
59I****************<O>*
I
I .840 I 1.528E 0I
78I******************<O>
I
I .860 I 1.966E 0I
82I*******************<>*
I
I .880 I 2.564E 0I
125I**********************<>
I
I .900 I 2.735E 0I
152I************************<>
I
I .920 I 3.601E 0I
168I************************<>
I
I .940 I 5.259E 0I
279I****************************<>
I
I .960 I 9.247E 0I
470I********************************<>
I
I .980 I 5.871E 1I
2940I*********************************************<> I
I E 0 I .000E 0I
0I
I
+-------+----------+-------+----------------+----------------+---------------+
x
d(Sig/dx) dN/dx
"O" : Generated Events.( Arbitrary unit in Log )
Output 3.10 An example of the original histogram
:::::::::::::::::::::::::::::::::::::::::::::::::::::::::::::::::::::::::::::::::
86
:::::::::::::::::::::::::::::::::::::::::::::::::::::::::::::::::::::::::::::::::
************* Number of trials to get an event *************
Total =
10095 events
"*" : No. of events in Linear scale.
x
Lg(dN/dx) dN/dx .0E+00
1.5E+03
3.0E+03
4.5E+03
+-------+----------+-------+------------+------------+-----------+-----------+
I .100 I 4.668E 3I
4668I***************************************OOOOOOO
I
I .200 I 2.174E 3I
2174I*******************OOOOOOOOOOOOOOOOOOOOOOO
I
I .300 I 1.131E 3I
1131I**********OOOOOOOOOOOOOOOOOOOOOOOOOOOOO
I
I .400 I 6.180E 2I
618I******OOOOOOOOOOOOOOOOOOOOOOOOOOOOO
I
I .500 I 3.180E 2I
318I***OOOOOOOOOOOOOOOOOOOOOOOOOOOOO
I
I .600 I 2.220E 2I
222I**OOOOOOOOOOOOOOOOOOOOOOOOOOOO
I
I .700 I 1.580E 2I
158I**OOOOOOOOOOOOOOOOOOOOOOOOOO
I
I .800 I 9.100E 1I
91I*OOOOOOOOOOOOOOOOOOOOOOOO
I
I .900 I 9.200E 1I
92I*OOOOOOOOOOOOOOOOOOOOOOOO
I
I 1.000 I 7.000E 1I
70I*OOOOOOOOOOOOOOOOOOOOOOO
I
I 1.100 I 4.800E 1I
48I*OOOOOOOOOOOOOOOOOOOOO
I
I 1.200 I 4.400E 1I
44I*OOOOOOOOOOOOOOOOOOOO
I
I 1.300 I 3.500E 1I
35I*OOOOOOOOOOOOOOOOOOO
I
I 1.400 I 2.500E 1I
25I*OOOOOOOOOOOOOOOOO
I
I 1.500 I 3.100E 1I
31I*OOOOOOOOOOOOOOOOOO
I
I 1.600 I 1.900E 1I
19I*OOOOOOOOOOOOOOO
I
I 1.700 I 1.900E 1I
19I*OOOOOOOOOOOOOOO
I
I 1.800 I 2.000E 1I
20I*OOOOOOOOOOOOOOOO
I
I 1.900 I 2.300E 1I
23I*OOOOOOOOOOOOOOOOO
I
I 2.000 I 1.100E 1I
11I*OOOOOOOOOOOOO
I
I 2.100 I 1.700E 1I
17I*OOOOOOOOOOOOOOO
I
I 2.200 I 1.300E 1I
13I*OOOOOOOOOOOOO
I
I 2.300 I 1.400E 1I
14I*OOOOOOOOOOOOOO
I
I 2.400 I 1.300E 1I
13I*OOOOOOOOOOOOO
I
I 2.500 I 9.000E 0I
9I*OOOOOOOOOOO
I
I 2.600 I 6.000E 0I
6I*OOOOOOOOO
I
I 2.700 I 7.000E 0I
7I*OOOOOOOOOO
I
I 2.800 I 1.100E 1I
11I*OOOOOOOOOOOOO
I
I 2.900 I 8.000E 0I
8I*OOOOOOOOOOO
I
I 3.000 I 4.000E 0I
4I*OOOOOOO
I
I 3.100 I 9.000E 0I
9I*OOOOOOOOOOO
I
I 3.200 I 2.000E 0I
2I*OOO
I
I 3.300 I 4.000E 0I
4I*OOOOOOO
I
I 3.400 I 1.200E 1I
12I*OOOOOOOOOOOOO
I
I 3.500 I 6.000E 0I
6I*OOOOOOOOO
I
I 3.600 I 3.000E 0I
3I*OOOOO
I
I 3.700 I 4.000E 0I
4I*OOOOOOO
I
I 3.800 I 3.000E 0I
3I*OOOOO
I
I 3.900 I 2.000E 0I
2I*OOO
I
I 4.000 I 5.000E 0I
5I*OOOOOOOO
I
I 4.100 I 5.000E 0I
5I*OOOOOOOO
I
I 4.200 I 1.000E 0I
1IO
I
I 4.300 I 2.000E 0I
2I*OOO
I
I 4.400 I 4.000E 0I
4I*OOOOOOO
I
I 4.500 I 7.000E 0I
7I*OOOOOOOOOO
I
I 4.600 I 4.000E 0I
4I*OOOOOOO
I
I 4.700 I 2.000E 0I
2I*OOO
I
I 4.800 I .000E 0I
0I
I
I 4.900 I 4.000E 0I
4I*OOOOOOO
I
I 5.000 I 2.000E 0I
2I*OOO
I
I E 1 I 9.500E 1I
95I*OOOOOOOOOOOOOOOOOOOOOOOO
I
+-------+----------+-------+------------+-----------+------------+-----------+
x
Lg(dN/dx) dN/dx 1.0E+00
1.0E+01
1.0E+02
1.0E+03
"O" : No. of Events in Log. scale.
Output 3.11 The number of trials distribution
:::::::::::::::::::::::::::::::::::::::::::::::::::::::::::::::::::::::::::::::::
87
Appendix A
Kinematics
Below is the list of built-in kinematics in the system. This will includes more candidates
in the future. The name of section shows the code number of the kinematics.
Normally, if one uses built-in kinematics, the cross section is given in unit of pb.
88
code number
contents
2001
2-body ! 2 body in CM frame
No -channel singularity.
2002
2-body ! 2 body in CM frame
With -channel singularity. (forward peak)
2003
2-body ! 2 body in CM frame
With -channel singularity. (forward-backward peak)
3001
2-body ! 3 body in CM frame ,
Sequential decay type 1 + 2 ! 3 + (4 + 5) ! 3 + 4 + 5.
Simple phase space.
3002
2-body ! 3 body in CM frame ,
Sequential decay type 1 + 2 ! 3 + (4 + 5) ! 3 + 4 + 5.
Particle-3 is a radiative photon from initial particles.
3003
2-body ! 3 body in CM frame ,
Sequential decay type 1 + 2 ! 3 + (4 + 5) ! 3 + 4 + 5.
Particle 4 and 5 make a resonance.
3004
2-body ! 3 body in CM frame ,
Sequential decay type 1 + 2 ! 3 + (4 + 5) ! 3 + 4 + 5.
Invariant mass of 4 and 5 behaves 1 2 .
3005
2-body ! 3 body in CM frame ,
Particle 5 is produced at central by 'fusion'.
1!3+ 2!4+
+ ! 5.
3006
2-body ! 3 body in CM frame ,
Radiative processes 1 + 2 ! 3( ) + 4 + 5,
both initial and nal radiation can be treated.
3007
2-body ! 3 body in CM frame ,
Double-radiative processes 1 + 2 ! 3( ) + 4( ) + 5
3008
2-body ! 3 body in CM frame ,
Three phton processes 1 + 2 ! 3( ) + 4( ) + 5( )
3009
2-body ! 3 body in CM frame ,
General purpos kinematics.
It can be used for almost all processes except radiative one.
4001
2-body ! 4 body in CM frame, a pair of sequential
decay type 1 + 2 ! (3 + 4) + (5 + 6) ! 3 + 4 + 5 + 6
No -channel singularity.
4002
2-body ! 4 body in CM frame, a pair of sequential
decay type 1 + 2 ! (3 + 4) + (5 + 6) ! 3 + 4 + 5 + 6
With -channel singularity.
4003
2-body ! 4 body in CM frame,
`fusion' type 1 + 2 ! (3 + ) + (4 + ); + ! 5 + 6
4004
2-body ! 4 body in CM frame,
General purpos kinematics.
For the 4-vector notation, we use ( x y z ) ordering. Generally, the kinematics
t
t
t
=M
A;
B;
A
B
t
t
A
p ;p ;p ;E
89
B
A
B
assumes
+ 2 ! 3 + 4 + 1 1 1 (2 0 body scattering)
(decay of a particle)
1 ! 2 + 3 + 4 + 111
and so on. Here the assignment of particles keeps the order of particles in the input
data at the stage of graph generation.
The Lorentz invariant phase space for nal -body ( ! 1 + 2 + 3 + 1 1 1 + ) is
dened by
n !Y
n
3
X
X
1 0
j
4
(4)
~0n = (2 )
0
3
(2 )3n04 n
out
out (2 ) 2 j
in
p1
p
p
p
p
p
p
;
p
;
n
d
p
d
0n =
(4)
A
d p
p
X
in
p
n
0
E
n d3 p
n !Y
X
j
out
p
The chain relation for the phase space is useful(0
2
out
d
j
:
E
< k < n
0 1):
2
0n( ! 1+2+3+1 1 1) = 0k+1( ! 1+1 1 1+ + ) 2 0n0k ( ! ( +1)+( +2)+1 1 1)
where 2 = 2 .
When b and c are in the center-of-mass system and a = b + c ,i.e., a = 0, we
use the following notations
d
A
d
q
A
k
dQ
q
d
q
k
Q
p
p
p
02 = 0CM( ; ) =
d
d
a bc
(4)
p
3
d
a bc
a bc
d
p
~
p
~
3
( a 0 b 0 c) 2 b 2
b
p
p
p
d p
a bc
a bc
c
Ec
d p
E
and write it by angular variables:
0CM( ; ) = ( 8; ) CM( ; ) = ( 8; ) cos
Here
(; ) = 2
a bc
k
d
b;(bc)db;(bc)
P
a
E
q
= 1 ( a+
a
E
E
m
b + mc )(Ea
0
m
b
0 c )( a +
m
E
b
m
0 c)( a 0
m
E
m
b + mc )
and the sux ( ) denotes that the angles b b are dened in the center-of-mass
system. Angles in the laboratory frame have no sux.
bc
;
A.1 2001
Kinematics 2002 and 2003 is variation of this one and the user can also consult them
in the following sections.
90
Description of the kinematics
This is the simple kinematics for 2 to 2 process in the center-of mass system. Integration
variables are naturally the polar angle and azimuthal angle with respect to the
incoming particles.
If there is no strong peak to some directions, e.g., to the forward direction, this
works well. Also user can introduce forward and backward angle cuto as options.
We use the frame where incoming particles collide along -axis, so that the momenta
of initial particles are assigned as follows:
Particle-1 (0 0 + 1 )
Particle-2 (0 0 0 2 )
where is the positive value determined by 1 2 . The angles and represent
the direction of particle-3. Here, relative velocity rel is assumed to be 2 for the collision
highly relativistic particles. If colliding particles are slow, the user needs modication
in kinit.f.
Phase space is in the center-of-mass system and it is given by
(12; 34) cos
0~ 2 = (21 )2 0CM(12; 34) = 8(2
)2
z
P
;
;
P; E
;
;
P; E
m ;m ;W
v
d
d
d
d:
Meaning of X() for BASES integration
X(1)
X(2)
cos = 2X(1) 0 1
= 2 X(2)
Options in kinit.f
Default value is shown in parenthesis.
1. Physical parameter section
W R*8 (200.0) : Center of mass energy.
COSCUT(1) R*8 (-1.0) : Minimum of cos .
COSCUT(2) R*8 (+1.0) : Maximum of cos .
2. Physics control section
NDIM I*4 (2) : If you want to suppress -integration, replace the denition
of NDIM by the following:
NDIM = 1
Then is xed to 0.0.
3. BASES control section
91
ITMX1 I*4 (5) : These three values control BASES integration.
of BASES for details.
See document
I*4 (5) :
NCALL I*4 (5000) :
NX I*4 (50) : Value NX control the histograms.
ITMX2
A.2 2002
This is the kinematics similar to 2001 and only the dierence is quoted here.
Description of the kinematics
In this kinematics, with ag ICOST=+1, the cross section is assumed to have 1
singularity, where = ( 1 0 3)2. New integration variable is introduced as
= 0 + 21
= 2( 1 3 0 3 cos ) 0 23
The variable is transformed into
= 2 3 cos
= (log )
Then the phase space in 2001 is replaced by
t
p
p
D
t
m ;
E E
PP
dD
PP d
dD=D
d
d
cos = 2
= 2
D
P P3
D
P P3
where =
D
D
min (Dmax =Dmin)
for 0
m :
;
D :
(log )
d
D ;
log(
< <
D
max =Dmin)d
1.
Meaning of X() for BASES integration
X(1)
Momentum transfer in -channel, = 0( 1 0 3)2 + 21.
= min ( max min )X(1)
the same as in 2001.
t
D
X(2)
D
D
=D
Options in kinit.f
Physics control section
ICOST I*4 (1) : Treatment of cos .
92
D
p
p
m
=t
A.3 2003
This is the kinematics similar to 2001 and only the dierence is quoted here.
Description of the kinematics
In this kinematics, with ag ICOST=-1, the cross section is assumed to have 1 and
1 singularity, where = ( 1 0 3)2 and = ( 1 0 4)2 . New integration variable
, D, is introduced as the same as 2002, but cos is symmetrized around 90.
=t
=u
t
p
p
u
p
p
Meaning of X() for BASES integration
X(1)
Momentum transfer in -channel, = 0( 1 0 3)2 + 21 .
= min( max min )X (1), D is symmetrized around X(1)=0.5.
the same as in 2001.
t
D
X(2)
D
D
D
p
p
m
=D
Options in kinit.f
Physics control section
ICOST I*4 (1) : Treatment of cos .
A.4 3001
Kinematics 3002, 3003, 3004, and 3009 are variation of this one and the user can also
consult them in the following sections.
Description of the kinematics
This is the kinematics for 2 to 3 process in the center-of mass system. Here the nal
state rst splits into particle-3 and the system of particles 4 and 5. After that the
latter decays into particle-4 and particle-5.
1 + 2 0! 3 +
0! 4 + 5
Integration variables are the polar angle and azimuthal angle for the rst split,
those angles for the second split, and the invariant mass of particles 4 and 5. Angles
for the rst split are dened with respect to the incoming particles and those for the
second split are dened in the center-of-mass system of particles 4 and 5 with respect
to the momentum direction of the system.
If there is a mass singularity for the two of particles in the nal state, it is recommended to assign the two particles to particles 4 and 5. Also user can introduce cuto
for angles and minimum energies as options.
q
93
q
For the 4-vector notation, we use ( x y z ) ordering. We use the frame where
incoming particles collide along -axis, so that the momenta of initial particles are
assigned as follows:
Particle-1 (0 0 + 1 )
Particle-2 (0 0 0 2 )
where is the positive value determined by 1 2 . Here, relative velocity rel is
assumed to be 2 for the collision highly relativistic particles. If colliding particles are
slow, the user needs modication in kinit.f.
The angles 3 and 3 represent the direction of particle-3. Invariant mass of 4 and
5, 2 is another variable.
2
= ( 4 + 5 )2
In the center of mass system of particles 4 and 5, angles 4;(45) and 4;(45) represent the
direction of particle-4. The system of particles 4 and 5 are boosted backward to the
momentum direction of particle-3.
Phase space is in the center-of-mass system and it is given by
0~ 3 = 21 02 (1 + 2 ! 3 + ) 2 02 ( ! 4 + 5)
= (12;832 (2) )(5 ; 45) cos 3 3 2 cos 4;(45) 4;(45)
Here there is no singular behavior, and IRESN=0 and ICOS3=0 are assumed.
p ;p ;p ;E
z
;
;
P; E
;
;
P; E
P
m ;m ;W
v
Q
Q
p
p
d
d
q dQ d
q q
d
q
d dQ d
Meaning of X() for BASES integration
X(1)
X(2)
X(3)
X(4)
d
:
cos 4;(45) = 2X(1) 0 1
Polar angle in the CM system of particles 4 and 5.
4;(45) = 2 X(2)
Azimuthal angle in the CM system of particles 4 and 5.
cos 3 = 2X(3) 0 1
Polar angle of particle-3
Invariant mass of particles 4 and 5, 2 .
Normal. 2 = 2min + ( 2max 0 2min )X(4)
3 = 2 X(5)
Azimuthal angle of particle-3
Q
Q
X(5)
Q
Q
Options in kinit.f
Default value is shown in parenthesis.
1. Physical parameter section
94
Q
R*8 (200.0) : Center of mass energy.
COSCUT(1,1) R*8 (-1.0) : Minimum of cos 3 .
COSCUT(2,1) R*8 (+1.0) : Maximum of cos 3 .
COSCUT(1,2) R*8 (-1.0) : Minimum of cos 4 . Here, 4 is the polar angle
of particle-4 with respect to the beam axis.
COSCUT(2,2) R*8 (+1.0) : Maximum of cos 4 .
COSCUT(1,3) R*8 (-1.0) : Minimum of cos 5 . Here, 5 is the polar angle
of particle-5 with respect to the beam axis.
COSCUT(2,3) R*8 (+1.0) : Maximum of cos 5 .
ENGYCT(1,1) R*8 ( 3) : Minimum of 3.
ENGYCT(2,1) R*8 ( ) : Maximum of 3.
ENGYCT(1,2) R*8 ( 4) : Minimum of 4.
ENGYCT(2,2) R*8 ( ) : Maximum of 4.
ENGYCT(1,3) R*8 ( 5) : Minimum of 5.
ENGYCT(2,3) R*8 ( ) : Maximum of 5.
AMASCT(1) R*8 ( 4 + 5) : Minimum of . is the mass of the system
of particles 4 and 5.
AMASCT(2) R*8 ( 0 3 ) : Maximum of .
ARESNS(1) R*8 (0.0) : Mass of resonance, this and the next parameter are
meaningful only when IRESN=+1.
ARESNS(2) R*8 (0.0) : Width of resonance.
2. Physics control section
NDIM I*4 (5) : If you want to suppress 3 -integration, replace the denition
of NDIM by the following:
W
m
W
m
E
W
E
m
E
W
E
m
E
W
E
m
Q
m
Q
Q
Then
NDIM = 4
is xed to 0.0.
IRESN I*4 (0) : Treatment of 2 . (Do not change.)
ICOS3 I*4 (0) : Treatment of 3 . (Do not change.)
3. BASES control section
ITMX1 I*4 (5) : These three values control BASES integration. See document
of BASES for details.
ITMX2 I*4 (5) :
NCALL I*4 (5000) :
NX I*4 (50) : Value NX control the histograms.
3
Q
95
Related modules
WTOLAB
A.5 3002
This is the kinematics similar to 3001 and only the dierence is quoted here.
Description of the kinematics
Here, the particle-3 favors the beam direction, e.g, the photon radiated from initial
particles. So in this case, 3 = 0 and 1 = 2 is assumed.
When the ag ICOS3=1, the kinematics is changed to the case for the radiation of
particle-3 along beam axis. If ICOS3=1, the ag IRESN is neglected. Here, the energy
of particle-3, 3 , is used instead of 2 using
2
= 2 0 2 3 + 23 ( 3 = 0)
and 3 is converted into
3
= (log 3 )
3
to absorb the 1 3 behavior(soft singularity) which appears in the photon radiation.
The angle 3 is changed to absorb the collinear singularity, which appears in the
form of
1
=2
=2
m
m
E
m
Q
Q
W
WE
m
m
E
dE
d
E
E
=E
We introduce a variable
D1 D2
D1
;
p1 p3 ;
D2
p2 p3 :
q
+ cos 3
=
= 11 0
1 0 4 21 2
cos 3
s
!
1
log
= 4 2 + log
= 11 0+
Here the correspondence is that = (0 1) to cos 3 = (01 1) and
4 1 3
1 =
2 =
1
1+
Then the phase space in 3001 is replaced by
2
= 2 3 log( 3;max 3;min) 4
where 3 = 3;min ( 3;max 3;min )x4 and
cos 3 = log( ) 1 2 2 2 1
1 1
3
v
v
;
y
E
E
v
;
dQ
v
;
E E
D
m =W ;
;
y
E
v
WE
D
E
;
D :
=E
dx
=E
d
D D
96
E
:
E P
dy:
Meaning of X() for BASES integration
X(1), X(2), X(5)
are the same in 3001.
X(3) Related to cos 3 through the variable above.
= min + ( max 0 min)X(3)
X(4) Energy of particle-3.
X(4)
3 = 3;min ( 3;max
3;min )
y
y
E
y
y
E
y
E
=E
Options in kinit.f
Physics control section
IRESN I*4 (0) : Treatment of 2 . (Do not change.)
ICOS3 I*4 (1) : Treatment of 3 . (Do not change.)
Q
A.6 3003
This is the kinematics similar to 3001 and only the dierence is quoted here.
Description of the kinematics
When the ag IRESN=+1, the amplitude is assumed to have a resonance behavior as
1
2
( 2 0 R )2 + R2 02R
Then the variable is transformed into
!
2
2
2
0
R
= arctan
( 2 0 R2 )2 + R2 02R = R 0R
R 0R
where R and 0R are the mass and width of the resonance.
Then the phase space in 3001 is replaced by
2
2 2
2 2
(
0
)
+
0R
R
R
2
=
R 0R
Q
M
dQ
Q
M
:
M
dt
M
Q
t
M
M
M
M
dQ
Q
M
M
dt:
M
Meaning of X() for BASES integration
X(1), X(2), X(3), X(5)
X(4)
are the same in 3001.
Invariant mass of particles 4 and 5, 2 .
Resonance. = arctan(( 2 0 R2 ) ( R 0R))
= min + ( max 0 min )X(4)
2
= R2 + R 0R tan
Q
t
t
Q
t
t
M
Q
t
M
t
97
M
= M
Options in kinit.f
Physical parameter section
ARESNS(1) R*8 ( W ) : Mass of resonance, R .
ARESNS(2) R*8 (0W ) : Width of resonance, 0R .
Physics control section
IRESN I*4 (1) : Treatment of 2 . (Do not change.)
ICOS3 I*4 (0) : Treatment of 3 . (Do not change.)
M
M
Q
A.7 3004
This is the kinematics similar to 3001 and only the dierence is quoted here.
Description of the kinematics
When the ag IRESN=-1, the amplitude is assumed to contain a pole as 1
variable is transformed into
2
= (log 2 )
2
Then the phase space in 3001 is replaced by
2
= 2 (log 2) = 2 log( 2max 2min )
where 2 = 2min ( 2max 2min)t for 0
1.
=Q
dQ
d
Q
dQ
Q
Q
Q
Q d
Q
=Q
Q
Q
:
Q
=Q
dt
< t <
Meaning of X() for BASES integration
X(1), X(2), X(3), X(5)
are the same in 3001.
X(4) Invariant mass of particles 4 and 5, 2.
1 2 behavior assumed.
2
= 2min( 2max 2min )X(4)
Q
=Q
Q
Q
Q
=Q
Options in kinit.f
Physics control section
IRESN I*4 (-1) : Treatment of 2 . (Do not change.)
ICOS3 I*4 (0) : Treatment of 3 . (Do not change.)
Q
98
2
, and the
A.8 3005
Description of the kinematics
This is the kinematics for 2 to 3 process in the center-of mass system. Here a particle
3 emmit particle A and a particle 4 emmit particle B. After that particles A and B
collide into particles 5;
1 0! 3 +
2 0! 4 +
+ 0! 5
Integration variables are the polar angle and energy of particles 3 and 4, and azimuthal
angle of particles 3. Angles of 3 and 4 are dened with respect to the incoming
particles.
For the 4-vector notation, we use ( x y z ) ordering. We use the frame where
incoming particles collide along -axis, so that the momenta of initial particles are
assigned as follows:
Particle-1 (0 0 + 1 )
Particle-2 (0 0 0 2 )
where is the positive value determined by 1 2 . Here, relative velocity rel is
assumed to be 2 for the collision highly relativistic particles. If colliding particles are
slow, the user needs modication in kinit.f.
New integration variable is intruduced as
2
= 0( 1 0 3)2
= 2 1 3 0 21 0 23
0 =
10 3
Phase space is in the center-of-mass system and it is given by
3
4 cos 4
3
0~ 3 = 8(21 )5 3sincos sin
3
4 j sin 4 j
In this kinematics, with ICOS3=1 the cross section is assumed to have 1 2 singularity. The variable is transformed into
2
= 2 3 cos 3, (for ICOS3=0)
2
2
= (log 2 ).
(for ICOS3=1)
Then phase space is replaced by
cos 3 = 2P1P 2 ,
(for ICOS3=0)
Q
2
2
= 2P P log( max min ) (for ICOS3=1)
where 2 = 2min ( 2max 2min) for 0
1.
A
;
B
;
A
B
p ;p ;p ;E
z
P
;
;
P; E
;
;
P; E
m ;m ;W
Q
p
p
p p
q
m
E
m
E
dE d
d
v
dE d
d
=Q
dQ
PP d
dQ =Q
d
d
2
3
3
Q
Q
Q
=Q
Q
dQ
Q
=Q
< <
99
d
Meaning of X() for BASES integration
X(1)
X(2)
Energy of = 1 0 3
2
=0 2
2
= 2min + ( 2max 0 2min) (2) for ICOS3=0
2
= 2min ( 2max 2min )X(2) for ICOS3=1
cos 4 = 2X(3) 0 1
Polar angle of particle-4
Energy of particle-4
3 = 2 X(5)
Azimuthal angle of particle-3
q
Q
Q
Q
X(4)
X(5)
p
q
Q
X(3)
p
Q
Q
Q
Q
X
=Q
Options in kinit.f
Default value is shown in parenthesis.
1. Physical parameter section
W R*8 (200.0) : Center of mass energy.
COSCUT(1,1) R*8 (-1.0) : Minimum of cos 3 .
COSCUT(2,1) R*8 (+1.0) : Maximum of cos 3 .
COSCUT(1,2) R*8 (-1.0) : Minimum of cos 4 . Here, 4 is the polar angle
of particle-4 with respect to the beam axis.
COSCUT(2,2) R*8 (+1.0) : Maximum of cos 4 .
COSCUT(1,3) R*8 (-1.0) : Minimum of cos 5 . Here, 5 is the polar angle
of particle-5 with respect to the beam axis.
COSCUT(2,3) R*8 (+1.0) : Maximum of cos 5 .
ENGYCT(1,1) R*8 ( 3) : Minimum of 3.
ENGYCT(2,1) R*8 ( s+m 02(mW +m ) ) : Maximum of 3.
ENGYCT(1,2) R*8 ( 4) : Minimum of 4.
ENGYCT(2,2) R*8 ( s+m 02(mW +m ) ) : Maximum of 4.
ENGYCT(1,3) R*8 ( 5) : Minimum of 5.
ENGYCT(2,3) R*8 ( s+m 02(mW +m ) ) : Maximum of 5.
2. Physics control section
ICOS3 I*4 (0) : Treatment of 3 .
3. BASES control section
ITMX1 I*4 (5) : These three values control BASES integration. See document
of BASES for details.
m
E
3
4
5
2
E
m
E
4
5
3
2
E
m
E
5
3
4
2
100
E
I*4 (5) :
NCALL I*4 (5000) :
NX I*4 (50) : Value NX control the histograms.
ITMX2
A.9 3006
This is the kinematics for radiative processes.
Description of the kinematics
This is the kinematics for 2 to 3 process in the center-of mass system. A particle 3 is
assumed to be a photon. To treat both initial and nal state radiations, a phase space
with respect to photon angles is divided into three regions;
=
Z
3
3
Z
Z
Z
= S 3 + S 3 + S 3
3
3
3
^
f 13 23 43 53g = 13 23g
12 = f 3 j
^
f 13 23 43 53g = 34g
4 = f 3j
^
f 13 23 43 53g = 35g
5 = f 3j
01 ( ^i 1 ^i ) and ^i is a unit (three) vector along a three momentum of a
d
S
d
d
d
12 d
S
where ij =
particle- .
cos
;
d
d
4 d
d
d
5 d
P
min ;
;
;
or S
P
min ;
;
;
;
S
P
min ;
;
;
;
P
P
d
;
;
P
i
In the region S12
In the region
S12
, the kinematics 3003 is used. Dierence is quoted here.
Options in kinit.f
Default value is shown in parenthesis.
1. Physical parameter section
COSOPN R*8 (1) : opening angle cut between photon and particle 4,5
2. Physics control section
IFRAD I*4 (3) : 1=initial state radiadiation, 2=nal state radiation,3=initial+nal
state radiation.
101
In the region S4
In the region 4, the nal state rst splits into particle-5 and the system particle-5 and
photon (particle-3). After that the latter decays into particle-5 and particle-3.
1 + 2 0! 5 +
0! 3(
)+5
Integration variables are the polar angle and azimuthal angle for the rst split,
those angles for the second split, and the invariant mass of particles 3 and 5. Angles
for the rst split are dened with respect to the incoming particles and those for the
second split are dened in the center-of-mass system of particles 4 and 5 with respect
to the momentum direction of the system.
For the 4-vector notation, we use ( x y z ) ordering. We use the frame where
incoming particles collide along -axis, so that the momenta of initial particles are
assigned as follows:
Particle-1 (0 0 + 1 )
Particle-2 (0 0 0 2 )
where is the positive value determined by 1 2 . Here, relative velocity rel is
assumed to be 2 for the collision highly relativistic particles. If colliding particles are
slow, the user needs modication in kinit.f.
The angles 4 and 4 represent the direction of particle-4. Invariant mass of 3 and
5, 2 is another variable.
2
= ( 3 + 5 )2
In the center of mass system of particles 3 and 5, angles 3;(35) and 3;(35) represent the
direction of particle-3. The system of particles 3 and 5 are boosted backward to the
momentum direction of particle-4.
Phase space is in the center-of-mass system and it is given by
0~ 3 = 21 02 (1 + 2 ! 4 + ) 2 02 ( ! 3 + 5)
= (12;842 (2) )(5 ; 35) cos 3 3 2 cos 4;(45) 4;(45)
To treat colinear singularity, new variables are introduced;
S
q
;
q
photon
p ;p ;p ;E
z
;
;
P; E
;
;
P; E
P
m ;m ;W
v
Q
Q
p
p
d
d
q dQ d
q q
d
dQ
Q
then,
dQ
2
=
2
2
2
Q
q
d dQ d
= (log 2 )
d
(log 2) =
Q d
Q
Q
102
2
;
log(
Q
max =Qmin )dt
2
2
d
:
where
2
Q
=
min (Qmax =Qmin)
2
2
Q
2
t
for 0
cos 3
< t <
= (
3
p
1. Moreover,
2
0 q)
Q E3
3
E
E3
2
2
= 2p0 2 5
2
= + 2p0
3
Q
E3
m
q
=P ;
;
Q
s
q
E
q
Q
2
m4
s
;
2
2
q =
q0
where 33 is polar angle of particle-3 in particle-3 and -5 rest frame, 3 is an energy of
particle-3 in a labf_rame. 3 is used as integration valiable instead of 33 , then
p 2
3
(cos 3 ) = 3 ( 3 )
P
E
Q ;
E
E
d
Q
E3 P
q
d E
:
Futher modication
= (log 3 )
= log( 3max
dE3
d
E3
E
E
;
min )dt;
=E3
for 0
1 has been done.
When the ag icos4=1, the amplitude is assumed to contain a pole as 1 2 =
1 ( 1 0 4 )2 . The treatment similer to kinem2002 has been done.
When the ag icos4=2, the amplitude is assumed to contain a pole 1 2 = 1 ( 1 0
2
2
= 1 ( 1 0 5 )2. The treatment similer to kinem2003 has been done.
4 ) and 1
< t <
=t
= P
P
=t
P
=u
= P
Meaning of X() for BASES integration
X(1)
cos 4 = 2X(1) 0 1
:ICOS4=0
= 0( 1 0 4)2 + 21 ,
= min ( max min)X (1)
:ICOS4=1
D is symmetrized around X(1)=0.5
:ICOS4=2
3 = 2 X(2)
Azimuthal angle in the CM system of particles 3 and 5.
2
= ( 3 + 5 )2 = 2min ( 2max 2min )X (3)
min max min )X (4)
3 = 3 ( 3
3
Energy of particle-3 (photon)
4 = 2 X(5)
Azimuthal angle of particle-4
D
D
X(2)
X(3)
X(4)
X(5)
= P
P
p
D
Q
P
E
E
p
D
P
E
m
=D
Q
Q
=Q
=E
103
Options in kinit.f
Default value is shown in parenthesis.
1. Physical parameter section
W R*8 (200.0) : Center of mass energy.
COSCUT(1,1) R*8 (-1.0) : Minimum of cos 3 .
COSCUT(2,1) R*8 (+1.0) : Maximum of cos 3 .
COSCUT(1,2) R*8 (-1.0) : Minimum of cos 4 . Here, 4 is the polar angle
of particle-4 with respect to the beam axis.
COSCUT(2,2) R*8 (+1.0) : Maximum of cos 4 .
COSCUT(1,3) R*8 (-1.0) : Minimum of cos 5 . Here, 5 is the polar angle
of particle-5 with respect to the beam axis.
COSCUT(2,3) R*8 (+1.0) : Maximum of cos 5 .
ENGYCT(1,1) R*8 (1.D-3) : Minimum of 3 .
ENGYCT(2,1) R*8 ( s+m 02(mW +m ) ) : Maximum of 3.
ENGYCT(1,2) R*8 ( 4) : Minimum of 4.
ENGYCT(2,2) R*8 ( s+m 02(mW +m ) ) : Maximum of 4.
ENGYCT(1,3) R*8 ( 5) : Minimum of 5.
ENGYCT(2,3) R*8 ( s+m 02(mW +m ) ) : Maximum of 5.
COSOPN) R*8 (1) : opening angle cut between photon and particle 4,5
2. Physics control section
ICOS4 I*4 (0) : Treatment of 4 .
IFRAD I*4 (3) : 1=initial state radiadiation, 2=nal state radiation,3=initial+nal
state radiation.
3. BASES control section
ITMX1 I*4 (5) : These three values control BASES integration. See document
of BASES for details.
ITMX2 I*4 (5) :
NCALL I*4 (5000) :
NX I*4 (50) : Value NX control the histograms.
E
3
4
5
2
E
m
E
4
5
3
2
E
m
E
5
3
4
2
In the region S5
4 $ 5 of previous section.
104
E
A.10 3007
This is the kinematics for double-radiative processes. It is similar to 3006 and only the
dierence is quoted here
Description of the kinematics
This is the kinematics for 2 to 3 process in the center-of mass system. Particle 3 and
4 are assumed to be photons. A energy ordaring is required;
E3 < E4
A.11 3008
This is the kinematics for three-photon process. It is similar to 3006 and only the
dierence is quoted here
Description of the kinematics
This is the kinematics for 2 to 3 process in the center-of mass system. Particle 3,4 and
5 are assumed to be photons. A energy ordaring is required;
E3 < E4 < E5
A.12 3009
This is the kinematics similar to 3001 and only the dierence is quoted here.
Description of the kinematics
This kinematics can treat processes in which particle 4 and 5 come from two independent resonances (for example, from a Higgs boson and a Z-boson). Moreover it can
treat some singularities of angluare distribution of particle-4.
In this kinematics, with ag ICOS4=1or2, the cross section is assumed to have at
rapidity distrobution. New integration variable is introduced as
0 log(1 + 2 )
log(1 + 2 )
= 2 24 ( 4 + 5 )2
By using this variable, cos 4 can be expressed as;
cos 4 = (1 + ) tanh
cos 4 is measured with respect to 0 3 .
bb
=
< <
m = P
= ;
P
:
P
105
:
With ag ICOST=-1, the cross section is assumed to have 1 singularity, where
= ( 1 0 4)2. New integration variable is introduced as
= 0
= 2( 1 4 0 4 cos 4)
cos 4 is measured with respect to 1 . The variable is transformed into
= 2 4 cos
= (log )
Then the phase space in 3001 is replaced by
=t
t
p
p
D
t;
E E
PP
PP d
;
:
P
dD
dD=D
d
cos
4
d
= 2
= 2
D
P P4
D :
(log )
d
D
P P4
D ;
log(
D
max =Dmin )d
where = min ( max min) for 0
1.
With ag ICOST=-2, cos 4 is symmetrized around 90.
D
D
D
=D
< <
Options in kinit.f
Default value is shown in parenthesis.
1. Physical parameter section
ARESNS(1,1) R*8 (0.0) : Mass of rst resonance.
ARESNS(2,1) R*8 (0.0) : Width of rst resonance.
ARESNS(1,2) R*8 (0.0) : Mass of second resonance.
ARESNS(2,2) R*8 (0.0) : Width of second resonance.
2. Physics control section
IRESNS I*4 (0) : Treatment of 2 . * no-singularity : IRESNS= 0 * narrow resonance (single): IRESNS= 1 * narrow resonance (single) * + 1/Q2
singularit : IRESNS=-1 * narrow resonance (double): IRESNS= 2 * narrow resonance (double) * + 1/Q2 singularit : IRESNS=-2 * Q2=S peak
: IRESNS= 3 * 1/Q2 singularity only : IRESNS=-3 * narrow resonance
(single) * + Q2=S peak : IRESNS= 4
ICOS4 I*4 (0) : Treatment of 4 . * no-singularity : ICOS4= 0 * z-axis -> p3 * 1/t singularity : ICOS4= 1 * 1/t + 1/u singularity : ICOS4= 2 * z-axis
-> p1 * 1/t singularity : ICOS4=-1 * 1/t + 1/u singularity : ICOS4=-2
Q
106
A.13 4001
Kinematics 4002 is variation of this one and the user can also consult them in the
following sections.
Description of the kinematics
This is the kinematics for 2 to 4 process in the center-of mass system. Here the nal
state rst splits into the system of particles 3 and 4 and the system of particles 5 and
6. After that both system decays:
1 + 2 0! 1 + 2
1 0! 3 + 4
2 0! 5 + 6
Integration variables are the polar angle and azimuthal angle for the rst split,
those angles for the two secondary splits, and the invariant masses of 1 and 2 . Angles
for the rst split are dened with respect to the incoming particles and those for the
secondary splits are dened in their own center-of-mass system with respect to the
momentum direction of the system.
If there is a mass singularity for the two of particles in the nal state, it is recommended to assign the two particles to form a pair above. Also user can introduce cuto
for angles and minimum energies as options.
For the 4-vector notation, we use ( x y z ) ordering. We use the frame where
incoming particles collide along -axis, so that the momenta of initial particles are
assigned as follows:
Particle-1 (0 0 + 1 )
Particle-2 (0 0 0 2 )
where is the positive value determined by 1 2 . Here, relative velocity rel is
assumed to be 2 for the collision highly relativistic particles. If colliding particles are
slow, the user needs modication in kinit.f.
The angles q1 and q1 represent the direction of the system of particles 3 and 4.
Invariant masses are another variables.
2
2
2
2
2
2
1 = 1 = ( 3 + 4)
2 = 2 = ( 5 + 6)
In the center of mass system of particles 3 and 4, angles 3;(34) and 3;(34) represent the
direction of particle-3. Similarly, 5;(56) and 5;(56) are dened. The systems of particles
3 and 4,and 5 and 6 are boosted backward to the laboratory frame later.
Phase space is in the center-of-mass system and it is given by
0~ 4 = (21 )8 02 (1 + 2 ! 1 + 2 ) 21 22 02 ( 1 ! 3 + 4) 02 ( 2 ! 5 + 6)
( 2; 56) cos
= (12; 1 2 )83((21; )34)
q1 q1
8
2 21 cos 3;(34) 3;(34) 22 cos 5;(56) 5;(56)
q
q
;
q
;
q
q
q
p ;p ;p ;E
z
;
;
P; E
;
;
P; E
P
m ;m ;W
v
Q
q
p
p
;
Q
q
p
p
d
d
q
q q
q
q
q
dQ d
d
dQ d
dQ dQ d
d
107
q
d
d
d
:
q
For the treatment of 2j , one can use one of three ways by setting the ags
IRESNS(j), (j=1,2).
Flat distribution to 2j , as in 3001 for the system of particle 4 and 5. The ag is
IRESNS(j)=0.
Resonance distribution to 2j , as in 3003 for the system of particle 4 and 5. The
ag is IRESNS(j)=1. If this mode is selected, also the user should supply the
values of mass and width.
1 2j distribution, as in 3004 for the system of particle 4 and 5. The ag is
IRESNS(j)=-1.
Here there is no singular behavior for channel, and ICOSQ3=0 is assumed.
Q
Q
Q
=Q
t
Meaning of X() for BASES integration
X(1)
X(2)
X(3)
X(4)
X(5)
X(6)
X(7)
X(8)
Invariant mass of particles 3 and 4, 21 .
Dependent on IRESNS(1). The same as X(4)
in 3001, 3003, 3004 for IRESNS(1)=0,1,-1.
Invariant mass of particles 5 and 6, 22 .
Dependent on IRESNS(2). The same as X(4)
in 3001, 3003, 3004 for IRESNS(2)=0,1,-1.
cos 3;(34) = 2X(3) 0 1
Polar angle in the CM system of particles 3 and 4.
3;(34) = 2 X(4)
Azimuthal angle in the CM system of particles 3 and 4.
cos 5;(56) = 2X(5) 0 1
Polar angle in the CM system of particles 5 and 6.
5;(56) = 2 X(6)
Azimuthal angle in the CM system of particles 5 and 6.
cos q1 = 2X(7) 0 1
Polar angle of particle-3
q1 = 2 X(8)
Azimuthal angle of 1
Q
Q
q
Options in kinit.f
Default value is shown in parenthesis.
1. Physical parameter section
W R*8 (200.0) : Center of mass energy.
COSCUT(1,1) R*8 (-1.0) : Minimum of cos 3 . This and angles below are
all in the laboratory frame.
108
R*8 (+1.0) : Maximum of cos 3 .
COSCUT(1,2) R*8 (-1.0) : Minimum of cos 4 .
COSCUT(2,2) R*8 (+1.0) : Maximum of cos 4 .
COSCUT(1,3) R*8 (-1.0) : Minimum of cos 5 .
COSCUT(2,3) R*8 (+1.0) : Maximum of cos 5 .
COSCUT(1,4) R*8 (-1.0) : Minimum of cos 6 .
COSCUT(2,4) R*8 (+1.0) : Maximum of cos 6 .
ENGYCT(1,1) R*8 ( 3) : Minimum of 3.
ENGYCT(2,1) R*8 ( ) : Maximum of 3.
ENGYCT(1,2) R*8 ( 4) : Minimum of 4.
ENGYCT(2,2) R*8 ( ) : Maximum of 4.
ENGYCT(1,3) R*8 ( 5) : Minimum of 5.
ENGYCT(2,3) R*8 ( ) : Maximum of 5.
ENGYCT(1,4) R*8 ( 6) : Minimum of 6.
ENGYCT(2,4) R*8 ( ) : Maximum of 6.
AMASCT(1,1) R*8 ( 3 + 4) : Minimum of 1. 1 is the mass of the
system of particles 3 and 4.
AMASCT(2,1) R*8 ( 0 5 0 6) : Maximum of 1.
AMASCT(1,2) R*8 ( 5 + 6) : Minimum of 2. 2 is the mass of the
system of particles 5 and 6.
AMASCT(2,2) R*8 ( 0 3 0 4) : Maximum of 2.
ARESNS(1,1) R*8 (0.0) : Mass of resonance, this and the next parameter
are meaningful only when IRESNS(1)=+1.
ARESNS(2,1) R*8 (0.0) : Width of resonance.
ARESNS(1,2) R*8 (0.0) : Mass of resonance, this and the next parameter
are meaningful only when IRESNS(2)=+1.
ARESNS(2,2) R*8 (0.0) : Width of resonance.
2. Physics control section
NDIM I*4 (8) : If you want to suppress q1-integration, replace the denition
of NDIM by the following:
COSCUT(2,1)
m
E
W
E
m
E
W
E
m
E
W
E
m
E
W
E
m
W
m
W
m
m
Q
m
Q
m
m
Q
Q
m
Q
Q
Then
NDIM = 7
is xed to 0.0.
IRESNS(1) I*4 (0) : Treatment of
for the meaning.
q1
109
2
Q1
. See the description of kinematics
I*4 (0) : Treatment of 22 . See the description of kinematics
for the meaning.
ICOSQ3 I*4 (0) : Treatment of q1 . (Do not change.)
3. BASES control section
ITMX1 I*4 (5) : These three values control BASES integration. See document
of BASES for details.
ITMX2 I*4 (5) :
NCALL I*4 (5000) :
NX I*4 (50) : Value NX control the histograms.
IRESNS(2)
Q
Related modules
WTOLAB
A.14 4002
This is the kinematics similar to 4001 and only the dierence is quoted here.
Description of the kinematics
In this kinematics, with ag ICOSQ3=1 , new integration variable is introduced as
= 0( 1 0 1 ) 2
= 2( 1 q 0 q cos q ) 0 21 0 21
Moreover with ag ICOSQ3=2 , the cross section is assumed to have 1 singularity.
The variable is transformed into
dT = 2 q cos q , (for ICOSQ3=1)
dT/T = (log ).
(for ICOSQ3=2)
Then the phase space in 4001 is replaced by
cos q = 2P1P cos q ,
(for ICOSQ3=1)
T
= 2P P log( max min ) (for ICOSQ3=2)
where = min ( max min) for 0
1.
T
p
Q
E E 1
;
PP 1
1
m
Q :
=T
P P 1d
d
d
1
q1
T
d
T
T
=T
1
T
q1
T
1
=T
d
< <
Meaning of X() for BASES integration
Except for X(7), they are the same in 4001.
X(7) Momentum transfer square, = 0( 1 0 1)2 .
= min + ( max 0 min )X(7)
(for ICOSQ3=1)
X
(7)
= min ( max min)
(for ICOSQ3=2)
T
T
T
T
T
T
T
T
=T
110
p
Q
Options in kinit.f
Physics control section
ICOSQ3 I*4 (1) : Treatment of q1. (Do not change.)
A.15 4003
Description of the kinematics
This is the kinematics for 2 to 4 process in the center-of mass system. Here a particle
3 emmit particle A and a particle 4 emmit particle B. After that particles A and B
collide into particles 5 and 6;
1 0! 3 +
2 0! 4 +
+ 0! 5 + 6
Integration variables are the polar angle and azimuthal angle of particles 3 and
4, those angles of particles 5 and 6 in their rest frame, energies of particles 3 and 4,
and the invariant masses of 5 and 6. Angles of 3 and 4 are dened with respect to the
incoming particles and those of 5 and 6 are dened in their own center-of-mass system
with respect to the momentum direction of the system.
User can introduce cuto for angles and minimum energies as options.
For the 4-vector notation, we use ( x y z ) ordering. We use the frame where
incoming particles collide along -axis, so that the momenta of initial particles are
assigned as follows:
Particle-1 (0 0 + 1 )
Particle-2 (0 0 0 2 )
where is the positive value determined by 1 2 . Here, relative velocity rel is
assumed to be 2 for the collision highly relativistic particles. If colliding particles are
slow, the user needs modication in kinit.f.
New variables are introduces as ;
2
2
2
1;2 = 0 1;2 = 0( 1 0 3;4 )
A
;
B
;
A
B
p ;p ;p ;E
z
;
;
P; E
;
;
P; E
P
m ;m ;W
Q
q
p
= 2(
and
0
q1
Invariant mass is another variables.
2
Q3
;2
p
;4
E E3
= 0
E
;
7
P3
P1
;2 P3;4 cos 3;4 );
;4 :
= 32 = ( 5 + 6)2
q
p
111
p
:
v
Phase space is in the center-of-mass system and it is given by
0~ 4 = 16(21 )6 1 p 21 2 21 22 10 20 3
09
3 4
2
2 ( 1 2 : 56) 1 cos 5;(56) 6;(56)
where
9 = 2 0 2 ( 3 + 4 ) + 2( 3 4 0 3 4 cos 3 cos 4 )
+ 23 + 24 0 23
= 2 3 4 sin 3 sin 4
For the treatment of 23 , one can use one of three ways by setting the ags
IRESNS.
Flat distribution to 23, as in 3001 for the system of particle 4 and 5. The ag is
IRESNS=0.
Resonance distribution to 23 , as in 3003 for the system of particle 4 and 5. The
ag is IRESNS=1. If this mode is selected, also the user should supply the values
of mass and width.
1 23 distribution, as in 3004 for the system of particle 4 and 5. The ag is
IRESNS=1.
When the ag ICOS3,4=1, the kinematics is changed to the case for the radiation
of particle-3,4 along beam axis.
d
q q
W
dQ d
W P
m
m
E E
dQ dQ dq dq d
P P
P
d
E E
P P
Q ;
:
Q
Q
Q
=Q
2
dQ1
2
;2 =Q1;2
= (log
d
112
;2 ):
2
Q1
;
Meaning of X() for BASES integration
X(1)
X(2)
X(3)
X(4)
X(5)
X(6)
X(7)
X(8)
Energy of 1 = 1 0 3
Energy of 2 = 2 0 4
Momentun transfer squaer, 21 = 0( 1 0 3 )2
2
2
2
2
1 = 1;min + ( 1;max 0 1;min ) (3) for ICOS3=0
2
2
2
2
X (3) for ICOS3=1
1 = 1;min ( 1;max
1;min )
Momentun transfer squaer, 22 = 0( 2 0 4 )2
2
2
2
2
2 = 2;min + ( 2;max 0 2;min ) (4) for ICOS4=0
2
2
2
2
X (4) for ICOS4=1
2 = 2;min ( 2;max
2;min )
cos 5;(56) = 2X(5) 0 1
Polar angle in the CM system of particles 5 and 6.
5;(56) = 2 X(6)
Azimuthal angle in the CM system of particles 5 and 6.
Invariant mass of particles 5 and 6, 23 .
Dependent on IRESNS . The same as X(4)
in 3001, 3003, 3004 for IRESNS(2)=0,1,-1.
3 = 2 X(8)
Azimuthal angle of particle-3
q
E
E
q
E
E
Q
Q
Q
Q
Q
Q
Q
Q
Q
Q
Q
p
p
p
X
=Q
Q
Q
p
Q
Q
Q
X
=Q
Q
Options in kinit.f
Default value is shown in parenthesis.
1. Physical parameter section
W R*8 (200.0) : Center of mass energy.
COSCUT(1,1) R*8 (-1.0) : Minimum of cos 3 . This and angles below are
all in the laboratory frame.
COSCUT(2,1) R*8 (+1.0) : Maximum of cos 3 .
COSCUT(1,2) R*8 (-1.0) : Minimum of cos 4 .
COSCUT(2,2) R*8 (+1.0) : Maximum of cos 4 .
COSCUT(1,3) R*8 (-1.0) : Minimum of cos 5 .
COSCUT(2,3) R*8 (+1.0) : Maximum of cos 5 .
COSCUT(1,4) R*8 (-1.0) : Minimum of cos 6 .
COSCUT(2,4) R*8 (+1.0) : Maximum of cos 6 .
ENGYCT(1,1) R*8 ( 3) : Minimum of 3.
ENGYCT(2,1) R*8 ( ) : Maximum of 3.
ENGYCT(1,2) R*8 ( 4) : Minimum of 4.
ENGYCT(2,2) R*8 ( ) : Maximum of 4.
m
E
W
E
m
E
W
E
113
R*8 ( 5) : Minimum of 5.
ENGYCT(2,3) R*8 ( ) : Maximum of 5.
ENGYCT(1,4) R*8 ( 6) : Minimum of 6.
ENGYCT(2,4) R*8 ( ) : Maximum of 6.
AMASCT(1) R*8 ( 5 + 5 ) : Minimum of 3 . 1 is the mass of the system
of particles 3 and 4.
AMASCT(2) R*8 ( 0 3 0 4 ) : Maximum of 3 .
ARESNS(1) R*8 ( W ) : Mass of resonance, this and the next parameter
are meaningful only when IRESNS(1)=+1.
ARESNS(2) R*8 (0W ) : Width of resonance.
2. Physics control section
NDIM I*4 (8) : If you want to suppress q1-integration, replace the denition
of NDIM by the following:
ENGYCT(1,3)
m
E
W
E
m
E
W
E
m
m
W
m
Q
m
Q
Q
m
NDIM = 7
Then
is xed to 0.0.
IRESNS I*4 (0) : Treatment of 23 . See the description of kinematics for
the meaning.
ICOS3 I*4 (1) : Treatment of 3 .
ICOS4 I*4 (0) : Treatment of 4 .
3. BASES control section
ITMX1 I*4 (5) : These three values control BASES integration. See document
of BASES for details.
ITMX2 I*4 (5) :
NCALL I*4 (5000) :
NX I*4 (50) : Value NX control the histograms.
3
Q
Related modules
PBOOST ROXMTX MINVR2 MVMULT
114
Bibliography
[1] K. Aoki et al., Suppl. Prog. Theor. Phys. 73, 1982.
[2] T. Muta, \Foundations of Quantum Chromodynamics", World Scientic, 1987.
[3] T. Kaneko, in \New Computing Techniques in Physics Research", ed. D. PerretGallix and W. Wojcik, p.555, 1990, Edition du CNRS, Paris,
T. Kaneko and H. Tanaka, in \Proc. of the Second Workshop on JLC", ed. S.
Kawabata, p.250, 1991, KEK Proceeding 91-10,
T. Kaneko et al., in \New Computing Techniques in Physics Research II", ed. D.
Perret-Gallix, p.659, 1992, Edition du CNRS, Paris.
[4] H. Tanaka, Comput. Phys. Commun. 58(1990)153.
[5] H. Tanaka, T. Kaneko and Y. Shimizu, Comput. Phys. Commun. 64(1991)149.
[6] S. Kawabata, Comput. Phys. Commun. 41(1986)127;
S.Kawabata, BASES/SPRING v.5.1, in preparation.
[7] J.Fujimoto et al., Suppl. Prog. Theor. Phys. 100, 1991.
[8] GRACE manual, MINAMI-TATEYA group, KEK report 92-19, (1993).
115