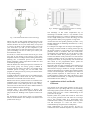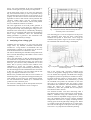
1
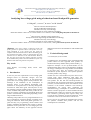
International Conference on Renewable Energies and Power Quality (ICREPQ’13)
Bilbao (Spain), 20th to 22th March, 2013
exÇxãtuÄx XÇxÜzç tÇw cÉãxÜ dâtÄ|àç ]ÉâÜÇtÄ (RE&PQJ)
ISSN 2172-038 X, No.11, March 2013
Analysing low-voltage grids using a behaviour based load profile generator
N. Pflugradt1, J. Teuscher2, B. Platzer1 and W. Schufft2
1
Chair of Technical Thermodynamics
Faculty of Mechanical Engineering
Chemnitz University of Technology
Straße der Nationen 62, 09107 Chemnitz (Germany)
Phone/Fax number:+0049 371 531 38745/+0049 371 531 838745, e-mail: [email protected]
2
Chair of Power and High-Voltage Engineering
Faculty of Electrical Engineering and Information Technology
Chemnitz University of Technology
Straße der Nationen 62, 09107 Chemnitz (Germany)
Phone/Fax number:+0049 371 531 37752/+0049 371 531 837752, e-mail: [email protected]
Abstract. This paper contains a behaviour based load
profile generator to generate realistic load profiles for every
single household in a low voltage grid. The results are
compared with measurements and it is shown that adding up all
the generated load profiles results in approximately the same
load and curve as measured on the real substation. Based on
this, the paper shows that the common approach of scaling
down standard load profiles to the individual houses yields very
different results than using realistic load profiles.
Key words
Load Profiles,
Simulation
Low-voltage
Grids,
Power
Flow
1. Introduction
In the last years the requirements of low-voltage grids
changed based on renewable energies and new
consumers. (f.e. electric vehicles). At the moment the
power flow in low-voltage grids is mostly unknown. The
challenge is the simulation of the consumption of
electrical energy in the different households. This
simulation is an important fact to develop management
structures for future micro grids. Currently there is only
the possibility of using synthetic profiles which are based
on the standard load profiles. But these profiles do not
show the realistic consumption of households. Real load
profiles of households are fluctuating depending on the
usage of different devices.
Obtaining load profiles for every single household in an
area is prohibitively expensive though, if possible at all.
Using the behaviour based load profile generator is a
quick and easy way of generating various realistic load
profiles of different households thus creating a realistic
simulation of the power flow in a low-voltage grid. This
paper shows the feasibility of this approach and the
differences between it and simulations with standard load
profiles.
2. Technical Background
A. Load Profiles for households
For different uses exist different types of household load
profiles. Based on their approach these profiles are
divided in bottom-up-models and top-down-models. [1]
Important examples of the top-down-model are the
standard load profiles. These are developed for modelling
the energy consumption of a large number of households
at the same time. They are primarily used by the
Distribution System Operators. The System Operators
use these profiles to buy energy.
Another use case is the simulation of power flow in lowvoltage grids. These simulations need either real,
measured load profiles or very good approximations of
such profiles. For this task the bottom-up-models are
used. Mostly they are based on statistical or probabilistic
processes, on measurements and on the behaviour of the
consumer or the weather conditions. The bottom-upmethodologies use among other parameters the
individual energy consumption of selected households
and the technical properties of that household. Because
individual load profiles are caused by the behaviour of
real consumers, generating them requires taking into
account all the constraints of both the behaviour of the
consumers as well as the constraints of the devices.
Figure 1 shows one example for the differences between
the synthetic standard load profiles and the real
consumption of a household.
4000
3500
3000
real consumption
standard load profile
2500
2000
consumptio n S in
kVA
1500
1000
500
0
00:00
06:00
12:00
18:00
00:00
time in hh:min
Fig. 1. Comparison between standard load profile and a real
load profile of a household
B. Simulation of low-voltage grids
The simulated low-voltage grid (Ur = 0.4 kV) in this
paper is based on a real existing grid in Germany. [2]
This grid is an urban grid which supplies a lot of
households in a small area. In this paper the load profile
generator is tested on a model of an urban low-voltage
grid including almost 80 connection points over an area
of 0.25 km². An average connection point supplies
approximately 10 households.
The program for the power flow simulation is done with
the tool MATPOWER. [3] This is a static calculation
program based on MATLAB. It simulates only one
moment of the power flow. To calculate the power flow
in the grid at various points in time with different loads,
an extension for MATPOWER was developed.
Figure 2 shows another extension developed by the
authors to interpret the simulated results. With this
extension it is possible to find critical situations, f.e. a
high utilization of the individual lines or the voltage drop
in the grid at each time step.
Fig. 2. Overview about the developed extension to interpret the
simulated results
3. Load Profile Generator
For this analysis a new behaviour based load profile
generator was used [4]. Most load profile generators
according to [1] are based on statistical approaches or
Markov chains.
One example is the program DHWCalc [5], a tool for
generating load profiles for domestic hot water use. It
works by assigning probabilities to time spans, for
example „50% between 12:00 and 13:00 on Weekdays“.
These probabilities are then used to randomly distribute
hot water usage events over all timespans, based on a
rather complicated algorithm. The algorithm takes into
account differences in winter and summer usage
behaviour, vacations and desired total yearly use.
Other load profile generators for electrical energy use
more complicated algorithms. Examples include finite
state machines or Markov chains, often coupled with
probabilities. A very simplified example of this might be
„After eating dinner there is an 80% chance of having the
TV turned on between 18:00 and 19:00, combined with a
30% of turning on the DVD player“. Those approaches
yield good results for creating a load profile for many
hundreds or thousands of households. But it is very
difficult to correctly simulate a realistic load profile for a
single household, especially for special cases like shift
workers or families with children.
Consider for example calculating the amortization time
of a battery used to raise the percentage of photovoltaic
power used in-house. It makes a large difference if the
household members are home during the day when the
sun is shining, if they work at nights or if they take 3
weeks of vacation in the summertime just when there is
the most sun.
The behaviour based load profile works differently: It
uses a psychological model based on the works of D.
Dörner [6] to simulate the behaviour of each member of
the household. From this the load profile
generator determines the device usage and then calculates
the energy profile.
Dörner’s work is based on the theory of the selfish homo
oeconomicus. The basic assumption here is that every
person always choses the action which best satisfies his
or her desires.
Dörner came up with a way to represent this very basic
idea with mathematical model in the computer: He
modelled each desire as “leaking water tank”. One of his
graphics is shown in Fig. 3. This means that the desire to
do something increases over time. It frequently needs to
be satisfied. And there is a logarithmic increase in the
importance of the desire the more urgent (empty) the
desire gets.
Fig. 4. Examples of the measured load profiles: A washing
machine and a fridge.
Fig. 3. The mental model Dörner uses for desires [6]
Dörner was able to fully explain human behaviour with
only five desires. For example he says that going to work
satisfies the desire to live (one needs money to buy food
to survive), the desire to feel competent (that you can do
your work shows you that you are competent at your
work) and the desire to feel some amount of control over
your surroundings, but not too much (you control your
environment at work).
In real life, it is rather obvious that one has to go to work
every day to earn money to buy food or to have some
disposable income to indulge oneself. Putting that kind of
planning into a simulation proved to be unfeasible
though. Therefore a more simple desire model was used
in the load profile generator.
Here the desires have been split apart into one desire for
each activity group. An activity group is defined as
activities that can replace each other. For example if the
simulated person is hungry, she can eat bread, cook
spaghetti or order pizza. Every activity will fill the desire
to stop feeling hungry.
To fulfil the desires activities have to be available for the
simulated person to choose from. For this a simulated
household is constructed with various devices.
Based on the devices possible actions are available to the
simulated person. For example having an oven makes it
possible to bake a cake, make pizza or to cook a turkey.
Of course each of these activities has a different duration
and uses different amounts of energy.
Activities have a m:n relationship to devices. For
example watching a DVD movie requires both the DVD
player and the TV. Reading a book requires no devices at
all.
For each device in each activity there is a load profile,
based on measured data. One example is the device load
profile shown in Fig 4.
The advantage of this rather complicated way of
describing a household is that it’s very flexible. In the
load profile generator it’s possible to simulate the energy
use of a single student just as well as the energy use of a
multi generation family living together in a big house.
And because the load profile generator provides a very
flexible framework for modelling the behaviour, it’s easy
to make changes.
For example one might want to analyse what happens to
the energy use when instead of working 8 hours per day
the person switches to a part time job. In a load profile
generator based on stochastic data this would mean
recalculating the probabilities for all the devices. With
the behaviour based load profile generator one just
switches the duration of the job from 8 to 4 hours and the
software calculates all the rest. Because the person is
coming home earlier, he will probably cook at home and
then based on the programmed desires spend the
afternoon for example with watching TV.
Obviously there are huge variations in the behaviour of
different people in different households. It was decided
that instead of trying to model an “average” household,
whatever that might be, it would be more useful to model
various concrete examples. The examples were based on
either personal experience or small surveys. The load
profile generator contains more than 100 devices, more
than 20 different households, is completely customizable
and available for free under [7].
4. Applications of the Load Profile
Generator
The purpose of the load profile generator is split in two
major areas: One is providing load curves for simulating
and testing hybrid systems and the other one is providing
realistic load curves for a better understanding of the
power flow in the grid.
Hybrid systems are systems that contain at least some
sort of power generation unit and some sort of storage
device. One example might be a photovoltaic array
combined with a battery, a combination of battery, fuel
cell and electrolyser or a fuel cell with a microcombined-heat-power-plant (micro-CHP-plant).
These combinations of various devices all have in
common that their usefulness depends very much on the
5. Analysing a low-voltage grid
Validating the load profiles is no easy task since there
simply aren’t any detailed, individual measurements
available for a large number of households. The only
measurements available to the authors for the task are
from the measurement of a substation in 2010.
The task of determining the individual load profiles from
that is a bit like determining if the number 10 was created
by adding 5 + 5 or 8 + 2.
Due to the impossibility of this the following approach
was used: First in cooperation with the local utility it was
determined how much electrical energy was used in each
house per year and how many households are in each
house. Due to privacy concerns house numbers were
randomized to protect the consumer. Because the
intention of this paper is demonstrating the feasibility of
the described approach the randomization does not matter
in this case. To analyse a real low-voltage grid the real
energy consumption would have to be used.
Based on the provided house data, the correct number of
household profiles was generated with approximately the
same amount of yearly energy use. After that the profiles
for each household were added up to combined load
profiles for each connection point.
The result of a) adding up all the load profiles and b) the
measurement at the substation is shown in figure 5.
800
consumption S in kVA
energy use in the household: If all power generated by
the PV is used right away, the battery will be pointless.
On the other hand, if there is no power use during the
day, then without the battery it won’t be possible to keep
the generated power from the day to the evening. So to
properly size these devices and to ensure that the control
algorithm are able to deal with the various problems like
vacations, sudden illness with the associated higher
energy use or even shift workers, realistic load profiles
for a lot of different situations are needed.
The other application of the load profile generator is
shown in this paper. For the future it is planned to use
this approach to help with predicting the energy use in a
household. This could work by automatically identifying
the devices in a measured load profile [8] and estimating
device usage. Furthermore, there are automatically
finding parameters to generate a new household. This
feature is not implemented yet though.
measured load profile
simulated load profile with load profile generator
700
600
500
400
300
200
100
0
0:00
12:00
0:00
12:00
0:00
12:00
0:00
12:00
0:00
12:00
0:00
time in h
Fig. 5. Comparison between measured load profile and
simulated profile on the substation
The interesting part is now the comparison of the power
flow simulation when using the same, scaled down
standard load profile at each house versus using the
simulated load profiles. Figure 6 shows this comparison
for households with the same energy consumption.
Fig. 6. Comparison between simulation of load profiles and the
standard load profiles
Due to the varying load, previously assumed power
reserves in the grid for charging electric vehicles might
be a lot smaller than originally calculated and a charging
management system will probably be needed a lot earlier.
In former works the capacity to charge electric vehicles
depends on the utilization of the transformer [1]. With
the simulated load profiles the utilization of the lines
turns out to be an important issue too. Figure 3 shows
this different line utilization. The simulated load profiles
reduce the capacity for charging electric vehicles
sometimes by half. This problem will be analysed in
more detail in future research.
The situation becomes even more interesting when a
large photovoltaic system is placed in one of the houses:
While a simulation using the standard load profiles
shows the house is dependable energy exporter on sunny
days, the simulation with the more realistic simulated
load profiles shows that it’s rapidly oscillating between
drawing power from the grid and providing power. While
it’s widely known that this happens for a single house,
the result of what happens to the power flows in a grid in
such cases is very important for substation planning.
6. Conclusion
In this paper a new type of load profile generator was
introduced. It has been used to generate individual load
profiles for every single household attached to a
substation.
It has been shown that adding up the simulated load
profiles from the load profile generator yields a new load
profile that is very close to measurement of the load
profile on a substation. Therefore the individual load
profiles and the method of adding up the profiles seems
to be valid.
Using the individual load profiles for each household it is
easily possible to do a realistic analysis of the power
flows in a low voltage grid which yields considerably
better results than simply assigning a scaled down
standard load profile to each node in the grid.
Additionally it has been shown that using the scaled
down standard load profiles in a grid with for example
medium to large photovoltaic systems yields very
different load flow results than using the standard load
profiles.
Acknowledgement
This work is one part of the research group smart
distributed power-storage systems and is supported by
the European Social Fund.
References
[1]
A. Grandjean, J. Adnot, G. Binet, A review and an
analysis of the residential electric load curve models,
Renewable and Sustainable Energy Reviews, Volume
16, Issue 9, December 2012, Pages 6539-6565, ISSN
1364-0321, 10.1016/j.rser.2012.08.013.
[2]
J. Teuscher, A. Götz, W. Schufft: “Electric vehicles
and their effects in low-voltage grids“, ICREPQ’11.
Las Palmas de Gran Canaria, 2011
[3]
R.D.
Zimmermann,
C.E.
Murillo-Sánchez:
MATPOWER 4.1 User’s Manual, Power Systems
Engineering Research Center (PSERC), 2011
[4]
Pflugradt, N.; Platzer, B.: Behavior based load profile
generator for domestic hot water and electricity use:
Innostock, 12th International Conference on Energy
Storage, Lleida (Spain), 2012
[5]
Jordan, U.; Vajen, K.: DHWcalc: Program to generate
domestic hot water profiles with statistical means for
user definied conditions. In: Goswami, D. Y. (Hrsg.):
Proceedings of the 2005 Solar World Congress.
Orlando, Florida, USA, August 6 - 12, 2005. Boulder,
Colorado 2005.
[6]
Dörner, D.: „Bauplan für eine Seele“, RowohltTaschenbuch-Verl, Reinbek bei Hamburg, 2008,
ISBN 3499611937
[7]
Pflugradt, N: Online-Load-Profil-Generator, www.tuchemnitz.de/~noah, 22.10.2012
[8]
Hart, G. W.: Nonintrusive appliance load monitoring,
In: Proceedings of the IEEE 80 (12), S. 1870–1891.,
1992