1
WEBFOCUS NEWSLETTER
1
New MR Developer for Windows
1
From Where I Sit:
A Spring Well Sprung
2
A Brief Introduction to the
Business Intelligence Dashboard
3
Stack Notation and Field Descriptions
4
Conditionally Styling Reports
in the Report Painter
HTML Tools Customization Tips
Using a Subroutine to
Handle Unconsolidated Data
Focal Point: A Growth Community
The WebFOCUS
Connector for Excel
New MR Developer
for Windows
by Chima Ngene
by Jim Thorstad
I
THIS ISSUE
The WebFOCUS Connector for Excel
July 2003
Information Builders, Inc.
Vo l u m e 4 N u m b e r 3
5
6
magine an application environment that
combined Microsoft Excel’s user interface and
computational prowess with the high capacity
for server side-processing and database access of
Information Builder’s WebFOCUS.
That’s what you get with the WebFOCUS
Connector for Excel. What’s more is that this
WebFOCUS solution not only leverages the
strengths of Microsoft Excel, but quite seamlessly integrates and delivers a closed-loop
Business Intelligence solution that operates
against a database.
Excel spreadsheets reading and writing to a centralized database offer many advantages to
more than just the users. For example, after
Excel does the number crunching there is no
need for manual and redundant data entry to
store the resulting data in the corporate database. This integration is made possible in part
through the Connector’s facility that maps the
database tables and columns into a customized
Excel spreadsheet. On the Excel spreadsheet
those rows and columns may not have the same
structure or design of the database.
In this article we are going to review the Excel
Connector IBI-WORK-AREA, which is where
this critical data mapping data is defined.
The Excel Connector solution is composed of
three main components:
• WebFOCUS Maintain
• WebFOCUS Reporting
• Microsoft Excel
7
8
Information Builders, Inc.
I
n WebFOCUS Version 5 Release 2.3, we are
responding to customer feedback with a new
offering tailored to the needs of Managed
Reporting developers. That offering is
WebFOCUS Managed Reporting Developer for
Windows.
The name is a mouthful, but we expect the MR
Developer to be received well by customers currently using the full Developer Studio product
to create and manage domain content. This is
because the full product has built-in features
many customers don’t need, and they include
MR Administration, Maintain, and Project
Deployment.
MR Developer was actually introduced to the
Information Builders Fee Schedule in April
2003, although that was merely a pricing action
and still resulted in a shipment of the full
Developer Studio product (with an implied
agreement to only use it for MR development).
Now in 5.2.3, a new license key is sent to customers to install Developer Studio with the
appropriate new behavior.
During installation, you will notice that you are
not presented with options to install a
WebFOCUS Reporting Server. You also do not
need to have a local web server on your workstation. This is because MR development is typically done on a remote WebFOCUS environment shared by all the developers. You can do
local MR development (for a standalone demo
at a trade show or a meeting) but you will need
to use the WebFOCUS Client and Server CDROMs and install those products separately.
To begin, the user must first open the
WebFOCUS Connector for Excel. This file is an
Excel document that can be opened from the
local computer file system, shared network
drive, or even from an e-mail message as an
attachment.
Once you open MR Developer, the first thing
you will notice is that the Projects on
localhost node no longer appears displayed
in the Explorer tree. As I mentioned before,
MR development is done exclusively from the
WebFOCUS Environments tree in Explorer.
(continued on page 9)
(continued on page 11, column 2)
WEBFOCUS NEWSLETTER
From Where I Sit…
A Spring Well Sprung
Larry Eiss
A
lot of new things have happened since the
last issue. A scant two weeks after I penned the
last column my first grandchild was born. The
young fellow weighed in at eight pounds, seven
ounces. As some of you can attest, it is an amazing thing when your kids have kids.
Spring sprung well too. In fact, the more I think
about it, the more apropos the words of that statement seem as a description of what happened. It
seems like it has rained every day since March 1
around here. Streams are full, springs have sprung
up where I have never seen them before, and my
well is having no trouble keeping up with
demand — most definitely a spring well sprung.
During the few dry times we’ve had, my wife and
I have cut grass. From our perch on lawn tractors
we have seen many of the new things this spring
has brought:
• A pair of Canada Geese nested near the pond
and hatched out five goslings. We watched
them on one of their first forays into the
world.
• The red fox family added five pups this year
as well, one for each gosling as it appears. So
much for forays into the world.
• The deer added fawns, and two of them romp
and play on our lawn under the watchful care
of their mother.
• Young groundhogs too have ventured out.
• An olive-sided flycatcher nested above the
light near my front door. The egg from which
her baby hatched is no larger than your little
fingernail.
• The muskrats are hard at work undermining
my lawn to create homes for themselves that
become sink-holes for me.
2
• Just last night I returned home to the news
that a large snapping turtle was laying eggs
behind my shop. She was still there hard at
work when I left this morning. She’ll lay
between 60 and 110 eggs and, depending on
the weather, we’ll see the hatchlings later this
year or next spring.
Here at Information Builders, there are plenty of
new things popping up as well. When WebFOCUS
Developer Studio Release 5 was made available, it
contained nearly 150 new features. That’s a lot to
assimilate.
When reading the product documentation, some
people come away with the impression that a web
server must be installed on the PC where
Developer Studio is running. This is not the case.
It’s true that a web server is required if application
development must be done without the benefit of
a connection to the WebFOCUS environment on
your network, but Developer Studio can be
installed another way as well — I call it “Thin
DevStudio.”
Thin DevStudio places only the Developer Studio
GUI on the local PC. The web server, Web
Application Server, and WebFOCUS Reporting
Server reside somewhere else. This provides distinct benefits. For example, a team of developers
can work on a Project on a remote computer and
use version control software to manage the source
code and other application components.
Another new thing is the Managed Reporting
Developer Edition of Developer Studio. This edition provides functionality like the browser-based
Domain Administrator has. It’s great for developing Managed Reporting applications because it
removes the Projects from view and lets developers work exclusively in the User Administration
Services repository.
More changes are on the horizon, and I’ll discuss
some of them in coming columns. Rain or shine,
from where I sit, new is great. Now where did I
leave that rocking-horse pattern? ◆
J u l y
2 0 0 3
WEBFOCUS NEWSLETTERE
A Brief Introduction to the
Business Intelligence Dashboard
to be shown in a Dashboard view. The Dashboard
front end depends on you; it has no particular
look because you have total control over what
appears in each view.
by Emma Schwarz
You can use your own corporate logo and colors
to customize the Dashboard and make it look like
your own product. You may also create departmental sites using different colors, logos and
reports. Since many different Dashboard views are
available, only one WebFOCUS installation is
needed to deliver multiple views at one site.
T
he WebFOCUS Business Intelligence Dashboard, otherwise known as the Dashboard, is a
thin-client front end that gives you the ability to
control and organize how reports are delivered to
the desktop.
Dashboard access is through
Microsoft’s Internet Explorer
browser. The Dashboard also
supports the Netscape 7 browser, but on a limited basis.
Dashboard users are Managed
Reporting users and have the
same properties and privileges
in both tools. The Dashboard
puts a new face on reports and
data available in the Managed
Reporting Repository.
If you have MRE releases 4.3.6
or 5.2x installed in your
machine, you also have the
Dashboard. There are additional configuration steps for
Release 4.3.6, but in more
recent releases the Dashboard is
available
with
every
WebFOCUS Managed Reporting installation. If you have
Managed Reporting Release
5.2x installed, use the URL
http://localhost/ibi_apps/bid to
get to the Dashboard index
page. From the index page,
administrators can access the
View Builder and users can
display Dashboard views.
The
Dashboard
is
administered using a
point-and-click
tool
called View Builder.
The
administrator
selects the logo, colors, composition and
reports to be shown
in a Dashboard view.
The Dashboard front
end depends on you;
it has no particular
look
because
you
Authenticated users can build
content pages that organize how
reports are delivered to their
own Dashboard view. In addition, authenticated users can put
reports into a list of favorites
that may appear on a banner
link or be displayed right in the
Dashboard main page.
This list can transcend domains,
so if you regularly run reports
from more than one domain,
“favorites” lists can make getting
to those reports a whole lot easier by making it possible for you
to group the reports together. In
addition, authenticated users
have all the functionality currently available to them in
Managed Reporting.
With the Dashboard, Information Builders has also introduced the concept of a “public”
user. The public user does not
enter a user ID and password in a
login page, but instead goes
directly into the Dashboard
Public View for limited access
to reports.
The
administrator
builds
Public user access is carefully
have total control
Dashboard views for various
controlled through the Dashgroups of users. The view can
board and Managed Reporting.
over what appears in
be based on the Managed
The administrator decides what
Reporting
group
through
the public user can see and how
Group Views, or any group of
he or she sees it. A kiosk applicaeach view.
users through Public Views.
tion is a typical use for a public
The administrator controls the
view.
look of the Dashboard for all
views. Each view the administrator builds can
Looking for more information? Check out the
have different looks and report access levels.
Managed Reporting Administrator’s Manual, and its
companion end user manual. Both are available at
The Dashboard is administered using a point-andhttp://www.informationbuilders.com under Serclick tool called View Builder. The administrator
vices
and Support Documentation. ◆
selects the logo, colors, composition and reports
Information Builders, Inc.
3
WEBFOCUS NEWSLETTER
Stack Notation
and Field Descriptions
stack row, then you should not use this notation.
If your stack never has more than one row, or you
are only interested in the data in the first row,
then this is fine. Otherwise you should not use
this.
by Mark Derwin
The second, STACK().FIELD, is the same as
STACK(Stack.FocIndex).FIELD, or the curately I’ve seen applications in which the data rently displayed or selected field. If a user makes
appearing on the screen, or being used in calcula- a selection from a list box, combo box, or radio
tions, is not what the developer is
group, and that object is popuexpecting. This is because of the
lated from a stack, then
way that the field is populated on
Lately I’ve seen applicaSTACK().FIELD contains the
the screen or the notation used in
selected value. If you are
the calculations. So here is a short
scrolling through a stack and
tions in which the data
refresher on how to reference
displaying one record at a
fields in a stack and how to poputime, the currently displayed
late fields on a form.
record is STACK().FIELD. If
appearing
on
the
you wanted to display the
selected record in a new stack
Stack Fields
you could use this:
screen,
or
being
used
in
When data is loaded into a stack,
Copy From Stack() Into
columns and rows are created.
Stack2
The columns are the names of the
calculations,
is
not
what
fields (either from the database or
computed) and the rows are
Field Descriptions
instances of the data. So, the folthe developer is expectFields displayed on a screen
lowing command:
can come from three places: a
FOR ALL NEXT MOVIECODE INTO
stack, the database or a coming. This is because of
MOVSTK
puted variable. Most of the
time, you will want the data to
come from a stack. This makes
Creates a stack with nine columns
the way that the field is
it easier to manipulate.
(Moviecode, Title, Category,
etc.) and 60 rows because that’s
how many rows are in the datapopulated on the screen
When you place the object on
base. To reference any cell in the
the form, the field name is
stack you use the notation:
prefaced by either the stack
StackName(Row).Field. If you
or the notation used in
name or the database name. If
wanted to reference the fifth title
when running your applicain the stack you would use
tion you see the last record in
the calculations. So
the stack, instead of the selectMOVSTK(5).TITLE
ed one, it means that you
dragged the database segment
here is a short refresher
Here, I explicitly used the row
onto the form instead of the
number. However, you can use
stack. You will have to remove
any variable or expression that
those fields, then drag the
on how to reference
evaluates to an integer. You could
stack onto the form and redisuse
play the fields.
L
MOVSTK(MOVSTK.FOCCOUNT).TITLE
This is the last row.
There are two other notations of
which you need to be aware:
fields in a stack and
how to populate fields
on a form.
STACK.FIELD and STACK().FIELD
The first, STACK.FIELD, is the same as using
STACK(1).FIELD or the first row of the stack. If
you want to operate on the current or selected
4
I am not going to go into computed fields on forms because
these don’t come from the
database and can only have
one value at a time.
So, be careful when displaying
and manipulating your data
and stacks. Make sure you’re seeing what you
expect to see and using the correct data. ◆
J u l y
2 0 0 3
WEBFOCUS NEWSLETTERE
Conditionally Styling Reports
in the Report Painter
by Richard Kwiatkowski
F
OCUS offers developers a powerful and flexible language to create and format tabular reports.
While these reports offer all the information an
organization requires, they may be lacking aesthetically.
•
3
Apply styling options to the report element
that the output displays when the condition
is met.
Example: Font Color equals Red
Column Justification equals
Center
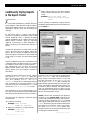
Once a condition is defined for a report element,
the Field Properties dialog box looks like what you
see in Screen 1.
To add visual cues to a report, and perhaps
improve its readability, developers need to add
FOCUS StyleSheet code, a separate language.
Coding StyleSheets can be a tedious process. The
Report Painter, however, offers an improved
graphical environment to assist developers in
adding conventional and conditional styling to a
report.
Conditional styling does not need much of a definition. The name says it all: Report output displays a value or component differently from the
rest of the report. For example, if sales are below a
critical level for a region, the sales values appear
in red.
Versions of Report Painter prior to Release 5.2 let
a developer apply conditional styling to a report
but offered a small subset of styling options —
font, background color and grid. The current
Report Painter offers many more conditional
styling options and also supports conditional
drill-downs.
To apply conditional styling to a column, a developer uses the Field Properties dialog box,
which he or she may access by right-clicking a column and selecting Options. The Field
Properties dialog box is a redesigned interface
that organizes all of the styling options into a
common dialog box. The dialog box’s Style tab
contains the Conditional Styling controls.
The combination of the conditional styling controls with the styling options allows developers a
fuller range of styling options for a true condition.
The basic steps for applying conditional styling
are as follows:
•
1 Create the condition.
•
2
Example: SALES GT 15000
REGION EQ ‘Northwest’
Apply the condition to a report element.
Example: Column Data
Column Total
Information Builders, Inc.
Notice the name of the condition appears below
the Unconditional label. You use these labels to
apply styling to the report element, in this case
the data component of the DEALER_COST column. If the Unconditional label is selected, the
Report Painter applies the styling to the report element, and sample output reflects this change. If a
conditional label is selected, the Report Painter
does not automatically apply the styling to the
report element, but rather this change is reflected
only in the actual report output.
Screen 1
Screen 1 shows that a developer has applied a
condition to the Column Data component of a
column and has assigned styling to the condition.
The plus (+) sign to the left of COND0001 indicates
that styling is associated with this condition. The
Sample window shows how the actual data values
will appear if the condition is met. In this example, when a DEALER_COST cost is greater than
$15,000 the font for the value becomes white and
the background becomes black.
(continued on page 8, column 2)
5
WEBFOCUS NEWSLETTER
HTML Tools Customization Tips
by Laura Drezek
W
ith the HTML Report and Graph Assistant
tools acting as the default ad hoc tools in
WebFOCUS and Developer Studio’s Reporting
Objects Component, we get many requests from
customers for customization of the product.
One of the most common customization requests
is for the ability to customize the field list display.
In this article, I will share a technique on how to
accomplish this.
Very often the names for fields are not intuitive or
descriptive enough for the ad hoc user, so the
request is to have the DESCRIPTION be the first
column in the field list. This way the first thing
users see when they look at the list is the description.
Here’s how to make this change.
The field list is built using the JavaScript file,
fldlst2.js, located in the /ibi_html/
javaassist/ibi/html/assist directory. The
JavaScript file unchanged contains the following
variables and values:
var
var
var
var
var
var
var
var
bShowName = true;
bShowAlias = true;
bShowTitle = false;
bShowRemarks = false;
bShowFormat = true;
bShowDescription = false;
bShowSegment = true;
bShowFilename = false;
Looking at the above code you will see that the
default for the fields list is Name, Alias, Format
and Segment. If you look at the Screen 1, you will
see the default field list for the CENTINV data
source.
Screen 1
To make the Description the first column, we
need to change the fldlst2.js file to read as follows:
var
var
var
var
var
var
var
var
bShowName = false;
bShowAlias = false;
bShowTitle = false;
bShowRemarks = false;
bShowFormat = false;
bShowDescription = true;
bShowSegment = false;
bShowFilename = false;
With those changes, the fields list will appear as
shown on Screen 2.
After you make DESCRIPTION the first column in
your fields list, the change will be reflected on the
Fields tab only, though you can get to the fields
list from several places in the tool. You will notice
that the change is reflected in the Managed
Reporting Environment and the Business
Intelligence Dashboard.
As you can see, this is an easy change that could
make your life much easier when using the product. And there are many more customization tips
that I will share with you in future issues of the
WebFOCUS Newsletter. ◆
Screen 2
6
J u l y
2 0 0 3
WEBFOCUS NEWSLETTERE
Using a Subroutine to
Handle Unconsolidated Data
by Harry Lotrowski
T
he WebFOCUS Financial Reporting Platform
has the ability to create reports from data sources
regardless of whether the data has been consolidated.
Sometimes the data is held in a native accounting
format (Figure 1). In this format, revenue figures
are stored as negative numbers. On the financial
report though, the detail numbers would always
be shown as positive numbers, but would be
aggregated in respect to the sign.
This will require a COMPUTE for the display field.
In this situation, or where multiple lines have
been combined as one, the value of the FOR field
(continued on page 13)
Figure 1
Information Builders, Inc.
7
WEBFOCUS NEWSLETTER
(Styling Reports continued from page 5)
Focal Point:
A Growth Community
by Monica McDonald
T
he Information Builders Product Marketing
division is posting new content for developers on
Focal Point. Coming soon and not to be missed
are the WebFOCUS Developer Studio minitutorials.
These mini-tutorials will be short lessons designed
to help users quickly start running the Developer
Studio product. The first mini-tutorial to be posted is "Creating a New Project." Others to follow
include:
• Setting up an ODBC Data Source
• Setting up a WebFOCUS Data Adapter
• Creating Metadata
• Adding Virtual Fields to Metadata
• Creating a Data View
• Creating Your First Developer Studio Report
In addition to these mini-tutorials, there is a lot
more activity at Focal Point. The section called
Information Builders’ Forum is generating a lot of
interest and excitement among our development
community, and it continues to grow everyday.
The forum had 266 registered users as of this writing. These users hail from more than 50
Information Builders customer sites.
Users come from a variety of industries, including
telecommunications, the public sector, insurance
and financial services. About 6 percent of registered users log in from outside the United States.
Users visit the Information Builders’ Forum to
share FOCUS and WebFOCUS tips and techniques
on the message boards. Check out these postings
at http://forum.informationbuilders.com.
While you’re there, be sure to take a look at the
recent changes we made to the Information
Builders’ Forum based on feedback from our visitors. Most notably, we have added a category for
Maintain users and a section for vendor postings
where Information Builders Product Managers
will be making announcements and asking for
product feedback. There will also be outreach programs posted under “Vendor Postings.”
In the near future, Information Builders will create a category for users of iWay products. Be sure
to check back with us regularly and don’t forget to
give us your feedback. What would you like to see
on Focal Point or the Information Builders’
Forum? Let us know by posting under “Web Site
Feedback.” ◆
8
An enhancement to the 5.2 version of the Report
Painter is the ability to apply conditional drilldowns to a report. A Conditional drill-down
behaves much the same way that conditional
styling works. When a report element meets a
condition, that element becomes hyperlinked and
the drill-down becomes active.
A developer applies a conditional drill-down from
the Drill Down tab on the Field Properties
dialog box. The steps to apply a conditional drilldown are the same basic steps for applying conditional styling to a report element, except that
instead of defining styling, you define a drilldown scenario.
Let’s take a look under the covers at the code that
Report Painter generates for conditional styling.
When a developer creates a condition the Report
Painter writes a Macro StyleSheet block that
names the condition (COND0001) and specifies
the condition that must be met (N2 GT 15000).
DEFMACRO=COND0001,
MACTYPE=RULE,
WHEN=N2 GT 15000,
At this point, the condition has not been applied
to a report element for a reason. The Report
Painter creates the Macro so that this condition
can be applied to other report elements. If the
Painter applied the condition directly to the
report elements StyleSheet block, that condition
would not be available for other report elements.
Once the condition is created and the Painter
writes the Macro block, the developer can apply
styling, including drill-downs, to a report element. The Report Painter writes the following
StyleSheet code:
TYPE=DATA,
COLUMN=N2,
FONT='ARIAL',
COLOR='WHITE',
BACKCOLOR=RGB(64 0 64),
STYLE=BOLD,
MACRO=COND0001,
This StyleSheet code shows the report element
(the data component of column N2), the styling
options (Arial, white, bold font, with a background color) and the condition that must be met
(COND0001). ◆
J u l y
2 0 0 3
WEBFOCUS NEWSLETTERE
(Connector for Excel continued from page 1)
Because the Excel Connector has been pre-configured, it is immediately ready for use once opened.
By clicking the Load button, the Excel Connector
populates the spreadsheet with data that comes
directly from a database.
Q: Is there any support for security?
A: Yes. Security measures are available at every
juncture.
Q: Does it support multiple tables?
The user can then apply edits to the spreadsheet.
To commit any edits to the database the user
clicks the Save button.
A: Yes. Through the simple use of JOINs, multiple database tables can be read from and
written to.
Figure 1
Behind the Scenes: Loading and Saving
The IBI-WORK-AREA
When the user clicks the Load button, the Excel
Connector invokes a WebFOCUS report. This
report simply issues TABLE FILE syntax to print
the database key columns and desired data fields.
The output of the report is stored on a dedicated
worksheet named IBI-WORK-AREA. It then uses
its data mapping information to populate the customer spreadsheet with data from the report. And
when the user clicks the Save button, it again
uses the data mapping information to copy the
custom spreadsheet values back into the IBIWORK-AREA, where it is then sent to a WebFOCUS
Maintain procedure for saving.
The IBI-WORK-AREA is a dedicated worksheet
within the Excel connector used by the
WebFOCUS Connector to temporarily store data
and describe its operational environment. The
information stored in the IBI-WORK-AREA
includes the following:
• System Information
• Mapping Information
• Storage space for temporary data
System Information
A: General knowledge of the Excel user interface is all that is required to use the
WebFOCUS Connector for Excel.
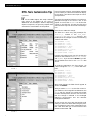
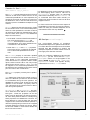
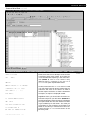
The System information described by WebFOCUS
Connector for Excel identifies the WebFOCUS
Environment and high-level operational data. As
depicted in Figure 1, the label appears in column
A and the values to be used are stored in column
B. All field labels includes a help description
explaining their purpose. Placing the mouse
pointer above the red triangle will reveal this help
text.
Q: Do I need to learn Excel VB programming
language in order to configure and set up?
The www field, identifies the web server host
machine and the protocol to use when connecting to it (either HTTP or HTTPS).
Commonly asked questions regarding the Excel
connector include the following:
Q: What types of skills are required to use the
WebFOCUS Connector for Excel?
A: No. The Connector for Excel has built-in
macros to support a wide array of spreadsheet configurations. To set up the Excel
Connector to use another database, general
knowledge of WebFOCUS Table and
Maintain is all that’s required.
Information Builders, Inc.
The WebFOCUS CLIENT field identifies the path to
the WebFOCUS Client, which is either the CGI or
ISAPI implementation.
Node identifies the WebFOCUS Server. This is the
node name defined in the WebFOCUS Client’s
ODIN.CFG file.
9
WEBFOCUS NEWSLETTER
(Connector for Excel continued)
Figure 2
The Application field provides a qualifying
application name and path for the WebFOCUS
Table and Maintain procedures. When the Excel
Connector needs to invoke a WebFOCUS procedure it will use this application path at run-time.
If supplying more than one application name,
separate them with a space character (not comma
or dash).
FOC_WRITE identifies the name of the WebFOCUS
Maintain procedure. The Maintain procedure is
called when performing save operations. The cell
adjacent to it, C5, can be used to pass additional
parameters to the Maintain procedure.
The FOC_READ field identifies the name of the
WebFOCUS Report. The reporting procedure
(Table) is called when performing load operations. The cell adjacent to it, C6, can be used to
pass additional parameters to the reporting procedure.
The Reserved field can be used for two distinct
purposes. When its value is set to "version," the
product version number of the Excel Connector
appears when the user clicks the Load button.
When the Reserved field has a value of "debug"
both load and save operations provide more output to the user, such as the parameter and values
that are passed to the WebFOCUS Client.
Max_Row_Count controls the size of the transaction block sent to WebFOCUS Maintain during
save operations. Its number represents the number of database rows that are passed to the
Maintain procedure at a time.
The Authenticate field controls the prompting
for the user name and password during load and
save operations. When it has a value of “Yes,” the
user will be prompted for a name and password.
Starting_foc_error_row tells the Excel
Connector where it should look to identify
WebFOCUS Error codes within the IBI-WORKAREA worksheet.
10
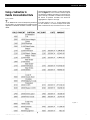
Mapping Information
The Mapping information describes how information from the WebFOCUS report is stored in the
custom spreadsheet (sheet1). The Excel
Connector does not require mapping information
for all columns in the WebFOCUS report.
However, it requires an entry for each column in
the report representing a database key field, and
each database column representing data on the
custom spreadsheet (sheet1).
The column mapping information defined in the
IBI-WORK-AREA starts at Cell D14 for the first
column, Cell E14 for the second column, Cell F14
for the third column and so on. Each mapped column has properties used by the WebFOCUS
Connector, and these property values appear in
their respective column on different rows. The
column property names are in Cells C14 thru C23
(Name, Source, Destination, Delta X, etc). See
Figure 2.
The Name property represents the actual column
name and should appear exactly as it does in the
database/report.
The Source property identifies the first cell containing data for its column in the IBI-WORKAREA temporary storage. The work-area temporary storage is used to hold output from the
WebFOCUS report. It appears after the load operation.
Destination property identifies the first cell in
the custom spreadsheet (sheet1) where the named
column data is to be mapped to. It is important
to note that an Excel named range can be used for
this type of reference. If a named range is moved
to another part of the spreadsheet, the
WebFOCUS Excel Connector mapping information still applies, and does not require change.
To create a named range, navigate to the desired
destination position on sheet1 and select the
Insert->Name->Define menu item. Enter the
desired name and click the OK button. The destination value in the IBI-WORK-AREA can then be
entered exactly as follows (where Type_of_service is the named Range):
J u l y
2 0 0 3
WEBFOCUS NEWSLETTERE
(Connector for Excel continued)
=CELL("address",Type_of_Service)
The Delta X property determines the horizontal
direction of data for the named column on the
customized spreadsheet. Its value represents the
number of horizontal cell positions to travel from
the Destination cell to store the data series from
the report (rows in the WebFOCUS Report for said
column).
Delta Y determines the vertical direction of data
for the named column on the customized spreadsheet. Its value represents the number of vertical
cell positions to travel from the Destination cell to
store the data series (rows in the WebFOCUS
Report for said column).
To designate a column as the internal key column
for data mapping, enter a value of "Set" into its
Destination.X property when its customized
data travels horizontally. Use Destination.Y if
its customized data series travels vertically on
sheet1. Then enter the value of "Get" into all other
mapped columns.
In a future article we will discuss more aspects of
the WebFOCUS Connector for Excel and demonstrate how easily the available templates can be
customized to work with any database. ◆
• As the Excel Connector identifies the Destina- ( M R D e v e l o p e r c o n t i n u e d f r o m p a g e 1 )
tion cell by applying the Delta.X and
Delta.Y, that new position becomes the
next Destination cell to apply the deltas to as
it traverses thru the data series.
• When the Delta
X and Delta Y properties
have a value of zero, no data will be mapped
to the customized spreadsheet for that column.
The Distinct property is used when repeated
data in the named column should not continuously appear in the customized spreadsheet
(much like when the BY keyword is used in a Table
report). When its value is set to "Yes," only unique
values for the column in the IBI-WORK-AREA will
be mapped to the customized spreadsheet. For
this feature to be most effective, the report should
print the column with sorted values.
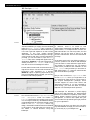
The project-based features of Developer
Studio/Power Reporter are geared toward self-service and/or Maintain development and have been
removed from MR Developer to simplify the
developer’s experience. Certain toolbar icons that
don’t apply have also been removed.
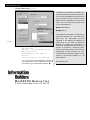
When you configure a WebFOCUS environment
in Explorer, you will notice that the Project
Development button no longer appears in the
dialog (Screen 1). The Managed Reporting/
ReportCaster button now appears directly
underneath the WebFOCUS Client button.
The Reserved property currently has no production uses.
Save determines if data for the named column is
sent to the Maintain procedure to be committed
to the database during the save operation. All
database key columns must be sent for the save
operation to be successful. A property value of
"Yes" indicates that the named column’s data is
sent during save operations.
Destination.X and Destination.Y are without a doubt the most difficult to comprehend.
Here goes… These two properties can be left
blank, but their applications do offer some practical value. How practical? When to use? By using
these properties the WebFOCUS Connector for
Excel attempts to track the data that has been
mapped to the customized worksheet (sheet1). It
does this by designating a column that is mapped
to sheet1 as being an internal key column. When
the end user deletes or moves it from sheet1, the
Excel Connector knows it.
Screen 1
Information Builders, Inc.
11
WEBFOCUS NEWSLETTER
(MR Developer continued)
Screen 2
The MR credentials you supply are now validated
before the Data Servers node is opened in
Explorer. If you are a Domain Administrator (this
is the user type that equates to an MR content
developer; in the 5.2.3 release Domain
Administrator was renamed Developer throughout the product) and don’t have the Data Server
privilege, you will be unable to open the Data
Servers node, and a message will appear with an
explanation (Screen 2). It proved impractical to
actually hide the Data Servers node in this
case, but we think the message will suffice.
Domain Administrators with the Data Server privilege will be able to view and edit the Server and
Application Path properties on a domain
(Screen 3), report or reporting object. But if you
don’t have the Data Server privilege, you will only
be able to view these properties.
Screen 3
12
You will also notice the Web Applications and
User
Management nodes are hidden in
Explorer because they do not apply to this product. You might wonder why an MR Administrator
using MR Developer for Windows shouldn’t have
access to the User Management feature. By
design, all MR administrative features are disabled
in this product. That means that you cannot create, delete, or rename Domains using MR
Developer.
In addition, there is no access to User
Administrator, Dashboard View Builder, PDA Sync
Administrator, or the ReportCaster Console. An
MR Administrator can use the product, but the
behavior will be the same as that of an MR
Domain Administrator who has the Data Server
privilege.
As we were putting this new offering together, a
common question was whether MR Developer
could be used to create self-service applications.
The answer is a qualified yes. You can certainly
create server procedures and metadata via the
Data Server node (provided you are either an
MR Administrator or a Domain Administrator
with the Data Server privilege).
But you can’t access the Web Applications folder from Explorer, which you might want to do
to create launch pages. And you cannot work in
the "Project development" paradigm, which
includes support for source code control and
deployment scenarios. If you are interested in
those things, you must use either the Power
Reporter or the Developer Studio products.
MR Developer for Windows is priced slightly
higher than MR Developer for Web Browsers
because of its additional capability (Task Viewer,
Report Painter, Resource Layout and Change
Management, to name a few). Speak with your
account team for help selecting the right products
for your organization.
We hope to hear from you about this new offering. Send feedback through your account team or
to me directly at [email protected]. ◆
J u l y
2 0 0 3
WEBFOCUS NEWSLETTERE
(Unconsolidated Data continued from page 7)
may not be readily available within COMPUTE
statements. When lines are combined, a COMPUTE
would pick up the lowest number as opposed to
the first account referenced.
To accommodate this situation, we have created a
new user-written subroutine called FMLINFO to
provide the ability to accurately determine the
FOR value. The syntax of this routine is
FIELD/XXX = FMLINFO(‘FORVALUE’,’XXX’)
where XXX is the format of the FOR field.
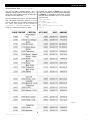
Consider the report in Figure 3 (on the next
page). If it is based upon the pre-consolidated data
in Figure 2, no aggregation takes place, and the
code can either be used to print or sum the data
as shown here:
TABLE FILE EXAMP
SUM AMNTS
AS 'CURRENT,MONTH,ACTUALS'
FOR
CHILD
1000 WITH CHILDREN ALL AS CAPTION
LABEL R1
Figure 2
Information Builders, Inc.
13
WEBFOCUS NEWSLETTER
(Unconsolidated Data continued)
Figure 3
However, to produce the same report on unconsolidated data similar to that of Figure 1, additional processing of the data is required. This is
where the FMLINFO functionality comes into play.
14
It allows you to reverse the sign before it is actually
written to the report page but after it has been aggregated. The code is as follows:
J u l y
2 0 0 3
WEBFOCUS NEWSLETTERE
(Unconsolidated Data continued)
Please note that the Use Multiple Values and the
Consolidate check boxes would be checked for
unconsolidated data reporting in the matrix window (Screen 1). The FMLINFO routine is only
effective within a compute. If you use it in a
DEFINE it will yield unpredictable results.
TABLE FILE EXAMP
SUM
AMNTS
NOPRINT
COMPUTE AMT/D12.2 = IF FMLINFO
('FORVALUE','A4') LT '2500'
THEN (AMNTS * (
-
1))
ELSE AMNTS;
AS 'CURRENT,MONTH,ACTUALS'
FOR
CHILD
1000 WITH CHILDREN ALL ADD
AS CAPTION LABEL R1
ON TABLE SET FORMULTIPLE ON
Information Builders, Inc.
Screen 1
Another area where the FMLINFO routine is used
is in drill-down financial reports. Assume that you
wanted to drill down on the actual FOR field to
another report. While the FOR field is selected for
the report, its caption is displayed instead.
Regardless of this, you should still choose the FOR
field as the object of your drill-down (Screen 2 on
the following page). When the report is displayed,
the caption field will have the underline indicating its availability for drill-down. The value you
would want to pass, however, would have to be
based on the value you retrieved via a field computed using the FMLINFO routine shown in the
following code:
15
WEBFOCUS NEWSLETTER
(Unconsolidated Data continued)
The WebFOCUS Newsletter is intended to disseminate a wide variety of technical information to the entire WebFOCUS community. To
submit an article, send it via e-mail to Pedro
Pereira at pedro_ [email protected]. If you would
like to be on our mailing list, send an email
to [email protected].
Editor Pedro Pereira
Design Paul Lin
Screen 2
TABLE FILE EXAMP
SUM AMNTS
AS 'CURRENT,MONTH,ACTUALS'
COMPUTE ACTCHILD/A4 =
FMLINFO('FORVALUE','A4'); NOPRINT
FOR CHILD
1000 WITH CHILDREN ALL AS CAPTION LABEL R1
FMLINFO does not currently appear in the list of
user-written sub-routines. Please keep this article
in mind during your development efforts. ◆
WEBFOCUS NEWSLETTER
2 P e n n P l a z a N e w Yo r k , N Y 1 0 1 2 1
The WebFOCUS Newsletter is published by
Information Builders, Inc., Two Penn Plaza,
New York, NY 10121-2898. Opinions
expressed in the WebFOCUS Newsletter are
solely those of the authors. Information
Builders, Inc. assumes no responsibility or
liability for damages resulting from errors or
misuse of information contained herein.
Vendor names and products in this issue are
trademarked by their providers. All published WebFOCUS Newsletter material is copyrighted by Information Builders, Inc. All
rights reserved.
DN 7503250.0703