1
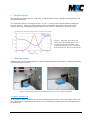
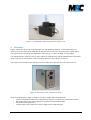
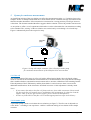
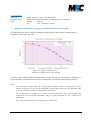
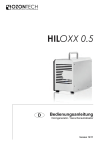
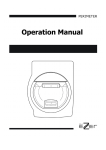
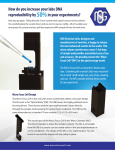
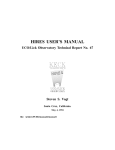
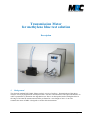
Transmission Meter
for methylene blue test solution
Description
1.
Background
The German standard DIN 52980 “Photo-catalytic activity of surfaces – Determination of the photocatalytic activity by degradation of methylene blue” asks for a measurement of the optical absorbance in
order to quantitatively determine the degradation rate. Due to an absorption band of methylene blue in
the range of 664 nm the measurement shall be performed at a wavelength of 664 ± 5 nm. The
transmission meter of MRC is designed to conduct this measurement.
Transmission meter user manual
version 2 – 25.04.2013
page 1 of 8
2.
Brief description
The transmission meter comprises a red LED, a calibrated photo-diode, a flexible mounting bracket and
the required electronics.
The LED emits light at a wavelength of 659 ± 11 nm, i.e. exactly in the absorption band of methylene
blue (see figure 1). A decrease of the methylene blue concentration thus leads to an increase of the
transmission of the LED light through the solution. This increase is measured by the photo-diode.
Figure 1: Emission spectrum of the
LED (red) and transmission curve of
methylene blue solution (blue). The
peak of the LED lies in the absorption
band of methylene blue around 664 nm.
3.
Mounting bracket
LED and photo-diode are integrated into a special mounting bracket which enables a flexible positioning
at different sample containers.
Figure 2: Mounting bracket in horizontal (left) and vertical (right) orientation
3.1. Option with flow cell
As an option we offer a modified version of the mounting bracket which can be connected to a flow cell.
The optoelectronic components are the same, but it is mechanically optimized for the small dimensions
of the flow cell.
Transmission meter user manual
version 2 – 25.04.2013
page 2 of 8
Figure 3: Combination of mounting bracket with flow cell
4.
Electronics
Figure 4 shows the front side of the electronic box with different elements. At the bottom there are
connectors for the cables of the LED and the photo-diode as well as for the transmission signal output.
The signal can be read out by any multimeter. Alternatively, it can be recorded on a data logger.
Two potentiometers at the top can be used to adjust the LED intensity and the amplification of the photodiode, respectively. The function of the saturation indicator is described in section 4.1.
The on/off switch and the connection for the power cable are on the rear side of the electronic box.
Figure 4: Electronics of the transmission meter
We have implemented a couple of features in order to enable stable measurements:
•
Current stabilization of the LED (compensation of power variations due to temperature drift)
•
Electronic chopper for offset suppression against room and ambient light
•
Electronic noise suppression
•
Coloured glass filter (Schott OG530) for suppression of ambient light
Transmission meter user manual
version 2 – 25.04.2013
page 3 of 8
4.1. Adjustment of the optimal signal range
The LED intensity and the amplification of the photo-diode should be adjusted in that way, that the
signal range for unbleached and maximally bleached solution is fully utilized. For this purpose a
preparation measurement with distilled water in the sample container should be performed under the
expected ambient conditions.
Hereby, the adjustment can be carried out in the following way:
•
•
LED intensity: The electronics can be adjusted to the maximum expected light intensities with
distilled water in the sample container. You should increase the intensity with the potentiometer
until the LED indicator marked with “Saturation” is not just yet shining. This process does not
depend on the chosen amplification.
Amplification of photo-diode: In order to adjust the amplification you should connect the
output signal to a multimeter. Still, you should have distilled water in the sample container. By
turning the potentiometer for the amplification you should reach a voltage of less than 5V. 5V is
exactly the saturation voltage of the amplifier. We recommend a value of about 4.5 V.
If you have a vertical orientation of the mounting bracket we recommend to place the photo-diode in the
upper position since it will catch less interfering background light in this position. In case of a bright
environment you can reduce the saturation limit. But this will limit the dynamic range (signal-to-noise) of
the photo-diode.
4.2. Option with fixed adjustment for the flow cell
As an option we offer an electronic control where the LED intensity and the amplification of the photodiode are already adjusted to fixed values. This option is usually chosen in combination with a flow cell.
It has the big advantage that – after a single calibration – you have a defined correlation between the
signal output voltage and the methylene blue concentration. The internal adjustments of the LED
intensity and the amplification of the photo-diode are optimized for transmission values which occur with
typical methylene blue concentrations according to the German standard DIN 52980.
Figure 5 shows a photo of the respective electronic box.
Figure 5: Electronic box of the
transmission meter with fixed
adjustments
Transmission meter user manual
version 2 – 25.04.2013
page 4 of 8
5.
System for continuous measurements
An insufficient mixing of the test solution can affect the measurement results e.g. if solution close to the
sample's surface is already bleached but the overall solution shows a different average concentration and
therefore another absorbance. If the transmission is measured at a wrong position you will get incorrect
values then. The German standard therefore suggests that the solution is stirred in periodic time intervals.
As an option we offer a set of components which make it easier to determine the concentration according
to the standard. The “stirring” of the test solution was carried out by recirculating it in a closed loop.
Figure 6 schematically shows the respective setup.
Peristaltic
pump
Flow cell
Figure 6: Setup with sample container, flow cell and peristaltic pump
for continuous measurements of the methylene blue concentration
5.1. Flow cell
The central element of this setup is a flow cell with a defined optical depth. Since the liquid column
which is relevant for the transmission measurement has a constant thickness, this setup has the advantage
that it enables absolute concentration measurements after a one-time calibration of the mounting bracket.
If the adjustment of the LED intensity and the photo-diode is carried out once there is no need for
additional modifications. In the electronics described in section 4.2 this adjustment is already made.
Notes:
•
•
If you connect the tubes to the flow cell please take care for a stable connection. Please avoid
any dye in the flow cell support since it would distort the measurement. It is hard to clean the
support. Thus, if any dye gets into the support, please contact the manufacturer.
In order to fix the tubes to the flow cell we include appropriate hose clips in the delivery.
5.2. Peristaltic pump
A peristaltic pump is used to recirculate the test solution (see figure 7). The flow rate is adjusted to a
value which – according to our experience– enables a sufficient mixing of test solution in the sample
container.
Transmission meter user manual
version 2 – 25.04.2013
page 5 of 8
Figure 7: Peristaltic pump at housing. The flow cell
with the connected tubes is mounted a the right side.
The peristaltic pump is integrated in a UV-stable aluminium housing so that it can be used directly in the
illumination chamber. There are screws at the housing to mount the flow cell. The pump is powered by a
wall power supply.
Notes:
(1) Especially when you replace the tubes it can happen that air is getting into them. Please make
sure that air is not accumulating at the transmission window of the flow cell where it would
distort the measurement. The elimination of air is easier if you turn the flow cell in an upright
position as shown in figure 3. If an air bubble is fixed to the transmission window (i.e. in a
stream burble), you can try to resolve and remove it by snapping with your finger and actively
moving the tubes.
(2) Please take care to keep the transmission window in a clean state.
(3) If the flow cell is wetted with methylene blue or other dyes you should recirculate it with distilled
water in order to avoid a dry coating.
5.3. Sample container
Figure 8 shows the example of a sample container which can be integrated into a closed loop. For an easy
performance of a continuous measurement we have equipped the container (diameter: 80 mm, height: 45
mm) with a top frame which carries tube connectors and a UV transmitting glass cover. The container
accepts samples with an area of 50x50 mm².
Note: The absorption of the chosen UV glass cover at a wavelength of 365 nm is about 11%.
The test solution in the container can be circulated through a flow cell by means of a peristaltic pump to
which the bracket for the transmission measurement can be connected. We have selected tubes which do
not absorb methylene blue and which are stable against UV illumination.
Transmission meter user manual
version 2 – 25.04.2013
page 6 of 8
Figure 8: Sample container with tube connectors
and glass cover
6.
Technical data
(subject to change)
Light source:
Kingbright L-1513SRC-C, Spectrum is shown figure 1
Photo-diode:
Centronic OSD15_5T
Wavelength range:
400 – 1.050 nm
Sensitive area: 15 mm²
Sensitivity:
0,21 A/W
Dark current: 3 nA
Figure 9: Left: Output signal of the photo-diode vs. intensity of a reference signal
Right: Spectral sensitivity of the photo-diode
Transmission meter user manual
version 2 – 25.04.2013
page 7 of 8
6.1. Accessories
Flow cell:
Peristaltic pump:
Tube:
7.
Hellma Analytics, 10 mm, 178.010-OS Z.8
Gemke LP 60, Rotational speed: 30 TPM, Flow rate ~ 14ml/min
at pump:
Silicone
else:
PVC / Thickness: 2.8x4.2
Appendix: Calibration of voltages vs. methylene blue concentration
The following figure shows voltages for different methylene blue concentrations recorded with the
transmission meter and a flow cell:
Figure 10: Typical calibration curve:
Voltages vs. methylene blue concentration
At the low right of the diagram the formula for the voltages and the dye concentration is displayed as a
result from fitting. The formula can be used to calculate the concentrations from measured voltages.
Notes:
•
The calibration strongly affects the resulting photo-catalytic activity. Coating of dyes or air
bubbles in the flow cell, dirt or debris and further aspects have an effect on the calibration. That
is why the calibration should be checked from time to time.
•
The measurement of voltages at a couple of known methylene blue concentrations and
comparison with the original calibration can give a good indication for the reliability of a
calibration.
•
Each calibration will lead to a new fitting curve and formula.
Transmission meter user manual
version 2 – 25.04.2013
page 8 of 8