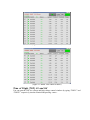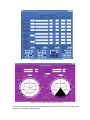
1
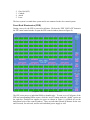
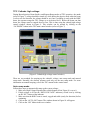
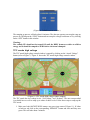
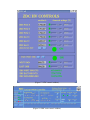
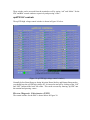
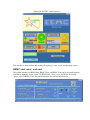
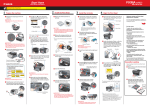
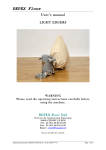
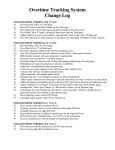
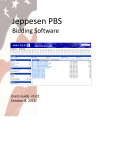
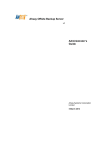
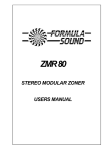
User Manual for STAR Slow Controls
10/21/2010
Revision 2.0: James Falconer Ross
Introduction
Most of the detectors used in the STAR experiment are located in high radiation areas, so it is
impossible to access any of the electronics during RHIC operation. Therefore, the Slow
Controls system is implemented for remote access to the Front End Electronics (FEE). The
Slow Controls system is designed using EPICS running on Sun Workstation connected to
VME processors running the VxWorks operating system.
In the STAR control room, “SC.STARP.BNL.GOV” is a Linux Workstation. Usually the Slow
Controls Graphical User Interface (GUI) is open on this computer. If it is not open, do the
following:
1. Open a terminal on sc.starp.bnl.gov and get [sysuser@sc sysuser]$
Both alarm handlers (general alarm handler and magnet alarm handler) should be running at all
times during normal operation.
How to start general alarm handler:
1)
2)
3)
4)
open x terminal
type : cd /home/sysuser/UTILS/ <enter>
type: ./softbeep-alarm <enter>
type: startalh <enter>
How to start the magnet alarm handler:
5)
6)
7)
8)
open x terminal
type : cd /home/sysuser/UTILS/ <enter>
type: ./softbeep-magnetalh <enter>
type: magnetalh <enter>
Alarm Handler Window
Alarms indicate unexpected changes in the parameters of a detector (for example: FTPC
pressure, TPC tripping, etc). The Alarm handler is a graphical application used to identify
problems. It consists of two windows, a runtime window and a main window.
Runtime Window
The run time window is a small window containing the name of the alarm configuration (see
Figure 1). The color of this window indicates the highest alarm severity of any outstanding
alarms within each alarm group (explained in a moment). The color coding is as follows (in
order of severity):
White
Red
Yellow
Background color
: Data Invalid Alarm
: Major Alarm
: Minor Alarm
: No Alarm
(Figure 1: runtime window)
Beeping and blinking of this window indicates an unacknowledged alarm. The main window is
opened by clicking on the button labeled “STAR”.
Main Window
The Main Window (Figure 2) is divided in to three sections: the menu bar (top), the alarm
configuration display area (middle), and the message area (bottom).
(Figure 2: main window)
The STAR experiment contains a number of subsystems (e.g. TPC, FTPC, EMC, BEMC, etc),
each of which contains detectors that have several configurable parameters. The alarm
configuration area contains hierarchical displays of each alarm group and the relevant
detectors' parameters. The buttons with the rightward pointing arrow on the hierarchical
display allow the user to expand or contract each alarm group's tree.
(Figure 3: Buttons used to expand or contract the hierarchical tree)
Each detector has several alarms that can go off. These are grouped under each detector in the
Main Window. The group of alarms applying to a particular detector can be selected by
clicking on the button containing the name of the detector in the left part of the alarm
configuration display area. The right part of the alarm configuration area displays the list of
contents of the currently selected alarm group. Figure 4 shows the TPC alarm group selected.
(Figure 4: Contents of TPC alarm group)
Acknowledging and silencing an alarm
A new button will be activated when a new alarm sounds (see Figure 5) and will remain active
until the alarm is acknowledged. You can acknowledge the alarm by clicking on the (now
active) button that applies to that alarm. These buttons have a color and a letter which represent
the highest severity of unacknowledged alarm within the group and read as follows (in order of
severity):
White labeled with “V”
: indicates an invalid data alarm
Red labeled with “R”
: indicates a major alarm
Yellow labeled with “Y”
: indicates a minor alarm
Background color indicates no alarm present
(Figure 5: Red alarm in EEMC and TRIGGER, White alarm in BEMC, TIGGER and TOF)
Opening the guide for a subsystem
To do this, click on the button with the letter “G” next to the subsystem in question's alarm
group. In Figure 6, this button is marked with a red circle.
Opening the control screen for a subsystem
To do this, click on the button with the letter “P” next to the subsystem in question's alarm
group. In Figure 6, this button is marked with a blue circle.
(Figure 6: Click the red circled button for subsystem guide.
Click on the blue circled button for the subsystem control screen)
How to handle an alarm
As explained earlier, a new button will be activated when a new alarm sounds. Follow the
following steps to acknowledge and solve the problem:
1. Acknowledge the alarm by clicking on the now lit (white, red, or yellow) button. The
beeping will stop.
2. If the hierarchical tree for the subsystem's alarm group is contracted, expand it and find
the alarmed detector.
3. Open the control screen by clicking on the button with the letter “P”.
4. Alarm handling methods differ from one detector to another. Separate user manuals for
each and every detector are available in the control room as well as on the star web
page. Refer to these manuals to solve the problem.
Star detector states
Each detector goes through different settings or states during different periods of operation.
For example, the FTPC when ramping up to full voltage will go through several states as the
voltage builds, each one appropriate to handling that level of voltage and moving it up or down
to the next level. Detector states can be set using the control screen. Guide lines for the various
STAR detector states are available in the control room. The following section describe some
important detector procedures.
Time Projection Chamber (TPC) Slow controls
The following figure (Figure 7) shows the TPC main controller window.
(Figure 7: TPC main control window)
By clicking on the blue buttons you can open control windows for each TPC subsection.
During a shift, the following detectors are important for the TPC's operation:
1. Front End Electronics (FEE)
2.
3.
4.
5.
Gate Grid (GG)
Cathode
Anode
Laser
The laser system is a stand alone system and is not connected to the slow control system.
Front End Electronics (FEE)
During a run cycle, the FEE is powered at all times. Click on the “FEE VOLTAGE” button in
the TPC main control window to open the FEE control window (shown in Figure 8).
(Figure 8: TPC FEE Controller window)
The FEE routs power to individual RDOs to handle tasks. To turn on or off all parts of the
FEE and corresponding RDOs at once, click the “on/off” button under the “global” section on
the right bar. Switched on supplies are green as shown in Figure 8, switched off are the
background color of the control window). There are individual on and off buttons for the east
and west ends, for each rack, and for each individual power supply as well.
TPC Cathode high voltage
During Beam Injection, Beam Studies, and Rotator Ramp modes of TPC operation, the anode
(refer to Figure 7) voltage should be turned off, while during the physics mode when the beam
is safe to use for detection, the voltage should be on. Once everything is ready with the RHIC
beam, the operator ramps the TPC voltage up to its desired level. Before the beam can shut
down, the voltage must be ramped down to zero. This is done using the cathode high voltage
control window, shown in Figure 9. This window can be opened by clicking on the
“CATHODE” button in the TPC main control window (refer to Figure 7).
(Figure 9: Cathode high voltage control window)
There are two methods for ramping up the cathode's voltage: auto ramp mode and manual
ramp mode. Normally, the detector operator need only use the auto ramp mode. For more
information on manual ramping, refer to the TPC manual in the control room.
Auto ramp mode
Follow these steps to automatically ramp up the system voltage:
1. Make sure High Voltage Setpoint slider switch (bottom left in Figure 9) is set to 0.
2. If high voltage is off (see the “HIGH VOLTAGE” indicator), switch it on by clicking
on the “HV” button on the indicator.
3. Make sure that the RHIC beam is stored, cogged and stable (ready for detection) before
continuing.
4. Click on the “AUTO_ON” button. The window shown in Figure 10 will appear.
5. Click on the “ON” button in this new window.
(Figure 10: Cathode auto on window)
The ramping up process will take about 10 minutes. The detector operator can stop the ramp up
process by clicking on the “STOP” button and can ramp the voltage back down to 0 by clicking
on the “OFF” button in this window.
Warning:
The cathode HV should not be turned ON until the RHIC beams are stable at collision
energy and it should be ramped to ZERO before the beam is dumped.
TPC anode high voltage
The TPC anode high voltage control window is opened by clicking on the “Anode Voltage”
button (refer to Figure 7). Figure 11 shows the TPC anode high voltage control window.
(Figure 11: TPC Anode high voltage control window)
The TPC anode has two voltage levels: “Full voltage” and “Pedestal”. The auto ramp method
is available here as well to ramp up to either of these levels. Follow these steps to ramp up the
TPC anode:
1. Make sure both ARCNET-BUSS statuses are green (top center of Figure 11). If either
or both are red click on the corresponding “REBOOT” button and wait until they turn
green. This will take about 5 minuets.
2. Click on the “AUTO-ON” button. The window shown in Figure 12 will appear.
3. If this window displays the message “ARCNET connection lost”, click on the “Reset
PGM” button.
4. Make sure RHIC beam is stored, cogged and stable (ready for detection).
5. Click on the desired voltage level: either full voltage or pedestal voltage in the anode
control auto on window.
6. The ramping process can be stopped and be ramped down to zero by clicking the
“OFF” button.
To turn the high voltage off, click on the “OFF” button in the auto on window shown in Figure
12.
(Figure 12: Auto on window for Anode Control)
The manual ramping method is also available, refer to the TPC manual for more information.
Anode trip resetting
Occasionally, one or more channels will trip “off” automatically due to overly high current (a
surge protector). In the case that a trip off TPC alarm sounds and the tripped channels (refer to
figure 11) turn from green to red, first silence the alarm and follow these steps to solve the
problem:
1. Click on the tripped channel in the anode high voltage control window. This brings up
the “channel status panel” shown in Figure 13.
(Figure 13: channel status panel)
2. Click on the “SET” button to open the control panel shown in Figure 14.
(Figure 14: Control panel)
3. In the DV panel, type 0 and hit the return key. Do this for all tripped channels.
4. In the anode high voltage control window, click on the “Clear Trips” button. (if the
tripped channel is in the “outer” section, click on “CLEAR OUTER” button, if it is in
the “inner” one click on “CLEAR INNER” button (refer to Figure 11).
5. Wait until tripped channels turn green.
6. If the tripped channels do not turn green, go back to the channel status panel and click
on the “ENABLED” button.
7. Slowly raise the voltage by changing the demand voltage value in the control panel
(Figure 14, DV panel). See the TPC control room manual or ask the shift leader for the
ramp up rate.
Gate Grid (GG)
The Gating Grid control window can be opened by clicking on the “Gating Grid” button on the
TPC main control window. The control window is shown in Figure 15. During a normal run,
the Gating Grid should always be on.
(Figure 15: Gating grid control window)
Forward Time Projection Chamber (FTPC)
The FTPC main control window is shown in Figure 16. This window is not accessed from the
TPC main control window (Figure 7) as it is a separate system entirely. Rather, it can be
opened from the terminal by entering “ftpc” into the command line and pressing <enter>.
To configure the FTPC's state, click on the “CONFIGURE” button.
(Figure 16: FTPC Main controller window)
The interlock status, cooling system, and other systems of the FTPC can be accessed from the
FTPC main control window.
ZDC and BBC
As a detector operator during normal smooth running you don’t want to change the sate of
these triggers. The main control windows for each are as follows:
(Figure 17: ZDC control window)
(Figure 18: BBC main control window)
These window can be accessed from the terminal as well by typing “zdc” and “bbchv” for the
ZDC and BBC control windows respectively and pressing <enter>.
upVPD HV controls
The upVPD high voltage control window is shown in Figure 19 below.
(Figure 19: upVPD high voltage control window)
Normally before Beam Dump or during Injection, Beam Studies, and Rotator Ramp modes,
you should keep the upVPD high voltage off. It is turned on and off by clicking on the “ON”
and “OFF” buttons in the lower left corner. This can be accessed by entering “upVDP” into
the terminal and pressing <enter>.
Electro-Magnetic Calorimeter (EMC)
The control window for the EMC is shown below in Figure 20.
(Figure 20: the EMC control window)
This window is accessed from the terminal by typing in “eemc_main” and pressing <enter>.
BEMC smd, west, and east
The control windows for BEMCsmd, BEMC West, and BEMC East can be accessed from the
terminal by inputting “bemc_lecroy” for BEMCsmd, “bemc_west” for BEMC West, and
“bemc_east” for BEMC East. The control windows for each are shown below.
(Figure 21: BEMCsmd control window)
(Figure 22: BEMC West control window)
(Figure 23: BEMC East control window)
Time of Flight (TOF) LV and HV
You can open the TOF low voltage and high voltage control windows by typing “TOFLV” and
“TOFHV” respectively into the terminal and pressing <enter>.
(Figure 24: TOF low voltage control window)
(Figure 24: TOF high voltage control window)
See the respective user manuals for information on the operation of all the above components.
Thank you, Wembley, and good night.