1
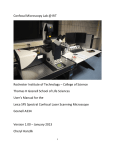
Multichannel Confocal User Guide Note: for more details see the Prairie user manual at http://www.prairie technologies.com/resources/software/PrairieView.html Please report any problems to Julie Last ([email protected]) Turning on the instrument 1. 2. 3. Turn on laser launches (on the right side of the computer cart). Let warm up for 30 minutes. Note: The bottom laser launch (b) is for uncaging and doesn’t need to be turned on for imaging. - Turn on main power switches on the front - Use key to turn lasers on - Open shutters 4. On cart turn on main power (behind the monitor) 5. Turn on the computer (open panel on from of computer tower to find the power button). 6. Turn on the power behind the microscope (on the right side) 7. Open Prairie View software 8. Select objective either in the software in the Nikon controls window or on the LHS of the microscope. The Prairie View software will automatically update the objective selection. 9. Loading the sample: To load the sample, tilt back the top of the microscope. Caution: The top is heavy and will not stay up by itself. 10. To look through eyepiece select eye on the front of the microscope. The light can be turned on and off and intensity adjusted on the left side of the microscope. 11. For confocal imaging select L100 on the front of the microscope and turn off the transmitted light. 12. Joystick control a. If the joystick does not work check to see if the boxes on top of the computer cart are on. b. To switch between fine, medium and coarse x-y movements rotate the top of the joystick. c. While imaging, moving the joystick up and down will move the sample left and right (but it will be correct if looking through the eyepiece or if using the stage controls in the software to move the sample). 13. Available for confocal imaging: Imaging dichroics: 488/568/647, 488XR, 405RDC, 405/488/561/640, (488, 491/633, 647) 405/514/633 Detectors: Three channel PMT Channel 1: 690/60, 605/70 Channel 2: 605/70, 535/30, 525/50 Channel 3: 525/50, 460/50 Channel 1,2,3 dichroics: 650 lp, 565 lp, mirror Channel 2,3 dichroics: 565 lp, 495 lp Nikon Objectives (Lenses): 10X, N.A.: 0.30, Plan Fluor, W.D. 16 20X, N.A.: 0.75, PlanApo VC, W.D. 1.0 40X, N.A.: 1.0, PlanApo, W.D. 0.16 Oil 60X, N.A.: 1.40, PlanApo VC, W.D. 0.13, Oil 100X, N.A.: 1.40, PlanApo VC, W.D. 0.13, Oil 14. Prior to imaging your sample, please check the laser power and PMT gain with the pollen grain slide. Procedure: 1. Use pollen grain slide, typically located on the air table, with the 20x objective 2. Choose an area with several pollen grains to image 3. Settings: a. 561 power = 100 b. Use Ch1 window with the 605/70 filter, set channel color to range check c. 4 us dwell time d. 512 x 512 resolution 4. Live scan and increase PMT power until there are a few red pixels (has been around 350-400) 5. Note this number on the log sheet Setting image gains and offset Gain is adjusted by turning on the PMT voltage (moving the slider bar to the right). Start with the desired PMTs set to 500 and adjust laser power and PMT voltage to obtain optimal image. Clicking the green tab on the left of the PMT window will allow access to the gain multiplier and the offset. Gain multiplier should only be used if more gain is needed than can be achieved with PMT voltage setting (keep this set to zero). Note – this will amplify both the signal and the noise. Offset can be adjusted in range check mode (right click on the color bar on the right of the channel button to go to range check). Turn off Laser and PMT powers and adjust the offset to get a minimal number of blue pixels. You should only need to do this once in an imaging session and it should not vary much from the starting settings. To obtain transmitted light image To set up for transmitted light – open shutter on 4th PMT and move mirror to direct light to PMT. The lever on the 4th PMT will be down when the shutter is open. When the mirror is in position red will be observed through the eyepiece. The transmitted light image will be on channel 4. Note: If using interlace the 4th PMT also needs to be added in the interlace setup (using any laser). Perfect focus This microscope has perfect focus, which can be used to keep focus when moving in x – y across the sample and to adjust for z drift. When the perfect focus is turned on the focus is set to the surface of the coverslip. The focus can be offset by using the perfect focus adjustment knob (on the air table to the right of the microscope). Set up for Live Cell Imaging The live cell imaging chamber is stored in a box on the bottom shelf of the wall cabinet. The microscope plate for the chamber is also in the box under the chamber. Use caution when placing the chamber on the microscope stage. The condenser must be raised up and the top of the microscope tilted back while putting in the chamber. Note: The top of the microscope is heavy due to the additional PMT so the top will not stay up by itself. Tilt back and place a fitting (located on the microscope table) in the junction to be sure that the top will not fall. The controller, tubing and bottle for humidity control are located on the table, behind the microscope. Fill the humidity control bottle above the minimum fill line with DI or filtered water. The top of the bottle can then be placed in the bottle and the connection made with the chamber. CO2 – The tank should be set for a pressure between 15 – 20 psi. Please do not change this setting. To open the tank, only open the main valve. Interlaced Scanning Interlaced scan patterns allow acquisition of frames using up to four different independent laser settings alternating each line for higher temporal resolution than is possible with using labels to alternate settings each frame. One line of each track is scanned to acquire one line of the final image. For example, if a system has two imaging lasers: one at 488 nm and one at 561 nm this feature allows the operator to scan a 512x512 image alternating wavelength with each line. The data for track one will be saved as the Channel One data and the track two data will be saved as channel two. Whenever the Interlaced scan pattern check box is checked, the defined interlaced settings will be used. This applies to Live Scan, Single Scan, T-Series, Z-Series, etc. Prairie View Controls Note: Some sections have extra controls accessible through a green bar located to the left of the section. Image Size is the first panel on the top left corner of the main control window. Image size is the pixels per image. 512 x 512 is recommended as a starting size for a fast frame rate and quick imaging. Higher resolution can be used once the object is in view. Image Window Size is located under Image Size. Image Window Size controls the way in which the image is displayed in the window. Fit will change the image to fit within the window. 1:1 will show the image at its actual size as defined by Image Size. Smaller will decrease image by 10% (click repeatedly to continue decreasing size). Larger will increase image by 10% (click repeatedly to contine increasing size). Dwell Time Per Pixel (us) is located under Image Window Size. Dwell Time designates the amount of time the laser is on each pixel. The value on the left is the minimum dwell time available and the number on the right is the selected dwell time. Lower image size = higher dwell time A starting dwell time of 4 us is suggested. Optical Zoom (mag) is located under Dwell Time. Optical Zoom allows the user to focus in on a smaller field of view. With higher optical zoom, laser is concentrated on a smaller field providing more power and greater potential for photobleaching. (Check laser power and PMTs to avoid this.) A limit will be reached at which no more resolution is possible. As the Optical Zoom is raised, the red box in the Pan Control panel will get smaller. Pan Control is located under Optical Zoom. The red box in the Pan Control panel denotes the area of the field of view that is being imaged. With the Pan Control, users can move the laser to specific areas in the total field of view without moving the stage. To return to the center of field, push 0. The button below the red box indicates pan speed (fine, medium or coarse). Scan Rotation is located under Pan Control. Scan Rotation controls the angle of laser scanning. The top of the scanning box is labeled as the yellow side of the red box in the Pan Control panel. Rotation is possible from 180 to -180 degrees. Clicking Zero will return the Scan Rotation back to 0 degrees. Scanning panel is located on the top right hand corner of the main control window. Scanning controls image acquisition. Live scan will continually scan the object and update the image. Single scan will scan the object once and display that image. New window will open a new imaging window. Running frame average is used with live scanning. o If the box is checked for running frame average, the software will average the number of frames indicated in the box. o Averaging frames can increase signal to noise ratio and resolve an image. o Averaging frames is only useful if the object is not being moved. Average every N frames is used with single scan. o This function will average the number of frames indicated in the box. o A higher number will result in a higher signal to noise ratio. Hard Shutter is the shutter located in front of the laser box. o When activated (denoted by a red icon), the laser is live. o The Hard Shutter will be activated automatically when acquisition begins. Soft Shutter controls the voltage being applied to the pockels cell. o When activated (denoted by a red icon), laser is being applied to sample. o The Soft Shutter will be activated automatically when acquisition begins. This confocal can only be used in Galvo mode (Scan mode will be inactive). Objective Lens is important to set. o Select the objective lens being used. The objective can be selected in the Nikon controls menu or on the microscope and the Objective Lens box in Prairie view should update automatically. o All lenses have been calibrated and should be listed in the drop-down menu. Stage Control is located under the Scanning panel. Before beginning to move the Stage Controls, it is useful to hit both 0s in the panel to bring all settings to “home.” The set of arrows on the left can be used to move the stage in the x or y axes. This can also be done using the joystick. The right set of arrows can be used to set the top and bottom positions of a z-stack (the boxes with the red lines). Step sizes (um) can be changed by entering a number in the appropriate box. Other step sizes can be chosen from the drop down menu. The tabs halfway down the main control window contain additional controls and experimental setups. The Laser, PMT, DAQ tab controls the power given to the laser and PMTs. The laser setting goes from 1-1000 (arbitrary units). The PMTs setting denotes the amount of voltage applied to the PMT. The green bar to the left of the PMT settings will change the menu to set the gains and offsets for each channel. The Z-Series tab controls the settings for creating z-stacks. The top and bottom positions as well as step size can be set here or in the Stage Control panel above. The number of slices wanted can be set in this tab. Four values are needed to set z-series parameters – start position, stop position, step size, and number of slices. When any three values are set, the fourth will be automatically calculated. If “Adjust PMT & Laser” is checked, different power and gain settings can be entered in the data table. If “At all XY stage locations” is checked, the z-series will be captured at all XY locations set in the XYStage tab. A Z-series can be saved so that the same series can be used again. Save Path is used to save the data to a particular location on the computer. *Note – Check the power set up in the z series box. If the series is defined by entering values in the zseries calculator the default is that the power will decrease through the series. The T-Series tab controls the settings for creating a series of images and data using various parameters such as XY stage locations, regions of interest, and Z-series. A cycle can be set up by changing values in the data table. A new cycle can be added or inserted in the Add/Insert Cycle panel by clicking “Single Image.” A particular x-y stage location can be selected by clicking “Stage Position” Waits can be inserted into the series by clicking “Wait.” Iterations indicates the number of times the cycle will repeat. Period is the time from the start of one iteration to the start of the next iteration. Z-series can be added using the drop down menu in the data table. To start running the T-series you have created, click “Start T-Series.” Save Path is used to save the data. T-Series Preferences (under preferences menu) T-Series Execution Order: Determines whether to do all iterations at a given XY stage location before proceeding to the next XY stage location – (1) T-Series Iterations - (2) XY Stage Locations - (3) Cycles – or to perform each iteration at all XY stage locations before proceeding to the next iteration – (1) XY Stage Location - (2) T-Series Iterations - (3) Cycles. TriggerSync Execution: TriggerSync experiments can be executed two different ways, either the software will wait for the entire experiment to finish before the next cycle starts, or the next cycle can be started directly after the TriggerSync experiment is started – Start next cycle immediately The XY-Stage tab allows you to set positions in your sample at which to collect data. To add a new position to the XY positions, move the stage to the desired position and click “Add Current Location.” The Plate Definition panel can be used to set up the x- y locations in well plates by entering the distance between wells and the number of x and y position in the well. This will automatically define all x – y positions. Currently, x and y need to be switched from the conventional directions or the positions will be marked incorrectly (90 degrees from expected). Prairie is aware of this problem and is working on a fix. The Grid Definition panel can be used to automatically set XY positions and aquire a full image between two points. o The start and stop locations can be set in this panel. o Choose the amount of overlap you wish to see between pictures by entering a value in the “Overlap %” box. o The calculated positions can then be added to the grid locations already chosen or used to replace those grid locations. The Misc tab contains the main Save Path for saving your data. The photoactivation mask can also be selected in the misc tab. The Image Window also contains important controls and settings. To the left of the pictures, are the channel buttons. Ch1/Ch2/Ch3/Ch4 indicate which channel is being shown in that image window. The small rectangle directly to the right of the channel buttons allow you to choose the color that that particular channel is shown in. Freeze will freeze the current image in the window. Data will continue to be collected, but it will not be shown in the frozen window. BOT (brightness over time) can be used to watch the change in pixel intensity over time. LS (line scan) can be used to define and acquire data along a line. PS (point scan) can be used to keep the laser beam focused at a particular spot. It is possible to record intensity at this spot over time. Photobleaching is a side effect of point scanning. ROI (region of interest) can be used to choose an area of the image to zoom into. Unlike optical zooming, region of interest selection does not create a power issue. Image size is chosen automatically when using ROI. LUT (look up table) can be used to observe the intensity of acquired data. The intensity of an image can be changed without affecting the raw data. This is a useful way to test whether you can use less power. The button with a graph image can be used to display a plot of intensity values in each channel along a line that you create on the image. The Photoactivation (PA) tool enhances the functionality of a Z-series acquisition or single scans by allowing the user to apply masks to scan areas, controlling where laser power is applied. These masks can be on specific z-slices, applied to an entire stack or a single scan. To use the PA tool for a stack of images, a Z-series must first be acquired, see Z-Series tab. While still in the playback window after acquiring a Z-series, select PA. This will open a toolbar on the right side of the Image Window. By using the scroll buttons at the bottom of the window or cursor keys to change frames and the buttons on the right to edit the masks, the mask region(s) are defined. These are the regions that are scanned by the laser beam. Regions that are not masked are not scanned. The selected regions are shown as translucent green areas on the image as shown below. When all masks are defined, disable the PA mask editing mode (Click PA). To use the PA tool for a single image click PA at any time except when in playback mode for a Z-series. Define a single slice PA mask as you would a set of masks for a Z-series. To use the mask it must be selected on the Misc tab. To acquire a Z-series using these masks, it will be necessary to set up a Tseries, being sure to select a set of masks in the PA column. It is important to make sure Save images generated when Photo Activation (PA) is used? is also checked in the Preferences menu. The Mark Uncage dialog is used to mark locations of points for photo activation or uncaging experiments. These points can be single or in a user-defined line or grid. Note: Although the Mark Uncage function can be performed in a PrairieView window, TriggerSync must be open and running (from the Applications menu) in order to use this function. When Mark is selected, a box appears on the image in the active Image Window and a second, Mark Uncage, window appears (as shown below). To select points, click on the appropriate option in the Mark window and follow the steps described below. Because this window is an interface between PrairieView and TriggerSync, it is necessary to set the Mark parameters using a Mark Points Wizard, which is accessed by clicking Configure. To Mark a Point: 1. Click Point. 2. Move point to desired location on image. 3. Click Configure... to set Mark Points parameters. 4. Click Prepare. 5. Click Acquire to mark points. To Mark a Line of Points: 1. Click Line. 2. Enter number of points in the X Point Density field. 3. Move line to desired location on image. 4. Click Configure... to set Mark Points parameters. 5. Click Prepare. 6. Click Acquire to mark points. To Mark a Grid of Points: 1. Click Grid. 2. Enter number of points in X and Y Point Density fields. 3. Move grid to desired location on image by dragging center point. 4. Resize and rotate grid by dragging corners. 5. Click Configure... to set Mark Points parameters. 6. Click Prepare. 7. Click Acquire to mark points. Note: If the PA does not occur at the marked points let me know – it may need a new calibration file.