1
EEL 4914 Senior Design
Final Design Report
April 21, 2008
PAMELA: Pulse Acquisition and Monitoring Equipment for Living
Applications
Team Name: PULSERS
Submitted by:
Mark Oden
cerberus at ufl.edu
Carlos Torres, Jr.
enderzztop at yahoo.com
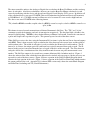
Project Abstract:
The goal of our project is to measure three heartbeats on the same test subject and be able to continuously
chart/analyze the timing differences among the heart beats. The continuous heart rate will be determined and
displayed as well. With this data, numerous other plots can be displayed (trajectory, change in heart rate over
time, etc.)
1
Table of Contents:
List of Tables and Figures …………………………………………………….
2
Features/Objectives …………………………………………………………...
3
Analysis of Competitive Products …………………………………………….
4
Technical Concepts ……………………………………………………………
5
Architecture …………………………………………………………………...
7
User Manual …………………………………………………………………..
10
Suggested Improvements ……………………………………………………...
11
Bill of Materials ……………………………………………………………….
11
Division of Labor ……………………………………………………………...
12
Timeline ……………………………………………………………………….. 13
Applications in Research ……………………………………………………....
14
Acknowledgements …………………………………………………………....
16
References ……………………………………………………………………..
16
Appendix A. LT. Spice Filter Simulations …………………………………....
17
Appendix B. Circuit Design and Layout ………………………………………
20
Appendix C. Atmega 324P C Implementation Code (Software PDF only) …...
25
Appendix D. LabView Implementation Code and Output (Software PDF only) 38
2
List of Tables and Figures:
Table 1. Bill of Materials …………………………………………………………………………………
11
Table 2. Planned Division of Labor ………………………………………………………………………
12
Table 3. Actual Division of Labor ………………………………………………………………………..
12
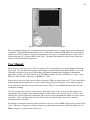
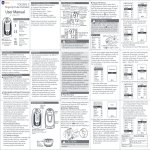
Figure 1. Overview of the Pulse Acquisition System …………………………………………………….
3
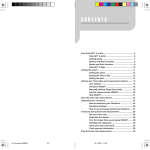
Figure 2. MITes Heart Beat Monitor ……………………………………………………………………..
4
Figure 3. COSY Digital Heart Bea Monitor ……………………………………………………………...
4
Figure 4. Annotated Oscilloscope Reading of a Heartbeat via Force Sensor (SF-4) …………………….
5
Figure 5. Technical Linear Scheatic of PAMELA Architecture …………………………………………
6
Figure 6. A simple op-amp schematic representation of a Schmidt Trigger ……………………………..
6
Figure 7. SF-2 Square Pressure Sensor, Pressure vs. Resistance ………………………………………… 7
Figure 8. Analog Circuitry for One Sensor ………………………………………………………………. 7
Figure 9. Micro-controller and LabView Software Flow Chart ………………………………………….
9
Figure 10. Porton of the LabView Block Diagram Logic ………………………………………………..
9
Figure 12. Actual Division of Labor Graph ……………………………………………………………… 12
Figure 13. Gantt Chart (Project Timeline) ………………………………………………………………..
13
Figure 14. Power Spectral Density plot of 588 point R-R-interval data …………………………………. 14
Figure 15. " λ(ε) (per beat) vs. ε (on a semilog scale) for HRV data of (a) a healthy subject and (b) a
subject with CHF" [8]. Used with permission. …………………………………………………………...
15
3
Features/Objectives:
This design is for a specific application. Its main function is to investigate how three heart beats relate to the
health condition of the test subject. The data will be recorded for further analysis. The user will be able to
determine their Beats Per Minute (BPM), view the average width of each pulse and the timing delay between
the different beats. The user will have two methods for viewing the BPM, the on-board LCD screen, or from
a computer which receives the serial data. A potential case study would be to collect data on a physically fit,
healthy subject with no known organ deficiencies and to collect data on an unhealthy subject with known
organ deficiencies. A general application of this product is to analyze one’s heart rate and interpret the data
accordingly. Existing products do not satisfy the needs of our specific application. Some current products on
the market include hospital heart rate monitors which implement IR sensors, wrist watch BPM monitors, etc.
The electronic pulse acquisition device will provide a unique and accurate method for acquiring heart rate
data for medical studies. The main features include:
•
•
•
Three sensors detecting the pulse
USB cable for easy access data acquisition
Easy to read graphical displays with pertinent health information through computer based software
• Differences in delay between the three different sensed pulses
• Individual R-R-interval values
• Constant Beats per Minute (BPM) monitor
Figure 1. Overview of the Pulse Acquisition System
4
Analysis of Competitive Products:
Our two competitors are the MITes (MIT Environmental Sensor) Heart Rate Monitor [5] and the COSY
Digital Heart Beat Monitor [6]. The MITes HRM (heart rate monitor) implements an industry standard Polar
chest-strap transmitter and receiver. The transmitter sends out a beating pulse while the actual MITes generic
board receives this heart beat signal, calculates the BPM and sends it back to the MITes receiver. Voltage
regulators are implemented to convert 5V down to 3V for the input of the device. This MITes unit is
contained within a pillbox and costs $95.50 per 50 units. [5]
Figure 2. MITes Heart Beat Monitor [5]
The COSY Digital Heart Beat Monitor features an IR finger/earlobe clip sensor to monitor the heartbeat. It
is a micro-controller based system which indicates the pulse via LED display and a piezoelectric beep. It
features a bar graph to indicate the best sensor position on the finger/earlobe and costs $100 per unit. [6]
Figure 3. COSY Digital Heart Beat Monitor [6]
Although both of these products are listed as competitors, they do not deliver the specific tasks that this
electronic pulse acquisition device offers. The device in this paper acquires three heart beat pulses
and analyzes the differences in pulses for medical purposes. Instead of implementing an IR sensor, this
device features three force sensors which capture the heart beat signal. This device is expected to cost nearly
$170 per unit.
5
Technical Concepts:
The main objective of our project is to construct a product which can provide data which can be interpreted
to diagnose the health condition of a test subject depending on the timing differences of three diverse heart
beats. Preliminary testing consisted of attempting to detect the heart rate with an IR detector (LTR-301) and
emitter (LTE-302) [1]. Unfortunately, the results were unacceptable and an alternative to IR sensors was
sought out. An expert's opinion led to testing force sensors (102-1223-ND). It was determined that these
force sensors would indeed detect a pulse.
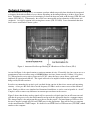
Figure 4. Annotated Oscilloscope Reading of a Heartbeat via Force Sensor (SF-4)
As noted in Figure 4, the signal contains a consistent amount of noise. Essentially, the force sensor acts as a
potentiometer with a resistance range of 100,000 kOhms (no force) down to nearly 1 kOhm (1.5 kg force)
[2]. When placed in series with a resistor and a 5V DC source the force sensor detects a pulse with
amplitude of approximately 60 mV. This signal will need to be amplified with an amplifying circuit prior to
being read by an A/D converter.
In order to accommodate the project's goal, our final design consists of three force sensors and supporting
circuitry. A low-pass RC filter with a cut-off frequency of 15Hz is used to remove most of the unwanted
noise. Band-pass filters were simulated and determined insufficient, as can be seen in Apendix A. An AC
Coupler is used to remove any difference in constant pressure between the sensors.
Figure 5 shows that the three analog signals will be converted to a digital signal via an A/D converter and
will then be post processed by the microcontroller and provide the appropriate data for a computer output.
The Atmega family is the microcontroller type chosen for this project. An Atmel Atmega 324P was used
because it supplies enough A/D, I/O and UART ports for this application. Data will be sent to a computer
via the microcontroller's UART output. It is then fed to an FTDI Serial-to-USB converter (FT232RL) which
attaches to the computer.
6
Figure 5. Technical Linear Schematic of PAMELA Architecture.
Figure 6. A simple op-amp schematic representation of a Schmidt Trigger [3]
To calculate the Beats Per Minute and collect the pulse start and stop times the concept of a Schmidt trigger
was implemented in the microcontroller code [3]. A Schmidt trigger is a comparator circuit (see Figure 6)
which outputs a high voltage while the input voltage is higher than a designated high preset value. It outputs
a low voltage while the input voltage falls below a designated low preset value. If the input voltage is
between these two preset values, then the output is unaltered. This comparator concept will be used in
software to determine the BPM (beats per minute) of the test subject.
National Instrument's LabVIEW is an extensive part of the data analysis. LabVIEW is a development
environment which implements a graphical programming language to accomplish a task. Users can drag and
drop block diagrams which serve as visual subroutines and interconnect them with wires. Data is input to
each subroutine or interface and output through the wires towards the following block diagrams [4].
Architecture:
The sensors used were CUI, Inc.'s SF-5 square pressure sensor (DigiKey P/N: 102-1225-ND). The sensor is
made of a Piezo-resistive material and as seen in Figure 7 [2], as pressure is applied to the sensor the
resistance decreases. The values in Figure 7 are derived from the SF-2 square pressure sensor, a 2 mm^2
sensor rather than the 5 mm^2 sensor used in this project. The SF-2 and SF-5 sensors share the same data
sheet. A voltage divider circuit was created with a 1 MOhm resistor. With the pressure sensor operating
near 100 to 250 gf the resistance range of the sensor would range from 100 KOhm to 5 MOhm. Assuming
this range of pressure is applied when taking a pulse, then the voltage divider would yield the largest range in
voltage change. The output of this voltage divider is taken through a voltage following operational amplifier,
to eliminate the effects of current on the circuit.
7
Figure 7. SF-2 Square Pressure Sensor, Pressure vs. Resistance
The output of the first operational amplifier is then attached to a DC blocking (AC coupler) capacitor and
biased at 2.5V with a two 1 MOhm voltage divider circuit and placed at the positive terminal of the
amplifying operational amplifier. The negative terminal is biased at an analog ground 2.5V, used for the
other sensors with a feedback circuit that contains two potentiometers for setting gain. One potentiometer is
for setting the coarse gain (100 KOhm) and the other for fine gain (10 KOhm). The output of the amplifying
operational amplifier is passed through a low-pass RC circuit with a cut-off frequency of 15 Hz (R = 100
KOhm, C = 0.1 uF). The output of the low-pass filter is then used as the input to the on-chip Analog-toDigital Converter in the Atmega 324P micro-controller.
Figure 8. Analog Circuitry for One Sensor
8
The micro-controller analyzes the Analog-to-Digital data to calculate the Beats Per Minute and the start/stop
times of each pulse. After these calculations, the user can view the Beats Per Minute calculated via each
sensor by interfacing with the device and the on-board Liquid Crystal Display (LCD) screen. In addition, all
of the calculated data is sent out of USART0 (Universal Synchronous/Asynchronous Receiver/Transmitter)
at 230,400 baud. A 14.745 MHz external oscillator was used to ensure 0% error at such a high baud rate.
The data is sent out of USART0 in the following format:
TX(,<data0>,<BPM0>,<start0>,<stop0>,<data1>,<BPM1>,<start1>,<stop1>,<data2>,<BPM2>,<start2>,<st
op2>,)\r\0\n
This format is catered towards transmission to National Instrument's LabView. The "TX(" and ")\r\o\n"
statements specify the beginning, and end, of transmission respectively. The first data block, <data0> is the
current Sensor0 reading. <BPM0> is the calculated Beats per Minute for Sensor0. Start0 is the start time of
a pulse and Stop0 is the stop time of a pulse. This pattern repeats for each of the three sensors.
When LabView receives the data, using the Instrument I/O Assistant, it plots the raw Sensor data and outputs
each BPM. There is then extensive logic to calculate the delay between each sensors beats and the width of
each heartbeat pulse. The width of each pulse is used to calculate the R-interval of each heartbeat. The Rinterval is, in essence, the unique period of each heart beat, typically measured from peak-to-peak. The Rinterval in this project is measured from the base of a peak to the base of the next peak. The delay between
each pulse allows for a visualization of the delay in milliseconds between one pulse measurement versus
another. The LabView output is also stored into a comma delimitated file for further analysis. Figure 9
shows the software flow chart, which has been abbreviated to include only one process, but the processes are
repeated for each of the three sensors. Figure 10 shows a portion of the LabView Block Diagram which
contains the logic portion of the code. Figure 11 shows a portion of the LabView Front Panel which contains
the output portion of the code. Appendix [D] (software PDF version only) shows the entire Block Diagram
and Front Panel, including sub-VIs (Virtual Instruments).
9
Figure 9. Micro-controller and LabView Software Flow Chart
Figure 10. Portion of the LabView Block Diagram Logic
10
Figure 11. Portion of LabView Front Panel Output
The programming language used to program the micro-controller was C, adapted for use of the Atmega line
of products. The programming interface used was AVR Studio 4 with WinAVR-20071221 as the backend
interface to the GCC compiler. All of the programming code used to accomplish the project's goals can be
found in Appendix [C] (software PDF version only). Appendix [B] contains the entire circuit design and
layout, created with Altium Designer 6.8.
User Manual:
This interface is quite easy to use. The user simple needs to have LabView pre-installed with the Software
VI's loaded. The user then should connect their computer to the Printed Circuit Board (PCB) via a A-to-B
USB cable and choose the proper COM settings in National Instruments Measurement & Automation
application. Namely, the desired baud rate is 230,400 baud, with 8 data bits, Odd Parity (O), One (1) Stop
Bit and no Flow Control. Simply put; 230400 8-O-1, None.
It may also be necessary for the user to choose the proper COM port in the Software VI. They can do this by
double-clicking the Instrument I/O Assistant and choosing the proper instrument. Upon correct setup, the
device will display the data as received from the sensors. There is also an Enable button in the VI to turn
on/off data recording.
To receive proper data from the sensors the user should place the sensors on any artery they choose and
applying the correct back pressure with their fingers to allow pulses to be properly sensed. If there is not
enough gain, it can be adjusted by turning the fine and coarse grain potentiometers which sit near the sensor
connectors. Given enough practice, the user will be able to view their pulses and retrieve valuable
information about each pulse.
In addition to viewing the output in LabView the user can view a sensors BPM reading on the on-board LCD
screen. The user is to push one of the three buttons, one button for each sensor, which will display the last
BPM reading for 3 seconds on the LCD screen.
11
Suggested Improvements:
Because of the nature of the sensors being pressure dependent, an amount of pressure must be applied to the
sensor in order for it to receive the small pressure a pulse applies. This applied pressure blocked by the AC
coupler, however because three different gain circuits are used, it is not feasible to contrast and compare the
amplitudes of the pulses. A sensor which would allow for the same measurements this device performs,
along with measuring an accurate amplitude for each pulse would be ideal. One possible sensor is a simple
infrared sensor; others include electrodes and oxygen sensors.
Analog potentiometers were used which do not allow for high-fidelity tuning. Digital potentiometers such as
Analog Devices AD5200 [7] would allow for very accurate resistances, and therefore gain. However, they
add significant overhead by with more circuitry and programming necessary.
A smaller, more compact device would allow for portability and decrease costs significantly. The initial
board was dimensioned at 7 inches by 7.5 inches. The board was re-designed to be 5 inches by 5 inches and
the layout can be seen in Appendix [B]. Assuming no further changes to circuitry, this board can be
populated and used accordingly.
The pressure sensors do not currently allow this, as they are sensitive to movement. However, if the sensors
were to allow movement this device could be made portable by decreasing the size of the instrument
(mentioned above) and by adding on-board data recording. With on-board data recording, a wireless
transmission to the computer could be added for quickly and easily allowing for data transport. Utilizing the
Bluetooth protocol would be an ideal example.
Bill of Materials:
Product
Part Number
Quantity
Price Per Unit
Total
Atmega 324P
ATMEGA324P-20PU
1
$6.02
$6.02
Force Sensors
SF-5L
3
$6.45
$19.35
Operational
Amplifier
FT232RL
NE5532N
4
$0.13
$0.52
604-00043
1
$4.02
$4.02
USB Connector
KUSBX-BS1N-B
1
$0.71
$0.71
1.8 MOhm
Precision Resister
TNPW12061M80BYEA
8
$9.17
$73.36
47 uF Capacitor
(Polarized)
UVR1V470MDD
1
$0.20
$0.20
100 nF Capacitor
(Ceramic)
Toggle Switch
K104K15X7RF53K2
10
$0.06
$0.60
108-1AS2T2220-EVX
1
$2.90
$2.90
LabView (Student)
N/A
1
$80.00
$80.00
Miscellaneous
N/A
N/A
$50.00
$50.00
Total
-
-
$237.68
Table 1. Bill of Materials
12
Division of Labor:
Carlos Manuel Torres Jr.
Preliminary Research
Mark Oden
Preliminary Testing
Design Amplifying Circuit
Design Noise Reduction Circuit(s)
Program A/D input/output
Program LabVIEW & Schmidt Trigger
(microcontroller)
Design Final Board
Design Preliminary Board
Test/Debug
Test/Debug
Presentation, Documentation and
Presentation, Documentation and
Meetings
Meetings
Table 2. Planned Division of Labor
Task/Percentage
Mark Oden
Carlos Torres, Jr.
Preliminary Research
35%
65%
Preliminary Testing
45%
55%
Design Amplifying Circuit
75%
25%
Design Noise Reduction Circuit 25%
75%
Design PCB Board
Populate PCB Board
25%
75%
75%
25%
Design Rev 2. Board
90%
10%
Program Microcontroller
100%
0%
Program LabView
10%
90%
Debugging/Testing
50%
50%
Table 3. Actual Division of Labor
Figure 12. Actual Division of Labor Graph
13
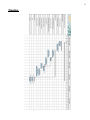
Timeline:
Figure 13. Gantt Chart (Project Timeline).
14
Applications in Research:
This device allows for an "immediate" output of the current sensor readings, the current BPM calculation, the
delay between the sensors and the individual R-R intervals. In research applications this immediate data
should be compiled continuously over a long period of time continuously in order to allow for proper
analyzation and interpretation. One application is analyzing the R-R intervals over time, otherwise known as
Heart Rate Variability (HRV). Prior research [8] indicates that HRV data is a multiscale phenomenon,
namely a random fractal. A multiscale, random fractal is characterized by being stochastic yet has longrange correlation with a small part of the signal representing another part or the whole signal. Given a
sufficient data set, determining whether it is a random fractal or not can be done by first finding the signal's
power spectral density (PSD) and determining the slope of the PSD over many scales of frequency (i.e. 0 to
10,000). Once the slope (M) is determined then the Hurst parameter (H) can be found by performing the
simple linear operation: M = 2H - 1. If the Hurst parameter is found to be between 0 and 0.5 then the signal
can be considered to have antipersistent correlation and be representative of a random fractal.
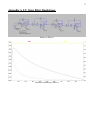
Figure 14 shows the Power Spectral Density of 588 R-R-interval values recorded from the designed
electronic device on an assumed healthy 24-year old male subject. The R-R-interval for each pulse was
determined by adding the time the system determined as currently in a pulse with the time between pulses.
The PSD was calculated by first performing a Fast Fourier Transform (FFT), then singling out the amplitude
by taking the absolute value of each data point and finally squaring the amplitude of each point. The mean
R-R-interval value for this data set was approximately 380 ms.
Figure 14. Power Spectral Density plot of 588 point R-R-interval data
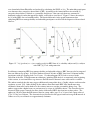
With the assumption that HRV data holds the characteristics of being a multiscale random fractal, many
analyzing techniques are available. For example, the scale-dependent Lyapunov exponent (SDLE) allows for
the analysis of data on a relatively short data set (in the hundreds, to thousands of data points) and allows for
the interpretation of random fractal signals. In [8], the authors analyzed 30,000 points of R-R-interval data
for each sampled participant in two classes. Data of 18 healthy participants and 15 unhealthy participants
15
were downloaded from PhysioNet and analyzed by calculating the SDLE, or λ(ε). The unhealthy participants
were known to have congestive heart failure (CHF). According to the American Heart Association [9]
congestive heart failure is defined as a potentially fatal disease “that can result from any structural or
functional cardiac disorder that impairs the ability to fill with or eject blood." Figure 15 shows the analysis
by [8] of the HRV data set from PhysioNet. The drastic differences in the graphs demonstrate that
comparing HRV data amongst healthy and unhealthy participants can allow for the diagnosis of heart related
illnesses.
Figure 15. " λ(ε) (per beat) vs. ε (on a semilog scale) for HRV data of (a) a healthy subject and (b) a subject
with CHF" [8]. Used with permission.
In addition to comparing HRV data amongst healthy and unhealthy subjects, HRV data can also be compared
between different age groups. In [10] the authors collected 24 hours of HRV data from 114 known healthy
participants with ages ranging from 1 to 82 years. 12 echocardiogram (ECG) leads were used in the
collection of the data. Through numerous techniques, including PSD analysis as mentioned at the beginning
of this section, it was found that as age increases the R-R-interval becomes more stable and less variable.
The authors conclude that this may suggest children and young-adults have a "highly adaptive cardiovascular
regulatory system" [10]. Other findings by the authors show that female HRV data demonstrate more
randomness than males and in both cases the variance increases at night, presumably during sleep. The
authors suggest that a higher heart rate variance may be a sign of a healthier subject. The electronic device
discussed in this paper is intended to allow for the collection of HRV data from one to three probes. The
authors in [10] also show that R-R-interval data for young adults (ages 15 to 39 years) had a mean value of
875+/-121 ms over 24 hours. The electronic device discussed in this paper found an average R-R-interval of
380 ms on a 24-year old male over approximately 6 minutes.
16
Acknowledgements:
Senior Design (EEL 4914) Professor: Dr. Eric Schwartz
Senior Design (EEL 4914) Technical Advisor: Michael Stapleton
Senior Design (EEL 4914) Teacher’s Assitants: Thomas McDonley, Joshua Childs
References:
[1] Lynette Jones, Nikhila Deo, Brett Lockyer, "Wireless Physiological Sensor System for Ambulatory Use,"
bsn, pp. 146-149, International Workshop on Wearable and Implantable Body Sensor Networks
(BSN'06), 2006.
[2] CUI, Inc. SF-X-XX Part Specification Sheet. http://www.cui.com/pdffiles/SF-X.pdf.
[3] Schmidt Trigger - Wikipedia, the free encylopedia. http://en.wikipedia.org/wiki/Schmidt_trigger.
[4] LabVIEW - Wikipedia, the free encyclopedia. http://en.wikipedia.org/wiki/Labview
[5] MIT Media Lab - MITes (MIT Environmental Sensors),
http://web.media.mit.edu/~emunguia/html/mites.htm
[6] COSY Digital Heartbeat Monitor,
http://www.cosycommunications.com/Digitalpulsemonitorcatalogue.htm
[7] Analog Devices AD5200 Part Specification Sheet.
http://www.analog.com/UploadedFiles/Data_Sheets/AD5200_5201.pdf
[8] Multiscale analysis of complex time series : integration of chaos and random fractal theory, and beyond /
Jianbo Gao …. [et al.] John Wiley & Sons, Inc. 2007.
[9] Sharon Ann Hunt, et. al. ACC/AHA 2005 Guideline Update for the Diagnosis and Management of
Chronic Heart Failure in the Adult. Circulation, Sep 2005; 112; e145 - e235
[10] Sirkku M. Pikkujämsä, et. al. Cardiac Interbeat Interval Dynamics From Childhood to Senescence:
Comparison of Conventional and New Measures Based on Fractals and Chaos Theory. Circulation. Jul 1999;
10: 393 - 399.
17
Appendix A. LT. Spice Filter Simulations:
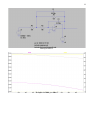
Band pass Filter A
Bode Plot for Band pass Filter A
18
Band pass Filter B
Bode Plot for Band pass Filter B
19
Band pass filter C
Bode plot for Band pass filter C
20
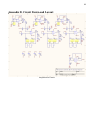
Appendix B. Circuit Design and Layout:
Amplification Circuits
21
Microcontroller interconnects, power stabilization circuit, push button inputs
22
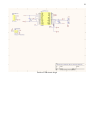
Serial-to-USB circuit design
23
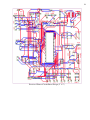
Revision 1 Printed Circuit Board Design (7.5” x 7”)
24
Revision 2 Printed Circuit Board Design (5” x 5”)