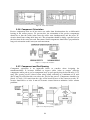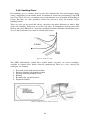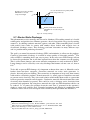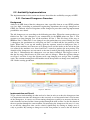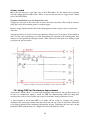
1
Analysis and Actions for Robust Electronics
Production at Haldex Brake Products Ltd
Philip Andersson
Tommy Eklund
Monteringsteknik
Examensarbete
Institutionen för ekonomisk och industriell utveckling
LIU-IEI-TEK-A--08/00456--SE
1
Abstract
This master thesis report contains information about a project carried out at Haldex Brake
Products that is situated in Redditch England. The Redditch site is part of the “Commercial
Vehicle Systems” division within the Haldex group. Haldex Brake Products is designing and
producing electronic anti lock brake systems.
The latest product is called GEN2 and the project goal was to increase productivity and
achieve more stability within the production processes of this product. The goal was achieved
trough implementation suggestions affecting the three categories in overall equipment
efficiency (OEE). Nine of the biggest implementations are presented in this report. Some of
the suggestions are already implemented and some are under progress to be implemented.
These implementations will result in an increase in productivity with additionally 953
products per week. The expected results are based on calculations on an average product. The
report also contains suggestions for future actions to even more increase the efficiency of the
production processes at Haldex Brake Products in Redditch.
2
3
Index
1. Introduction........................................................................................................... 10
1.1. Background.................................................................................................... 12
1.2. Goal ............................................................................................................... 12
1.3. Company Presentation................................................................................... 12
1.4. Product Descriptions ...................................................................................... 12
1.4.1. GEN2 5 Aux (003-9227-09)..................................................................... 13
1.4.2. GEN2 5 Aux, Accelerometer (003-9215-09)............................................ 13
1.4.3. GEN2 5 Aux, Accelerometer, Super Aux (003-9210-09) ......................... 13
1.4.4. GEN2 3M Master..................................................................................... 13
1.5. Method ........................................................................................................... 14
1.5.1. Process Stability ...................................................................................... 14
1.6. Resources...................................................................................................... 16
1.7. Limitations...................................................................................................... 16
2. Theoretical Reference Frame ............................................................................... 18
2.1. Lean Manufacturing ....................................................................................... 18
2.1.1. Define Value for the Customer ................................................................ 18
2.1.2. Identify the Value Stream ........................................................................ 18
2.1.3. Balance the Flow ..................................................................................... 18
2.1.4. Pulling Flow ............................................................................................. 18
2.1.5. Continues improvement........................................................................... 18
2.2. Overall Equipment Efficiency ......................................................................... 19
2.2.1. How is it calculated?................................................................................ 19
2.2.2. Availability................................................................................................ 19
2.2.3. Performance ............................................................................................ 22
2.2.4. Quality ..................................................................................................... 22
2.3. First Time Pass Rate and First Pass Yield..................................................... 23
2.4. Order-point System ........................................................................................ 23
2.4.1. Economic Order Quantity ........................................................................ 23
2.4.2. Safety stock ............................................................................................. 24
2.5. Manufacturability ............................................................................................ 26
2.5.1. Solder Volume ......................................................................................... 26
2.5.2. Solder Paste ............................................................................................ 26
2.5.3. Pad Design .............................................................................................. 27
2.5.4. Trace Design ........................................................................................... 27
2.5.5. Solder Mask Design ................................................................................ 28
2.5.6. Component Orientation ........................................................................... 29
2.5.7. Component and Pad Spacing.................................................................. 29
2.5.8. Handling Stress ....................................................................................... 30
2.5.9. Fiducial Marks and Tooling Holes............................................................ 31
2.5.10. Vias and Tracks..................................................................................... 31
2.6. Testability....................................................................................................... 32
2.6.1. Test Points............................................................................................... 32
2.6.2. Components ............................................................................................ 32
2.6.3. Edge Clearance....................................................................................... 32
2.6.4. Tall and Coloured Components ............................................................... 33
2.6.5. IC Pins..................................................................................................... 33
2.6.6. Polarity Marks.......................................................................................... 33
2.7. Electro Static Discharge................................................................................. 34
4
3. Description of Context .......................................................................................... 36
3.1. Description of the Production System ............................................................ 36
3.1.1. Labelling and Magazines (A, P, S and Y) ................................................ 36
3.1.2. Ultraprint 2000 HiE (B and I)..................................................................... 37
3.1.3. Philips Sapphire (C and J)....................................................................... 37
3.1.4. Philips Emerald (D and K) ....................................................................... 38
3.1.5. Manual Inspection (E and L).................................................................... 38
3.1.6. Electrovert Omniflow 5 (F)....................................................................... 39
3.1.7. My Reflow Oven (M)................................................................................ 40
3.1.8. Automated Optical Inspection (G, H, N and O)........................................ 41
3.1.9. Flex Assemble/Reflow Station (Q)........................................................... 41
3.1.10. IFR (R)................................................................................................... 42
3.1.11. PCB Break-Out Station (T) .................................................................... 42
3.1.12. Casing (U) ............................................................................................. 43
3.1.13. Soldering Robot (V) ............................................................................... 43
3.1.14. Cirrus ELOT (X)..................................................................................... 43
3.1.15. Grease (Y) ............................................................................................. 43
3.1.16. Rework (Z)............................................................................................. 43
3.2. Capacity of the Production System ................................................................ 44
3.3. Initial Status of the Production System........................................................... 45
3.4. Haldex Way.................................................................................................... 46
3.4.1. The 10 Principles..................................................................................... 46
3.4.2. Tier Model – The Haldex Way and Targets ............................................. 47
4. Implementations and Results ............................................................................... 48
4.1. Overall Equipment Efficiency ......................................................................... 48
4.2. Availability Implementations........................................................................... 49
4.2.1. Reviewed Changeover Procedure........................................................... 49
4.2.2. Reducing Stock Costs and Part Shortages ............................................. 50
4.3. Performance Implementations ....................................................................... 53
4.3.1. Component Reel Change Reduction ....................................................... 54
4.3.2. Relocating the LIFO Buffer ...................................................................... 55
4.3.3. Test of a new Solder Paste...................................................................... 57
4.4. Quality Implementations................................................................................. 58
4.4.1. Design Review of the GEN2 Products..................................................... 58
4.4.2. Design Review of GEN2 3M .................................................................... 61
4.4.3. Electro Static Discharge Proposal ........................................................... 62
4.4.4. Solder Paste Procedure .......................................................................... 63
4.4.5. Validating Repeatability in Test Equipment ............................................. 64
5. Summarization of Results..................................................................................... 66
6. Action Plan ........................................................................................................... 68
6.1. Investigation of Solder Ball Formation............................................................ 68
6.2. Official design rules document ....................................................................... 68
6.3. SMED............................................................................................................. 68
6.4. Quality control during production.................................................................... 69
6.5. Investigation of root causes of picks and place problems .............................. 69
6.6. Investigate variations in the screen print quality............................................. 69
6.7. PLC and Robot programming skills on site .................................................... 69
5
6.8. Using OEE for Continuous Improvement ....................................................... 70
6.9. Repeatability in Test Equipment..................................................................... 71
6.10. Flux Residues on Connection Pins .............................................................. 71
7. Conclusions .......................................................................................................... 72
8. References ........................................................................................................... 74
9. Appendixes........................................................................................................... 75
6
7
Declaration of Abbreviations
RFT – Right First Time
A product that is right first time is produced without the need of rework.
FTPR – First Time Pass Rate
This is the rate of products that is RFT through a process or production cell.
FPY – First Pass Yield
This is the rate of products that is RFT through multiple processes.
GEN2 – Generation 2
This is Haldex Brake Product’s most recent product.
OEE – Overall Equipment Efficiency
OEE is a measurement of how efficient a process or production system is.
PCB – Printed Circuit Board
A PCB is a circuit board populated with electronical components.
SMA Lines – Surface Mount Assembly Lines
This is a production line that assemble PCB’s. In this report SMA Lines refers to the SMA
Line 2 and 3 at Haldex Brake Products in Redditch.
PDCA Cycle – Plan Do Check Act Cycle
A working procedure for continuous improvement.
EBS – Electronic Brake System
A sophisticated brake system that through sensor inputs can determine which wheel or axel
needs to be slowed down.
ECU – Electronic Control Unit
The electronic part of the EBS.
EOQ – Economic Order Quantity
A formula used to calculate the most economic order quantity.
PLC – Programmable Logical Controller
A system used to control manufacturing processes.
IC – Integrated Circuit
A chip component that contains several smaller components inside.
ESD – Electrostatic Discharge
A phenomenon occurring when negatively and positively charged materials come in contact
with each other, causing a discharge.
8
AOI – Automated Optical Inspection
Test equipment that through the use of cameras and flashes compare the photos taken with
CAD data and tolerance levels.
CAD – Computer Aided Design
Drawings made with computer software.
IFR – International Flight Recorders
The old supplier name of the test equipment used to test components and function. The
supplier name is still used as the equipment name.
EOLT – End of Line Test
An abbreviation for any test equipment that is at the end of the production line.
LIFO – Last In First Out
The abbreviation for the function of equipment that sends the last entered product out first.
SMED – Single Minute Exchange of Die
A tool used to minimize change over time by converting internal change over to external.
MO – Manufacturing Order
An order of X amount of product Y.
9
1. Disposition
The second chapter of the report contains background information about the project. The
company and the product that the project focused on is described as well as the methodology
used during the project.
The third chapter is the theoretical reference frame and contains information about the
different tools and methods used during the project. The chapter also describes best practise
when designing electronics, which has been used during the implementation phase of the
project.
The forth chapter is a description of context containing more in dept background information
to the project. Description of the production system at Haldex and its initial status as well as a
description of the lean principles used at Haldex.
The fifth chapter describes problems found and implementations made to solve these
problems. The chapter also describes the results of each implementation and their effects on
OEE.
Chapter six is a summarization of all the results in the previous chapter.
Chapter seven contains information about suggestions made for future projects at Haldex. All
suggestions made are observations made during the project that because of time shortage
could not be addressed.
The eight chapter contains conclusions made at the end of the project. Containing both of the
authors insights to the project.
Chapter nine contains the references used in the project report and chapter ten contains the
appendixes to the report.
10
11
2. Introduction
2.1. Background
Haldex Brake Products is having problems with sustaining stability within their electronics
production. In order to raise their throughput and RFT they need to find the reasons of the
instability and implement changes to solve the problems. By solving these problems Haldex
will also reach a higher level of the Haldex Way (Lean Manufacturing Principles) and will be
able to market themselves as a company with successful lean production.
2.2. Goal
The goal is to improve the GEN2 assembly process in order to increase productivity and
achieve more stability within the production process. The goal is also to improve the FTPR
and OEE of the production system.
2.3. Company Presentation
The project initiator is “Haldex Brake Products” which is situated in Redditch England and is
a part of the “Commercial Vehicle Systems” division within the Haldex group. It is a
manufacturing company that have development and production of brake systems that are sold
to manufacturing companies of heavy trucks, trailers and buses. Two of their Swedish
customers are Scania and Volvo. The Haldex Redditch site is the only production unit within
the group that produce electronics.
The Haldex group contains four different divisions which are the Commercial Vehicle
Systems, Garphyttan Wire, Hydraulics Systems and Traction Systems. The group currently
has 23 production plants in the countries Sweden, Germany, England, Hungary, USA,
Mexico, Brazil, India and China. 1
Name
Employees
Net Sales (M SEK)
Haldex Group
Commercial Vehicle Systems Division
Haldex Brake Products
4683
3064
206
7890
4765
-
Table 1 - Employees and Net Sales of Haldex
2.4. Product Descriptions
Haldex Brake Products manufacture approximately 25 different products. The project focuses
on the latest product that Haldex released onto the market, the EB+ GEN2. This product is an
electronic anti lock brake system (EBS) that is mainly used on trailers. This system allows the
truck and trailer to stop or slow down in all road conditions without risking that the driver
loses control. This is achieved by the ability to slow down tires without locking the brakes.
The system also has the ability to slow down separate wheels, axles or sides if it is needed to
keep the trailer on the road.
The EB+ GEN2 contains two modules that are put together in order to assemble a finalised
product, the valve module and the electronic control unit (ECU) module. The valve module
distributes air pressure between the different outputs in order to apply force to the pneumatic
brakes and thereby slow down a specific wheel, axel or side. The ECU is the brain of the
system. It determines which valve output is to be used and how much air pressure is needed in
1
www.haldex.com, 10-03-08
12
order to brake the specific tire as efficiently and controlled as possible. In order for the ECU
to know which commands to send it relies on sensor inputs. These inputs could i.e. be tire
speed or tilting angle. The cables that are connected to the brakes are also manufactured at
Haldex Brake Products and they can therefore deliver complete EBS systems.
There are three versions of the GEN2 that currently are being produced and there is also
another version being developed. The new version is supposed to enter production in
September 2008.
2.4.1. GEN2 5 Aux (003-9227-09)
This is the simplest of the versions of GEN2, it contains the basic functions of an EBS. It can
stop or slow down the tires without locking the brakes, it also contains 5 auxiliaries which
mean that additional sensors or equipment can be connected to the EBS. Example of
equipment that can be connected is an info centre, these are also produced at the Redditch
site. The info centre gives diagnostic information that identifies problems quickly to minimise
downtime.
2.4.2. GEN2 5 Aux, Accelerometer (003-9215-09)
A more advanced version containing the same abilities as the 003-9227-09, additionally it
contains an accelerometer that can identify if the trailer is tiling. The EBS will then brake the
tires needed to reverse the tilting and get the trailer back into a normal state.
2.4.3. GEN2 5 Aux, Accelerometer, Super Aux (003-9210-09)
This is the most advanced version it contains the same abilities as the 003-9215-09 but also
contain a super auxiliary. This adds an additional 3 inputs/outputs to the EBS adding the
ability to connect even more advanced diagnostic equipment like the DIAG+. This is a
computer software which gives information about speeds, distances, brake demand and trailer
load giving complete information about the trailer.
2.4.4. GEN2 3M Master
The newest version is called GEN2 3M Master. The old versions are called 2M which stands
for 2 modulators. Each modulator allows another axle to be controlled by the EBS. So the
new version therefore allows three axles to be monitored and controlled. The reason why the
development of the product was initiated was because of a customers demand for this
specification. One of the most important aspects with the development of this product was
that its manufacturability was investigated and improved.
13
Figure 1 - GEN2 Motherboard
2.5. Method
Through personnel at Haldex a human point of view of the problems was given. By reading
instructions manuals as well as being educated by the personnel the production equipment has
become comprehensive. Through the use of product information and data sheets the products
design for assembly has been interpreted.
Research and data collection has resulted in statistics that have been analysed and used to
make conclusions and suggestions about the problems. When statistics was unavailable, facts
has been gathered instead to strengthen suggestions. These have then been discussed with the
resources of the project in order to see if conclusions could be made. Tests have then been
made to make further conclusions and suggestions about the problems. Through the previous
steps mentioned the goal of the project has been reached.
2.5.1. Process Stability
A continuous improvement methodology was developed and used through out the project in
order to improve processes. The methodology is based on the PDCA cycle with a focus on
obtaining process stability. This methodology is based around seven action steps, the
following figure displays the different steps.
Find a Measurement
Implement Your Plan
Establish a Step Stone
Your Attack Plan
A New Tool in Your Belt
A Continuous Measurement
Observe and Learn
Figure 2 - Process Stability Methodology
14
Find a Measurement
The first step is to find an accurate and informative method to measure the current status of
the process that needs improvement. The measurement has to give information over time in
order to display results of improvements. Questions that should be answered with the chosen
measurement are:
What do we want to measure?
How can this be measured?
What will this measurement tell us?
Is the measurement traceable over time?
Establish a Step Stone
Next step is to determine the current status of the process with the chosen measurement.
Establish a step stone, a reference point which improvements can be measured against in
order to see the effects. The measurement method needs to be consistent through out the
measurement period in order to trace the effects. It is therefore important that the correct
measurement is chosen and that it is accurate.
A New Tool in Your Belt
The first step stone should be used as a tool in order to find shortcomings within the process.
Find deviations and the causes of the deviations. The more informative measurement used the
more information can be retrieved in this stage about the causes of the problems.
A Continuous Measurement
Establish deadlines for new step stones, establish fixed time intervals between measurements
of a new step stones. I.e. determine a new step stone every week or month. With closer time
intervals the measurement becomes more accurate. Some deviations in the process might not
be found in one time period but will reveal themselves as problems over time.
Your Attack Plan
Set up plans in order to attack the deviations found in the previous steps. Find solutions to the
problems and set up deadlines for when the solutions should have been implemented. Set up
improvement teams that should work with implementing solutions of problems. Assign tasks
and ownership of these tasks. I.e. make attack plans for the top three problem causes every
time period, exchange a problem cause with a new one when it has been solved.
Implement Your Plan
When the attack plans have been completed implement all the solutions suggested. If the
problem hasn’t been solved by the time of the next step stone this problem should be pursued
the upcoming time period.
Observe and Learn
When the solutions have been implemented the results should be measured in order to see the
effects. If the implementation has had a positive effect this should be transferred over to other
processes as well in order to learn from the problems. It is important to follow up on the
implementations several time periods after implementation in order to see improvements over
time.
15
2.6. Resources
Name
Title
Phone Number
E-mail
Jerry Ralph
Production Engineering Manager
(Project Manager)
Electronics Production Engineer
Production Manager
University Mentor
University Mentor
Test Engineer
Production Team Leader
Director Production Technology
and Systems
+44 1527 499625
[email protected]
+44 1527 499658
+44 1527 499616
+46 1328 1172
+46 1328 2447
+44 1527 499541
+44 1527 499499
+46 7062 56035
[email protected]
[email protected]
[email protected]
[email protected]
[email protected]
[email protected]
[email protected]
Ann Crompton
Ian Skelding
Lars Wennström
Kerstin Johansen
Peter Williams
Fiona Winterton
Monica Bellgran
Table 2 - People Resources to the Project
2.7. Limitations
The project only contains information, analysis and studies of the electronics production at
Haldex Brake Products in Redditch. The products investigated are limited to the different
variations of the GEN2 product.
16
17
3. Theoretical Reference Frame
3.1. Lean Manufacturing
Lean manufacturing is a production philosophy which focusing on elimination of none value
added activities trough the entire supply chain. This means reduction of waste such as over
production, waiting time, inventory, defects, transportation etc. Lean production can be
achieved through five action steps.
3.1.1. Define Value for the Customer
This means that the customer creates the demand. Without demand no business. Therefore it
is important to define what the customer wants, when it is wanted and how it is wanted.
Because of that the customers demands and requests continuously change it is important to re
evaluate the value for the customer on a regular basis.
3.1.2. Identify the Value Stream
To be able to reduce as much waste as possible it is important to have a good understanding
of the whole process from raw materials to finished and delivered products. By identifying the
value flow it will show which activities that adds value and which does not. This way a
manufacturer knows where to focus to reduce waste.
3.1.3. Balance the Flow
By balancing the flow from raw material to finished products all the wasted resources like
waiting time between processes will be reduced. Optimally would be to have a single piece
flow through the processes. To have a perfect balanced flow means that all processes runs at
the same speed and the product moves from process to process without delay.
3.1.4. Pulling Flow
This means that the customer demand is controlling the production. This eliminates over
production and makes production more flexible to changes in customer demand.
3.1.5. Continues improvement
The last step is to continuously improve all processes. This could be done by standardization
to make sure that known problems never reoccur. A good method is to work according to the
PDCA cycle. PDCA stands for Plan, Do, Check and Act. This means that you first should
plan how to improve the process. When it is decided how, when and who should solve the
problem it is time to do what has been planned. This is often a test or an experiment. When
the “Do” phase is carried out it is time to check the result of the activity. If conclusions can be
made the next step is to act. This could also be described as standardization i.e. decide how a
work process should be carried out and make sure it is carried out the same way every time to
eliminate the initial problem. To complete the cycle it now time to start all over again.2 3
2
3
http://www.lean.org/WhatsLean/Principles.cfm, 2008-07-04
http://www.hci.com.au/hcisite2/toolkit/pdcacycl.htm, 2008-07-04
18
Figure 3 - The PDCA cycle
3.2. Overall Equipment Efficiency
Overall equipment efficiency is a simple and practical monitoring tool. Through three
categories it will help to define problem areas within manufacturing processes. The three
categories are availability, performance and quality and they are used to improve the
efficiency of machines and assembly lines.
3.2.1. How is it calculated?
The results of an OEE calculation are presented through percentages. An example of world
class OEE is shown below.
Availability
Performance
Quality
90.0 %
95.0 %
99.9 %
OEE
85.0 %
The industry average is about 60 % and there are not a lot of companies in the world that have
world class OEE. OEE is calculated though multiplying the three categories together. 4
Availability x Performance x Quality = OEE
The first time a company measures OEE they usually find themselves way below the industry
average. This is not uncommon but by identifying shortcomings within production through
the use of OEE this measurement usually is raised to the industry average in short period of
time.
3.2.2. Availability
This category measure the time when the equipment actually was up and running compared to
the time that was available to it. It is calculated through six gathered information sources
available time, planned downtime, planned operative time, unplanned downtime, change over
time and available operative time. These six different information sources are explained
below.
4
http://www.oee.com/world_class_oee.html, 2008-07-06
19
Available Time
This is the time when the equipment is available for production. I.e. the equipment is
available for production 24 hours each day then the available time is 24 hours. The only
exception for this is when the equipment purposely have not been running for reasons like
bank holidays.
Planned Downtime
This is the time when it is planned that the equipment is not supposed to run. The planned
downtime is breaks, lunched, planned maintenance and planned meetings. It is only these
categories that are planned downtime, things that are planned for and happen on a daily or
weekly basis. The times for these are also to be constant in order for them to be planned. If a
meeting always varies in time you actually can not say that it was planned.
Planned Operative Time
This is the time that is made available to production. It is a simple calculation of subtracting
the planned downtime from the available time.
Planned Operative Time = Available Time – Planned Downtime
The time that is left is the time that you have planned to be producing parts in your
equipment.
Unplanned Downtime
These times needs to be collected as they happen in order to get accurate figures. It is the
times of when the equipment is not running because of unplanned reasons. I.e. the equipment
breaks down causing a halt to production or that there is a part shortage making it impossible
for the operator to proceed with the work. An unplanned downtime needs to be at least 10
minutes in order to be classified as a downtime, if it takes less it should not be recorded.
Different reason codes are used to classify the unplanned downtime in order to group
problems together and by that making them easier to target as a problem area. The reason
codes are explained below.
M – Unplanned Maintenance
When unplanned maintenance is performed this reason code should be used. This is when the
operator chooses to stop the equipment to prevent future breakdowns from happening. I.e. the
operator stops the equipment in order to make an adjustment.
B – Breakdown
This reason code should be used when there is a breakdown causing a stop in the equipment.
The operator could not prevent the stop and is therefore a breakdown. I.e. the equipment
stopped because of malfunction.
O – Waiting for Operator
If there is an operator stationed at the equipment but he/she is not available to the equipment
this reason code should be used. I.e. the operator is working elsewhere because of personnel
shortage.
20
E – Waiting for Engineer
This reason code should be used when production has stopped and it needs the attention of an
engineer in order to solve the problem. I.e. test equipment has stopped working and needs an
engineer in order to begin production again. The problem can not be solved by the operator.
Q – Quality Stopped Process
The operator notices a quality problem within the output of the equipment and therefore stops
the production in order to adjust the problem. I.e. the products coming out of the equipment
has defects and the operator knows how to solve the problem.
P – Part Shortage
When there is a part shortage and the operator needs to stop the process in order to fill up the
shortage this reason code should be used. This reason code should also be used if the operator
has to stop the production in order to look for a part. I.e. the equipment needs labelled boards
but there are none, he/she therefore needs to stop production in order to label them.
N – No Work
This reason code should be used when there is an operator stationed at the equipment but
he/she does not have any products to work on in the equipment. I.e. the operator needs to wait
by the equipment for products that are on their way.
S – Reoccurring Setup
This reason code should be used when there is a reoccurring setup in the equipment. The
setup needs to have the same duration every time so that one can measure the frequency
instead. I.e. the operator does a test which always takes a fixed number of minutes and this is
done several times each shift, the operator then puts down the frequency of the setup.
Change Over Time
This is the time when the equipment is not running because of an undergoing change over.
The times that are to be recorded are from when the equipment stopped producing products to
when it begins producing once again. All change over times are to be recorded, the 10 minute
rule do not apply here.
Available Operative Time
When all the information about unplanned downtime and change over time has been gathered
one can calculate the available operative time. This is the time when production was actually
up and running. It is calculated through subtracting the unplanned downtime and the change
over time from the planned operative time.
Available Operative Time =
Planned Operative Time – Unplanned Downtime – Change Over Time
Calculating Availability
When all the numbers have been gathered one can calculate the availability, this through
dividing the available operative time with the planned operative time.
Availability = Available Operative Time / Planned Operative Time
This will give a percentage and basically tells how much of the available production time was
used for production.
21
3.2.3. Performance
This category tells how well the equipment performed during the production time calculated
in the availability. If it were a perfect world this figure would be 100 % even though there are
breakdowns and other unplanned downtime reasons.
But in reality that this is not possible, reasons why the performance is lower than perfect can
for example be that the equipment is not running as fast as it should or that all the downtime
in the availability calculation has not been filled in.
An unrecorded breakdown tell that the equipment was up and running when it actually was
not, this making one to believe that the equipment was not running as fast as it should and
therefore lowers the performance. It is very important that everything is filled in as it happens.
There will always be some performance losses because of unplanned downtime. This is
because of the downtime that is not recorded so if there are a lot of these this will show in the
performance.
The performance is calculated through the number of products processed and the ideal time it
takes to process one product. The reason why the average time it takes to produce one product
is not used is that one are not aiming for the average but for the perfect world. This is not
possible but it is the only way to know if the equipment is doing the very best that it can.
Products processes and the ideal cycle time are multiplied together and this will give the time
it actually should have taken to produce those products in a perfect world. The results of this
are then divided with the available operative time used in availability.
Performance =
(Number of Products Processed x Ideal Time per Product) / Available Operative Time
The percentages that this gives tell how far away the equipment is from perfect production
efficiency.
3.2.4. Quality
This category tells the quality of the products that are processed. Every error causing products
to be reworked or scrapped should be recorded and accounted into this calculation. The first
thing to calculate is the number of approved products.
Number of Approved Products =
Number of Products Processed – Number of Rework and Scrap
By dividing this number with the number of products processed the quality is calculated.
Quality =
Number of Approved Products / Number of Products Processed
One can never have an OEE of 100 % because there will always be breakdowns, change over,
performance losses and quality failures. OEE is a very useful tool and is part of many lean
manufacturers’ methods to get leaner and more efficient. 56
5
6
http://www.oee.com/oee_factors.html, 2008-07-06
http://www.oee.com/calculating_oee.html, 2008-07-06
22
3.3. First Time Pass Rate and First Pass Yield
First time pass rate is a measurement used to determine the quality of the output of a process.
FTPR is the rate of products that are right first time (RFT) through a process. First time pass
rate indicates how many of the processed product that went through without the need for
rework. Rework processes is non value added activities therefore it is important to strive for
100% FTPR.
When calculating overall FTPR it is important to consider all the process steps within the cell
or work area. This is calculated by the rate of products that goes through all linked processes
without the need for rework. Overall FTPR is also commonly called First Pass Yield (FPY).7
3.4. Order-point System
The most common way to determine when to order is to use an order point system. This
system uses a specified stock level called the order point to determine when to order. When
the stock level goes below the order point a new order is to be raised. The order point is based
on the demand during the lead time and the safety stock that is needed. This means that the
order will arrive when the stock level is equal to the safety stock if the demand is like
predicted. The safety stock will cover for variations in demand during the lead time. Below is
an example of how the stock level could look like when using an order point system with
fixed order quantity and a safety stock.8
Figure 4 - Order-point system
3.4.1. Economic Order Quantity
EOQ is a method of comparing the elements of the cost to supply an item. By using this
method the economic order quantity is determined in order to minimize total costs of stock.
EOQ is calculated by using the following formula and the following inputs.
7
8
The Haldex Way 2nd Edition, Jan-Erik Dantoft, 2006
http://www.ies.luth.se/log/courses/iet064/Lektioner/8_Lagerstyrning.pdf, 2008-07-04
23
Annual Usage
This is the annual usage of an item based on forecasts. If forecasts are not available the annual
usage can be based on historical data.
Order Processing Costs
This is the sum of all the fixed costs that occur each time an item is ordered. This includes the
cost of all steps from raising the order to handle the goods when it arrives. The order cost is
primarily the cost of labour associated with processing the order. Costs of phone calls, faxes,
postage, envelopes, transaction etc. associated with the order can also be included to get a
more accurate costing.
Carrying cost
Carrying cost is the cost associated with having inventory on site. Carrying cost is
represented as the annual cost per unit of the average stock that is kept on site. The cost is
calculated as a percentage of the average stock value for an item. Parameters that are
included in the carrying cost is as following.
Capital binding cost is the cost of binding capital in raw material. This is determined by the
interest that is paid for the capital that is invested in material or the loss of interest that could
have been earned if the capital was invested instead of being tied up.
Insurance costs and taxes that are related to the total value of the inventory should also be
included in the carrying cost. The cost of the physical storage area should only be included if
it is variable based on the inventory level.9
3.4.2. Safety stock
To make sure that the stock does not run out a safety stock is often needed. Reasons to stock
shortages could be uncertainties in demand during the lead time or length of the lead time. It
could also be caused by human mistakes or system malfunctions.
To determine a suitable safety stock two different aspects need to be taken into consideration.
The first is the service factor. This is based on how certain the business wants to be that
production is supplied at all time. When the service level is decided the normal distribution is
used to calculate the service factor.
The second aspect is the standard deviation during the lead time. This is the deviation during
the time between when the order is raised and when it is available for production. The
deviation should be determined based on recent history of demand.
The standard deviation during the lead time is then multiplied by the safety factor to
determine the safety stock with the decided service level. 10
9
http://www.inventoryops.com/economic_order_quantity.htm, 2008-07-03
http://www.inventoryops.com/safety_stock.htm, 2008-07-03
10
24
25
3.5. Manufacturability
When designing electronics for assembly there are numerous aspects to consider. Due to
circuit density on surface mounted boards it is imperative to design for assembly. Things to
consider are trace and component spacing as well as component size, orientation and position.
If a board is designed for assembly a great deal of rework can be avoided. For a board to have
high manufacturability it needs to have accurately placed components on the PCB with
reliable solder joints. These attributes of design all need to be inspected and tested before
taking the product into production.
3.5.1. Solder Volume
The biggest source of component faults is excessive solder volume. Excessive solder volume
does nothing for strength in the solder joints. Drawbridge effect and bridging are common
results of excessive solder volume. Inadequate solder is the source of weak or missing solder
joints for passive components and coplanarity problems with IC-circuits.
When manufacturing a PCB it is important to know that non-coplanar parts like IC-circuits
needs more solder than small passive components to get proper solder joints and less rework.
It is important to find a balance of solder volume to satisfy the IC-circuits and not to have
excess on the passive parts. It is the height of the stencil that decides the thickness.
Figure 5 - Drawbridge effect
3.5.2. Solder Paste
Solder paste is sensitive to humidity and could easily be contaminated, if the paste is exposed
to air it will oxidize this will make the paste degenerate causing bad printability. Therefore
there are specifications about the handling of solder paste during storage and usage. The
specifications are from KOKI, the supplier of the solder paste used at Haldex. KOKI specify
that the paste should be stored in a fridge with a temperature of 5 - 10 ºC, it should never be
frozen. It is recommended to store the solder paste containers on its side and rotate them
regularly. This will help to prevent layering in the paste, since the solder and flux have
different densities. When a container is removed from the fridge it must be allowed to reach
room temperature without any heating method. It can be removed from the fridge the previous
day to ensure that it has reached room temperature, the lid should never be removed during
this time.
When the solder paste have reach room temperature and is going to be used it should be
stirred by using a stainless steel or chemically resistive plastic spatula. It is recommended to
stir at least 1 – 2 minutes to get the correct viscosity. When the paste is to be added to the
stencil it is recommended to use plastic tools to ensure that the stencil do not get damaged. To
much solder paste added to the stencil results in lesser printability so there should never be
more solder paste than to the height of the squeegee blade.
26
Already used solder paste should never be mixed with fresh solder paste. It is allowed to reuse
solder paste if it has been removed from a stencil and placed in a separate container with the
lid on while i.e. a change over is performed. Old solder paste that has been used should
according to KOKI guidelines be exchanged at the start of every shift when producing 24
hours a day.
The ambience of the printing process should be 25 ± 5 º C and a humidity of 40 – 60 % RH.
Air conditioning is to be controlled so that it does not affect the printing process, wind can
cause the solder paste to dry out.
Squeegee speed and separation speed should be as low as possible. The pressure on the stencil
should also be as low as possible but still enough pressure to get a clean stencil after each
print. If the paste has the correct viscosity it should roll in front of the stencil, any wave like
or slump movement in the solder paste points to bad solder paste. The stencil should be
thoroughly cleaned between changeovers, both top and bottom.
3.5.3. Pad Design
The soldered joints size and shape are affected by the design of the solder pads. The
components that are most prone to depend on pad design are small passive components due to
their low mass. Pads should be tested in the manufacturing process and the reflow process to
determine if the pad designs are working as they should.
3.5.4. Trace Design
Traces connected to the pads are another source of faults. During the reflow process heat is
transferred from the board to the pads which then reflows the solder paste. Symmetry is
important because of the thermal mass induced on the pads during the reflow. If asymmetry
in the pads, solder migration can result in drawbridges, missing solder joints or shorts.
Figure 6 - Solder migration
Vias and plated thru-holes that are present can result in starved or missing solder joints caused
by capillary action of the solder. Guide lines for trace designs are:
1. Limit the number of traces entering a pad to a single trace if possible to reduce solder
migration.
2. Symmetry is important. Balance the trace entry to a pad to minimize any induced
component rotation.
3. No vias or plated thru-holes in a pad, it steals solder from the joint.
A test to see if the trace and pad design is working correctly is to screen print a PCB and then
reflowing it without any components. Signs of migration or missing solder can then easily be
detected and evaluated. In the following figure recommended trace designs can be found.
27
Figure 7 - Recommended trace designs
3.5.5. Solder Mask Design
Solder mask materials vary from dry film laminate to screen wet film or photoimageable
liquid solder mask. Solder mask thickness range from 0.6 mils (15.2 µm) to 9 mils (22.8 mm)
across the different mask types. Improper solder mask design can cause two different types of
faults. The first fault is misregistration of solder mask layout or obscuring of a pad surface
causing faulty solder joints.
Figure 8 - Ideal solder mask
Figure 9 - Bad solder mask print
The second fault is solder mask thickness. If the solder mask is too thick it can result in
drawbridge effects, this could be eliminated by having solder mask windows under
components. It also makes cleaning of flux residues trapped beneath components easier. You
should place solder mask between IC-circuits pads if there are traces running between those
pads. High density boards should use photoimageable solder masks to minimize registration
problems.
28
Figure 10 - Solder mask windows
3.5.6. Component Orientation
Passive components that are of low mass can suffer from disorientation due to differential
heating in the reflow process. To prevent this, the orientation of the passive components
should be so that the solder joints enter the solder zone simultaneously and low mass ICcircuits should enter along their long axis. The orientation should be along a parallel axel to
the direction of the conveyor track movement. Small components should have perpendicular
long axis orientation to the conveyor track movement.
Figure 11 - Component orientation
3.5.7. Component and Pad Spacing
Component separation is an important factor to consider when designing for
manufacturability. It becomes difficult to inspect solder joints or remove defective
components when pad to pad or component body to pad spacing drop below 50 mils (1.175
mm). The spacing can be reduced when using reflow soldering to a minimum of 25 mils
(0.635 mm) if needed but this can reduce the yield of the process. Components shouldn’t be
placed 137 mils (3.21 mm) from the edge of the board because of the conveyor tracks. ICcircuits should have at least 6 mm of clearance around them to minimize solder volume
problems.
Figure 12 - Component spacing
29
3.5.8. Handling Stress
Post handling stress is another factor to take into consideration, this could happen during
testing, depanelizing of the mother board, installation of connectors or mounting of the PCB
into a case. There are not a vast amount of research within the area of bending and handling of
boards. But there are some guidelines which have proven to lower the amount of post
handling rework.
There are areas on the board that always experience too much deflection to achieve high
yields and reliability. Such areas are corners and edges. If components are kept away from
them by more than 200 mils (4.7 mm) these problems would be minimized. Deflection causes
stress to the board which can result in cracked solder joints.
Figure 13 - PCB corner stress
The GEN2 motherboards contain three smaller boards and there are several techniques
available to separate these boards from the motherboard. There are a few existing bad
techniques, for example:
1.
2.
3.
4.
5.
6.
Prescored boards with manual breakout
Perforated boards with manual breakout
Shearing including blanking shears
Routing
Breakout tabs, prerouted boards
Prepunched boards
Figure 14 - High stress areas and break out stress
30
The reason why these techniques are bad is that they might expose the PCB and its
components to too much deflection and stress so that solder joints might crack. But there are
also some techniques that work:
1. High speed fine tooth saws, can only do linear cuts and need a rigid fixture
2. Laser cutting, can only cut through 47 mils (1.1045 mm) thick PCB because of
excessive charring of board edges
3. Water jet, is slow and noisy but is the most flexible technique
These techniques work without to many negative effects on component yields. They are
somewhat more restricted than the bad examples but the advantages in the long run result in
higher component yields. There should be PCB bridges between the individual boards to
support them through the production process. These should be placed 25 mm from each other
to give proper support.
3.5.9. Fiducial Marks and Tooling Holes
Fiducial marks are used as reference points by optical systems to locate the position of a
board within production equipment. The camera locates the fiducial and determines whether it
correctly positioned or within tolerances. There should be at least two fiducial marks on every
individual board, one at each side. They should be placed diagonally or if more than two
marks have been placed they should be symmetrically placed.
The marks should be round and copper plated with at least 1 mm across the diagonal. They
should then have a copper free area which is also clear of solder resist around the plated
centre. This should then be surrounded by a “robber bar” which is a small copper lining. An
image of a fiducial mark is presented below. No test points are to be placed 5 mm from the
centre of the fiducial because of possible confusion in the machines.
Tooling holes should be used as fixtures to the board, there should be at least two on each
individual board. They should be placed diagonally from each other as far from each other as
possible. The holes should be at a minimum of 125+3 mils (2.9375+0.0705 mm) over the
diagonal. Referenced to the fiducial marks the maximum allowed offset is 2 mils (0.047 mm).
3.5.10. Vias and Tracks
Vias should always be covered with solder resist if they are not going to be used as a test
point. Vias should not be placed adjacent to solder pads. They should neither be touching nor
overlapping the pads. If a via have to be placed near a solder pad it shall always be covered by
solder resist.
Tracks should have the minimum distance of 0.2 mm spacing between each other. They
should not be less than 0.2 mm wide and the thickness should be 75µ m. To protect the board
from ESD, tracks should be placed 10 mm from the edges where conveyor tracks is in contact
with the board.11
11
Surface Mount Zero Defect Design Check List, John Maxwell
31
3.6. Testability
When designing a PCB for testability there are a couple of aspects to take into consideration.
Most of these aspects are during the design period of the product and the aspects include for
example the layout of test points and test pad requirements.
3.6.1. Test Points
Components should never be probed directly on their solder joints or component leads. This
could result in latent faults which can reveal themselves during the customer’s use of the
product which results in returned products. You should never use vias as test points because
of damage that can be done upon the vias barrel. A via can be used if no other alternative
exist, but it should then be filled with solder to make connectivity better.
Test pads should be placed on one side of a double sided board to minimize expensive double
sided test fixtures. The test pads should be circular and nominally 35±3 mils (0.8225±0.0705
mm) in diameter. These pads should also be located at least 125 mils (2.9375 mm) from edges
because of the conveyors tracks which might need the space.
The spacing between the pads should be 100 mils (2.35 mm) if possible, no less than 50 mils
(1.175 mm) should be used. There should be at least 40 mils (1.016 mm) of clearance
between test pads and components to not damage the component or the probe. A components
height as distance to a test point is a good reference.
Unused traces should be connected to test pads so that they can be tested to ensure that faults
found are not associated with these traces. To ensure better connectivity the test pads can be
coated with solder or conductive non-oxidant material such as gold. There should be test
points for every component because it results in more accurate readings, cluster tests should
be avoided if possible.12
3.6.2. Components
The following general rules apply to the application and use of components:
1. Avoid the use of transparent components.
2. Try to avoid using glass-bodied components that reflect.
3. If possible, avoid metal plates such as screening or support brackets that reflect.
4. Do not mark components such as tantalum capacitors with a marker pen before
inspection, this causes confusion when checking component polarity.
3.6.3. Edge Clearance
The distance from a component to the edge of a PCB should not be less than 4.75 mm on both
sides of the boar. This is to make clearance for the conveyor track.13
12
13
http://www.ipc.org/, 2008-06-14
SMEMA 1.2: Mechanical Equipment Interface Standard
32
3.6.4. Tall and Coloured Components
A tall component is the ones that are more than 350 mils (8,225 mm) high. Components of
these heights should be placed together preferably in rows to minimize mixture with low
components. This is because of that the optical inspection systems get shadows from the tall
components onto the low components which results in errors. Low components should be
placed at least the distance of the height of the tall component from the tall component. Other
colours than black should be avoided because of reflections of flashes in the optical inspection
systems.
3.6.5. IC Pins
To minimize reflections it is important to avoid the use of white or yellow service print under
the IC pins. It is also important to not place high reflective test pads or holes under the IC
pins. These types of high reflective surfaces can be misinterpreted by the AOI as short circuits
and cause false alarms. To improve inspection of solder joints it is preferable that the distance
from the end of the pin to the end of the connection pad is equal or greater than 0.5 mm.
≥ 0.5 mm
Figure 15 - Distance to end of pads
3.6.6. Polarity Marks
In order to maximize the AOI’s ability to discover components that is placed with the wrong
polarity it is important to use components with distinctive polarity marks. It is recommended
to follow these guidelines when choosing a component.
There should be a good contrast between the polarity mark and the component body.
The polarity mark must be solid i.e. a continual line. Text or other types of broken marks
make it difficult to differentiate between the polarity mark and the component body.
There should be a gap between the polarity mark and the component edge. It is recommended
having a gap of at least 1/8 of the component length.
The polarity mark should be at least 1/8 of the total component length in width.14
14
Automated optical inspection guidelines for PCB assembly design, Orbotech, 2008
33
Good contrast between polarity mark
and component body
Distance from edge should be
Minimum 1/8 of total
component length
Polarity mark width should be
minimum 1/8 of total component
length
Figure 16 - Polarity markings
3.7. Electro Static Discharge
This phenomenon occurs naturally and can not be eliminated. Everything around us is loaded
with negative and positive ions. Humans generate a lot of electrostatic energy just by moving
around i.e. by rubbing synthetic materials against each other. When something that is loaded
with positive ions comes in contact with another object loaded with negative ions an
electrostatic discharge occurs. This discharge can harm electronics in many different ways
and is a problem when producing electronics.15
The goal is to control electrostatic discharge (ESD) and minimize its effects on the products.
Control of electrostatic discharge is essential to ensure quality of electronic products.16 The
effect of ESD is something that is not easy to prove. In the worst cases ESD damage will not
be detected in production, but it will show up much later when the costumer uses the product.
This is called latent damages and occurs when the components are only weakened by ESD.17
Latent damages can be caused by even a tiny discharge that humans can not even see, hear or
feel. 18
To be able to prevent ESD damages it is important to know what causes it. Materials can be
broken down into three categories. Generative materials are active static generators i.e.
plastics, hair and polyester clothing. These materials are important to keep away from contact
with sensitive electronics products. Neutral materials i.e. wood, paper or cotton does not tend
to generate static electricity. They also work isolative which make them useful as a protection
between generative materials and electronics. Conductive materials like metal neutralize static
electricity when bounded to ground. This could be used to dissipate static electricity from
personnel and equipment. By using these materials the right way ESD hazardous effects can
be reduced. I.e. to protect the products from the static that is generated in the operator’s
clothes a cotton coat could be used. Grounded equipment and flooring in combination with
conductive shoes can be used to dissipate static electricity from personnel and machines. 19
15
http://www.esda.org/basics/part1.cfm 2008-07-03
Electronics manufacturing processes, Prentice-Hall Inc. p 449, Landers, T.L, 1994
17
Microelectronics System Packaging Technologies, C 17-8, Tummala, R.R.T, 2003
18
Electrostatic Discharge Control, Vermason Ltd.
19
http://www.allaboutcircuits.com/vol_3/chpt_9/1.html, 2008-07-03
16
34
35
4. Description of Context
4.1. Description of the Production System
Through this chapter the production system of the electronics at Haldex Brake Products is
explained. The processes are described in order as if a PCB would have been assembled in the
system. The following process chart describes the flow.
Figure 17 - Process chart of production lines at Haldex Redditch
There are two connected automatic production lines where the first line prints, assemble and
reflow the bottom side of the PCB and the second line does the top side. After the automatic
lines there is a manual line which tests and finalises the product. The PCBs that are fed into
the production system contain three smaller boards which are held together by a frame, this is
called a motherboard.
4.1.1. Labelling and Magazines (A, P, S and Y)
When a batch of GEN2 is initiated the PCBs are first labelled with an individual barcode and
then stacked in magazines of 20 PCBs. The barcode is used to identify the PCB throughout
the production system. The magazines are manually fed into an auto magazine handler. The
magazine handler then automatically loads a new PCB into the system when needed.
There is a second auto magazine handler placed at the end of the production system which
loads the populated PCBs into new magazines when they have gone through the automatic
production lines.
36
4.1.2. Ultraprint 2000 HiE (B and I)
The Ultraprint 2000 is a fully automated stencil printer that deposits solder paste on printed
circuit boards prior to population of surface-mounted components. The supplier of the
machine is the company MPM and this is the first process in the production system. 20
Figure 18 - Photos of Ultraprint 2000
The following figure explains the different steps of the stencil printing process. The machine
uses a squeegee to press solder paste into the apertures of a laser etched stencil that is
positioned on top of the PCB. Though the height of the stencil the correct amount of solder
paste is applied to the PCB and through the positions of the apertures the solder paste is
placed on top of the component pads. 21
Figure 19 – The different steps in a screen printing process.
4.1.3. Philips Sapphire (C and J)
The second process in the production system is the Philips Sapphire pick and place unit. Its
purpose is to place small components like resistors and capacitors onto the PCB.
An optical inspection of the PCB is performed prior to placement of components. The
machine uses twelve heads with nozzles to place the components. The system uses vacuum to
pick up the components and by having twelve heads it can pick up and place twelve
components at a time. Each individual component is inspected by a laser before placement in
order to determine if it is the correct component and that it has the correct orientation.
20
Ultraprint 2000 HiE Series System Support Guide
SMD Technology, Solder Paste and Solder Paste Application, Philips Electronic Manufacturing Technology,
1995
21
37
Figure 20 - Photos of Philips Sapphire
The Philips Sapphire is equipped with two sets of heads, this allows it to process two PCBs at
the same time. Half of the components are placed by the first set of heads and is then moved
to the next set for placement of the remaining components.
The components are fed to the pick and place unit by feeders. The feeders are loaded with
reels of single packaged components. When a component is picked up from the pick up
location the machine triggers the feeder to feed the next component into position. This allows
the pick and place unit to pick up a certain component at the same position every time. Every
component has an own feeder. This gives the pick and place unit access at all times to all the
components needed to assemble a PCB, this allows high speed placement of components of
various sizes.
4.1.4. Philips Emerald (D and K)
The third process is a pick and place unit called the Philips Emerald. This machine places the
larger components onto the PCB. The Emerald is equipped with two heads allowing it to
place two components at a time. This machine operates in the same way as the Sapphire apart
from that it only has one set of heads that are placing all the components and can therefore
only process one PCB at a time.
Figure 21 - Photos of Philips Emerald
4.1.5. Manual Inspection (E and L)
After the pick and place units have placed the components a manual inspection is performed
on the first assembled PCB. This is only done at the beginning of a new batch to see if the
change over have been correctly configured. The PCB is compared with the schematics of the
product that is about to be manufactured.
38
4.1.6. Electrovert Omniflow 5 (F)
The Omniflow 5 is the first of the two reflow soldering ovens in the production system. Both
ovens are convection reflow ovens which mean that air is directed through a heating element
and then directed onto the material that is to be heated, this is shown in the following figure.
The heated air is evenly distributed through symmetrical holes in the oven.
Figure 22 - Convection reflow process
The conveyor track transports the PCB into the oven with a speed that will determine the time
that the PCB will pass through every zone of the oven. The oven has five different heating
zones that all can be set to different temperatures. 22
During a reflow process with solder containing lead the characteristic of a reflow process
should look like the one in the following figure. The initial stage of the reflow process is to
preheat the solder, therefore named preheat zone. The temperature should rise slowly up to
the temperature of the soak zone, this will minimize the possibility of solder paste spatter
caused by out-gassing.
The soak zone is used to slowly get the solder pastes temperature up to the of the peak zone
and to active the flux in the paste. The flux is used to remove residues and oxygen in the paste
in order to increase the solder ability.
22
Omniflow 5 Instruction Manual
39
Figure 23 - Heat profile of convection reflow process
The peak zone is where the solder goes above its melting point and where the joint is
soldered. Too much time spent in this zone can cause possible decreasing joint strength in
inter-metallic layers. The last zone is a cooling zone where the temperature should decrease
slowly in order to get the joints to a solid state. Several heating zones can be used as either
preheat, soak, peak and cooling zones. The times and temperatures depend on the solder paste
used in the process.23 24
Figure 24 - Photo of Omniflow 5
4.1.7. My Reflow Oven (M)
This is the second reflow oven used in the production system. This oven has 6 heating zones
and 2 cooling zones. Because it has more heating and cooling zones the temperatures of the
PCB and solder is easier to define. This oven solders the components on the top side of the
PCB. The components on the bottom side is smaller and is therefore mounted first on the
PCB, if the bigger components on the top side would have been mounted first their mass
could make them fall of the PCB during the second reflow in the My Reflow Oven. 25
23
SMD Technology, Reflow Soldering, Philips Electronic Manufacturing Technology, 1995
Technical Information KOKI Super Low Void Solder Paste
25
User manual myReflow.com
24
40
Figure 25 - Photo of My Reflow Oven
4.1.8. Automated Optical Inspection (G, H, N and O)
After that the components have been soldered in the Omniflow 5 an automated optical
inspection (AOI) is performed. The machine inspects if the components have been correctly
placed and if they have been correctly soldered.
It combines PCB Computer Aided Design (CAD) data with an online component library to
create an inspection program. The machine is equipped with several standard resolution and
high resolution cameras with different angles several flashes to take a multitude of
photographs of the PCB. These photos are then analysed through comparison with reference
photos and set tolerance levels to determine if soldered joints have enough paste and that they
have been soldered correctly. It also determines if the right components are at the right place
and have the correct orientation.
Figure 26 - Photo of AOI
4.1.9. Flex Assemble/Reflow Station (Q)
When the PCB has passed though the AOI four flex cables need to be mounted in order to
connect the three separate boards. This is carried out in a part automatic and part manual
station. An operator load and unload the machine with PCBs and the machine solders the flex
cables onto the PCB using a heated element.
41
Figure 27 - Photo of flex station
4.1.10. IFR (R)
A component and function test is carried out in a rig called the IFR. It tests circuits and
components through test points placed on the PCB. If an error is found the PCB is sent to the
rework station. The IFR test covers 92.2 % of the components on a GEN2. There are nearly
800 components on a GEN2 but 232 components aren’t tested individually but through circuit
tests the percentage is as high as mentioned.
Figure 28 - Photos of IFR
The function test uses simulations in order to test the functionality and if an error occurs it is
sent to the rework station. The IFR can give information about RFT, failures and the rework
done to fix the failures.
4.1.11. PCB Break-Out Station (T)
The motherboard contains three smaller boards that are held together by bridges. The machine
cuts these bridges by pressing two sharp tools against each other. The scrap is separated from
the boards by being held by vacuum nozzles. The boards are unloaded and at the same time
the scrap is thrown away. After this process the boards are connected only by flex cables.
Figure 29 - Photo of break out machine
42
4.1.12. Casing (U)
The separated boards are then placed in a casing in order to protect it when it eventually is
mounted onto a trailer. This is a simple manual process done by an operator.
4.1.13. Soldering Robot (V)
To connect the inputs and outputs of the board to the connector pins in the casing a soldering
robot is used. The robot solders each pin one by one which is a totally automated process. The
operator loads and unloads the PCBs.
Figure 30 - Photo of soldering robot
4.1.14. Cirrus ELOT (X)
When all the pins are properly soldered the inputs and outputs are tested in a test machine
called the Cirrus EOLT. The machine uses a learning method to decide what tolerance levels
to use. A correctly measured GEN2 has been used as a reference which the machine has been
taught.
4.1.15. Grease (Y)
There are a couple of placed components on the PCB that are formed as cones which are filled
with grease manually. Connection pins to the valves are to be placed into these cones in a
later stage of the production. The greasing is done to prevent potting to get in under the pins.
When this has been done the cases are stored in ESD protected boxes for transport to further
processing.
Potting is a process where liquid is poured on top of the electronics, the liquid then hardens
and protects the components from dirt and dampness during the use of the product.
4.1.16. Rework (Z)
The rework station is intermittently used because of the lack of operators during certain shifts.
When there are operators on the station they have to correct the PCBs that have failed
somewhere in production.
When the operators are going to correct a PCB they get a slip of paper containing information
about what needs correcting if it comes from the IFR. The operators doing the rework have
years of experience and are skilled in correcting the errors. When the PCB is corrected it is
once again tested in the IFR.
43
If the PCB comes from the AOI they scan it and get a print on a computer screen which tells
them what is wrong and where it is wrong. They then mark this error and send it back onto the
production line, it is not tested in the AOI again. The operator doing the rework coming of the
IFR then rework the marked ones before they are tested in the IFR. A PCB is allowed to be
reworked three times, if the errors haven’t been corrected at this point it is scrapped.
Figure 31 - Photos of rework stations
4.2. Capacity of the Production System
These are the cycle times and capacities of the processes in the production system. The
numbers are subjected to transport times between processes and errors in the equipment
making production come to a halt. It is also subjected to that the PCBs are RFT. These are the
cycle times of GEN2 products.
Name of Process
Capacity (PCBs/Hour)
Cycle Time / PCB
Production Line
MPM UP 2K
Philips Sapphire
Philips Emerald
Electrovert Omniflow 5
Orbotech AOI
MPM UP 2K
Philips Sapphire
Philips Emerald
Vitroincs Soltec My Reflow Oven
Orbotech AOI
90
25
40
90
120
90
30
40
90
120
40 sec
2 min 25 sec
1 min 30 sec
40 sec
30 sec
40 sec
2 min
1 min 30 sec
40 sec
30 sec
3
3
3
3
3
2
2
2
2
2
Bottleneck Capacity
Flex Assembly/Reflow
Aeroflex IFR
TC Break-Out
Casing
TC Soldering Robot
Cirrus EOLT
25
12
17
240
60
14
240
2 min 25 sec
5 min
3 min 30sec
15 sec
1 min
4 min 15 sec
15 sec
2&3
Manual
Manual
Manual
Manual
Manual
Manual
Bottleneck Capacity
12
5 min
Manual
Bottleneck Capacity of all Processes
12
5 min
All
Table 3 - Capacity Figures of the Production System
These numbers are not reflecting the real capacity of the production system because they are
subjected to failures. If you account the fact that there is rework and retesting of PCBs after
the IFR it will show that this test is the bottleneck of the system. Today they got a FTPR with
variations between 75 ± 5 %. By assuming that all PCBs that fail the first time have had
44
rework and then passes the second test. It would give that 25 ± 5 % of the PCBs need to be
retested and therefore lowers the IFR capacity. In this case the real capacity would be
approximately 13 ± 1 PCBs/hour. This is not the case because often the PCBs need a second
and third rework before passing or even being scrapped. If you account this the capacity will
be even lower and the test becomes a bottleneck to the system.
4.3. Initial Status of the Production System
The initial status was determined in order to discover deviations from perfect production.
Initial status is also to be used to evaluate improvements made to the system. The status of the
system was determined by analysing the FTPR and OEE for the different processes within the
production system. The status was only determined in the equipment that are affecting the
manufacturing of GEN2.
Overall Equipment Efficiency
Availability
Performance
Quality (FTPR)
OEE
Average Products per Week
SMA Lines
Hot Bar
IFR 1
IFR 2
Casing Line
67.4 %
66.4 %
81.0 %
36.2 %
65.4 %
71.5 %
94.4 %
51.1 %
46.7 %
52.7 %
85.3 %
21.0 %
55.6 %
58.4 %
77.1 %
25.0 %
61.8 %
77.4 %
94.0 %
44.9 %
2501
709
368
516
836
0
1
0
20
6
0
2
0
43
6
0
1
0
35
13
0
3
0
21
12
Table 4 - Average OEE and Products Produced in Key Processes
Downtime Reasons ( Hours per Week)
Part Shortage
Breakdown
Change Over
No Work
Waiting for Operator
13
11
10
0
2
Table 5 - Downtime in the Key Processes
Due to the downtime reasons and inefficient production Haldex have had an average of late
deliveries to a value of £82,500 per month.
The quality in the SMA lines is determined through the automatic optical inspection
equipment. Because of that optical inspections of this kind is never exact it will always detect
some amount of false alarms. This could i.e. be when a component is slightly rotated or
misplaced but it is still acceptable from a functioning point of view. The status of the false
alarm rates are 16.08 % in the first AOI and 11.95% in the second.
45
4.4. Haldex Way
Haldex group has over the last 15 years grown in both sales and profitability. In order to
sustain these results Haldex need to be able to adapt, change and develop further. In order to
do this they have implemented lean manufacturing principles which they call the “Haldex
Way”.
“The Haldex Way is a management philosophy, which focuses on customer satisfaction and at
the same time, achieve world-class performance. By implementing The Haldex Way principles
in our entire group – from product development and through the whole supply chain to the
customer – we will ensure our success” 26
The Haldex way concept is based on three management core values:
Customer first
Respect for the individuals
Elimination of waste
4.4.1. The 10 Principles
There are ten principles that the Haldex Way is based on, by following these principles the
company will become a lean manufacturer.
1. Standardization
Standardize by defining the best method for performing an activity and to do it the same way
every time.
2. Takt Time
Takt time reflects the sales on the market. It is defined by the available time divided by the
customer demand. The daily production rate shall be controlled by the takt time.
3. Levelled Flow
This is accomplished through evenly distribution of the products during the available time to
minimize manual work and optimize the use of equipment.
4. Balanced Flow
This is done by distributing the activities evenly between the different production processes in
the flow.
5. Consumption Controlled
Never start to produce before a customer signals a demand. This is called a pull method and
can be controlled by a Kanban system.
6. Visualization
By making production performance information visible, everybody can easily follow the
process.
26
The Haldex Way 2nd Edition, Jan-Erik Dantoft, 2006
46
7. Capable Process
This is achieved by doing things right from the beginning by means of suitable tools, good
instructions and preferably a poke yoke system that makes it impossible to make an error.
8. Real time
Everything is supposed to be directly linked together so that there are no delays in the system.
In this way abnormalities can immediately be discovered. This makes it easier to quickly
correct the root causes so that the errors is not repeated.
9. Go and See
A leader should participate and support. By participating in production the leader gets
knowledge in order to understand the work and what problems that can arise.
10. Continuous Improvement
By using the PDCA-cycle Haldex constantly challenge their results. In this way they always
strive for improvements within their production.
4.4.2. Tier Model – The Haldex Way and Targets
The work of implementing the Haldex Way is continually carried out at the Haldex Redditch
site. In order to proceed to the next step many different goals have to be reached. Haldex
Redditch site is at this time at the copper tier. In order to reach the bronze tier a number of
activities have to be implemented. One of the biggest problems is to sort out the FTPR, it has
to be increased to a stable 94%. The Haldex Way tier model can be found in appendix 1.
47
5. Implementations and Results
In this chapter the implementations proposed during the project will be explained. Overall
equipment efficiency has been used as a measurement through out the project. All
implementations have therefore been categorised according to how they affect the three
categories of OEE. The first implementation that is described is the actual implementation of
a correct OEE measurement.
5.1. Overall Equipment Efficiency
Background
In the beginning of this project it was discovered that OEE was not calculated and measured
correctly according to common practice and the “Haldex Way”. It was just the performance
section that was calculated in the electronics department as well as the other departments. It is
important to calculate OEE correctly and use it as a tool in order to discover and address the
aspects with the biggest effect on production efficiency. The data was gathered through an
OEE data collection sheet that was filled in by the operators at the SM-lines 2&3 and the two
IFRs. The data was at this point to indistinct for a correct calculation of OEE.
Implementation and Result
In order to get all the data needed from the electronics production a modified OEE data
collection sheet was compiled. The new sheet was divided into different sections for easy
location of the data. The data to be filled in is separated into two pages. The first side is for
unplanned downtime and changeover time. The other side contains information about
available time and planned downtime which from now on is to be filled in by the production
planner at the start of each week. It also contains information of what type and how many
products that has been produced and how many that was sent to rework. This is to be filled in
by the operators and the quality engineer at the end of each week. Based on the availability,
performance and quality data gathered in the collection sheets the OEE calculation is carried
out by a production engineer. The new data collection sheet could be found in appendix 2.
The correct OEE is then to be analysed and used to discover what have had the most negative
effect on production efficiency the previous week. This knowledge can then be used to
eliminate problems and improve the efficiency of the equipment.
After the first couple of weeks it was noticed that the information needed of the OEE data
collection sheets was not collected as it was supposed to be. It was therefore decided that an
introduction booklet was to be written. This was called “Introduction to Overall Equipment
Efficiency” and together with education sessions this booklet was used to make the operators
more aware of OEE.
The production engineering department have also been educated in the use and calculation of
OEE in order for them to proceed with the OEE measurement after the project has ended.
Currently there are five processes with complete OEE results every week. In order to reach
bronze tier in the Haldex Way this needs to be expanded to all the key processes within the
whole factory.
48
5.2. Availability Implementations
The implementations in this section are the ones that affect the availability category of OEE.
5.2.1. Reviewed Changeover Procedure
Background
Analysis of OEE showed that the changeover time especially from or to any GEN2 product
was very high. According to production engineering department the average changeover to
GEN2 was 140 min. After investigations of the changeover procedure some big improvement
possibilities were found.
The old changeover was according to the following procedure. When the current product was
finished on line 3 the changeover was commencing in the MPM printer on Line 3. The
operator was then changing over all the machines on line 3. This was done all the way to
MPM on Line 2. When Line 3 was changed over the production was started. During the Line
3 changeover the production was still going on Line 2 to finish off the last products of the
batch. When Line 3 was up and running again the operator started to changeover Line 2.
When all the machines and conveyors was changed over and the loader at the end of the line
was adjusted the machines was started and Line 2 started to produce the new product. The
duration of the changeover was measured as the time it took to physically changeover Line 3
and Line 2. Unfortunately this changeover was not always followed. The biggest reason is
that the line stops allot because of pick errors and reel changes. When the operator changes
over Line 3 and Line 2 stops the operator needs stop changing over and get Line 2 running
again. The constant running back and forth has made the operators to change over both Line 3
and 2 before starting production.
Figure 32 - SMA Lines
Implementation and Result
To get a better understanding of what need to be done in order to reduce the changeover time
it is important to measure the changeover time correctly to see how much time is lost because
of the changeover. A correct way of measuring changeover would be to measure the time it
takes from the last board of the current product through the AOI on Line 2 to the first board of
the next product through the same machine. By measuring the changeover this way it is easy
to see that the changeover time can be reduced significantly by starting to change over as
early as possible. By starting to change over to the new product as soon as the last board of
49
the current product has entered the sapphire on Line 3 a lot of time can be saved. By the time
the last board is finished in emerald Line 3 the MPM is changed over and the operator could
start to change over the pick and place units. By chasing the last board through the lines a
great deal of time could be saved.
For this to work smoothly it has to be two operators on the lines during the changeover. One
operator is primarily running the lines and one is changing it over. This is made possible by
changing the shifts so that there will always be two operators trained on the lines between
6am to 10pm. By planning so that all changeovers are carried out during these hours the new
changeover procedure will work. This will significantly lower the changeover time which will
result in lower labour cost or more products produced.
To be able to compile a new changeover procedure some timings were made on how much
time it takes to change over all the different machines and conveyors. It was also investigated
how much time it takes to process different products in all the processes. This was done in
order to see which processes are holding up the product flow. These processes are important
to focus on in order to get as low changeover time as possible. It was discovered that the
changeover has to be carried out differently depending if the system is changed over to a
faster or slower processed product.
To get an overview of the changeover and the tasks needed a block diagram was compiled.
This show how much time it takes to change over different processes and how long it takes
for the previous product to get processed. Based on these results two new changeover
procedures were compiled. These can be found in appendix 3.
In theory it should take 35min to do a changeover according to both procedures. This
changeover time has also been confirmed by trials.
By changing the way the changeover is measured and by reorganising the way the changeover
is carried out the time has been reduced from 140 min to 35 min. This reduction in
changeover time will allow approximately 153 extra products to be produced each week
based on an average product. This will affect OEE in the SMA lines as following.
OEE of SM Line 2&3
Current
Increase
Expected
Availability
Performance
Quality (FTPR)
OEE
67.4 %
66.4 %
81.0 %
36.2 %
4.1 %
2.2 %
71.5 %
66.4 %
81.0 %
38.4 %
2501
153
2654
Average Products per Week
Table 6 - Implementation Effects on OEE and Products
5.2.2. Reducing Stock Costs and Part Shortages
Background
The main goal for purchasing and stores is to supply the SM lines with components at all
times. Part shortage has the last couple of months stopped the line for about 68 hours/month
and on top of that it has caused several unnecessary changeovers. One of the biggest problems
is that the amount of components that actually is held on site is different from the stock levels
in the computer system.
50
At the moment the same component is delivered several times a week in different batch
quantities. I.e. 042-6439-09 was delivered 9 times between the 29 May and the 1 July. The
quantities varied between 8000 and 44000 on 4000 component reels. At the same time many
other types of components was delivered. This large variation of components delivered at the
same time is obviously taking a lot of time to sort, book, label and place at the correct
position. The complexity of receiving several deliveries may be one of the reasons why stock
levels differ from the computer system because of misplaced or wrongly labelled reels.
It is important to take all aspects into account when deciding what, when and how much to
order of every single component that is used. A simple and good way to do this is to use the
Economical Order Quantity.
Implementation and Result
The suggestion is to use an order-point system that uses a safety stock based on the amount of
feeder positions for each component. The order quantity is calculated using EOQ. In the cases
where EOQ suggest higher order quantities than the storage capacity, it is recommended to go
as close as possible to EOQ without exceeding the storage capacity. The order point is
calculated by using the demand during lead time and the determined safety stock.
Example of Today
This is an example of 042-6439-09 which is a regular capacitor. The price for the component
is £0.001 each. During the time between the 29 May and 1 July it was ordered 9 times with a
total of 41 reels. The status of the stock levels is as shown below.
Todays Orders
70000
60000
Stock Level
50000
40000
Stock Level
Average Stock
30000
20000
10000
30-Jun
28-Jun
26-Jun
24-Jun
22-Jun
20-Jun
18-Jun
16-Jun
14-Jun
12-Jun
10-Jun
08-Jun
06-Jun
04-Jun
02-Jun
31-May
29-May
0
Dates
Figure 33 - Stock levels of today’s system
If the last month is used as an average this component will be ordered 9 times each month and
the average stock level is 30 000. The annual costs for this component would be as following:
Order Processing Costs:
Carrying Costs:
Total Costs:
£1 123.20
£2.70
£1 125.90
51
These costs are based on a carrying cost of 9% of the component value and an order
processing cost of £10.4 per order. These figures were given by the accounting department.
Example of Suggested System
The same component would with this system have 2 orders containing 16 reels of 15000
components. The new order quantity would still not take more storage space than what could
be held on site and it would last into the middle of July. The status of the stock levels are as
shown below.
With 2 Reel SS
160000
140000
Stock Level
120000
Stock Level
100000
Average Stock
80000
Safety Stock
60000
Order Point
40000
20000
01
-J
ul
28
-J
un
25
-J
un
22
-J
un
19
-J
un
16
-J
un
13
-J
un
10
-J
un
07
-J
un
04
-J
un
01
-J
un
29
-M
ay
0
Dates
Figure 34 - Stock levels of suggested system
The annual costs of this system would be:
Order Processing Costs:
Carrying Costs:
Total Costs:
£159.88
£8.10
£167.98
The difference between today and the suggested system for this component would be an
increase in carrying cost of £5.4 a year and a reduction of order processing cost of £963.32
per year. The reduction of the total annual cost would be £957.92.
Calculations of 43 of the high usage components have been carried out to show the potential
of the new ordering system.
Order Processing Costs:
Carrying Costs:
Total Costs:
Today’s System
£32 947.20
£355.19
£33 302.39
Suggested System
£2 481.62
£1 350.05
£3 831.66
The difference in total costs would be £29 470.73. The cost reduction is because of the
reduction in the amount of times the components are ordered. Today these 43 components are
ordered and delivered 3156 times a year. With the suggested system this number will be
reduced to 240 times per year for these components. With two deliveries a week it will be
delivered 2-3 different components each time instead of 31-32.
52
EOQ will in some cases suggest lower stock levels and order quantities than what is currently
held. This is because of that these components have a high price which means that they have a
high carrying cost. I.e. by reducing the stock level and order quantity on the accelerometer
(042-6981-09) the carrying cost will be reduced by £1316 a year and the order processing cost
increased by £127. Detailed cost information of the mentioned components above and some
other example components are to be found in appendix 4.
By having bigger order quantities on high usage low value components the amount of
deliveries will be reduced significantly. This will make it easier and more efficient to handle
the goods. This will also make it harder to make mistakes like labelling the reels incorrectly
or putting them in the wrong storage position.
The safety stock will even more reduce the risk that part shortage or part losses cause the lines
to stop. The safety stock will cover for variations in demand during the lead time and also
some stock losses. Even with a big safety stock it is important to have the correct stock levels
on the computer system. The new system is not as sensitive to small stock losses as the old
system but reoccurring stock losses without adjustments will in the long run cause the safety
stock to run out and the line to stop.
By ordering less often there will be a significant reduction in the amount of work needed for
processing orders and handling goods. This time could instead be used for regular stock takes
to make sure that the real stock level is the same as in the computer system. This could in
example be done prior to a component refill.
Low stock levels also have a negative effect on the quality in the output of the SMA lines. If a
component runs out in a feeder and the component is out of stock, the operators then often
borrows of other feeders. These feeders are already tweaked for a feeder setup. When
removing a feeder from the feeder setup it can affect the component pick up position when the
feeder is put back onto the machine. This may cause miss picks or miss placed components.
The same negative effect happens between exchanges of reels within the same feeder when
they run out.
This suggestion together with reorganizing of the storage positions will eliminate downtime in
the SMA lines caused by part shortage. This will allow production of approximately 404 more
products per week. This will have the following effect to OEE in the SMA lines.
OEE of SM Line 2&3
Current
Increase
Expected
Availability
Performance
Quality (FTPR)
OEE
71.5 %
66.4 %
81.0 %
38.4 %
10.9 %
5.9 %
82.4 %
66.4 %
81.0 %
44.3 %
2654
404
3058
Average Products per Week
Table 7 - Implementation Effects on OEE and Products
53
5.3. Performance Implementations
The implementations in this section are the ones that affect the performance category of OEE.
5.3.1. Component Reel Change Reduction
Background
Currently a lot of losses within production are caused by component reel changes. A
component change takes an average of 3 minutes. Because of that the component reels are
small to the size they run out often, causing this 3 minute stop in production. There are
several hundreds of different components so this has a major impact on production
performance. Based on the current production quantities there is an average reel change loss
of 16 hours per week. This loss will be reduced to 14 hours in the near future when PLC
which is one of the most produced products is no longer going to be manufactured in
Redditch.
Implementation and Result
The action that was taken to reduce the component change time was to increase the size of the
component reels. This will make more hours available to production. Calculations were made
to determine which component has the highest usage on the three most produced products. I.e.
Component 042-5393-09 is placed 13 times on one product which has a weekly quantity of
450 products per week. The same component on the same feeder is also used to populate 450
products of 8 components per product. This adds up to 9450 components per week. By
increasing the reel size from 5000 per reel to 20000 per reel the changes is reduced from 2 in
a week to 0.5 in a week. This results in 4.25 minutes more production time each week. To be
able to increase all the reels that affect production significantly some investments has to be
made. Some of the feeders used are not adaptable for big reels. By fitting a back plate on the
existing feeder it will be possible to increase the reel size. After some investigation it was
decided to buy in 40 new back plates.
In order to increase the reel sizes Haldex first need to use up the stock that the supplier holds
for them. This could be up to 16 week worth of stock.
Investments needed for this implementation is the purchasing of 40 back plates to a total
amount of £1160. In order for production to run smoothly it is still needed the same amount of
reels in minimum stock as before. Because that the new reels contains more components the
minimum stock level will increase. The increase in stock cost based 9% carrying cost is
approximately £1188 in a year.
The result of this implementation should according to calculations reduce the wasted
production time with approximately 7 hours per week. This also means that 7 hours of the
operator’s time will be made available for other tasks. The time could i.e. be used for
continuous quality control or preparations for future reel changes.
This will allow for approximately 330 more products to be produced each week and will
result in an increase in OEE as following.
54
OEE of SM Line 2&3
Current
Increase
Expected
Availability
Performance
Quality (FTPR)
OEE
82.4 %
66.4 %
81.0 %
44.3 %
7.2 %
4.8 %
82.4 %
73.6 %
81.0 %
49.1 %
3058
330
3388
Average Products per Week
Table 8 - Implementation Effects on OEE and Products
5.3.2. Relocating the LIFO Buffer
Background
Currently one of the AOI Rework stations is placed on the outside of the SMA Lines. This
forces the line operator to waste time by walking over there several times each hour in order
to check boards that have failed in the AOI. Below is a spider chart of a typical hour of an
operator and the amount of travel he is doing. The green marked track is the LIFO buffer.
Figure 35 - Spider chart of an operator hour
Implementation and Result
The suggestion is to place the AOI rework station within the lines to stop the amount of time
spent walking over to the station. To do the move of the LIFO buffer the buffer itself needs
reprogramming as well as the conveyors around it. The current option is to outsource the
move to the supplier. A price proposal has been received from the supplier “PAF Conveyor
Engineers” that could do this for £2000. The reprogramming needs to be done off site which
means that the buffer would be unavailable for 3 days. It will then take 8 hours once it is back
to fit everything into place and program the conveyors to work with the buffer.
55
Below are some calculated figures to display how much that is wasted because of the current
position of the rework station.
Walking distance back and forth:
Time that is wasted walking back and forth:
Average amount of travels to AOI Rework:
Distance travelled during one hour:
Total time wasted during one hour:
Total time wasted during 4 weeks:
(1.75 Minutes x 8 Hours x 3 shifts x 5 days x 4 weeks)
Cost of the wasted time per week:
(14 Hours x £20.8)
Distance per Shift:
Distance per 4 weeks:
(1160 Meters x 3 Shifts x 5 Days x 4 Weeks)
29 Meters
21 Sec
5 / Hour
145 Meters
1 Min 45 Sec
14 Hours
£291.2
1160 Meters
69.6 Kilometres
This means that Haldex are currently paying the operators £291.2 every 4 weeks just to walk.
On the following page the proposed layout is presented as a spider chart as well.
Figure 36 - Spider chart of an operator hour after move of LIFO buffer
Another matter to take into account is that some of the times when the operators is by the AOI
rework station an alarm goes off in one of the machines. I.e. the sapphire on line 2 stops
because of a feeder jam.
In average this happens 2 times out of the 5 times when they are over there. This means that
the travel distance is prolonging the stop in the machinery. In this example we use the entire
travel time in order to compensate for that operator finishes what he/she was doing by the
station before going and fixing the feeder jam.
Amount of wasted production time each week:
(21 seconds x 16 times during a shift x 3 shifts x 5 days)
84 Min
If this investment was to be made it would earn itself back in 27.5 weeks based on standard
labour cost alone. Then Haldex would actually be paying the operators for value adding
activities instead of walking. If it is taken into account that this will result in more production
hours as well, then the payback period will be even shorter. This investment is all about
removing non value adding activities from production, removing “muda” (waste) which is a
part of being a lean manufacturer.
56
This implementation will result in approximately 66 more products per week and an increase
in SMA line OEE as following.
OEE of SM Line 2&3
Current
Increase
Expected
Availability
Performance
Quality (FTPR)
OEE
82.4 %
73.6 %
81.0 %
49.1 %
1.4 %
0.9 %
82.4 %
75.0 %
81.0 %
50.0 %
3388
66
3454
Average Products per Week
Table 9 - Implementation Effects on OEE and Products
5.3.3. Test of a new Solder Paste
Background
When boards are produced there is excessive flux collecting itself on top of 10 connector pins
on the boards. The reason why this is a problem is when they are tested in the IFRs’. Because
of the excessive flux on the connector pins the test pins can not penetrate the none conductive
flux and by this making the test abort itself causing retesting. Currently the operators are
using sandpaper to scrape off the excess on the pins. This adds flux residue onto the board
making it a none clean board. It is also time consuming making the operators waste
production time.
Implementation and Result
To remove the connection problem in the IFR machines a new solder paste was tested. This
new solder paste contained less flux and therefore made it more testable. The down side is
that lower amount of flux means that the paste has lesser solder ability. A test batch of 10
PCBs was produced with the more testable solder paste, the product was GEN2 003-9210-09.
The initial results were good and there were no problems testing the boards in the IFRs. A
couple of the boards were tested in a test rig that tests if the flex cables have been soldered
correctly. The test rig pulls the flex cables of the board and if they are pulled off before a
predetermined force they do not pass the test, all tested boards passed.
All the boards were then taken to a test facility where they were x-rayed in order to
investigate voiding inside the joints. The results were dire and most joints contained a huge
amount of voiding. The following photographs are of the x-rays taken.
57
Figure 37 - X-ray photos of voiding
It was obvious that the change of paste was not the best way to tackle the connection problem.
Another possible solution is to change the stencil apertures to make the screen printer apply
less solder on the connection pins. This exercise is currently carried out by one of the
production engineers at Haldex.
5.4. Quality Implementations
The implementations in this section are the ones that affect the quality category of OEE. No
results on the quality in OEE have been estimated in this section. This is because of that the
effects of these implementations are difficult to estimate.
5.4.1. Design Review of the GEN2 Products
Background
Throughout the project there has been a focus on the GEN2 products and a part of the project
was to do a review of the design for manufacturability and testability. Through guidelines of
component manufacturers and industry organisations facts about design was gathered. These
facts were then compared to the product in order to determine its manufacturability and
testability.
Implementation and Result
The CAD data of the GEN2 products were examined and compared to the AOI data base in
order to localize where problem areas on the PCBs were. These problem areas were then
compared with the guidelines in order to make improvement suggestions.
The AOI data base showed a lot of problems with solder volume, especially around the ICcircuits. Recommendations say that passive components should be placed at least 6 mm away
from the ICs in order to minimize these problems. There are currently passive components
close to some IC-circuits on the GEN2 that are failing. A possible source to this problem can
be that a step stencil is used. Around the largest IC-circuit on the GEN2 the stencil is thinner
in order to get less solder on those leads to prevent shorts. But because of that the distance to
the adjacent components are not enough these joints might be starved or suffer from slump
action.
58
Figure 38 - Components placed close to an IC-circuit with solder volume problems
According to guidelines the amount of traces from a solder pad should be minimized to one,
the corresponding pad should then have symmetrical trace pattern to minimize solder
migration and rotation of the component. There is currently more than one trace on most of
the solder pads on the GEN2 and the trace patterns are not symmetrical. As shown in the
picture below there are non symmetrical trace patterns which can result in rotated
components.
Figure 39 - Components with bad trace design
There are some specifications about recommended spacing between components. There
should be at least 50 mils (0.635 mm) of spacing between components to make automated
optical inspection easier. Some components are below this recommendation. 25 mils are
allowed in a reflow process which GEN2 is processed through but some components go
below this recommendation as well.
59
Figure 40 - Component spacing
In order to get enough support when populating the board tooling holes should be used.
Because of that the mother board contains three smaller boards, all individual boards might
need tooling holes in order to get the correct support for the process. Currently the board is
flexing when being populated by the pick and place machines. A different sort of support is
needed and the material of the PCBs needs revision in order to reduce this problem.
There are supports bridges between the individual boards and the motherboard, according to
Haldex own guidelines these should be as close as 25 mm from each other, which they are
not. The breakout method used at Haldex is not a recommended one, fine tooth sawing could
be used instead.
Figure 41 - Distance between break out bridges
There is a white coloured component on the top side of the board which results in reflections
and shadowing of other components in the AOI. To switch to a black component would be an
improvement. This component is also a tall component, the AOI supplier themselves
recommend that components are placed with at least the components height as a distance to
the next component.
Figure 42 - A tall and white coloured component
Vias should be covered by solder resist in order to decrease the amount of air that can pass
through the holes when being vacuum held. If this would be changed the PCBs would be
easier to fixate in all equipments using vacuum fixtures.
All of these aspects were presented to the design engineers at the Redditch site. They were
presented as design guidelines in order to address problem areas that exist within production.
60
The guidelines were not well received by the design engineers. There currently is no official
design documentation containing manufacturability aspects for the design engineers to take
into consideration when designing new products. This sort of documentation has been
suggested in the action plan of this report in order to make future products have a higher
manufacturability.
5.4.2. Design Review of GEN2 3M
Background
During the project it was introduced that a new product was being developed and was to be
taken into production in early September, the GEN2 3M Master. Because of that a review of
the GEN2’s design was performed in the early stages of the project it was decided that a
review of the new product was also to be done in order to make design suggestions which
would improve the finalised product.
Implementation and Result
The design review of the GEN2 was compared with the new products CAD data and several
design suggestions was made concerning trace design, component spacing, orientation, size
and position of test pads. In total there were 28 areas on the new product where changes were
suggested. All the areas suggested are based on the data gathered from the AOI quality
reports, areas where there are several errors weekly. By attacking these areas the errors will
not be transferred to the new product and thereby increase the quality results. Below is an
example of a suggested change that was implemented.
Figure 43 – The photo to the left is of the old GEN2 design.
The photo to the right is the implemented change onto the GEN2 3M.
Figure 44 - The photo to the left is of the old GEN2 design.
The photo to the right is the implemented change onto the GEN2 3M.
61
In appendix 5 most of the suggested changes can be found. In total of 25 out of the 28 design
suggestions were well received and implemented onto the new product. When a test batch
was manufactured a number of boards were examined in order to find more design
suggestions.
It was found that polarity markings were badly placed. The marking was placed underneath
the components instead of adjacent to the components. This makes it difficult for the
operators to do a manual inspection of the polarity. If the markings would be placed on the
outline of the component they could easily check this manually. On the bottom side of the
PCB there are no polarity markings.
Figure 45 - Left photo is of top side which contains polarity markings.
The right photo is of the bottom side and is without polarity markings.
One problem with the old GEN2 2M was that the board was flexing and bending. This means
that the placement height in the pick and place units are inconsistent and that the component
are placed on an unstable surface. This may result in badly placed components and damaged
or dirty nozzles. The laminate material used in the test batch of the new GEN2 3M makes the
board more stable. It is important to keep a good material when this product goes into
production.
The new product has a more balanced population of components on top and bottom. This
allows for a more balanced flow in the production lines. To optimize the efficiency of the
production system it is important to strive towards the same cycle time in all the different
processes. This way the longest cycle time will be reduced and the bottleneck removed.
The GEN2 3M Master is being tested and will likely be initiated into production as planned.
The effects on quality of the implemented changes will first be displayed during production
because of that there currently is no AOI program for the product or IFR test fixture yet.
Anticipations of the quality results are that they will contain fewer false alarms in the AOIs
and result in less rework and by that raising the FTPR.
5.4.3. Electro Static Discharge Proposal
Background
When manufacturing electronics it is important to protect the products from electrostatic
discharge. ESD can harm products making them malfunction in the early stages of its
lifecycle. Nine out of ten products that have been damaged by ESD are unnoticeable to the
eye but reveal themselves as zero kilometres errors or in the later stages of usage.
62
At the moment the operators in the electronics production at Haldex Redditch use wrist strap
that dissipate ESD and they also use shielding coats. The coats do not dissipate ESD they only
lower the risk of generating more ESD. The wrist straps grounds the operators and therefore
removes ESD generated. The wrist straps do not allow the operators to be very flexible
because of that they need to connect their strap to a grounding point with a cable. This allows
them to move in a 2 meters radius from the grounding point. If they need to move further
away they have to disconnect themselves and connect themselves to a new grounding point.
There are two sections of flooring in the electronics that are grounded. This is the most
effective way to remove ESD and still allow the operators to be flexible. The downside is that
you need grounded shoes in order for this to work. At the moment these shoes are not used
and therefore making this investment a waste. To make the investment work for its cost the
operators need the ESD protected footwear provided to them.
There are more sections in the electronics that would benefit from the ESD protected flooring
i.e. by the IFRs in order to make the operators more flexible. A cost efficient proposal is to
purchase ESD floor mats or to use the left over ESD flooring which can be cut out and fitted
to the areas that need the protection. The areas proposed to cover are by the AOI rework
stations, between the IFRs and by the hot bar. In order to make these floor mats to work as
intended they as well need the grounded footwear.
The proposal is that permanent personnel will be supplied with the footwear and foot straps
will be provided to the temps. This is because it is an investment in the personnel as well as in
the production.
Implementation and Result
Quite early after that the ESD proposal was presented to management the ESD shoes was
purchased. All personnel working within the electronics now have a pair of ESD shoes. A
larger investment than ESD floor mats have been introduced by other engineers at the
Redditch site because of that they would like a larger coverage of ESD flooring. The
suggestion is ESD floor tiles that can be installed in sections rather than all in one go. In
appendix 6 the suggested coverage of the ESD floor tiles are displayed together with the costs
of the investment. It was a part of this project to suggest a layout for the tiles. This is still
waiting to be signed of by management.
If the flooring is bought more sections will be ESD protected and fewer products will have
latent ESD errors. This will have an effect on returned products as well as some errors found
during testing within production. This will increase the quality of the products that are
produced in the electronics area and it will also make the operators more flexible at their
workspace.
5.4.4. Solder Paste Procedure
Background
When looking at the prints coming out of the stencil printer it was noticed that sometimes the
print on some boards were worse than others. There are set practices for how to handle solder
paste in order to get a good print. It was observed that these practices were not always
followed.
63
Implementation and Result
In order to address this problem a solder paste handling procedure was created, there currently
was none in the section. The procedure tells the operator how to handle and store the solder
paste. See appendix 7 for the solder paste handling procedure.
If this procedure was to be followed the quality of the print would increase and this will result
in a higher quality in the joints. This causing less rework and errors in the test equipment.
5.4.5. Validating Repeatability in Test Equipment
Background
At the early stages of the project it was decided that a test batch of 50 pieces of GEN2 were to
be assigned to the project. The GEN2 version that was given was the most sophisticated one,
the one containing super aux and the accelerometer. One of the key parts of the test batch was
to test the boards in several test fixtures of the IFRs’. This was to determine if there are
differences in the test equipment.
Implementation and Result
The boards were followed through production and observations of possible errors in the
equipment as well as quality errors were found. The boards were produced during four hours
and the results were recorded within the different databases of the test equipment. The boards
were processed and then tested. The boards that failed were then reworked and tested again as
they normally would have. The only difference was that the boards were tested in both of the
test fixtures available.
One major observation was made. The fixtures were showing different test results. One board
could pass in the first fixture but fail in the next one. This is a major concern because it is
safety equipment that is being manufactured at Haldex. This is one of the things that will be
added to the future action plan and needs to be addressed after the project has ended.
64
65
6. Summarization of Results
The following numbers describe the increase in products produced. Because of that the hot
bar and the casing line do not process any other product than GEN2 the increase in products is
also displayed as if we only had produced GEN2.
Average Products Produced per Week
Current
Increase / Increase as GEN2
Expected
SM Line 2&3
Hot Bar
IFR 1
IFR 2
Casing Line
2501
953 / 516
3454
709
516
1225
368
258
626
516
258
774
836
516
1352
82.4 %
75.0 %
81.0 %
50.0 %
(+ 13.8 %)
90.8 %
89.0 %
94.4 %
76.2 %
(+ 32.1 %)
79.4 %
52.7 %
85.3 %
35.7 %
(+ 14.7 %)
83.5 %
58.4 %
77.1 %
37.6 %
(+ 12.5 %)
93.8 %
82.5 %
94.0 %
72.6 %
(+ 27.7 %)
0
11
5
0
2
0
1
0
0
0
0
2
0
8
6
0
1
0
4
13
0
3
0
0
0
Table 10 - Estimated Effects on Products Produced
Overall Equipment Efficiency
Availability
Performance
Quality (FTPR)
OEE
Increase of OEE
Table 11 - Estimated Effects on OEE
Downtime Reasons (Hours per Week)
Part Shortage
Breakdown
Change Over
No Work
Waiting for Operator
Table 12 - Estimated Downtime after Implementations
The quality effects of the implementations are difficult to estimate and are therefore not
accounted for in the results.
The increase in produced products per week with additionally 953 average products or 516
GEN2 will significantly reduce the amount of late deliveries that Haldex currently have.
The new more efficient ordering system will reduce the order processing cost and allow
personnel to work with value adding activities instead of processing orders. It will also reduce
the carrying cost for expensive components that today stand for the majority of the total
carrying cost.
66
67
7. Action Plan
7.1. Investigation of Solder Ball Formation
Observations has shown that solder paste gets smeared out on to the PCB when components
are placed in the Sapphire on Line 2. The solder paste that is not on the connection pads
become small solder balls when the PCB goes through the reflow oven. These could in worst
case cause shorts in fine pitch components. There is no evidence of that this is causing a lot of
errors but it is still not the way it should be.
According to the quality department there has been one warranty return caused by solder balls
but the quantity of possible defective products is immeasurable and could be considerably
higher. Therefore it is recommended to investigate what is causing these deviations in quality.
7.2. Official design rules document
For Haldex to be able to produce good products it is important that the design of the product
apart from function also is focused on manufacturing and testing. It is also important to future
proof the components and other material that is used in the design. Therefore the suggestion is
to compile a standard design rule document with inputs from design, production, quality and
purchasing. This document should be used as rules for future product development projects.
This should also be used as information to the suppliers of what is expected out of their work
or products.
7.3. SMED
Currently there are some SMED activities being investigated within electronics but in order to
get an impact effect on the change over times a complete SMED exercise needs to be done.
SMED, single minute exchange of die is about converting internal change over to external.
An internal change over is performed when the equipment is stopped, change over that can
not be performed when the machine is up and running. External is all change over that can be
done during production.
A simple question to ask the operators to ask themselves when they do a change over is, do I
need to do this now while the machine is stopped or could it be done while it is running?
The procedure of SMED is to identify all key activities in a changeover and classify them as
internal or external, every step should be accounted. Next step is to evaluate if any internal
could be changed to an external. Change the procedure, do trial runs and re-evaluate. This
should work accordingly to the PDCA cycle. The SMED exercise should involve all areas of
expertise both operators and engineers.
It is important to focus all changes on production time lost instead of actual equipment setup
time. As mentioned in the change over procedure review it is lost production time that is to be
measured when performing a change over. By using SMED the changeover time can be
reduced significantly.
68
7.4. Quality control during production
When the performance improvements suggested is implemented more time will be made
available for the operators. This extra time could be used for more focus on quality during
production. In many occasions small means are needed in order to prevent miss placed
components.
There have been examples where a dirty nozzle or an un-calibrated pick up position has
caused a lot of failed products before it was discovered. If these problems would be
discovered and rectified in an earlier stage many failed products could be prevented.
This could be done through that the operator gets informed by the AOI when the same
component has failed i.e. two times in a short period of time. The operator could then adjust
the feeder or clean the nozzle before the problem has caused numerous of failed products.
7.5. Investigation of root causes of picks and place problems
Many of the problems with pick and placements are not caused by the fact that the machines
are old and inaccurate. Bad calibration of the pick up positions, unclean or broken nozzles is
the most common reason for dropped or misplaced components in the pick and place
machines.
To be able to reduce this problem it is needed to do investigations of what is causing the
machine to not pick up a component correctly and place it in the right position.
This could i.e. involve investigations of:
Are the nozzles that are used suitable for the components that are placed?
Is the right routines for exchanges and cleaning of nozzles used?
What is causing the pick up position to move?
When the causes are known there is time to come up with routines for how to prevent these
problems.
7.6. Investigate variations in the screen print quality
By observations it has been discovered that there is variations in printing quality. One board
could have a good print and the next board in the production flow could have a bad print. To
make sure that the screen printing quality is high these variations need to be reduced.
Investigations of what is causing these variations need to be carried out. When the cause is
discovered routines needs to be put in place to ensure high print quality. These causes could
i.e. be inefficient cleaning, variations in squeegee pressure etc.
7.7. PLC and Robot programming skills on site
At the moment Haldex needs to outsource PLC and robot program modifications.
Recommendations for the future are to invest in training for the maintenance personnel so that
these modifications could be done on site by Haldex staff. This will in the long run reduce
outsourcing costs and simplify rearrangements of the production equipment.
I.e. to move the LIFO buffer and do the program modifications is a relatively simple fix that
easily could have been done on site by Haldex personnel.
69
Actions needed
Move the end conveyor to the other side of the LIFO buffer. Get the whole unit in position
after the turning point on SMA Lines. Move sensor on end conveyor to trigger when a board
passes the LIFO buffer.
Program modifications on existing control units
Trigger the conveyor in the rack tower to move in forward direction. This could be done by
using the sensor in the turning point as an input trigger.
Remove trigger input from the AOI to the turning point so that it always turns it in the same
direction.
Add one parameter to decide if the board should be lifted or not. Set memory if board fails in
AOI. Use the same output that is used for determining the direction of the turning point. Add
memory as an argument for lifting the board. When a board is lifted then reset memory again
to prepare for the next board.
Figure 46 - Example of PLC program modification, red lines marks the change.
7.8. Using OEE for Continuous Improvement
A part of the “Haldex Way” is to work with continuous improvement. An excellent tool to use
in order to continuously improve would be OEE. By implementing OEE into shop floor
meetings they will be alerted of the top reasons of downtime in the production system.
A good method to work with OEE is to gather all the results to calculate the greatest
downtime then investigate further why that reason was the top cause of downtime. Often this
is the biggest problem when working with problem solving, identifying the root causes of the
problems. OEE could therefore be a helpful tool that will make this easier.
70
7.9. Repeatability in Test Equipment
As mentioned in chapter 4.4.5. “Validating Repeatability in Test Equipment” there are
different test results in different test fixtures. This problem needs to be addressed in the near
future. The test equipment must have high repeatability and accuracy. The suggestion is to
perform a six sigma project in order to identify the cause and remove the problem.
7.10. Flux Residues on Connection Pins
In chapter 4.3.3. “Test of a new Solder paste” it is addressed that excessive flux on ten
connection pins on the GEN2 PCBs create performance losses in the IFRs. This problem
could rather easily be fixed and would increase the performance in the IFRs. By changing the
apertures in the stencils this problem could be solved.
71
8. Conclusions
Continuous Improvement
To be a lean manufacturer is all about reducing waste, especially waste that has a negative
effect on production. Therefore it is important to continuously improve the production
processes and surrounding systems. During this project we have used OEE as a measurement
to find shortcomings within production. We have found that OEE gives a good overview of
how well different processes are performing and how one process can be affecting another.
OEE also shows us what is causing production not to run or run slower than ideal. The result
from OEE calculations has throughout the project been the base for what to focus on.
By knowing what has caused the line to stop and for how long, we can use that data to show
decision makers that the investment for implementing our suggestion to solve the problem is
worth doing. We have found that the cooperation between departments it not always easy and
efficient. Therefore we have decided to have a number of improvement projects undergoing at
all time throughout the project. This is in order to not get a stand still because of that we are
waiting for another department to act.
Stock Level
The Haldex way says that stock levels should be as low as possible. This is not working at
Haldex Redditch. Low stock levels have in this case caused numerous part shortages and high
order processing costs. This has caused purchasing and good inwards to work more with order
processing than necessary. Low stock levels in general are good but in this case we are talking
of very low cost components with high usage. We have found that the order processing cost
per year on most of the components are many times higher than the carrying cost. Therefore
we suggested implementing EOQ and safety stock to reduce both problems caused by
inefficient component ordering.
Wrong Focus
We have throughout the project found that there has been a great focus on getting new SMA
equipment. What we have seen is that the current equipment is well capable of meeting the
demand. It has not taken much investigation to see that the biggest problem to production has
been inefficient stock handling. This would not have been solved by new equipment. By
picking the low hanging fruits suggested during the project we expect an increase in
productivity with approximately 38% that is equal to an extra 953 products a week and there
is still a lot of room for improvements. By improving the current system as much as possible
we expect that Haldex will be able to meet the demand for some more time. When Haldex
Brake Products has showed that the current system is producing as efficiently as possible and
the system is still not capable of meeting the demand. Then we think that Haldex brake
products have showed that they are worth the investment of new equipment.
Future
With the competition from low cost countries Haldex needs to be a lean and efficient
producer in order to be the most profitable alternative. We think that Haldex in Redditch has a
skilled staff and there is a lot of potential for improvements. With better communication and
cooperation between the departments and more focus on stable and efficient processes we are
positive that Haldex will stand the competition and be worth the investments needed for the
future.
72
73
9. References
Online references
http://www.haldex.com, 10-03-08
http://www.lean.org/WhatsLean/Principles.cfm, 2008-07-04
http://www.hci.com.au/hcisite2/toolkit/pdcacycl.htm, 2008-07-04
http://www.oee.com/world_class_oee.html, 2008-07-06
http://www.oee.com/oee_factors.html, 2008-07-06
http://www.oee.com/calculating_oee.html, 2008-07-06
http://www.ies.luth.se/log/courses/iet064/Lektioner/8_Lagerstyrning.pdf, 2008-07-04
http://www.inventoryops.com/economic_order_quantity.htm, 2008-07-03
http://www.inventoryops.com/safety_stock.htm, 2008-07-03
http://www.ipc.org/, 2008-06-14
http://www.esda.org/basics/part1.cfm 2008-07-03
http://www.allaboutcircuits.com/vol_3/chpt_9/1.html, 2008-07-03
Printed References
The Haldex Way 2nd Edition, Jan-Erik Dantoft, 2006
SMD Technology, Reflow Soldering, Philips Electronic Manufacturing Technology, 1995
SMD Technology, Solder Paste and Solder Paste Application, Philips Electronic
Manufacturing Technology, 1995
Technical Information KOKI Super Low Void Solder Paste
Ultraprint 2000 HiE Series System Support Guide
Omniflow 5 Instruction Manual
User manual myReflow.com
Electrostatic Discharge Control, Vermason Ltd.
Electronics manufacturing processes, Prentice-Hall Inc. p 449, Landers T.L, 1994
Microelectronics System Packaging Technologies, C 17-8, Tummala, R.R.T, 2003
Automated optical inspection guidelines for PCB assembly design, Orbotech, 2008
Surface Mount Zero Defect Design Check List, John Maxwell
Mechanical Equipment Interface Standard, SMEMA
74
10. Appendixes
Appendix 1 – Haldex Way Tier Model
75
Appendix 2 – OEE Data Collection Sheets
76
77
Appendix 3 – Change Over Procedures
All to GEN2
Prepare for changeover before production has finished in the MPM on line 3.
Line 2&3 operator makes sure that boards are labelled and loaded before changeover.
Request help from Line 1 operator.
Line 1 operator is running Line 2&3 during changeover.
Start change over procedure on line 3.
1
Commence with changeover in MPM Line 3 when the last board has been printed.
2
2.1
2.2
2.3
2.4
2.5
2.6
2.8
MPM line 3: (Operator Line 2&3)
If required remove/clean current stencil.
Load program for next product.
Install/set-up tooling for next product.
Select/install required stencil for next product.
Check/adjust width on all connecting conveyors.
Start screen printing process.
Switch off shuttle gate to make sure that sapphire is not loading board before it
is changed over.
3
3.1
Sapphire line 3: (Operator Line 1)
Line 1 operator should start to change over Sapphire Line 3 as soon as the last
board is out of Emerald line 3.
3.2
3.3
3.4
3.5
3.6
3.7
3.8
Emerald line 3: (Operator Line 2&3)
Cut/trim the feeder waste tapes.
Referring to MO sheet, load relevant programs.
Referring to program feeder list, check/populate as necessary.
Check/adjust PCB clamping.
Check/adjust width on all connecting conveyors.
Switch to inspection mode on the conveyer between Emerald and Omniflow
line 3.
Start production by turning on Sapphire, Emerald and the shuttle gate on line
3.
4
4.1
4.2
Omniflow Line 3: (Operator Line 1)
Referring to MO sheet, load relevant program.
Start machine.
5
5.1
5.2
5.4
5.4
5.5
A.O.I. Line 3: (Operator Line 1)
Referring to MO sheet, load relevant program.
Check/realign as necessary bar code reader on input conveyor.
Check/adjust width on all connecting conveyors all the way to MPM Line 2.
Switch to inspection mode on conveyor before MPM Line 2.
Switch on inspection point on line 3 to allow products through the oven.
78
6
6.1
6.2
6.3
6.4
6.5
6.6
6.7
7
7.1
MPM line 2: (Operator Line 2&3)
If required remove/clean current stencil.
Load program for next product.
Install/set-up tooling for next product.
Select/install required stencil for next product.
Check/adjust width on all connecting conveyors.
Switch off shuttle gate after MPM line 2 to make sure that sapphire is not
loading board before it is changed over.
Start the printing process by switching on the conveyor and start the MPM on
line 2.
Sapphire line 2: (Operator Line 1)
Line 1 operator should start to change over Sapphire Line 2 as soon as the last
board is out of Emerald line 2
7.2
7.3
7.4
7.5
7.6
7.7
7.8
Emerald line 2: (Operator Line 2&3)
Cut/trim the feeder waste tapes.
Referring to MO sheet, load relevant programs.
Referring to program feeder list, check/populate as necessary.
Check/adjust PCB clamping.
Check/adjust width on all connecting conveyors.
Switch to inspection mode on conveyor between Emerald and oven.
Start Sapphire, Emerald and switch on the shuttle gate.
8
8.1
8.2
Omniflow Line 2: (Operator Line 1)
Referring to MO sheet, load relevant program.
Start machine.
9
9.1
9.2
9.3
9.4
9.5
9.6
A.O.I. Line 2: (Operator Line 1)
Note the time for the last board tested in the AOI.
Referring to MO sheet, load relevant program.
Check/realign as necessary bar code reader on input conveyor.
Check/adjust width on all connecting conveyors.
Check/adjust width on WES racks.
Switch on the inspection point to allow products through the oven.
10
10.1
10.2
Changeover finalisation: (Operator Line 2&3)
Note the time for the first product tested in the AOI.
The changeover time noted is now to be reported in the OEE data collection
sheet.
Change over is now completed and the line 1 operator can now go back to line
1.
10.3
79
GEN2 to All
Prepare for changeover before production has finished in the MPM on line 3.
Line 2&3 operator makes sure that boards are labelled and loaded before changeover.
Request help from Line 1 operator.
Line 1 operator is running Line 2&3 during changeover. Line 1 operator should at the first
part of the changeover focus on getting the old product out of the lines and getting the new
product to queue up behind the machine that is currently being changed over. When the old
product is out of Emerald Line 2 the Line 1 operator helps to change over Sapphire,
Omniflow and AOI on line 2.
Start change over procedure on line 3.
1
Commence with changeover in MPM Line 3 when the last board has been printed.
2
2.1
2.2
2.3
2.4
2.5
2.6
2.8
MPM line3: (Operator Line 2&3)
If required remove/clean current stencil.
Load program for next product.
Install/set-up tooling for next product.
Select/install required stencil for next product.
Check/adjust width on all connecting conveyors.
Start screen printing process.
Switch off shuttle gate to make sure that sapphire is not loading board before it
is changed over.
3
3.1
3.2
3.3
3.4
3.5
3.6
Sapphire & Emerald line3: (Operator Line 2&3)
Cut/trim the feeder waste tapes.
Referring to MO sheet, load relevant programs.
Referring to program feeder list, check/populate as necessary.
Check/adjust PCB clamping.
Check/adjust width on all connecting conveyors.
Switch to inspection mode on the conveyer between Emerald and Omniflow
line 3.
Start production by turning on Sapphire, Emerald and the shuttle gate on line
3.
3.7
4
4.1
4.2
Omniflow Line 3: (Operator Line 2&3)
Referring to MO sheet, load relevant program.
Start machine.
5
5.1
5.2
5.4
5.4
5.5
A.O.I. Line 3: (Operator Line 2&3)
Referring to MO sheet, load relevant program.
Check/realign as necessary bar code reader on input conveyor.
Check/adjust width on all connecting conveyors all the way to MPM Line 2.
Switch to inspection mode on conveyor before MPM Line 2.
Switch on inspection point on line 3 to allow products through the oven.
80
6
6.1
6.2
6.3
6.4
6.5
6.6
6.7
7
7.1
MPM line2: (Operator Line 2&3)
If required remove/clean current stencil.
Load program for next product.
Install/set-up tooling for next product.
Select/install required stencil for next product.
Check/adjust width on all connecting conveyors.
Switch off shuttle gate after MPM line 2 to make sure that sapphire is not
loading board before it is changed over.
.
Start the printing process by switching on the conveyor and start the MPM on
line 2.
Sapphire: (Operator Line 1)
Line 1 operator should start to change over Sapphire Line 2 as soon as the last
board is out of Emerald line 2
7.2
7.3
7.4
7.5
7.6
7.7
7.8
Emerald line2: (Operator Line 2&3)
Cut/trim the feeder waste tapes.
Referring to MO sheet, load relevant programs.
Referring to program feeder list, check/populate as necessary.
Check/adjust PCB clamping.
Check/adjust width on all connecting conveyors.
Switch to inspection mode on conveyor between Emerald and oven.
Start Sapphire, Emerald and switch on the shuttle gate.
8
8.1
8.2
Omniflow Line 2: (Operator Line 1)
Referring to MO sheet, load relevant program.
Start machine.
9
9.1
9.2
9.3
9.4
9.5
9.6
A.O.I. Line 2: (Operator Line 1)
Note the time for the last board tested in the AOI.
Referring to MO sheet, load relevant program.
Check/realign as necessary bar code reader on input conveyor.
Check/adjust width on all connecting conveyors.
Check/adjust width on WES racks.
Switch on the inspection point to allow products through the oven.
10
10.1
10.2
Changeover finalisation: (Operator Line 2&3)
Note the time for the first product tested in the AOI.
The changeover time noted is now to be reported in the OEE data collection
sheet.
Change over is now completed and the line 1 operator can now go back to line
1.
10.3
81
Appendix 4 – Example of Stock Cost Reduction
82
83
Appendix 5 – Design Suggestions for GEN2 3M
Top Side Suggestions
84
85
Bottom Side Suggestions
86
87
88
89
90
Appendix 6 – ESD Flooring Suggestion
91
Appendix 7 – Solder Paste Procedure
Storage
•
The solder paste should be stored in a refrigerator with the temperature 5-10ºC
•
The paste should never be frozen.
Preparation
•
Solder paste is to be taken out of the refrigerator 24 HOURS BEFORE USE in order
to allow it to reach room temperature. It must reach room temperature before use.
•
Make sure that the paste isn’t out of date.
•
When a container is removed from the refrigerator the time and date is to be written on
the container.
•
No heating method to speed up the process is allowed.
•
The lid of the container should never be removed during the 24 hours, otherwise the
paste will oxidize and dry out making it a bad quality paste.
•
Usage
Use the solder paste with the earliest stated time and date that has been removed from
the refrigerator.
•
The solder paste should be thoroughly STIRRED with a chemically resistive plastic
spatula for 2-3 MINUTES.
•
Before adding solder paste to the stencil make sure it is clean, clean it at every change
over, clean it using the automated wash system.
•
A chemically resistive plastic spatula should be used when applying solder paste to the
stencil to ensure no damage to the stencil is made.
•
Do not add to much solder paste to the stencil, the amount should not exceed the
height of the squeegee blade.
•
Always KEEP THE LID ON the container tightly closed when not in use.
•
When performing a change over put the remaining old solder paste into a separate
cleaned container do not add to an unused paste container.
DO NOT MIX USED SOLDER PASTE WITH FRESH ONE!!!
•
Before reusing old paste, repeat the usage procedure once again.