1
DATA LOGGER
MODELS DL-1080/1081
USER MANUAL
V1.5x
INTRODUCTION ................................................................................................................................................................. 4
CONNECTIONS AND INSTALLATION ............................................................................................................................... 5
MECHANICAL INSTALLATION..................................................................................................................................... 5
ATTACHING AND DETACHING THE FRONT COVER .......................................................................................... 8
ATTACHING AND DETACHING THE DISPLAY ..................................................................................................... 9
ELECTRICAL CONNECTIONS ..................................................................................................................................... 9
SAFETY SUMMARY ..................................................................................................................................................... 9
RECOMMENDATIONS FOR INSTALLATION ....................................................................................................... 10
POWER SUPPLY .................................................................................................................................................. 11
DIGITAL I/O ........................................................................................................................................................... 11
RELAYS ................................................................................................................................................................. 11
RS485 .................................................................................................................................................................... 11
AUXILIARY POWER SUPPLY FOR POWERING TRANSMITTERS .................................................................... 12
ANALOG INPUTS .................................................................................................................................................. 13
CONNECTIVITY RESOURCES .................................................................................................................................. 14
FLAGS (LEDS).................................................................................................................................................................. 15
INSTALLING THE USB DRIVER ...................................................................................................................................... 16
WINDOWS 7 ............................................................................................................................................................... 16
DEFINITION AND SELECTION OF SERIAL PORT (COM) - WINDOWS......................................................................... 19
CONFIGURATION AND DATA DOWNLOAD SOFTWARE .............................................................................................. 20
CONFIGURATION ...................................................................................................................................................... 21
GENERAL CONFIGURATIONS ............................................................................................................................ 23
RS485 INTERFACE CONFIGURATION ................................................................................................................ 24
ETHERNET INTERFACE CONFIGURATION ....................................................................................................... 25
ETHERNET INTERFACE CONFIGURATION - TCP/IP ................................................................................... 26
ETHERNET INTERFACE CONFIGURATION – FTP ....................................................................................... 27
ETHERNET INTERFACE CONFIGURATION - SMTP ..................................................................................... 28
ETHERNET INTERFACE CONFIGURATION - E-MAIL RECEIVERS ............................................................. 28
ETHERNET INTERFACE CONFIGURATION - SNMP .................................................................................... 29
ETHERNET INTERFACE CONFIGURATION – HTTP .................................................................................... 30
ETHERNET INTERFACE CONFIGURATION – MODBUS TCP ...................................................................... 31
ANALOG CHANNELS CONFIGURATION............................................................................................................. 32
ANALOG CHANNELS CONFIGURATION – CUSTOM CALIBRATION ........................................................... 34
DIGITAL CHANNELS CONFIGURATION.............................................................................................................. 35
REMOTE CHANNELS CONFIGURATION ............................................................................................................ 37
VIRTUAL CHANNELS CONFIGURATION ............................................................................................................ 40
ALARMS CONFIGURATION ................................................................................................................................. 41
LOG CONFIGURATION ........................................................................................................................................ 45
DIAGNOSTICS ............................................................................................................................................................ 47
DOWNLOAD ............................................................................................................................................................... 50
DOWNLOAD DATA ............................................................................................................................................... 51
DOWNLOAD MANAGER ....................................................................................................................................... 54
USING THE STEP-BY-STEP (WIZARD) ......................................................................................................... 54
NON STEP-BY-STEP ...................................................................................................................................... 62
PREFERENCES .......................................................................................................................................................... 66
PASSWORD PROTECTION.................................................................................................................................. 66
COMMAND-LINE OPERATION .................................................................................................................................. 67
BATCH FILE .......................................................................................................................................................... 67
ACTION TYPE ................................................................................................................................................. 67
CONNECTION MODE ..................................................................................................................................... 67
ACTION PARAMETERS .................................................................................................................................. 68
AEMC INSTRUMENTS
DATA LOGGERS
EXPORT PARAMETERS ................................................................................................................................. 68
DATA LOGGER OPERATION .......................................................................................................................................... 69
ANALOG INPUTS ....................................................................................................................................................... 69
DIGITAL INPUTS/OUTPUTS ...................................................................................................................................... 70
COUNTING ............................................................................................................................................................ 70
OUTPUT RELAYS ....................................................................................................................................................... 71
RS485 INTERFACE .................................................................................................................................................... 71
AUXILIARY RS485 ...................................................................................................................................................... 71
REMOTE CHANNELS ................................................................................................................................................. 71
VIRTUAL CHANNELS ................................................................................................................................................. 72
USB INTERFACE ........................................................................................................................................................ 73
USB DEVICE ......................................................................................................................................................... 73
USB HOST............................................................................................................................................................. 74
ETHERNET INTERFACE ............................................................................................................................................ 74
MODBUS-TCP ....................................................................................................................................................... 74
SENDING E-MAILS - SMTP .................................................................................................................................. 75
WEB PAGES - HTTP ............................................................................................................................................. 75
UNCHANGEABLE PAGES .............................................................................................................................. 75
CUSTOM PAGES ............................................................................................................................................ 77
MARKERS ............................................................................................................................................................. 77
FILE TRANSFER - FTP ......................................................................................................................................... 79
NETWORK MANAGEMENT - SNMP .................................................................................................................... 79
DATA LOGGING AND DOWNLOAD ........................................................................................................................... 81
ALARMS ...................................................................................................................................................................... 83
DATA COMMUNICATION................................................................................................................................................. 85
DISPLAY (HUMAN-MACHINE INTERFACE).................................................................................................................... 86
“FAVORITES” SCREEN .............................................................................................................................................. 88
“CHART” SCREEN ...................................................................................................................................................... 88
“CHANNEL LIST” SCREEN......................................................................................................................................... 88
“ALARMS” SCREEN ................................................................................................................................................... 88
“STATUS” SCREEN .................................................................................................................................................... 89
“CONFIGURATION” SCREEN .................................................................................................................................... 90
EQUIPMENT SOFTWARE/FIRMWARE UPDATE ............................................................................................................ 91
CLOCK BATTERY REPLACEMENT................................................................................................................................. 92
SPECIFICATIONS ............................................................................................................................................................ 94
REPAIR AND CALIBRATION ...................................................................................................................................... 96
TECHNICAL AND SALES ASSISTANCE.................................................................................................................... 96
LIMITED WARRANTY ................................................................................................................................................. 97
WARRANTY REPAIRS ............................................................................................................................................... 97
AEMC® INSTRUMENTS – 99-MAN 100386 v5
2
AEMC INSTRUMENTS
AEMC® INSTRUMENTS – 99-MAN 100386 v5
DATA LOGGERS
3
AEMC INSTRUMENTS
DATA LOGGERS
INTRODUCTION
The Data Logger Models DL-1080/1081, hereafter, will be referred to in this document as Data Logger.
The Data Logger is a high-resolution and high-speed data acquisition and logging equipment for analog and digital
signals. The result of an advanced technological development, the product is distinguished in diverse aspects, such as
high-performance, high-connectivity and ease of configuration and operation. This technology is presented as the ideal
solution for applications that require flexibility and functionality for diverse communication networks.
Its main features include:
•
Analog inputs: 8
•
Digital inputs/outputs: 8
•
Relay outputs: 2
•
2 MB internal memory
•
SD Card interface (up to 16 GB – not available in some models)
•
RS485 interface
o Main: Modbus RTU master and slave
o Auxiliary (DB9 connector – not available in some models): Modbus RTU slave
•
•
•
Ethernet services (not available in some models):
o DHCP
o HTTP (web page)
o FTP (client and server)
o SMTP (e-mails sending)
o SNMP
o Modbus TCP
USB:
o
o
Host
Device
DISPLAY (HMI - human-machine interface [DISPLAY] – optional)
There are four input channel types in the Data Logger: analog, digital, remote and virtual. Analog and digital channels
are those acquired directly by Data Logger through their respective inputs. The remote channels are those acquired
through Modbus RTU protocol, operating as master on its RS485 interface. Virtual channels are a special type of input
channel where mathematical operations can be carried out, allowing the calculation of complex formulas from the
measured information.
The analog input channels are configurable for reading voltage, current, thermocouples, Pt100 and Pt1000 signals.
These inputs count on the precision of a 24 bit A/D converter with high acquisition speed, which can reach 1000 samples
per second. The digital channels can be configured individually as inputs or outputs.
The Ethernet interface allows data download and data access of the inputs and outputs, through services that can be
individually enabled and configured. Through a web browser (HTTP), one can visualize the data of the enabled channel,
diagnostics and general information of the Data Logger. FTP client can be used for logging data downloads. Data
Logger can identify up to 32 distinct alarm conditions, allowing the triggering of outputs, sending e-mails or SNMP traps
whenever an alarm condition is detected. All the information relative to the variables, status and diagnostics of the Data
Logger are available in Modbus registers that can be accessed through the Modbus TCP interface or the Modbus RTU
interface available either through USB interface (device) or RS485 (when operating as slave).
The USB Interface device is used for connection to a computer for configuration, monitoring or download. Whereas the
USB interface host is used for connection of a USB flash drive, for data downloading from the logging memory.
The data logging memory can be transferred by any of the interfaces to the configuration software, which allows the
exportation for the most diverse data formats.
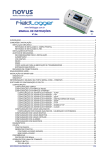
When the indication of the measured data from the process is necessary, an exclusive color graphical DISPLAY
(Human-Machine Interface) can be attached or installed remotely (optional).
NOTE: The DISPLAY is also referred to as HMI in the software provided with the data logger.
AEMC® INSTRUMENTS – 99-MAN 100386 v5
4
AEMC INSTRUMENTS
DATA LOGGERS
CONNECTIONS AND INSTALLATION
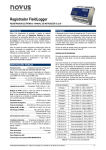
When unpacking, remove the insulating film of the Data Logger battery, located below
the chassis according to Fig. 01, before carrying through the electrical wiring and
configuration.
Fig. 01 – Insulating film of the battery
MECHANICAL INSTALLATION
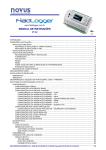
Data Logger chassis can be installed on a 35 mm DIN rail.
For the installation on the rail, you must pull out the two clamps located right below the connections of the channels,
taking care not to remove them, as per Fig. 02.
Note: If necessary, the connector may be removed for installation of DIN rail.
Fig. 02 - DIN rail installation
AEMC® INSTRUMENTS – 99-MAN 100386 v5
5
AEMC INSTRUMENTS
DATA LOGGERS
Afterwards, attach the Data Logger to the rail according to Fig. 03.
Fig. 03 - DIN rail installation
Finally, push the two clasps up until you hear a double-click to complete the installation, as shown in Fig. 04.
Fig. 04 - DIN rail installation
AEMC® INSTRUMENTS – 99-MAN 100386 v5
6
AEMC INSTRUMENTS
DATA LOGGERS
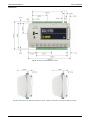
Dimensions:
Fig. 05 – Dimensions without DISPLAY module
Fig. 06 – Dimensions of the side without DISPLAY module
AEMC® INSTRUMENTS – 99-MAN 100386 v5
7
Fig. 07 – Dimensions of the side with DISPLAY module
AEMC INSTRUMENTS
DATA LOGGERS
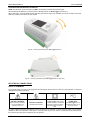
ATTACHING AND DETACHING THE FRONT COVER
NOTE: The DISPLAY is also referred to as HMI in the software provided with the data logger.
When detaching the front cover, pull the lever at the right side of the Data Logger up to the end.
When attaching it, insert the cover (left side first) and press its right side gently. After that, press the lever back into the
chassis.
Fig. 08 – Attaching and detaching Data Logger front cover
Fig. 09 – Attaching and detaching Data Logger front cover (side view)
AEMC® INSTRUMENTS – 99-MAN 100386 v5
8
AEMC INSTRUMENTS
DATA LOGGERS
ATTACHING AND DETACHING THE DISPLAY
NOTE: The DISPLAY is also referred to as HMI in the software provided with the data logger.
When detaching the DISPLAY, pull up the lever at the right side of the Data Logger up to the end.
When attaching it, insert the DISPLAY (left side first) and press its right side until DB9 connectors are firmly connected.
After that, press the lever down into the chassis.
Fig. 10 – Attaching and detaching the Data Logger DISPLAY
Fig. 11 – Attaching and detaching the Data Logger DISPLAY (side view)
ELECTRICAL CONNECTIONS
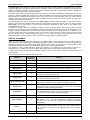
SAFETY SUMMARY
The symbols below are used on the equipment and throughout this document to draw the user’s attention to important
operational and safety information.
CAUTION or WARNING:
Read complete instructions
prior to installation and
operation of the unit.
DOUBLE INSULATION
The Data Logger power supply
is double insulated, represented
by the above symbol printed on
the equipment’s connection
label.
CAUTION or WARNING:
Electrical Shock Hazard
POWER INPUT
The Data Logger may be
powered from either AC or
DC power source.
All safety related instructions that appear in the manual must be observed to ensure personal safety and to prevent
damage to either the instrument or the system. If the instrument is used in a manner not specified by the manufacturer,
the protection provided by the equipment may be impaired.
AEMC® INSTRUMENTS – 99-MAN 100386 v5
9
AEMC INSTRUMENTS
DATA LOGGERS
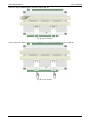
Fig. 12 - Data Logger front panel
The Data Logger has two rows of terminals. Among them are the following items: Ethernet, input connections, power
supply, output relays, auxiliary power supply output, digital inputs and serial communication. This information is identified
according to Fig. 13 and Fig. 14:
Supply Voltage
Fig. 13 - Upper side connections
NOTES:
1) An external protection device consisting of a 0.5A slow blow fuse (UL Listed) must be wired near to the Data Logger.
2) A switch or circuit-breaker placed near to the Data Logger shall be used as the disconnecting device.
Fig. 14 - Lower side connections
RECOMMENDATIONS FOR INSTALLATION
•
Input signal leads must be installed in grounded conduits and away from power or contactor wires.
•
Instruments must be powered only by an exclusive power supply.
•
Installing RC filters (47Ω and 100nF, serial) is strongly recommended at contactor coils or any other inductors.
•
System failure should always be taken into account when designing a control panel to avoid irreversible damage to
equipment or injury to people. The RL1 and RL2 output relays, used as alarms, do not warrant total protection.
•
Wiring section: minimum gauge 0.14 mm².
AEMC® INSTRUMENTS – 99-MAN 100386 v5
10
AEMC INSTRUMENTS
DATA LOGGERS
POWER SUPPLY
The terminals 25 and 26 are used to supply power to the Data Logger.
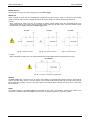
DIGITAL I/O
There are eight I/O ports that can be individually configured as inputs or outputs. There is a terminal for the positive
signal of each I/O, and a common negative terminal for all of them (there is no isolation between the channels).
• Inputs:
When configured as inputs, they may be connected to voltage outputs (please check the acceptable levels in the
Specifications section), dry-contact outputs and NPN outputs. Care must be taken when connecting multiple outputs
because there is no isolation between the Data Logger inputs.
Fig. 15 - Voltage connection
Fig. 16 - Dry-contact connection
Fig. 17 - NPN Connection
• Outputs:
When configured as outputs, they can activate limited power loads (please check the Specifications section).
Fig. 18 - Connection of a load RL to a digital output
RELAYS
The Data Logger has 2 relays that can be used in the activation of electrical loads (please check the Specifications
section). For each relay, there is a common terminal, NC (normally closed) terminal and a NO (normally open) terminal.
When deactivated, the relay common is in contact with the NC terminal. When activated, the common is in contact with
the NO terminal.
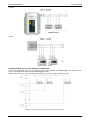
RS485
The RS485 Interface of the Data Logger has terminals for the 3-wire communication, including the common. The
connection in a Modbus network will depend if the device is configured to operate as a master or a slave.
AEMC® INSTRUMENTS – 99-MAN 100386 v5
11
AEMC INSTRUMENTS
DATA LOGGERS
• Master
• Slave
Fig. 19 – Master and Slave
AUXILIARY POWER SUPPLY FOR POWERING TRANSMITTERS
For non 24V transmitters, there is a built in 24VDC power supply available in the Data Logger. This auxiliary power
supply is electrically isolated from the other Data Logger terminals.
Below is the correct way to use the auxiliary power supply for powering 4-20mA transmitters (2-wire).
Fig. 20 – Auxiliary power supply powering 4-20mA (2-wire) transmitters
AEMC® INSTRUMENTS – 99-MAN 100386 v5
12
AEMC INSTRUMENTS
DATA LOGGERS
ANALOG INPUTS
Pt100/Pt1000 connection
The RTD connection for the channels is made to the terminals in accordance with the
figure at the left. The 3-wire connection from the Pt100 sensing element to the Data
Logger input guarantees the cancellation of the error caused by the lead resistance. All
three wires must have the same gauge and length.
For the two-wire Pt100, interconnect terminals 1 and 2.
Thermocouple connection
The Thermocouple connection for the channels is made to the terminals in accordance
with the figure at the left. Please observe the correct connection polarity.
Cables used for connecting thermocouples must have the same thermoelectric
characteristics as the thermocouple used (compensation cable or extension cable), and
also must be connected with the correct polarity.
The non-use of compensation cables or the use with the incorrect polarity can cause
significant measurement errors.
Voltage (mV) connection
The millivolt connection for the channels is made to the terminals in accordance with the
figure at the left. Please observe the correct polarity of the connection.
Voltage (V) connection
The voltage connection for the channels is made to the terminals in accordance with the
figure at the left. Please observe the correct polarity of the connection.
Current (mA) connection
The milliamp connection for the channels is made to the terminals in accordance with the
figure at the left. Please observe the correct polarity of the connection.
AEMC® INSTRUMENTS – 99-MAN 100386 v5
13
AEMC INSTRUMENTS
DATA LOGGERS
CONNECTIVITY RESOURCES
Fig. 21 - Data Logger connectivity resources
USB Connection
Interface used for a USB drive connection, for downloading data from the logger memory.
PC Connection
Interface used for connection to a computer for configuration, monitoring or data download.
SD card connection
Interface used for SD card expansion. The data from the logger memory can be transferred
by any of the interfaces to the configuration software, which allows exportation for a wide
varity of data formats.
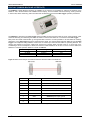
Ethernet
Interface used for Ethernet 10/100 communication. It is recommended to use a category 5 (or
higher) cable in a RJ45 connector.
The Ethernet connector on the Data Logger has two indicating LEDS: the green LED (on the
left side) lights indicating the connection to the Ethernet network; the yellow LED (on the right
side) flashes indicating that there is data traffic in the interface.
DB9 connection for DISPLAY (Optional)
Connection for installation of the DISPLAY (Human–Machine Interface) on the Data Logger
used for indicating measured signals and configuration. With firmware version 1.20 and
higher, it can be used as a generic RS485/Modbus RTU (slave) port.
AEMC® INSTRUMENTS – 99-MAN 100386 v5
14
AEMC INSTRUMENTS
DATA LOGGERS
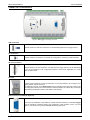
FLAGS (LEDS)
Tx/Rx flags
These LEDs signal transmission and reception of data by the RS485/Modbus interface,
regardless if it is configured to operate in master or slave mode.
Status / USB flags
When connecting the equipment, both LEDs initially flash two times and then turn off until all
the initialization has been completed.
The Status flag remains ON in normal condition. When it is logging, flashes 2 times at 3
second intervals. In error conditions, this LED will be flashing 3 times at 8 second intervals.
In the error cases, please check if the Data Logger clock has the correct date and time. If
they are wrong, probably the clock battery has run down and needs to be replaced. If it is OK,
try rebooting the machine by turning off its power supply and restarting it after 10 seconds. If
the LED continues to indicate an error, there may be something wrong with your Data
Logger requiring service.
The USB flag remains ON only while a cable is connected to a USB device or while the USB
flash drive is plugged into the USB host interface. The following exceptions are:
•
Download errors via USB flash drive: flash drive with insufficient writing space,
inability to write to the flash drive (write protected) or flash drive not compatible
(sector different from 512 bytes, for example), the USB LED flashes while the error
condition remains (typically, until the flash drive has been removed). Check the "USB
Interface" section in the "Data Logger Operation" chapter for more details.
•
At the end of the download, if everything is correct, the USB flag remains ON until the
flash drive has been removed from the equipment.
AEMC® INSTRUMENTS – 99-MAN 100386 v5
15
AEMC INSTRUMENTS
DATA LOGGERS
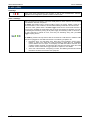
INSTALLING THE USB DRIVER
When installing the configuration software, the USB driver is automatically installed. If you need to install the driver
without depending on the software, this can be done by following the procedure described below.
The following installation steps may vary from PC to PC, even for the same operating system version. The steps and
screens that follow below are only for guidance purposes.
NOTE: The Data Logger may be referred to as the FieldLogger in some instances.
WINDOWS 7
1. Connect the Data Logger to a USB port on your computer. Windows will try to install a driver automatically and will
not succeed, because the necessary driver is not in its standard library.
2. Click on "Start>Control Panel". Click on "System", then on the "Device Manager".
3. Locate the Data Logger (the icon with an exclamation mark next to it) and double-click on it.
4. Click on "Update Driver...".
5. Ask to "Browse my computer for driver software".
6. Enter the path for the folder where the drivers are located (the product CD or folder where you saved them when
downloaded from the site).
AEMC® INSTRUMENTS – 99-MAN 100386 v5
16
AEMC INSTRUMENTS
DATA LOGGERS
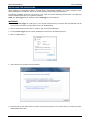
7. Wait for the installation to begin.
AEMC® INSTRUMENTS – 99-MAN 100386 v5
17
AEMC INSTRUMENTS
DATA LOGGERS
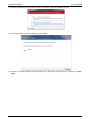
9. Windows will indicate that it cannot verify the editor of this driver. Confirm the installation anyway.
10. A message indicating successful installation will then display.
11. Returning to the Device Manager screen will allow you to check which virtual serial port is allocated to the Data
Logger.
AEMC® INSTRUMENTS – 99-MAN 100386 v5
18
AEMC INSTRUMENTS
DATA LOGGERS
DEFINITION AND SELECTION OF SERIAL PORT (COM) - WINDOWS
The serial port associated to the Data Logger is automatically defined by the operating system right after connecting the
Data Logger. The user can easily identify or change the COM port associated with Data Logger:
NOTE: The Data Logger may be referred to as the FieldLogger in some instances.
Control Panel / System / Hardware / Device Manager / COM & LPT Ports
Select the device "USB Serial Port" corresponding to the Data Logger and click on "Properties". Select "Port Settings"
and click on "Advanced". In the "COM Port Number", select the serial port to be associated with Data Logger. Some
serial ports can be checked while In Use. Just select one of these ports if you know that it is not being used by another
peripheral device on your computer.
In some cases, the serial ports can be checked as in use even when the associated device is no longer installed on your
computer. In this case it is safe to associate this port to Data Logger. The following figure presents the view of the
device manager containing a Data Logger, and property screens where you can reset the associated COM port.
AEMC® INSTRUMENTS – 99-MAN 100386 v5
19
AEMC INSTRUMENTS
DATA LOGGERS
CONFIGURATION AND DATA DOWNLOAD SOFTWARE
The configuration software (Configurator) allows you to configure Data Logger, download and export recorded data and
read input channels and status information. This chapter is intended to show and explain software usage. The use of the
Data Logger with all its features will be detailed in the chapter "Data Logger Operation”.
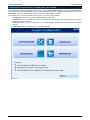
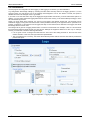
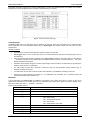
On the main screen, choose the function that you want to run from the four available:
• Configuration: Allows you to change the Data Logger configuration.
• Diagnostics: Allows you to read the values of the enabled channels, the status of configured alarms and general
information and device status.
• Download: Allows you to download data from the Data Logger memory, view and export them in various
formats.
• Preferences: It allows modifying some of the software options.
AEMC® INSTRUMENTS – 99-MAN 100386 v5
20
AEMC INSTRUMENTS
DATA LOGGERS
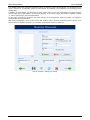
CONFIGURATION
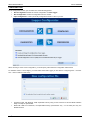
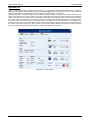
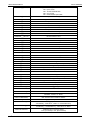
On the configuration screen, you can select one of the following options:
•
Read Configuration: Reads the current configuration of a Data Logger.
•
New Configuration: Creates a configuration from the scratch.
•
Open Configuration: Loads a previously configuration saved to a file on your PC.
When choosing to create a new configuration, you must specify a file where this configuration will be saved.
For software version 1.40 and higher, you must select which Data Logger you are about to configure (power – normal or
24V – does not matter on this case):
•
Complete model, with Ethernet, USB, expansible memory using an SD Card and a second RS485 interface
ready to accept an optional HMI.
•
Model with USB but no Ethernet, non-expansible memory (internal flash only – no SD Card) and only one
RS485 interface.
AEMC® INSTRUMENTS – 99-MAN 100386 v5
21
AEMC INSTRUMENTS
DATA LOGGERS
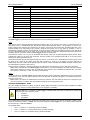
Once the configuration has been loaded into the software (originated from a device, a file, or simply created from scratch,
according to the selected option), then you can make the desired configuration changes. There is a sequence of screens
with various parameters arranged by functionality to accomplish this.
Each time you try to move onto the next screen (via the "Next" button), the configured parameters are checked. If there
are problems with any parameter, an error window is displayed and the symbol "
not be consistent with other previous settings.
” shows up next to the field that may
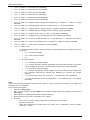
The icon bar at the bottom of the window has icons for the following functions:
•
Back: Returns to the previous configuration screen.
•
Save: Saves the current configuration to a file. If a file has not yet been associated with this configuration, it
opens a dialog screen for the user to choose the name and location of the file.
•
Connection: Allows connection to a Data Logger (opens a window for the interface selection) when it is
disconnected and the disconnection when it is connected.
•
Load Screen Initial Configuration: Undo the changes made by the user and returns to the initial configuration
of the current screen.
•
Cancel: Closes the current configuration.
•
Next: Performs the settings check of the current configuration screen and, if everything is OK, goes to the next
screen.
Icon toolbar
AEMC® INSTRUMENTS – 99-MAN 100386 v5
22
AEMC INSTRUMENTS
DATA LOGGERS
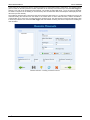
GENERAL CONFIGURATIONS
The first screen shows some general parameters for configuration for the Data Logger:
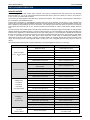
•
Tag (name) to be given to the equipment (maximum of 16 characters).
•
When using the DISPLAY with the Data Logger, you need to indicate the level of access that the operator will
have:
o No DISPLAY access: Prevents the use of the DISPLAY, because no parameter can be viewed by it in
the Data Logger.
o Parameters reading: The DISPLAY can be used only to view the channels and status of the Data
Logger, no configuration changes are allowed.
o DISPLAY configuration and overall reading: Full configuration of the DISPLAY is allowed, as well
as viewing the channels and status of the Data Logger.
o Overall configuration and reading: The DISPLAY can be used to configure parameters (its own and
some for the Data Logger), in addition to viewing the channels and status of the Data Logger.
•
Enabling data download by using a USB flash drive: it enables or disables the data download using a USB flash
drive. When enabled, it also indicates the priority in case of a USB flash drive without enough space to
download all requested data: more recent data or older data. In addition, you can configure the number of days
(from the day of download, if the priority is the latest, or from the oldest data, if the priority is the oldest) that you
want to download. Because of the fact that we do not make a copy of all data from the equipment’s memory
(which, in the case of SD cards, can be a lot of data), this can accelerate download time significantly.
General Configurations
AEMC® INSTRUMENTS – 99-MAN 100386 v5
23
AEMC INSTRUMENTS
DATA LOGGERS
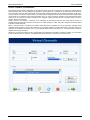
RS485 INTERFACE CONFIGURATION
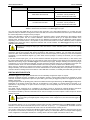
Next configuration screen is the RS485 Interface screen. On this screen, you can choose the type of behavior for this
interface: whether it will be a Modbus RTU slave, a Modbus RTU master or not be used at all. It is recommended to
disable the interface if it is not used.
When it is used as a slave, you must configure your Modbus address, the baud rate, parity and number of stop bits.
When it is used as a master, it is not necessary to configure the Modbus address (only valid for the slaves). In this case,
the configuration of Modbus network, where it indicates which registers are read from what slaves, will be carried through
later, on the Remote Channels screen.
Interface RS485
AEMC® INSTRUMENTS – 99-MAN 100386 v5
24
AEMC INSTRUMENTS
DATA LOGGERS
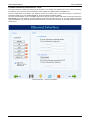
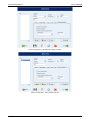
ETHERNET INTERFACE CONFIGURATION
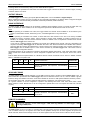
The Ethernet interface configuration should be carried through the screen below. If it is to be used, it is recommended to
disable it, as shown here.
Disabled Ethernet Interface
AEMC® INSTRUMENTS – 99-MAN 100386 v5
25
AEMC INSTRUMENTS
DATA LOGGERS
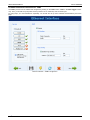
ETHERNET INTERFACE CONFIGURATION - TCP/IP
Once the interface is enabled, the buttons on the left allow you to enable and configure each of the services offered by
this interface. The icon on the right of each button shows whether the related service is enabled or not.
The first configuration to be made is the selection of fixed IP or DHCP and, in the case of fixed IP, to choose the
parameters relating to it, such as Data Logger IP, the subnet mask and default gateway.
You must choose whether or not to use DNS, which can be used to connect to the e-mail server or FTP server (when the
Data Logger is the FTP client for the daily download of data through this service). If so, you must configure the DNS
server's IP address or, if the DHCP option has been selected, you can choose to search for the DNS server’s IP from the
DHCP server.
Ethernet Interface - TCP/IP Configuration
AEMC® INSTRUMENTS – 99-MAN 100386 v5
26
AEMC INSTRUMENTS
DATA LOGGERS
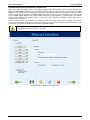
ETHERNET INTERFACE CONFIGURATION – FTP
The FTP button allows you to configure the options related to the FTP services. There are two types of FTP related
functionality to choose from in the Data Logger: client and server.
As a server, the Data Logger allows for an external client to connect to it in order to download logged data, both from the
SD card as well as from internal memory. You must configure the connection and access data, for user name (maximum
of 10 characters), password (maximum of 10 characters) and connection port.
As a client, once a day at a set time, it will connect to a FTP server to send the data from its memory (internal or SD
card). You must configure the following access parameters so the Data Logger will be able to access the server: user
(maximum of 50 characters) and password (maximum of 10 characters), in addition to the IP address or server name (in
case you enabled the DNS – name being up to 50 characters) and the server’s port.
Ethernet Interface - FTP Configuration
AEMC® INSTRUMENTS – 99-MAN 100386 v5
27
AEMC INSTRUMENTS
DATA LOGGERS
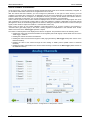
ETHERNET INTERFACE CONFIGURATION - SMTP
The SMTP button allows access to the parameters related to sending e-mails. The Data Logger allows e-mails to be
sent to multiple receivers when alarms or events are active. On this screen, the parameters related to the access to the
e-mail server must be configured, such as its IP address or server name (in case you enabled the DNS – name being up
to 50 characters), in addition to the user (maximum of 50 characters) and password (maximum of 12 characters).
Finally, you must configure the e-mail parameters to be sent in case of an alarm event. This e-mail has a subject
(maximum of 32 characters) and has a part of the message body that is user defined (up to 64 characters) and it is the
same for all alarms or events. The e-mail of the sender (maximum of 50 characters) and the e-mails of the receivers
(maximum of 50 characters for each one) must also be configured.
Ethernet Interface - SMTP Configuration
ETHERNET INTERFACE CONFIGURATION - E-MAIL RECEIVERS
To insert e-mail receivers, click on the "Edit List" button. A new window will open, allowing for the inclusion and removal
of e-mails from the receivers list. All potential receivers of alarm or event e-mails must be included in this window. The
choice of which alarms or events will be sent to which receivers will be made later, on the alarms configuration screen.
Ethernet Interface - Configuration of E-mail Receivers
AEMC® INSTRUMENTS – 99-MAN 100386 v5
28
AEMC INSTRUMENTS
DATA LOGGERS
ETHERNET INTERFACE CONFIGURATION - SNMP
The SNMP protocol can be enabled and configured by clicking on the SNMP button. SNMP in the Data Logger is readonly. Thus, you should set up the public access (maximum of 16 characters) and connection port.
For using traps, you must enable them separately. You should also set up the IP address and destination port for the
traps.
Ethernet Interface – SNMP Configuration
AEMC® INSTRUMENTS – 99-MAN 100386 v5
29
AEMC INSTRUMENTS
DATA LOGGERS
ETHERNET INTERFACE CONFIGURATION – HTTP
The HTTP button enables the Data Logger to serve a web page with some of its data. This page has an auto-refresh
parameter, indicating to the browser software that the page should be reloaded with updated data from periodically. For
this, the configuration needed is the connection port and the time in seconds between page updates.
Ethernet Interface – HTTP Configuration
AEMC® INSTRUMENTS – 99-MAN 100386 v5
30
AEMC INSTRUMENTS
DATA LOGGERS
ETHERNET INTERFACE CONFIGURATION – MODBUS TCP
Finally, the Modbus TCP button allows you to enable the Modbus TCP communication protocol, used to read and write
data to the Data Logger. Additionally the Configuration software itself uses this protocol to communicate with the Data
Logger in order to read and write configuration parameters, view diagnostic data and download recorded data, when
Ethernet interface has been selected. The Data Logger should be accessed by the “255” identification (ID). Any other ID
used in a Data Logger Modbus-TCP access will be understood as being targeted to a RS485 slave in the RS485
network, reached through the gateway function. In this case, if this functionality is enabled, the data packet will be
forwarded to the RS485 bus.
When the RS485 interface is configured as a Modbus master and Modbus TCP protocol is enabled, the gateway
functions can be enabled, which allows the user to send Modbus commands using the Ethernet interface (Modbus TCP)
to the slaves connected to the Modbus RTU network through Data Logger.
Data Logger operation as a gateway between a Modbus TCP network and a Modbus RTU network is
only available from firmware version 1.10 or later.
Ethernet Interface - Modbus TCP Configuration
AEMC® INSTRUMENTS – 99-MAN 100386 v5
31
AEMC INSTRUMENTS
DATA LOGGERS
ANALOG CHANNELS CONFIGURATION
On the next screen, you must configure the analog channels that will be used. Each channel is individually configured, so
you should first select which channel to be configured in the list on the left.
After the channel has been selected, you must configure its parameters on the right. For each channel, you must
configure a tag (name with a maximum of 16 characters) and an input type. Depending on the selected input type, the
indication limits must also be configured. For temperature sensors, you must choose whether the indication will be in
Celsius or Fahrenheit, for the others, you can type a string for the unit (maximum of 10 characters).
There is also the option to enter an error value to be displayed when an error is detected on the input signal, such as an
open 4-20mAloop or a Pt100 with a broken cable. It is also the possible to configure a digital filter for the input channel
(the higher the value, the more filtering applied to the channel, making the response more immune to noises on the input
signal, but also slower to respond to variations - maximum filter value is 20).
There is also an option to use Custom Calibration. This feature allows up to 10 pairs of points to be inserted in a
“correction table” (per analog input) in the device, creating segments for adjustments to the indicated value. Further
details can be found in the "Data Logger Operation” chapter.
The number of decimal places to be displayed must also be configured. This parameter refers to the following cases:
• Reading the value of the channel via Modbus 16 bits registers (INT16 with signal). Further details can be found in
"Data Logger – Modbus”.
• Reading the value of the channel via DISPLAY.
• Reading the value of the channel through the HTML page generated by Data Logger itself (HTTP service on the
Ethernet interface).
• Reading the value of the channel through the OID reading of SNMP protocol (SNMP service of Ethernet
interface).
• Reading the alarm value related to the channel when receiving e-mails from the Data Logger (SMTP service on
the Ethernet interface).
Analog Channels - Configuration of a temperature channel
AEMC® INSTRUMENTS – 99-MAN 100386 v5
32
AEMC INSTRUMENTS
DATA LOGGERS
Analog Channels – Configuration of a linear channel
AEMC® INSTRUMENTS – 99-MAN 100386 v5
33
AEMC INSTRUMENTS
DATA LOGGERS
ANALOG CHANNELS CONFIGURATION – CUSTOM CALIBRATION
Using the "Custom Calibration" button, you can enter up to 10 custom calibration points for each analog channel as
described below:
1. Disable the custom calibration of the channel to be adjusted, deleting all points configured for it, and apply this
setting.
2. In the points to be adjusted, apply the standard value and write down the value indicated by the equipment.
3. Afterwards, insert the pairs of Custom Calibration points (source value and indicted value) and apply the
configuration.
Analog Channels - Custom Calibration
Analog Channels - Custom Calibration
AEMC® INSTRUMENTS – 99-MAN 100386 v5
34
AEMC INSTRUMENTS
DATA LOGGERS
DIGITAL CHANNELS CONFIGURATION
After configuring the analog channels, next configure the digital channels and relays. Just as it is in the analog channels,
on the list on the left, you can select which channel is to be configured.
Each channel can be configured as an input or an output. As an input, you can enable it or not. If it is disabled, it will not
appear as an option in the logs, alarms, in the virtual channels or even on the DISPLAY. Once the input has been
enabled, you must provide a unique tag (name - maximum of 16 characters) for this channel. You should also provide a
value to be displayed when in "0" level (low voltage level or contact closed at the input) and another value to be indicated
when in "1" level (high voltage level or contact open at the input). These values will be shown in the channel reading.
Optionally configure a unit (maximum 10 characters) for the input.
Digital channels - Configuring an input
It is possible to perform counting on the digital inputs from firmware version 1.10 or later. No special configuration is
needed; just configure digital channels as inputs. The counting values can be accessed by Modbus registers (check the
section on “Data Logger – Modbus”) and can also be copied to a virtual channel, where it can be logged or used by the
alarms, for example. When applying a new configuration in the digital channels, the all previously collected counting
values are reset to zero.
AEMC® INSTRUMENTS – 99-MAN 100386 v5
35
AEMC INSTRUMENTS
DATA LOGGERS
When configured as an output, you should indicate whether this output may be triggered by Data Logger alarms &
events or if it will be controlled by external Modbus commands, coming from a PLC or SCADA software, for example.
Digital channels – Configuring an output
The two Data Logger relays are also configured on this screen and their configuration is similar to that of other digital
outputs. You must indicate whether they are triggered by internal alarms or external Modbus commands.
Digital Channels - Configuring a relay
AEMC® INSTRUMENTS – 99-MAN 100386 v5
36
AEMC INSTRUMENTS
DATA LOGGERS
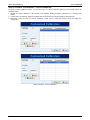
REMOTE CHANNELS CONFIGURATION
The configuration of remote channels is only available when the RS485 interface has been configured as a Modbus
master. In the case of the RS485 interface having been configured as a slave or disabled, the remote channels screen
will display a message indicating the inability of its configuration.
Remote Channels Disabled
AEMC® INSTRUMENTS – 99-MAN 100386 v5
37
AEMC INSTRUMENTS
DATA LOGGERS
If the RS485 interface was configured as Modbus master, the following screen will be displayed. You should set up a tag
(name - maximum of 16 characters), unique for each channel, and optionally a unit (maximum of 10 characters) for the
reading value.
In addition, for each channel, you should set up which network slave is to be read, what Modbus command should be
used and what is the initial register to be read from the slave. In the current version, the number of registers is always
"1", which means that you cannot do block reading.
An error value must also be configured. This value is shown on the channel when there is a problem, for example, a
communication error with the slave.
After channel configuration, you must click on the “Add” button in order to enter the channel in the list to the left. If you
want to remove a channel from the list, you must select it from the list and click on "Remove".
Remote Channels - Setting up a channel
AEMC® INSTRUMENTS – 99-MAN 100386 v5
38
AEMC INSTRUMENTS
DATA LOGGERS
At the bottom of the screen there are the general parameters for the Modbus Master configuration. The reading interval,
given in tenths of seconds (maximum 18,000, equivalent to 30 minutes) is the time that you want the Data Logger to
perform a new scan of all configured remote channels. The number of trials (valid range: 1 to 10) is how many attempts
are made in sequence for the reading of each channel (if the communication fails in all attempts it will display the error
value set up for the channel).
The maximum response time it will wait for the slave’s response (valid range: 2 to 10,000 ms) indicates how long it will
wait after sending the command from the master. If the answer does not come within this time, it will be considered a
communication error and a retry (if configured) will be carried through. The time between commands (valid range: 1000
to 5000 ms) indicates how much time Data Logger will wait between receiving the slave’s response and sending the
next command.
Remote Channels - Inserting a channel in the list
AEMC® INSTRUMENTS – 99-MAN 100386 v5
39
AEMC INSTRUMENTS
DATA LOGGERS
VIRTUAL CHANNELS CONFIGURATION
The following screen allows configuration of the virtual channels. Each virtual channel is the result of a mathematical or
logical operation and must be configured by selecting a unique tag (name - maximum of 16 characters) for this channel.
You should then select the first channel that will serve as the operand (depending on the selected operation, it will be the
only one). When you select "Constant Value", you will be able to assign a numeric value to the virtual channel (this value
can be used as an operand in other virtual channels). Next, you must choose the operation to be performed and which
channel is to be used as the second operand in the operation (when previously chosen "Constant Value", place the
numeric value of the channel).
Finally, choose a unit (optional - maximum of 10 characters) for the channel, plus an error value and the number of
decimal places desired in the indication of the same one. When clicking on "Add", the newly configured channel is added
to the list of virtual channels.
When a virtual channel is configured, all enabled input channels are available for use as operands, including virtual
channels already placed in the list. This enables you to generate relatively complex expressions, using the result of an
operation as an operand in another one. For more details, please refer to the section on "Virtual Channels" under the
chapter "Data Logger Operation”.
Clicking on any virtual channel in the list, its parameters are loaded at the top fields. To delete a channel, you must select
it from the list and click on "Remove". To delete all the virtual channels, you must click on "Remove All".
Virtual Channels
AEMC® INSTRUMENTS – 99-MAN 100386 v5
40
AEMC INSTRUMENTS
DATA LOGGERS
ALARMS CONFIGURATION
After setting up all channels, you can configure alarms to indicate error or exception conditions. You must choose which
channel must be used for the alarm, what the alarm condition is, and what the set point (trigger value for the alarm) is.
For example, you can select an analog temperature channel to alarm when the temperature exceeds a critical threshold,
or a digital input channel to alarm when your state is different from the expected value.
A hysteresis can be configured to prevent a marginal condition, such as an input that hovers around the set point value,
which would generate multiple alarm events. In some cases, like when the alarm channel is a digital input, the hysteresis
does not make much sense and should be maintained at “0”.
Whenever a digital channel is used for an alarm, hysteresis shall not be used (must be
configured with “0”)!
Each alarm can have one or more associated actions. You should then choose what actions should be performed on the
occurrence of an alarm or event (different actions are organized by tabs). The available actions are: activation of relays,
activation of digital outputs (if they are configured to be triggered by an alarm), sending of e-mails to one or more
receivers (selected from among the ones configured on the Ethernet interface configuration page), sending a SNMP trap
and the start and/or stop of the recording. Finally, when everything is set up, include the alarm in the list by clicking on
the “Add” button.
When clicking on an alarm from the list on the left, its parameters are loaded into the fields on the right. To delete a
channel from the list, you must select it from the list and click on "Remove". To modify parameters of an alarm, you must
select it from the list, make the desired changes and click on "Modify". The button "Delete all" deletes all alarms in the
list.
Alarms Configuration - Relays selection
AEMC® INSTRUMENTS – 99-MAN 100386 v5
41
AEMC INSTRUMENTS
DATA LOGGERS
Alarms Configuration - Digital outputs selection
Alarms Configuration - Logs control configuration
AEMC® INSTRUMENTS – 99-MAN 100386 v5
42
AEMC INSTRUMENTS
DATA LOGGERS
Alarms Configuration - E-mail receivers selection
Alarms Configuration - Enabling SNMP traps
AEMC® INSTRUMENTS – 99-MAN 100386 v5
43
AEMC INSTRUMENTS
DATA LOGGERS
Alarms Configuration – Selection the internal variables
Alarms Configuration - Alarm added to the list
AEMC® INSTRUMENTS – 99-MAN 100386 v5
44
AEMC INSTRUMENTS
DATA LOGGERS
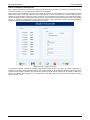
LOG CONFIGURATION
The last page of the configuration is about logging. If data logging is not desired, you should disable it.
Log configuration should begin initially by choosing the start mode and stop mode for the logging process. If, on the
previous screen, the start and/or stop of the loggings were assigned to one or two alarms or events, this option is
disabled and cannot be changed on the Logs screen.
If you want to use the start and/or stop of the loggings through Modbus commands, you must enable these options. In
addition, you must select where the logging data must be stored in the memory; in the internal flash (512k logs) or in the
SD card inserted by the user.
Finally, you must select which channels you want to log and what is the desired storage rate. The channels can be
selected for logging moving them from the left side column (available channels) to the right side column (channels to be
logged). A maximum of 100 channels can be logged, but keep in mind that the more channels to be logged, the slower
the storage rate that can be used.
The storage rate is given as a logging interval and it is common to all channels. For example, a rate of 1 second means
that all channels selected will be stored once per second. Although the equipment allows for a rate of up to 1000 per
second, you must bear in mind the following side effects:
• It is not good to have a storage rate faster than the scan rate of the analog channels or the scan rate of the
remote channels. In this case, the logs would have repeated data.
• The more data that is in memory, the slower the download process will be and more data will be processed in
preview and export.
Logs Configuration – Logging configuration
AEMC® INSTRUMENTS – 99-MAN 100386 v5
45
AEMC INSTRUMENTS
DATA LOGGERS
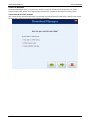
After completing the configuration, you can send it to the data logger by clicking on the "Send" button. If the configuration
was previously read from the data logger and the interface was not disconnected, the same interface used for reading
will be used for writing otherwise you must choose which interface to use for sending the configuration.
At the end of the transmission, a message will appear indicating the success (or failure) of the operation. You can save
the configuration to a file to be retrieved in the future if desired.
If you just want to save it to a file instead of sending the configuration to the Data Logger, you must choose the file name
and click on the “Save” button.
AEMC® INSTRUMENTS – 99-MAN 100386 v5
46
AEMC INSTRUMENTS
DATA LOGGERS
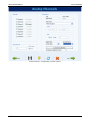
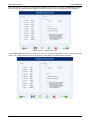
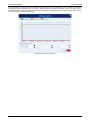
DIAGNOSTICS
When you select Diagnostics, the login screen will appear. You must indicate what interface will be used for reading the
diagnostics parameters: RS485 (RS485 interface of the Data Logger should be selected as "slave"), USB or Ethernet
(the Ethernet interface of the data logger must be enabled, as well as Modbus TCP protocol).
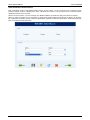
Reading parameters is then performed and the General parameters window is opened. This window shows the data
logger’s tag, serial number, firmware version and model. It also shows the time of its clock compared to the computer's
clock. In this window you can also see the configuration parameters for the RS485 interface. For the Ethernet interface,
the current status (connected or disconnected) is indicated, as well as the IP and MAC addresses. On the right side of
the window, there is an indication of the connection status of the DISPLAY and the USB flash drive, in addition to the
capacity and free space of the internal flash memory and the SD card (when connected). Finally, there is an indication of
the current state of the recording and, when the start or stop of these through Modbus commands is enabled. There are
buttons in order to perform the respective actions of starting and stopping the recording.
Diagnostics - General Status
AEMC® INSTRUMENTS – 99-MAN 100386 v5
47
AEMC INSTRUMENTS
DATA LOGGERS
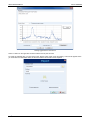
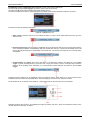
On the Chart tab, you can select up to 6 channels to be viewed in a chart. At the bottom, you can select the channel to
be displayed and its associated color on the chart. When all desired channels are selected, click on the "Start" button.
The channel values will be read approximately every 2 seconds and will be plotted on the chart. If any channel is in error,
the channel selection will be shown in red.
Diagnostics - Monitoring channels
AEMC® INSTRUMENTS – 99-MAN 100386 v5
48
AEMC INSTRUMENTS
DATA LOGGERS
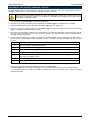
On the Alarms tab, you can check the real-time status of all configured alarms or events. At the top, there is an indication
of how many alarms are enabled and how many are in a state of alarm. In the list below, the settings for each alarm are
shown. If the alarm is active, its configuration is shown in red.
Diagnostics - Monitoring Alarms
AEMC® INSTRUMENTS – 99-MAN 100386 v5
49
AEMC INSTRUMENTS
DATA LOGGERS
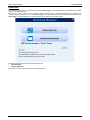
DOWNLOAD
By selecting Download, you can download data from the Data Logger, search data previously downloaded from a folder
or view or export logged data.
The user can create a folder on their computer (or their network) where a recording database will be created. This
database may have data from one or more Data Loggers and will be the destination of all data downloaded from the
Data Logger. From this database, the views and data export will look for the channel data.
The Download Manager screen has the following options:
•
Download Data
•
Download Manager
These options will be viewed in detail in the following sections.
AEMC® INSTRUMENTS – 99-MAN 100386 v5
50
AEMC INSTRUMENTS
DATA LOGGERS
DOWNLOAD DATA
When selecting this option, the first thing to do is choose the data source where the software should read data from.
The available options are:
•
Download data from a Logger (requires a connection with the logger).
•
Download data from a USB flash drive (in cases when the flash drive was used to retrieve data from Data
Logger). The flash drive must be plugged in the computer.
•
Download data from a SD card. The card must have been used in the Data Logger as the recording memory
target. The SD card is recommended when large logging recording takes place because it is the fastest way of
moving data to the computer.
•
Download data from a Windows folder. This folder/directory can be located in your local computer or on your
network. This option should be used to process data previously downloaded via FTP.
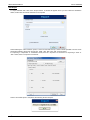
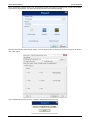
When selecting downloading data directly from Data Logger, a window will pop up asking for the connection mode to the
logger. One of these interfaces can be selected to download data: Ethernet (Modbus TCP) interface, USB (device)
interface or RS485 (Modbus RTU) interface.
AEMC® INSTRUMENTS – 99-MAN 100386 v5
51
AEMC INSTRUMENTS
DATA LOGGERS
After completing the connection, the next screen will show data logger information.
This screen is very useful, as it helps to assure you are accessing the right logger when downloading via
Ethernet/Modbus TCP or RS485/Modbus RTU if there are multiple Data Loggers in the network. Next, the Data Logger
memory location, where logged data is stored (internal flash or SD card), must be chosen.
If you select to download data from the SD card, the next screen will ask the desired time period for the recorded data.
You can download all data (in case of SD cards, the amount of data can be very large and take a long time to download)
or data just from a certain period of time.
AEMC® INSTRUMENTS – 99-MAN 100386 v5
52
AEMC INSTRUMENTS
DATA LOGGERS
Next, you must confirm the data base folder (folder where all data should be stored in your computer or in the network)
and choose whether downloaded data should be deleted from Data Logger memory or should be kept.
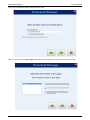
The next step is to transfer the data from Data Logger to data base folder. Click the right green arrow button in order to
proceed, downloading will start and a progress bar will be displayed indicating the download progress. Once
downloaded, a new screen will be opened for data review/export as described in the “Download Manager” section.
AEMC® INSTRUMENTS – 99-MAN 100386 v5
53
AEMC INSTRUMENTS
DATA LOGGERS
DOWNLOAD MANAGER
The Download Manager allows you to choose the format for viewing the data and to choose the data to be viewed.
Using the step-by-step “wizard” format makes it easy and intuitive to complete the download and viewing process.
USING THE STEP-BY-STEP (WIZARD)
First, choose the way data will be processed. The available ways include viewing in table format, viewing in chart format,
exporting data to a file and creation of a report with the desired data.
AEMC® INSTRUMENTS – 99-MAN 100386 v5
54
AEMC INSTRUMENTS
DATA LOGGERS
Next, choose the database folder, where data will be saved.
Next, you must select which Data Logger’s data will be viewed. Selection is done by the logger’s serial number.
AEMC® INSTRUMENTS – 99-MAN 100386 v5
55
AEMC INSTRUMENTS
DATA LOGGERS
Next, the desired time period must be selected.
Lastly, choose which channels must be viewed or exported, as well as the number of decimal places for the
channels.
AEMC® INSTRUMENTS – 99-MAN 100386 v5
56
AEMC INSTRUMENTS
DATA LOGGERS
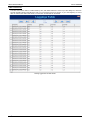
Table Format View
The table view shows data in a table sorted by time, with oldest data first. At the top of the dialog box, there are
several navigation buttons that allow the user to move forward or back one screen, or go to the beginning or end of
data. In order to view data in this format, no more than 16 channels can be viewed.
Viewing logged data in table format
AEMC® INSTRUMENTS – 99-MAN 100386 v5
57
AEMC INSTRUMENTS
DATA LOGGERS
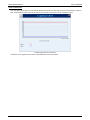
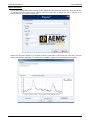
Chart Format View
The chart view shows data in a chart format. Moving the mouse over the chart shows the instantaneous values of
each viewed channel at the bottom of the screen. No more than 16 channels can be viewed at one time.
Viewing logged data in chart format
The button on the upper left corner of the screen allows the chart to be printed.
AEMC® INSTRUMENTS – 99-MAN 100386 v5
58
AEMC INSTRUMENTS
DATA LOGGERS
Data Export
To export selected data, click on the “Export” button. A window will appear where you must select the destination
folder, the file name and the file extension to be exported.
When selecting the “Other Formats” option, a second screen will show up, where it will be possible to choose some
parameters related to the chosen format: RTF, HTML, XML, PDF, CSV, SQL, XLSX or DOCX.
For exporting in “SuperView” or “FieldChart” format, there is a top limit of 16 channels. For exporting in “PDF” or
“RTF” format, there is a top limit of 8 channels
When a successful export is completed, the following window will open.
AEMC® INSTRUMENTS – 99-MAN 100386 v5
59
AEMC INSTRUMENTS
DATA LOGGERS
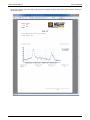
Report Generation
The file name and destination folder must be entered. Additionally, fields that will be used in the report must be filled
in, including report and author names, company name and report title. An image can also be selected to be
presented in the report, such as company logo.
Clicking the “OK” button will bring up a progress bar shown at the bottom of the screen and, when ready, the chart
from the desired period will display. A comment field is available to add text to be included with the final report.
AEMC® INSTRUMENTS – 99-MAN 100386 v5
60
AEMC INSTRUMENTS
DATA LOGGERS
At this point, clicking on the “OK” button will generate and display the report. This report can be printed or saved to a
file for later access.
10/15/2012
03:10
AEMC
AEMC® INSTRUMENTS – 99-MAN 100386 v5
61
AEMC INSTRUMENTS
DATA LOGGERS
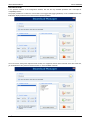
NON STEP-BY-STEP
In the previous versions of the configuration software, this was the only available procedure and it was kept for
compatibility reasons.
The proper procedure is to select the source folder of the logged data (logging database). In the "available downloads"
field will be displayed all devices that have downloaded data available.
You must choose, through the respective serial number, the equipment that has data of interest at this time. After that,
you must define the time period of interest and click on "Show available channels".
AEMC® INSTRUMENTS – 99-MAN 100386 v5
62
AEMC INSTRUMENTS
DATA LOGGERS
Then, select which channels, among those available, are of interest.
Finally, the chosen channels can be viewed in several ways.
Viewing logged data in table format
AEMC® INSTRUMENTS – 99-MAN 100386 v5
63
AEMC INSTRUMENTS
DATA LOGGERS
Viewing logged data in chart format
There is a button on the upper left corner that allows users to print the chart.
To export the selected data, you must click on the “Export” button. After a prior processing, a window will appear where
you must select the destination folder, the file name and the file extension to be exported.
AEMC® INSTRUMENTS – 99-MAN 100386 v5
64
AEMC INSTRUMENTS
DATA LOGGERS
Since configuration software version 1.50, the exporting process was improved, providing more control over the fields
and formats of the exportation. The basic window with the format choice became different:
Whenever choosing the “Other formats” options, a second window pops up, allowing the choice of the type of the file and
many other options.
Upon completion of the export process, a window is displayed showing its success.
AEMC® INSTRUMENTS – 99-MAN 100386 v5
65
AEMC INSTRUMENTS
DATA LOGGERS
PREFERENCES
Using the Preferences screen, you can change the way the software application is started, adapting it to the procedure
that is desired. The configurable options are:
•
Do Nothing: Normal behavior of the software. You will see the initial application screen where you may select what
tasks to perform.
•
Read Configuration: The application will automatically open the connection screen and then execute reading the
parameters configured in the data logger connected.
•
Open Last Configuration: The application will read the last used configuration file and show it in the configuration
screen, without connecting to the logger. If there is no last file, the software will indicate the error and display the
initial screen.
•
Download Logging Data: Will open the screen where you can choose what type of download will be performed.
•
Open Diagnostics Screen: It will open the connection screen, and read from the connected logger.
On this screen you can also change the language that the software will adopt as default.
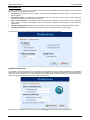
PASSWORD PROTECTION
It is possible to protect the access to the equipment by using passwords. You can register a password for configuration
and another one for data download. First one protects the equipment from undesired changes in its configuration and the
second one does not allow data to be downloaded by unauthorized people. In order to remove the need of a password to
access the equipment, simply leave the new passwords fields blank.
This property is available since firmware version 1.40. Data Logger leaves factory with no passwords set.
AEMC® INSTRUMENTS – 99-MAN 100386 v5
66
AEMC INSTRUMENTS
DATA LOGGERS
COMMAND-LINE OPERATION
The Data Logger Configurator has the ability to be called with “command-line” parameters, which means it can be used
to download and export data by other applications.
It is advisable to create a batch file (.bat) to help organize the desired parameters. Once this batch file is done, it can be
called (executed) from any other software in order to run the desired tasks, which include:
•
Download data from the device.
•
Get data from a folder where data has already been downloaded to.
•
Export downloaded data to a file.
•
Export data from the Data Logger data base to a file.
•
Create a report with logged data.
Some parameters are sent in the command-line, others are read by the INI files of the Configurator. So, it is important
that you perform the desired action with the Configurator at least once before trying to do it by the command-line. It
assures you that the method you are about to use works properly, and it saves the needed parameters in the INI file as
well, so they can be used later.
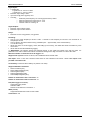
Parameter order is important! Do not try to use them in any order but the one shown here.
Parameter examples are shown inside quotation marks (“). Do not use quotation marks in the real file.
BATCH FILE
The batch file is exactly the same of those ancient DOS batch files. Its name must have no more than 8 characters, a dot
(.) and 3 more for its extension (“bat”).
In the file, we separate the parameters in four parts:
1. PART1 – Action type
2. PART2 – Connection mode
3. PART3 – Action parameters
4. PART4 – Export parameters
All parameters are separated by semicolons.
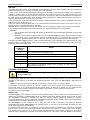
ACTION TYPE
The following actions are allowed:
•
“1” to download and export data.
•
“2” to export data from the data base.
•
“3” to download data without exporting it.
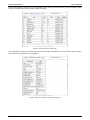
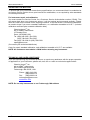
CONNECTION MODE
The connection mode can be:
•
“1” to connect by Ethernet/Modbus TCP. In this case, it will read the port and reconnection time from the
Configurator “INI” file, which means that it should have been done before in the Configurator “normal” operation.
This option requires the IP address as an additional parameter. For software version 1.30 and higher, a port
number must be also included and a time out in milliseconds. Example: “1;10.51.10.78;502;3000;”
•
“2” to connect by the USB cable. This option requires the COM port as an additional parameter. Example: “2;3;”
•
“3” to connect by the RS485/Modbus RTU interface. In this case, it will read the baud rate, parity, stop bits and
timeout from the Configurator “INI” file, which means that it should have been done before in the Configurator
“normal” operation. This option requires the COM port and the Modbus address as additional parameters.
Example: “3;2;7;”
“4” getting data from a folder. This option should be used when data was already downloaded from the Data
Logger through a USB flash drive, FTP or when reading directly from the device SD card (plugged in your
computer). This option requires the folder path as an additional parameter (the folder with the device serial
number must be included). Important: there must be no blank spaces in the path! Example: “4;E:\11097831;”
When the chosen Action is “2” (export only, no download), the parameter “NULL” must be used to indicate that no
connection is needed. Example: “NULL;”
•
AEMC® INSTRUMENTS – 99-MAN 100386 v5
67
AEMC INSTRUMENTS
DATA LOGGERS
ACTION PARAMETERS
These parameters are directly related to the option chosen for the Action. The data base folder is read by the
Configurator INI file, so be sure to set it in the software before trying to use it by the command-line.
•
For Action “1”, we need the following additional parameters (their order should be respected):
1. Data source. It can be: “0” when downloading data from device internal flash, “1” when downloading
from device SD card and “2” when getting data from a folder in the computer/network (connection
mode “4”).
2. Time period. It can be: “0” to download all its data or any other integer “X” number to download data
from the last “X” days.
3. Erase option. It can be: “0” will keep data in the original memory, “1” will erase downloaded data from
the original memory.
4. Serial number. Device serial number should be placed here.
5. Download password (needed for firmware versions 1.40 or higher). Registered password for
downloads should be placed here. A “NULL” string must be used if there no password is used.
•
For Action “2”, we need the following additional parameters (their order should be respected):
1. Serial number. Device serial number should be placed here.
2. Time period. It can be: “0” to download all its data or any other integer “X” number to download data
from the last “X” days.
•
For Action “3”, we need the following additional parameters (their order should be respected):
1. Data source. It can be: “0” when downloading data from device internal flash, “1” when downloading
from device SD card and “2” when getting data from a folder in the computer/network (connection
mode “4”).
2. Time period. It can be: “0” to download all its data or any other integer “X” number to download data
from the last “X” days.
3. Erase option. It can be: “0” will keep data in the original memory, “1” will erase downloaded data from
the original memory.
4. Download password (needed for firmware versions 1.40 or higher). Registered password for
downloads should be placed here. A “NULL” string must be used if there no password is used.
Example: “1;7;0;1234”
•
•
Example: “0;0;1;11097831;1234;”
Example: “11097831;3;”
EXPORT PARAMETERS
These parameters are related to file export. The target folder for the exported files, as well as the Author, Company and
Title fields for the reports are read by the Configurator INI file. Be sure to set it in the software before trying to use it by
the command-line.
•
File name with no extension or blank spaces.
•
File type. Use “1” for PDF, “2” for CSV, “3” for RTF, “4” for XLS, “5” for SuperView, “6” for FieldChart and “7” for
creating a report.
•
Number of decimal places to be used for channels values. Valid values: 0 to 6.
•
Example: “test_report;2;1;”
When the chosen Action is “3” (download only, no export), the parameter “NULL” must be used to indicate that no export
is needed. Example: “NULL;”
AEMC® INSTRUMENTS – 99-MAN 100386 v5
68
AEMC INSTRUMENTS
DATA LOGGERS
DATA LOGGER OPERATION
ANALOG INPUTS
The Data Logger has eight analog input channels. The types of accepted inputs and sensors are the following:
thermocouples J, K, T, E, N, R, S and B; RTDs Pt100 and Pt1000; DC 0 to 50mV; 0 to 60mV; 0 to 20mV; -20 to 20mV; 0
to 5V; 0 to 10V; 4 to 20mA and 0 to 20mA.
The accuracy of these signals is described in the Specifications section. The connection of these signals is described in
the Connections and Installation section.
These inputs incorporate an analog/digital converter (A/D) with 24 bit resolution and accuracy. In the selected scan
interval, all of the analog channels enabled will be read. The ratio between the number of channels enabled and the scan
time is limited up 1000 readings per second. Therefore, one channel can be read 1000 times per second, two channels
at 500 times per second and so on. So, the A/D converter will work faster in order to cope with the desired channels
scan.
The A/D converter has a better signal-noise ratio when operating at low speeds (longer scan intervals), as well as higher
effective resolution and better immunity to noise from the power line. It is recommended to use the longest possible scan
interval for the application to obtain better results from the analog inputs. It is recommended to disable all the channels
that are not necessary, because the increase in the number of enabled channels causes the A/D converter to work faster
in order to cope with the scan rate. Each type of input signal has a valid range of measurement (detailed in the
Specifications section of this manual). However, the logger usually can measure signals that exceed the limits of this
range. How far beyond the valid range will depend on the type of the configured input and may vary from device to
device.
The following table outlines what to expect depending on the signal applied at the input, for each type.
INPUT TYPE
CONDITION OF INPUT SIGNAL
INDICATION
Within the range
Value read from input
Open thermocouple
Value of configured error
Just above the upper limit
Value read from input *
A little below the lower limit
Value read from input *
Far above the upper limit
Value of configured error
Well below the lower limit
Value of configured error
Within the range
Value read from input
Pt100/Pt1000 with one or more wires
disconnected
Value of configured error
Just above the upper limit
Value read from input *
A little below the lower limit
Value read from input *
Far above the upper limit
Value of configured error
Well below the lower limit
Value of configured error
Within the range
Value read from input
Disconnected signal
Value of configured error
Just above the upper limit
Value read from input *
A little below the lower limit
Value read from input *
Far above the upper limit
Value of configured error
Well below the lower limit
Value of configured error
Within the range
Value read from input
Disconnected signal
Value close to 1.8V
Just above the upper limit
Value read from input *
A little below the lower limit
Value read from input *
Far above the upper limit
Value of configured error
Well below the lower limit
Value of configured error
Within the range
Value read from input
Disconnected signal
4 to 20mA: Value of configured error
0 to 20mA: 0mA
Thermocouples:
J, K, T, E, N, R, S and
B
Pt100 and Pt1000
Voltage (mV):
0 to 50mV,
0 to 60mV,
0 to 20mV
and -20 to 20mV
Voltage (V):
0 to 5V
and 0 to 10V
Current (mA):
4 to 20mA
and 0 to 20mA
AEMC® INSTRUMENTS – 99-MAN 100386 v5
69
AEMC INSTRUMENTS
DATA LOGGERS
INPUT TYPE
CONDITION OF INPUT SIGNAL
INDICATION
Just above the upper limit
Value read from input *
A little below the lower limit
4 to 20mA: Value read from input *
0 to 20mA: it is not possible to
decrease besides the inferior limit
Far above the upper limit
Value of configured error
Far below the lower limit
4 to 20mA: Value of configured error
0 to 20mA: it is not possible to
decrease besides the inferior limit
(*) Note: The indication of the analog channel is beyond the limits specified for the selected input type. Accuracy is not guaranteed in this condition.
Table 01 - Measurement and indication of the Data Logger input types
You must choose the digital filter to be used for each channel in use. Valid values between "0" (no filter) and "20"
(maximum filter) are allowed. The higher the value of the filter, the lower the fluctuations read in the input, and the slower
the channel responds to changes in the input signal.
There is also the ability to insert up to 10 points for each channel in order to correct distortions in the reading of these
channels at these points. This is a "custom calibration," feature because it allows you to adjust the indication at the
desired points, resetting the error at these points to zero. Between the inserted points, the adjustment is done linearly,
depending on the entered values. It is important to point out that the insertion of custom calibration points is optional,
available only to those who want to adjust the indication with a local standard. The Data Logger already comes fully
calibrated from the factory.
Whenever you change the input type, make sure that the custom calibration points of the previous input
are deleted!
For each channel, you must assign a unique name (tag), which will be used to reference the channel. You should also
choose the type of input (sensor) that will be connected to that channel. In addition, you can assign the unit for the
measured value: when temperature sensors (Pt100, Pt1000 or thermocouples) are involved you must choose between
Centigrade (°C) and Fahrenheit degrees (°F); when linear sensors (voltage or current) are involved, you can type the
desired unit.
In the case of linear input types, you can choose what the indication range of the channel will be, in other words, what
the channel will indicate when the input is at its minimum value and at maximum value (minimum and maximum values
determine the working range of the Data Logger for the selected input type). Example: selecting the 4-20mA input type
connected to a 0 to 2 bar pressure transmitter, we must choose the minimum value in the configuration of the input "0.0"
and the maximum value "2.0". All the available resolution and accuracy will be contained in the selected range.
When using any equipment on analog inputs that are connected to the power network (for example: thermocouples or
voltage simulator), it is recommended not to use the USB interface for communicating due to the possible occurrence of
noise and offsets in readings due to the influence of the USB cable connection, most likely associated with ground loops.
DIGITAL INPUTS/OUTPUTS
The Data Logger has eight digital channels that can be individually configured as inputs or outputs.
Channels configured as inputs, if enabled, may be logged in memory, used as alarm inputs and as operands of virtual
channels. Channels configured as outputs are "open-drain" type and may be triggered by alarms or triggered via external
Modbus commands.
The digital inputs have two (floating point) values associated with their logic states during the Data Logger configuration.
Depending on the input’s current logic state ("0" is equivalent to a low voltage or a closed contact in the input; "1" is
equivalent to a high voltage or an open contact in the input), this corresponding value is used by the virtual channels,
alarms and logs.
The digital outputs configured to be controlled by the alarms cannot be triggered by external Modbus commands.
Likewise, the outputs configured to be controlled by external Modbus commands cannot be used by the alarms.
The outputs controlled by external commands can be used, for example, as control outputs or alarm outputs of SCADA
software or PLCs.
The digital inputs/outputs terminals are not isolated from the analog inputs terminals!
Do not use analog and digital signals coming from the same voltage source; this will cause the logger to
malfunction.
COUNTING
From firmware version 1.10 on, it is possible to perform pulse counting at the digital inputs of the Data Logger. Counting
32
resolution is 32-bit, which means that each input can count from “0” up to (2 – 1 =) “4294967295”. When the maximum
value is reached, the next counted pulse will cause a roll-over and will reset the counting to zero.
The counting values can be accessed from Modbus registers (see the “Data Logger – Modbus” document) and can also
be copied to a virtual channel, where they can be logged to memory or used by the alarms, for example. When applying
a new configuration in the digital channels, the counting values of all of the digital channels are reset to zero.
AEMC® INSTRUMENTS – 99-MAN 100386 v5
70
AEMC INSTRUMENTS
DATA LOGGERS
Counting values can be zeroed by writing it in the related Modbus registers.
Counting values are persistent and will remain even when Data Logger is turned off. When it is turned on again, counting
continues with the next value.
OUTPUT RELAYS
The Data Logger has two relay type outputs (RL1 and RL2) which can act as Alarms or Digital Outputs.
When configured as Alarms, they act according to the configuration adopted for the alarms. When configured as Digital
Outputs, they are controlled remotely via Modbus commands (via RS485, USB or Ethernet).
RS485 INTERFACE
The Data Logger RS485 interface can be enabled or disabled. When disabled, it does not impact the traffic that may
exist on the data bus. When enabled, it can be configured to operate as a Modbus RTU master or as a slave.
Slave
When operating as a Modbus RTU slave, the logger makes the channel values available to be accessed by the
master on the Modbus network, either being a PLC, a SCADA application or any other device.
Master
When operating as a Modbus RTU master, it allows data from other devices on the bus to be read by the Data
Logger and used in recording, alarms, virtual channels or simply made available via another interface such as
Ethernet, for example. See the "Remote Channel" section for details of how to implement a Modbus RTU network
with the Data Logger in the master role.
It can work as a gateway between a Modbus TCP network and a Modbus RTU network. This way, all Modbus TCP
requests received by Data Logger with an identifier other than “255” will be forwarded to the Modbus RTU network,
assuming that this request was addressed to a slave located in this network. Modbus TCP requests received by a
Data Logger with an identifier equal to “255” will be answered by the Data Logger itself. This feature must be
enabled in the Configurator software.
The RS485 interface can be configured to operate at the following speeds (baud rates): 1200, 2400, 4800, 9600, 19200,
38400, 57600 and 115200. Moreover, it can be configured to operate with one or two stop bits, and in even, odd or
parity.
Further details about the implementation of a Modbus devices network via RS485 can be found in "RS485 & RS422
Basics”, available in the product CD.
D1
D
D+
B
Bidirectional data line.
Terminal 50
D0
D
D-
A
Inverted bidirectional data line.
Terminal 49
Optional connection that improves communication
performance.
Terminal 48
C
GND
AUXILIARY RS485
The Data Logger auxiliary RS485 interface is in the DB9 connector which is located under the Data Logger cover. Its
main function is to provide data to the Data Logger HMI, but from firmware version 1.20 on, it can be used as a generic
interface, acting as a Modbus-RTU slave. Some further details can be seen in “HMI (Human-Machine Interface)” section.
As an interface to the HMI, it must be configured with baud rate 115200 bps, one stop bit and no parity.
As a generic interface, it can be configured to operate in the following baud rates: 1200, 2400, 4800, 9600, 19200,
38400, 57600 e 115200. Besides that, it can be configured to operate with one or two stop bits and with even, odd and
no parity.
D1
D
D+
B
Bidirectional data line.
Pin 4
D0
D
D-
A
Inverted bidirectional data line.
Pin 8
Optional connection that improves communication
performance.
Pin 7
C
GND
REMOTE CHANNELS
Function not available in models “Data Logger – USB, 512k logs, RS485” and “Data Logger – USB,
512k logs, RS485, 24 V”.
The Data Logger can act as a master on a Modbus RTU network (please check the RS485 interface configuration) to be
sure it is able to read up to 64 registers from other devices (Modbus slaves) and use these registers as inputs in the
virtual channels, alarms and recordings. Each one of these registers read from other slaves is called a "remote channel".
AEMC® INSTRUMENTS – 99-MAN 100386 v5
71
AEMC INSTRUMENTS
DATA LOGGERS
The Data Logger starts reading the channels in the same order that they were created at configuration time. It goes on
reading all channels, respecting the times between commands, until it has read them all. When the scan interval has
elapsed, it restarts the readings of all remote channels. In case the channels scan takes longer than the settled scan
interval, it restarts the channels reading immediately.
If the slave takes longer than the configured time out to respond, this will be considered a communication error. In the
same way, response packets with invalid CRCs or with times between bytes greater than those specified in the Modbus
standard will be considered communication errors. In the occurrence of a communication error in a remote channel
reading, it tries again until the configured number of attempts has been reached. If the error persists, the error value
configured for the channel is assumed.
The communication flow can be monitored by the Data Logger Tx and Rx LEDs. Whenever a command is sent to a
slave, the Tx led turns ON. When the slave responds to the command, the Rx led turns ON. This way, during a normal
Data Logger scan of some slaves, Tx and Rx LEDs should flash alternately as many times as the number of the
configured remote channels.
From firmware version 1.50 on, it is possible to assign a number of decimal places directly to the remote channels,
therefore it is not necessary to use virtual channels to view a remote channel which has one or more decimal places. For
example, reading a temperature from a Modbus slave that has a decimal place in integer format, e.g. multiplied by “10”
(25.7ºC is read as 257), it is now possible to read “25.7” directly. In older versions, you had to create a virtual channel
that received this remote channel and divided its value by 10 to restore the original temperature value. This virtual
channel could then be used to replace the remote channel for logging, alarms or simple indication.
VIRTUAL CHANNELS
There are up to 128 virtual channels available in the Data Logger. These channels are the result of logical or
mathematical operations. Depending on the selected operation, one or two operands will be necessary, defining that the
operands are always other channels (analog, digital, remote or even virtual). All operands are in "floating point" format,
which allows a greater precision in the calculations by allowing use of several decimal places.
It is possible to “chain” several operations, causing the outcome of an operation to be the operand of another. If a
channel used as an operand is in an error condition, the resulting virtual channel will also assume an error value.
Constant values can be used through the "Constant" operation, where a value chosen by the user may be assigned to a
virtual channel.
The following operations are available and can be used:
Operation
Number of
Operands
Constant
1
Assigns a value to the virtual channel. Example: VC = 123.67
Addition
2
Receives the addition from two channels. Example: VC = C1 + C2
Subtraction
2
Receives the subtraction from two channels. Example: VC = C1 - C2
Multiplication
2
Receives the multiplication from two channels. Example: VC = C1 * C2
Division
2
Receives the division from two channels. Example: VC = C1 / C2
Logical “And”
2
Receives “0” if at least one of the two channels is zero. It receives “1” if
both channels are different from zero.
Logical “OR”
2
Receives “0” if at least one of the two channels is not zero. It receives
“0” if both channels are equal to zero.
Logical “Exclusive OR”
2
Receives “1” if only one of the two channels is not zero. It receives “0” if
both channels are equal to zero or if both are different from zero.
FloatToFloat
2
Transforms two 16-bit values in a “float”. Typically used when reading
two Modbus registers (remote channels) from other device that, when
combined, represent a floating point value.
Int32ToFloat
2
Transforms an integer 32-bit signaled value in a floating point value.
The allowable range for the integer value (operand) is from -16777215
to 16777215. Values outside this range will truncate.
Square Root
1
Receives the square root from the operand (source channel).
Exponentiation
2
Receives the result from the first high channel to the second channel.
C2
Example: VC = C1 . The value of the exponent is limited to the range
of -120 to 120, and must be an integer (the decimal part shall be
disregarded).
1
Copies the current counting value of the selected digital channel
(operand) to this virtual channel. It uses only 24 bits, which means it
can count up to “16777215” (most significant byte of the counting’s
ignored).
1
At a configurable time rate (in seconds), shows the difference from the
Count
1
Variation
2
AEMC® INSTRUMENTS – 99-MAN 100386 v5
Function
72
AEMC INSTRUMENTS
DATA LOGGERS
current channel value related to the previous time value.In other words,
it has the value of the final time minus the value of the initial time. In
case this operation is being performed in a digital channel, the variation
of its countings will be computed.
Accumulation
2
ByteInv FloatToFloat
ByteInv Int32ToFloat
3
3
1
Receives the accumulated value of the selected channel. At a
configurable time rate (in seconds), gets the current channel value and
sums to the accumulated amount.
2
Transforms two 16-bit values in a “float”. It works just like the
FloatToFloat operation, but each register has its bytes swapped (byte
high ↔ byte low) right before the operation. Useful when the register
read from a slave has a byte order (endianness) which is opposite to
the one expected by Data Logger.
2
Transforms an integer 32-bit signaled value in a floating point value. It
works just like the Int32ToFloat operation, but each register has its
bytes swapped (byte high ↔ byte low) right before the operation. Useful
when the register read from a slave has a byte order (endianness)
which is opposite to the one expected by Data Logger.
(1) Note 1: Available from firmware version 1.10 on.
(2) Note 2: Available from firmware version 1.20 on.
(3) Note 3: Available from firmware version 1.40 on.
When an error occurs on any channel (for example, disconnected sensor in an analog channel), its configured error
value is set to it. If this channel is used as an operand of a virtual channel, its error value will be detected and the
outcome of the virtual channel will be its own configured error value, leading to a propagation of the error values. The
only exception is the operation “Int32ToFloat”, that does not propagate the error of the source channels (operands),
because it is typically used in the conversion of two remote channels in a 32-bit value and, in this case, it would show an
error every time one of the remote channels would have the error value (all values are valid – there is no error value that
can be set outside of the valid range).
Sample of chaining virtual channels in order to obtain more complex formulas
As an example, we will be using the formula for calculating the flow measurement using an orifice plate, which is very
popular in the industrial instrumentation environment. The formula is the following:
Where Q = flow
ρ = flow density
∆P = differential pressure
K = constant that makes the appropriateness of units and dimensions involved
In this case, we will be considering that the differential pressure (∆P) will be read as an analog channel (ChAnalog_1 =
∆P), with the limits configured for measuring the correct unit.
In the Configurator software, we must enter the following virtual channels:
VC1 = K (“constant” operation with the numeric value of K)
VC2 = p (“constant” operation with the numeric value of p)
VC3 = ChAnalog_1 / VC2 ("Division" operation)
VC4 = √VC3 ("square root" operation)
VC5 = VC1 x VC4 ("multiplication" operation)
As a result, VC5 has the flow value of Q.
USB INTERFACE
The Data Logger has two USB interfaces: one USB device, used for the configuration, monitoring and data
downloading, and one USB host, used for data download and firmware updates, if and when necessary.
USB DEVICE
The USB interface device is the preferential interface for the equipment configuration. It is the only interface that can
never be disabled.
To access it, use the USB cable supplied. The "USB" LED turns ON, indicating that the interface is ready for use. On first
access, it may be necessary to install the USB drivers on your computer. If you have to do this, refer to the "USB Driver
Installation" section.
The communication on this interface is Modbus RTU, just like as the slave interface RS485. The same commands and
the same table of registers are available for this interface (refer to the document "Data Logger – Modbus”).
AEMC® INSTRUMENTS – 99-MAN 100386 v5
73
AEMC INSTRUMENTS
DATA LOGGERS
USB HOST
The USB host interface can be used to download the recorded data from either the internal flash memory or the SD Card
(it will download the memory currently configured), via a USB flash drive.
In order to perform the data download with a USB flash drive, this option must have been enabled on the Configurator
software. If enabled, when you connect the USB flash drive in the USB host interface, the "USB" LED should turn ON
indicating that it has been correctly recognized. From then on, the transfer of data to the USB flash drive is started and
the “USB” LED starts to flash quickly. When all data has been transferred, the "USB" LED stops flashing and stays on,
indicating that the USB flash drive can now be removed.
If data download with a USB flash drive has been disabled, nothing will happen when you plug in a USB flash drive in the
USB interface, the LED will not turn on.
There is an option to download all the memory or to download data of a limited number of days. In the second case, you
can still choose if to download the earlier or later data.
Example: When configuring the download of the most recent four-day data, the logger scans the memory and transfers
to the USB flash drive all logging data found from the last four days that actually has some logged data.
Remarks:
• Use a USB flash drive with enough free capacity for all data that must be downloaded (preferably an empty USB
flash drive).
• Depending on the volume of data and the busy rate of the Data Logger processor, the download may require
a long period of time. To optimize data download via USB flash drive, try to download data more frequently
and set the Download Period option for a few days, which will reduce the data volume in each download.
Throughout the Data Logger operation, while not downloading data to the USB flash drive, different types of errors
generate 3 blinks on the status LED. When the USB flash drive is connected for download and an error occurs, it is
indicated as shown in the table below:
ERROR
NUMBER OF
BLINKS
1
Not enough space on the USB flash drive
2
File not found
3
USB flash drive disconnected before the end of the download
4
Writing error in USB flash drive
5
Error in creating the path in the USB flash drive
6
Error opening the download session: there is already an open session
(configuration or download)
ETHERNET INTERFACE
Function not available in models “Data Logger – USB, 512k logs, RS485” and “Data Logger – USB,
512k logs, RS485, 24 V”.
The Data Logger Ethernet interface allows connection to Ethernet 10/100 Mbps networks. There are several services
available for this interface, all enabled and configured individually, which gives the Data Logger a high degree of
versatility.
NOTE: It is always recommended to disable an interface or a service, when it is no longer needed.
For connection to the TCP-IP network, you can set a fixed IP or use DHCP (dynamic host configuration protocol, the
protocol that allows an IP number assigned by the network server). Furthermore, if desired, you can enable the DNS
service, where in some services, instead of the IP number of the servers, you can configure your name (URL).
The following services are available:
MODBUS-TCP
The Data Logger can be enabled to communicate through Modbus-TCP protocol, widely used in SCADA systems. By
enabling this functionality, the Data Logger will act as a Modbus-TCP server, allowing channel values, as well as status
and configuration information, to be read and written by external software applications. Enabling the gateway
functionality (assuming the device is configured as a Modbus-RTU/RS485 master), the Data Logger can forward Modbus
requests to slaves connected to the Modbus-RTU network.
The Data Logger must be accessed by the ID “255”. Any other ID will be assumed to be targeting a ModbusRTU/RS485 slave through Data Logger by the gateway function. In this case, if this functionality is enabled, the data
packet will be forwarded to the RS485 bus.
The gateway functionality works as a multiplexer, receiving all the simultaneous Modbus-TCP connections and putting
them in a line to be sent to the Modbus-RTU network, one at a time. Due to this line, in a worst-case scenario, ModbusTCP clients timeout should be set as long or longer than Modbus-RTU master timeout (configured in the Remote
Channels screen) multiplied by the number of the active Modbus-TCP connections. If the client Modbus-TCP timeout is
AEMC® INSTRUMENTS – 99-MAN 100386 v5
74
AEMC INSTRUMENTS
DATA LOGGERS
shorter than that value, a timeout must occur instead of an exception code “0Bh” (Gateway Target Device Failed to
Respond) in a missing slave situation.
SENDING E-MAILS - SMTP
The Data Logger can be configured to send e-mails to multiple receivers upon the occurrence of alarms or events. The
receivers must be entered in the data logger through the logger configuration. In the alarm configuration, you must select
which receivers should be notified via e-mail on the occurrence of each alarm or event.
For this service, you must configure an e-mail server that will be accessed at the time as the alarm occurrence. On this
server, there must be a valid e-mail account for the Data Logger to login.
NOTE: SSL connections are not supported.
In the e-mail message body there are two parts: a constant part that is common to all messages, and a variable part that
is dependent on the alarm or event that originated the message. The constant part is defined by the user, as well as the
message subject. The variable part contains the Data Logger tag, its serial number and a string describing the alarm
condition or event that caused the message.
Fig. 22 - Example of alarm message
IMPORTANT: E-mails do not have delivery or reading guarantees. Thus, in alarm cases, it is desirable to use other ways
to report alarm or events.
WEB PAGES - HTTP
Data Logger has the capacity to serve web pages. It has three unchangeable and always available pages with basic
information about channels, configuration, status and alarms. Besides that, from firmware version 1.30 on, is is capable
of serving custom web pages, which are hosted in the SD card.
UNCHANGEABLE PAGES
Data Logger has the capacity to serve three unchangeable web pages: one that has basic information about the
enabled channels, one that has configuration information and equipment status and one with configured alarms
information. There are two possible formats for these pages: HTML or XML. These pages include simple HTML code and
can be viewed with most popular browsers. They are reloaded automatically at a configurable rate. Pages in XML format
have the same information as that found in the related HTML pages, in a standardized format (format descriptions are
available in the product CD), which allows the external usage of this data, increasing application flexibility (a typical
application is the generation of a customized HTML page with data read from the XML page). There is no automatic
reload of XML pages.
In order to ease information access, it is possible to use links to get directly into the desired webpage and to the most
interesting information, as the following table shows.
Web Pages
HTML
XML
Channels
DATA LOGGER_IP\channels.html
DATA LOGGER_IP\channels.xml
Configuration and Status
DATA LOGGER_IP\status.html
DATA LOGGER_IP\status.xml
Alarms
DATA LOGGER_IP\alarms.html
DATA LOGGER_IP\alarms.xml
If only the IP address of the logger is typed in the browser, the channels HTTP page will be loaded.
Pages in XML format and the links with direct access to Data Logger pages are available only from
firmware version 1.10 on.
AEMC® INSTRUMENTS – 99-MAN 100386 v5
75
AEMC INSTRUMENTS
DATA LOGGERS
The channel information page reports, for each enabled channel, its tag, its current value, its unit, its type (analog, digital,
remote or virtual) and also if this channel is enabled for logging.
Fig. 23 - Channels information HTML page
The configuration and status information page has the current status of parameters, as well as serial number, firmware
version and other information from the equipment.
Fig. 24 - Configuration and status information HTML page
AEMC® INSTRUMENTS – 99-MAN 100386 v5
76
AEMC INSTRUMENTS
DATA LOGGERS
The Alarms information page shows, for each enabled alarm, its index, the related channel, the condition, the set point,
hysteresis, the unit (if configured) and if the alarm is activated (ON) or not (OFF).
Fig. 25 - Alarms information HTML page
CUSTOM PAGES
The Data Logger can serve web pages that are hosted in its SD card, since they are located in the “webserv” folder.
These pages can use much information directly from the Data Logger, like channels values and units, clock time and
serial number.
Working conditions
•
All needed files must be placed inside the “webserv” folder in the SD card.
•
Data Logger works in the “8.3” file name format, so no file should have more than 8 characters (plus the 3 of
the extension).
•
Files with markers that should be replaced by the Data Logger information need their names to start with the
“_” character. Otherwise, these markers will not be replaced. Files which are not started with this “_” will not be
parsed and will be served faster.
•
Subfolders are accepted, though the maximum path length must be limited to 60 characters top (including the
“webserv” folder and the “/” characters).
•
If a valid marker is used with a channel or alarm that does not exist (example: analog channel 130), an
“ERROR” message is returned.
•
If a valid marker is used with a channel or alarm that is disabled, a “DISABLED” message is returned.
•
Whenever you want to display the character “%”, it is advisable to use it doubled “%%”. It will assure that it will
not be misinterpreted with a marker start.
MARKERS
A lot of information from Data Logger is available to be inserted in the custom web pages. It is done by the use of
alphanumeric markers that, when found in the file, are replaced by their related value. Again, this will only happen in the
files whose names start with a “_” (example: “_data.htm”).
These are all available markers:
Marker
Replacement information
%ANALOG___001.T%
Analog channel 1 tag
%ANALOG___001.V%
Analog channel 1 current value
%ANALOG___001.U%
Analog channel 1 unit
%ANALOG___001.D%
Analog channel 1 diagnostics information value:
Bit 0: open sensor
Bit 1: shorted Pt100/Pt1000
Bit 2: out of limits
Bit 3: Pt100/Pt1000 open cable
...
...
%ANALOG___008.T%
Analog channel 8 tag
%ANALOG___008.V%
Analog channel 8 current value
%ANALOG___008.U%
Analog channel 8 unit
AEMC® INSTRUMENTS – 99-MAN 100386 v5
77
AEMC INSTRUMENTS
DATA LOGGERS
%ANALOG___008.D%
Analog channel 8 diagnostics information value:
Bit 0: open sensor
Bit 1: shorted Pt100/Pt1000
Bit 2: out of limits
Bit 3: Pt100/Pt1000 open cable
%DIGITAL__001.T%
Digital channel 1 tag
%DIGITAL__001.V%
Digital channel 1 current value
%DIGITAL__001.U%
Digital channel 1 unit
...
...
%DIGITAL__008.T%
Digital channel 8 tag
%DIGITAL__008.V%
Digital channel 8 current value
%DIGITAL__008.U%
Digital channel 8 unit
%REMOTE___001.T%
Remote channel 1 tag
%REMOTE___001.V%
Remote channel 1 current value
%REMOTE___001.U%
Remote channel 1 unit
...
...
%REMOTE___064.T%
Remote channel 64 tag
%REMOTE___064.V%
Remote channel 64 current value
%REMOTE___064.U%
Remote channel 64 unit
%VIRTUAL__001.T%
Virtual channel 1 tag
%VIRTUAL__001.V%
Virtual channel 1 current value
%VIRTUAL__001.U%
Virtual channel 1 unit
...
...
%VIRTUAL__128.T%
Virtual channel 128 tag
%VIRTUAL__128.V%
Virtual channel 128 current value
%VIRTUAL__128.U%
Virtual channel 128 unit
%ALARM__001.STS%
Alarm 1 tag
%ALARM__001.SPT%
Alarm 1 status: “ON” (active alarm) or “OFF” (not active)
%ALARM__001.CND%
Alarm 1 configured setpoint
%ALARM__001.UNI%
Alarm 1 configured condition: “>”, “>=”, “<”, “<=”, “==” or “!=”
%ALARM__001.HYS%
Alarm 1 configured unit
...
...
%ALARM__032.TAG%
Alarm 32 tag
%ALARM__032.STS%
Alarm 32 status: “ON” (active alarm) or “OFF” (not active)
%ALARM__032.SPT%
Alarm 32 configured setpoint
%ALARM__032.CND%
Alarm 32 configured condition: “>”, “>=”, “<”, “<=”, “==” or “!=”
%ALARM__032.UNI%
Alarm 32 configured unit
%ALARM__032.HYS%
Alarm 32 configured hysteresis
%INFO.IN.FLTAG_%
Data Logger tag
%INFO.IN.SERIAL%
Serial Number
%INFO.IN.FWVER_%
Firmware version
%INFO.IN.MBMODE%
Main RS485 interface Modbus mode:
"Disabled", "Master" ou "Slave"
%INFO.IN.MBADDR%
Main RS485 interface Modbus address
%INFO.IN.D_TYPE%
Selected logging memory: “Flash” or “SD Card”
%INFO.IN.START_%
Start logging mode selected:
"Immediately", "Date/Time", "Alarm" ou "Via Modbus Only"
%INFO.IN.STOP__%
Stop logging mode selected:
"Full Memory", "Circular Memory", "Date/Time" ou "Alarm"
%INFO.IN.FDRVIN%
USB flash drive connection status:
“Yes” (connected) or “No” (disconnected)
AEMC® INSTRUMENTS – 99-MAN 100386 v5
78
AEMC INSTRUMENTS
DATA LOGGERS
%INFO.IN.SDSIZE%
SD card memory capacity, in kbytes
%INFO.IN.SDFREE%
SD card available free memory, in kbytes
%INFO.IN.INSIZE%
Internal flash memory capacity, in bytes
%INFO.IN.INFREE%
Internal flash available free memory, in bytes
%INFO.IN.ANLSCN%
Analog channels scan interval, in ms
%INFO.IN.LOGPER%
Logging interval, in ms
%INFO.IN.LOGSTS%
Current logging status: “Logging” or “Stopped”
%INFO.IN.HMICON%
HMI connection status: “0” (no HMI) or “1” (HMI connected)
%INFO.RTC.YEAR_%
Internal calendar year
%INFO.RTC.MONTH%
Internal calendar month
%INFO.RTC.DAY__%
Internal calendar day
%INFO.RTC.HOUR_%
Internal clock hour
%INFO.RTC.MIN__%
Internal clock minute
%INFO.RTC.SEC__%
Internal clock second
FILE TRANSFER - FTP
The Data Logger provides both FTP client and server for the transferring of data files.
Client
FTP client is used to make programmed downloads of logging data. It can be done once a day, in a determined time, or
many times a day, in a determined time interval (this option requires firmware version 1.50 or higher). In order to use,
simply configure the username and password to be used in server login and set the daily download start time or the
interval between them, depending if the “periodic” download (more than once a day) option is enabled. In case of
downloading at periodic intervals, start download moments are always referred to midnight (example: 4-hour interval will
turn out to downloads at 00:00, 04:00, 08:00, 12:00, 16:00 and 20:00). If, at the time configured for starting the download,
a problem with the connection arises, the Data Logger will retry for 30 minutes.
From firmware version 1.40 on, you can download data directly in the CSV (comma-separated values) format. When
selecting this option for the client FTP download, the files created in the download folder will be in the CSV format
instead of the binary (standard) format.
The created CSV file will have the equipment tag in its first row. In the second row, there will be the column names. From
the third row on, there are the dates, times and channel values for eack log. If the logging rate was configured in
milliseconds, this extra column will be placed before the values columns. All fields are between quotation marks (“) and
the field separator used is the semi-colon (;).
Due to the extra processing to transform the files to the CSV format, this option may cause a delay in the download.
Note: Due to a limited size of the Data Logger internal buffer, it is recommended that FTP server welcome message
should have sentences no longer than 60 characters (each sentence must necessarily be finished with “car return”
and “new line” characters, or “0Dh” and “0Ah” in hexadecimal).
Server
To use FTP server on the Data Logger, simply enable this feature in the Configurator application and set up a username
and password. In this way, the user will have access to the data files for read-only purposes. The standard used for the
FTP is the "Unix" type.
Note: There is no support for simultaneous connections. Therefore, the used client will have to be configured to just
use one connection. In addition, the client must be configured to use the passive mode.
NETWORK MANAGEMENT - SNMP
All of the enabled channels for reading, as well as several status information, have their values available via SNMP
protocol (read-only, there is no writing implemented on the equipment via SNMP).
Standard MIBs are not available in Data Logger. Available SNMP information is listed below, besides the
following OIDs of the “System” group:
•
sysDescr
•
sysObjectID
•
sysUpTime
The available MIB is described below. A MIB file is available in the product CD. The branch “Enterprise” of MIB is used,
where the “Enterprise number” is 34590. The sub-branch assigned to Data Logger is 1. Thus, all information will have
the OID starting in 1.3.6.1.4.1.34590.1.
The available OIDs:
•
1.3.6.1 .4.1.34590.1.0 = Device tag. [OCTET STRING]
•
1.3.6.1 .4.1.34590.1.1 = Device serial number. [OCTET STRING]
•
1.3.6.1.4.1.34590.1.2 = Firmware version. [OCTET STRING]
AEMC® INSTRUMENTS – 99-MAN 100386 v5
79
AEMC INSTRUMENTS
DATA LOGGERS
•
1.3.6.1 .4.1.34590.1.3 = Device date year. [INTEGER]
•
1.3.6.1.4.1.34590.1.4 = Device date month. [INTEGER]
•
1.3.6.1.4.1.34590.1.5 = Device date day. [INTEGER]
•
1.3.6.1.4.1.34590.1.6 = Device time hour. [INTEGER]
•
1.3.6.1.4.1.34590.1.7 = Device time minute. [INTEGER]
•
1.3.6.1.4.1.34590.1.8 = Device time second. [INTEGER]
•
1.3.6.1.4.1.34590.1.9 = RS485 interface enabling and configuration (0 = disabled; 1 = master; 2 = slave).
[INTEGER]
•
1.3.6.1.4.1.34590.1.10 = Selected logging memory (0 = internal memory; 1 = SD card). [INTEGER]
•
1.3.6.1.4.1.34590.1.11 = Logging status (0 = logging stopped; 1 = logging in progress). [INTEGER]
•
1.3.6.1.4.1.34590.1.12 = Available memory for logging in internal memory, in bytes. [INTEGER]
•
1.3.6.1.4.1.34590.1.13 = Presence of SD card (0 = no card; 1 = card present). [INTEGER]
•
1.3.6.1.4.1.34590.1.14 = Available memory for logging in the SD card, in kilobytes. [INTEGER]
•
1.3.6.1.4.1.34590.1.15 = Presence of USB flash drive (0 = no USB flash drive; 1 = USB flash drive present).
[INTEGER]
•
1.3.6.1.4.1.34590.1.16 = Presence of the DISPLAY (0 = no DISPLAY; 1 = DISPLAY present). [INTEGER]
•
1.3.6.1.4.1.34590.1.17 = Total number of enabled channels. [INTEGER]
•
1.3.6.1.4.1.34590.1.18.X.Y
o
o
X = Sequential channel number, starting with analog channels and followed by the digital, remote and
virtual ones:
X = 1: First channel enabled.
X = 2: Second channel enabled.
etc.
Y = Channel information:
Y = 1: Channel tag. [OCTET STRING]
Y = 2: Channel read value. Wherever appropriate (virtual and analog channels, for example),
it will be multiplied by the number of decimal places configured by the user. [INTEGER]
Y = 3: Channel unit. [OCTET STRING]
Y = 4: Channel type indication (analog, digital, etc.), and the channel number related to this
type. Examples: ANALOG_001, DIGITAL_005, REMOTE_014, VIRTUAL_103. [OCTET
STRING]
Y = 5: Channel error indication (0 = channel ok; 1 = channel in error state). [INTEGER]
Y = 6: Indicates that the channel is enabled (value = 1) or disabled (value = 0) for logging.
[INTEGER]
Traps
Traps will be generated if enabled and selected in the alarms in order to indicate their occurrence. The address and
destination port are configurable.
They have the following fields:
•
Community: “Data Logger”.
•
OID: .1.3.6.1.4.1.34590.1.100 (where 34590 is the "enterprise number" used and the 1 following is the branch of
Data Logger)
•
General number: 6 (indicating that the trap is “enterprise-specific").
•
Specific number: Index for the occurred alarm (zero - based).
•
Trap value
o OID: .1.3.6.1.4.1.34590.1.100.XX, where XX is the index of the occurred alarm.
o Type: OCTET STRING.
o Value: String indicating the occurred alarm in the format: TAG + CONDITION + VALUE. Example:
“Channel_1 > 129.43”
AEMC® INSTRUMENTS – 99-MAN 100386 v5
80
AEMC INSTRUMENTS
DATA LOGGERS
DATA LOGGING AND DOWNLOAD
Data logging can be done in the internal memory of the Data Logger or, optionally in a SD card (not included), which
must be inserted into the proper compartment behind the cover (or DISPLAY). The internal memory capacity is up to
532,480 measurements, SD card logging capability will depend on its storage capacity (size), assuming that the card is
empty.
NOTE: Poor quality SD cards can compromise data logging, causing missed recording periods at higher storage
rates or become more susceptible to data write corruption. Therefore, it is always recommended you use high-speed
(class 4 or higher) SD cards from established brands.
SD Card logging not available in models “FieldLogger – USB, 512k logs, RS485” and “FieldLogger –
USB, 512k logs, RS485, 24 V”.
Any channel (analog, digital, remote and virtual ones) can be written into the memory. Logging is periodic and has its
storage (rate) set through the Configurator software. After each time interval, the current values of the configured
channel are logged in the selected memory.
There are several ways to start and stop the recording, and many of them can be freely combined. During the recording,
all the selected channels will be recorded in the requested memory (internal flash or SD card) based on the interval
configured.
Depending on the start and stop modes selected, there may be "snippets" of data in memory, and therefore, periods
without any data recorded. This is fully compatible with the data logger and is not a problem.
The start modes available are:
• Immediate start: Recording will start right after the data logger reconfiguration.
• By date/time: Recording will be started at the selected date/time.
• By alarm: When the alarm condition is met (alarm active), recording will be started.
• Only by Modbus commands: Recording will start only when a specific command is sent to the Modbus
equipment.
The stop modes available are the following:
• Full memory: The recording will be stopped only when the selected memory (internal flash or SD card) is full.
• Never stop (wrap around): Recording will be continually stored in the selected memory. When the memory is
full, the oldest data will be erased so that the most recent data may be saved.
• By date/time: Recording will start at the selected date/time.
• By alarm: If the recording started by the same alarm, when the alarm condition is no longer met (alarm inactive),
the recording stops. If the recording was started for some other reason, as soon as the alarm condition takes
place (alarm active), the recording will stop.
• By Modbus command: A specific Modbus command can be sent to stop the recording. This command is
independent of the selected stop mode and has priority over it.
The following possibilities to start and stop recording are available:
Logging start
Recording stop
Immediate
Date/Time
Alarm
Only Modbus
command
Full memory
Yes
Yes
Yes
Yes
Wrap around
Yes
Yes
No
Yes
Date/Time
Yes
Yes
No
No
Alarm
Yes
Yes
Yes
No
Here are the operation details for each of these modes:
• Immediate start and stop when memory gets full:
As soon as the new configuration is applied, recording is started. The Data Logger continues recording until the
memory (internal or SD card) is full. In the case of a power failure, recording will be interrupted and begins again
as soon as power is restored.
• Immediate start and never stops (wrap around):
As soon as the new configuration is applied, recording is started. The Data Logger goes on recording forever,
overwriting the oldest data as soon as the memory is full. In the case of a power failure, recording is interrupted,
and begins again as soon as power is restored.
• Immediate start and stop by date/time:
As soon as the new configuration is applied, recording is started. The Data Logger continues recording until the
set date and time. In the case of a power failure, recording is interrupted and begins again as soon as power is
restored. If the memory is full before the set date/time, the Data Logger will stop recording.
• Immediate start and stop by alarm:
As soon as the new configuration is applied, recording is started. The Data Logger goes on recording until an
AEMC® INSTRUMENTS – 99-MAN 100386 v5
81
AEMC INSTRUMENTS
DATA LOGGERS
alarm condition takes place (configured alarm for recording stop). When the alarm condition stops, recording
continues. In the case of a power failure, recording is interrupted, and begins again as soon as power is restored.
When the memory is full, the Data Logger will stop recording.
• Start by date/time and stop when memory is full:
Once the date/time set for recording start has occurred, recording will start. The Data Logger goes on recording
until the memory (internal or SD card) is full. In the case of a power failure, recording is interrupted, and begins
again as soon as power is restored. When memory is full, the Data Logger will stop recording.
• Start by date/time and never stops (wrap around):
Once the date/time set for recording start has arrived, the recording will start. The Data Logger will continue to
record, overwriting oldest data as soon as the memory is full. In the case of a power failure, recording is
interrupted and begins again as soon as power is restored.
• Start and stop by date/time:
Once the date/time set for recording start has arrived, recording will start. The Data Logger goes on recording
until the stop date and time occurs. In the case of a power failure, recording is interrupted and begins again as
soon as power is restored (if the stop date/time has not yet occurred). If the memory is full before the set stop
date/time, the Data Logger will stop recording.
• Start by date/time and stop by alarm:
Once the date/time set for the recording start has occurred, recording will begin. The Data Logger goes on
recording until the configured alarm condition takes place. When the alarm condition stops, recording continues.
In the case of a power failure, recording is interrupted and begins again as soon as power is restored.
• Start by alarm and stop when memory is full:
When an alarm condition takes place, recording begins (it will not start if the alarm condition is already active. It
will wait for the next alarm occurrence to begin recording.) The Data Logger continues recording until the
memory is full (internal or SD card). In the case of a power failure, recording is interrupted and begins again as
soon as power is restored.
• Start and stop by alarm:
When an alarm condition occurs, recording begins (it will not start if the alarm condition is already active. It will
wait for the next alarm occurrence to begin recording). The Data Logger continues recording while this alarm
condition is in progress. When the alarm condition stops, recording stops.
• Start only by Modbus command and stop when memory is full:
When the Modbus command (details about this command can be found in the document "Data Logger – Modbus”
and in the chapter "Configuration and Download Software", "Diagnostics" section) to start recording is sent to the
data logger, the recording will start. The Data Logger continues recording until the memory is full (internal or SD
card).
• Start only by Modbus command and never stops (wrap around memory):
When the Modbus command (details about this command can be found in the document "Data Logger – Modbus”
and in the chapter "Configuration and Download Software", "Diagnostics" section) to start recording is sent to the
data logger, the recording will start. The Data Logger continues recording forever, overwriting the oldest data as
soon as the memory is full.
Modbus commands to start and stop recording, when enabled, can be sent at any time and has precedence
over the configured start and stop modes. In this way, if a Modbus command to start recording is sent to the
data logger, recording will start, no matter the state of the data loggers’ configured mode (the only exception
is a configured mode different from "wrap around memory" when the memory is already full). Similarly,
when sending a Modbus command to stop recording, it will stop regardless of the mode configured for start
and stop. If a stop command has been sent and then there is a start command, per the configured mode,
recording will not occur because the command has higher priority than the modes.
The sent command persists even after a power outage. When sending a new recording configuration,
however, the previously sent commands are "over written".
When recording is on the SD card, a folder is generated for the purpose of organizing the recorded data and to simplify
access for the software access to the data. The following figure shows an example of this structure:
In the root folder a subfolder is created using the serial number of the data logger as its name. Inside this folder,
subordinate folders are set up with the year and month in which the logging began used as the folder name. Inside of the
year-months folders, other folders are generated whose names are the days in which the recording started. The data
files are stored in these folders and their names are constructed by the information related to hour, minute, second and
hundredths of second of the first record in the file, followed by the extension "fl". For example, the file
/00000002/201210/01/18243516.fl was generated by a Data Logger with the serial number 00000002 on October 01,
AEMC® INSTRUMENTS – 99-MAN 100386 v5
82
AEMC INSTRUMENTS
DATA LOGGERS
2012, and the first record contained in this file was recorded on this day at 18 hours, 24 minutes, 35 seconds and 16
hundredths.
The files generated by the registration process are composed of a header followed by periodic data blocks and
timestamps (time markers). The header carries information relevant to the record from the file that is essential for the
correct interpretation of its data. The data block stores values for each channel that is being recorded, in floating point
format (IEEE 754) with simple precision. Each record occupies 4 bytes. The timestamps are used as time reference to
identify when the channels were recorded. Periodic timestamps serve to ensure the integrity of the recording in time,
even in the event of a power failure or fault in the SD card.
When recording to internal memory, the file format is exactly the same as when it is written on the SD card. However,
because of the larger available memory, all data will be contained in one file.
The internal flash memory has approximately 2M bytes that will hold 512k (512000) records. The exact number depends on
the enabled channels, number for recordings and on the storage interval. Storage intervals equal or longer than 30 seconds
per record, requires extra data to indicate the time when the record happened (timestamp), which increases memory
consumption and makes the total recording capacity decrease. Therefore, the worst possible scenario is logging only one
channel on slow (longer than 30 s) intervals.
Data download consists of copying the data from the internal memory of the Data Logger or from the SD card to a
computer. When using the configuration software supplied, the step-by-step “wizard” instructions simplify the process. When
downloaded using a USB flash drive, it is also simple and automatic. When performed manually, via an FTP client, for
example, you must ensure that the directory structure is kept, otherwise an error may occur in the interpretation of the data
download.
It is not possible to download data through different interfaces at the same time. If you start a download through the
Ethernet interface (FTP, for example) and another user tries to download via USB flash drive, this second access will not
be allowed. You must wait until the first download has been terminated.
Depending on the amount of data stored, mainly when using high-capacity SD cards, the download process can take
hours. In these cases, prepare to make the download through faster interfaces and, perhaps, in evening hours.
The simultaneous data download while recording is based on the assumption that the download rate is faster than the
recording rate. This is particularly important when using the wrap around recording mode, because otherwise, you could
not download all the data (the recording, being faster, might eventually turn around, reaching and surpassing the
download, which would lead to data inconsistencies). In this case, whenever wrap around memory is used with high
storage rates, you should use a faster interface for download.
ALARMS
32 alarms are available in each Data Logger. Each alarm requires you to choose a channel, a condition, a set point and
hysteresis. When the alarm condition is met (example: Channel_1 > 45.0 º C), an event is generated for which different
actions can be associated. For each selected channel, its current value is used in the comparison. In the case of digital
channels, use the values associated with the two logical states. When one channel is in error, the configured error value
will be used in the alarm. The value of the channel to be used will always be the floating point value.
The available conditions are:
• Greater than (>): Alarm condition is met when the selected channel is greater than the set point.
• Greater than or equal (>=): Alarm condition is met when the selected channel is greater or equal to the set point.
• Less than (<): Alarm condition is met when the selected channel is less than the set point.
• Less than or equal (<=): Alarm condition is met when the selected channel is less than or equal to the set point.
• Equal (==): Alarm condition is met when the selected channel is equal to the set point. With this condition,
hysteresis is not effective and should be maintained at "0.0". Analog channels can rarely have a value exactly
equal to the set point value, so you should avoid this condition because it will be an alarm condition that might
never be satisfied.
• Different (!=): This alarm condition is met when the selected channel differs from the set point. With this
condition, hysteresis should be maintained at "0.0".
• Analog channels can rarely have a value exactly equal to the set point value, so you should avoid this condition
because it will be an alarm condition that might never be satisfied.
Available actions are:
-
Activating the relays (they must be configured to "activation by alarm" using the Configuration software).
Activating the digital outputs (they be configured to "activation by alarm" using the Configuration software).
• Recording start: when the alarm condition is reached, recording starts if not already recording.
• Recording stops: when the alarm condition is reached, recording stops if not already stopped.
• Recording start and stop: records while the alarm condition exists.
• Sending e-mails: allows sending an e-mail and reporting the alarm condition to up to 10 receivers (they must
have been included in the receivers list of the data logger).
• Sending SNMP traps: sends a trap to the configured server with a number regarding the index of the alarm.
Sending e-mails depends on the availability of TCP connections of the Data Logger (there is a limit of simultaneous
connections, see the Specifications chapter). Sending traps depends on the availability of UDP connections in the Data
Logger (it has a limit of simultaneous connections, see the Specifications chapter).
AEMC® INSTRUMENTS – 99-MAN 100386 v5
83
AEMC INSTRUMENTS
DATA LOGGERS
Only one alarm can start a recording, and only one alarm can stop it. When you configure the start and/or stop of the
recording by alarms, there is no option of “wrap around memory”, recording will terminate as soon as memory is full.
The alarm condition must last at least 250 ms in order to ensure that it is detected. Also the output of the alarm condition
must last at least 250 ms in order to guarantee that it is detected. Note that the analog channels can have a delay in the
measurement of the true input value, depending on the sensor type, on intervals between readings and the configured
filter, among others. The remote channels, in turn, depend directly on the set storage interval. Thus, these types of
channels incur an additional latency in the detection of the alarm condition.
During power up of the Data Logger, there are no reliable channel values. In case of the analog and remote channels,
you should wait for the first scan to be completed for valid values to be available. Alarms that use these channels may
take a while before they are ready to compare with the configured set point. When using remote channels, a complete
scan may take several seconds.
AEMC® INSTRUMENTS – 99-MAN 100386 v5
84
AEMC INSTRUMENTS
DATA LOGGERS
DATA COMMUNICATION
The Data Logger has several communication interfaces. Some can be used as Modbus slaves:
•
RS485, acting as a slave on the Modbus RTU protocol.
•
USB device, acting as a slave on the Modbus RTU protocol.
• Ethernet, acting as a server in the Modbus TCP protocol.
All Data Logger configurations, as well as reading the inputs, are accomplished via Modbus protocol.
You can find all the information needed to read data from the input channels without using the Configuration software in
the document "Data Logger - Modbus.pdf" on the product CD. To ensure proper configuration and data download of,
always use the Configuration software. After configuring the equipment, data on the inputs and/or outputs can be
accessed by any other software capable of Modbus RTU or Modbus TCP communication.
AEMC® INSTRUMENTS – 99-MAN 100386 v5
85
AEMC INSTRUMENTS
DATA LOGGERS
DISPLAY (HUMAN-MACHINE INTERFACE)
The DISPLAY (Human-Machine Interface) is available as an accessory to the Model DL-1080 and is standard on the
Model DL-1081. Several features are available with this display, such as enabled channel monitoring, viewing channels
in chart mode, alarms monitoring, status checking and configuration of some basic Data Logger operation parameters.
The DISPLAY is attached to the Data Logger through a DB9 connector located under the cover of the Model DL-1080.
Check the Attaching and Detaching the DISPLAY section to see how the DISPLAY is connected to the Data Logger.
Both power and serial communication go through the DB9 connector. It is also possible to use the DISPLAY remotely,
attaching it to the Data Logger through a serial extension cable. The communication between DISPLAY and the Data
Logger is accomplished using RS485 at a baud rate of 115200 bps. This limits the DISPLAY operating distance. The
voltage drop allowed in the power cables (both positive and negative leads summed) must be no more than 0.4V.
Considering a current consumption of 80mA, the maximum cable resistance can be 5Ω. For some common cables, the
DISPLAY’s maximum operation distance is shown in Table 02.
Gauge
24 AWG
22 AWG
20 AWG
Section
2
0.21mm
2
0.33mm
2
0.52mm
Maximum Length
29m
47m
75m
Table 02 – Wire resistance
Figure 27 below shows the pin-out needed to build an extension cable to the DISPLAY.
Figure 27 – Building an extension cable
PIN
SIGNAL
DESCRIPTION
1
-
-
2
+5 V
DISPLAY power input: +5 VDC
3
-
-
4
B / D1 / D+ / D
RS485 Tx/Rx positive data
5
-
-
6
-
-
7
GND
DISPLAY power input: ground
8
A / D0 / D- / D\
RS485 Tx/Rx negative data
9
-
-
Table 03 – Pin-out for building the DB9 connectors
AEMC® INSTRUMENTS – 99-MAN 100386 v5
86
AEMC INSTRUMENTS
DATA LOGGERS
The DISPLAY screen is divided into three sections: top bar, main area and bottom bar.
The top bar (A) shows the Data Logger logo and the name of the current screen.
The main area (B) shows the information associated with that screen.
The bottom bar (C) shows alarms, download progress and serial communication indication whenever necessary.
The bottom bar has the following information:
Figure 29 – DISPLAY bottom bar
• Alarm events (1): Shows that one or more alarms are active. In order to check which alarms are active, go to the
Alarms screen.
• Download progress (2): When plugging a USB flash drive to download the data, there is a percentage indication
of the download completed. If downloading data from internal flash memory, it shows the percentage of the total
memory already downloaded. If downloading from the SD card, it shows the percentage of the current file being
downloaded.
• Communication in progress (3): Informs that there is communication between the DISPLAY and the Data
Logger. Typically, this flag will be on most of the time, varying from screen to screen. If this flag stays off and the
DISPLAY stops updating, there most likely is a communication problem between the DISPLAY and the Data
Logger.
Interfacing with this DISPLAY is accomplished using the navigation buttons, which allow you to move between all the
available screens and select and edit parameters. The following figure shows the keys and their functions.
Not all characters can be viewed on the DISPLAY. Limited characters for tags and units are recommended.
Navigation between the screens is accomplished through keys RIGHT and LEFT. There are six different screens, each
one with specific functionality, as follows:
AEMC® INSTRUMENTS – 99-MAN 100386 v5
87
AEMC INSTRUMENTS
DATA LOGGERS
“FAVORITES” SCREEN
This screen shows a six-position grid where you can assign a channel to be displayed in each position. Every enabled
channel in the Data Logger is available for assignment, this is accomplished using UP and DOWN keys to select the
desired position in the grid and ENTER to open a list of the available channels. Next, use the UP and DOWN keys again
to find the channel you want to display and ENTER to select it.
“CHART” SCREEN
This screen saves a log of the favorite channels values. The time period of this log, the limits of the channels displayed
(vertical limits of the chart) and other parameters can be configured in the “Parameters” screen. Pressing the ENTER key
will bring up a legend screen with the tags of your favorite channels that is on the chart along with their associated colors.
Pressing the ENTER key again will show the parameters configured for the chart. Pressing the ENTER key one more
time will return to the Chart screen. The red color is reserved to indicate that one or more channels have values over the
high limit or under the low limit configured for the chart.
The log starts at the moment the DISPLAY is powered and it is updated constantly, no matter which DISPLAY screen is
viewed. It is important to note that this log is limited to the data that can be seen in the screen (100 points) and it is not
possible to retrieve old (out-of-the-screen) data. It is also important to note that this log is independent the recording in
the Data Logger.
“CHANNEL LIST” SCREEN
This screen shows a list of all enabled channels (analog, digital, remote and virtual). The UP and DOWN keys are used
to navigate between the channels. The ENTER key has no function on this screen.
“ALARMS” SCREEN
The Alarms screen has a 32-position grid where each numbered position is related to its equivalent alarm or event.
When an alarm is active, its number will be displayed in red on this screen.
An alarm flag will appear on the bottom left side as long as any of the enabled alarms are active. This flag will show in all
screens. The UP, DOWN and ENTER keys have no function on this screen.
AEMC® INSTRUMENTS – 99-MAN 100386 v5
88
AEMC INSTRUMENTS
DATA LOGGERS
“STATUS” SCREEN
A list is shown in the status screen with information about the Data Logger and the DISPLAY itself. Navigation is
accomplished using the UP and DOWN keys. The ENTER key has no function.
Information is organized in a hierarchical way, where hierarchical levels are displayed by indentation on the left side.
Parameters that indented belong to the previous left justified parameter.
The following parameters can be monitored on this screen:
Data Logger: ............................................................... Data Logger information
Tag ........................................................................ Configured tag for the Data Logger
Firmware Version .................................................. Data Logger firmware version
Serial Number ....................................................... Data Logger serial number
Ethernet ................................................................ Ethernet interface information
Enabled ............................................................. Yes/No if interface enabled/disabled
Connected......................................................... Yes/No if interface cable connected/disconnected
Data Logger: ......................................................... Information about data recording
Scan Interval ..................................................... Analog scan interval configured
Logging Rate..................................................... Storage rate configured
Logging Enable ................................................. Yes/No if logging is enabled/disabled
Storage Memory ............................................... Shows where data is being stored
SD Card Connected .......................................... Yes/No if SD card connected/disconnected
Recording Status .............................................. Indicates if recording is active or stopped
Recording Mode................................................ Recording mode information
Start............................................................. Indicates how recording will start
Stop ............................................................. Indicates how recording will stop
SD Free Memory ................................................... Shows the available memory for recording on the SD card
Int. Free Memory ................................................... Shows the available memory for recording using internal memory
DISPLAY...................................................................... DISPLAY information
Firmware Version .................................................. DISPLAY firmware version
Serial Number ....................................................... DISPLAY serial number
AEMC® INSTRUMENTS – 99-MAN 100386 v5
89
AEMC INSTRUMENTS
DATA LOGGERS
“CONFIGURATION” SCREEN
Some Data Logger and DISPLAY parameters can be changed on this screen. In order to edit a parameter, you should
first select it by pressing the UP and DOWN keys. Once it is selected, press the ENTER key to enter the edit mode.
When in edit mode, the UP and DOWN keys can be used to edit the parameter value (increment and decrement). When
editing a parameter composed by more than one field (like IP addresses) select the correct field using the RIGHT and
LEFT keys. Single field parameters that have a wide range have a special way to change the increment/decrement factor
using the RIGHT and LEFT keys during editing: it starts with a factor of “1”; every time you press the LEFT key, it
multiplies this factor by 10 (tens, hundreds, thousands, …); every time you press the RIGHT key, it divides this factor by
10 (thousands, hundreds, tens, …). Once you have the desired value, press ENTER to complete the edit mode.
As with the “Status” screen, information here is organized in a hierarchical way:
The available parameters on screen are:
Data Logger: ................................................................................... Data Logger configuration
Date ........................................................................................... Date configuration
Time ........................................................................................... Time configuration
Ethernet ..................................................................................... Ethernet interface configuration
DHCP Enable......................................................................... DHCP enabling
IP Address ............................................................................. IP address configuration
Subnet Mask ......................................................................... Subnet mask configuration
Gateway ................................................................................. Gateway address configuration
Modbus RTU .............................................................................. Modbus RTU interface configuration
Mode ...................................................................................... Operation mode: master/slave
Slave Address ........................................................................ Modbus slave address
Baud rate ............................................................................... Communication baud rate
Parity ...................................................................................... Communication parity
DISPLAY........................................................................................... DISPLAY configuration
Backlight Timeout....................................................................... Backlight turn off time (0 = always on)
Chart .......................................................................................... “Chart” screen configuration
Color Background .................................................................. Background color: black/white
Interval ................................................................................... Period of time displayed on the Chart
Reference Value 1 ................................................................. First reference line value*
Reference Value 2 ................................................................. Second reference line value*
Input High Limit ..................................................................... Chart maximum displayed value**
Input Low Limit ....................................................................... Chart minimum displayed value**
* For disabling the reference lines, configure them to a value outside of the input configured range.
** If the Low Limit is configured to a value greater than the High Limit, the Chart will not display the values of the
channels in a correct way!
AEMC® INSTRUMENTS – 99-MAN 100386 v5
90
AEMC INSTRUMENTS
DATA LOGGERS
EQUIPMENT SOFTWARE/FIRMWARE UPDATE
The Data Logger allows firmware updating in the field, through a USB flash drive. The current firmware version is
available on www.aemc.com. The procedure for updating firmware is as follows.
Before performing the update, download any data in the data loggers’ memory and, if desired, also the the
data logger’s configuration. Saving it to a file. Both the configuration and the logged data in flash memory
will be lost in the upgrade process.
1. Turn off and unplug all Data Logger connections attached to it.
2. Copy the flogger.flb file, which is the binary firmware file of the Data Logger into USB flash drive root folder.
3. Insert the USB flash drive into the USB host of the Data Logger (that must remain off).
4. Plug in the power cord, apply power then turn the Data Logger ON again. The status and USB LEDs should flash
together, indicating that the boot loader is running.
5. The status LED should still be flashing in the same pattern. The USB LED should flash quickly while the flogger.flb
file copy is being performed. Once the copy has been completed, the USB LED should stay lit, indicating that the
USB flash drive can be removed.
6. If there is an error while copying (writing) the firmware to the Data Logger, it will be indicated by the status LED. It
will stop flashing periodically and begin repeatedly showing a pattern of blinking associated with the error that
occurred.
Blinks
Description
1
An error occurred in reading flogger.flb file.
2
Error in initializing the Data Logger USB host (when inserting the USB flash drive)
3
Error in erasing the Data Logger program memory.
4
Error in writing to the Data Logger program memory.
5
The written firmware is larger than the program memory available in the Data Logger.
The writing only partially occured.
6
Error in closing flogger.flb file.
7
Invalid flogger.flb file.
7. Remove the USB flash drive from the USB host portion on the Data Logger.
The Data Logger should reset itself automatically and may be returned to normal use with the updated firmware.
It is recommended that you delete the firmware file (flogger.flb) from the USB flash drive to prevent undesired
updates in the future.
AEMC® INSTRUMENTS – 99-MAN 100386 v5
91
AEMC INSTRUMENTS
DATA LOGGERS
CLOCK BATTERY REPLACEMENT
The Data Logger clock is kept by an internal battery as long as the equipment is not supplied by the AC power. In case
of battery discharge, logged dates and times may not be correct. Whenever the Data Logger detects such a situation, it
informs you by continuously flashing the Status LED three times in a row (check the Flags (LEDs) section).
Replace battery with Panasonic lithium battery Part No. CR 2032 only.
Usage of another battery may present a risk of fire or explosion.
Replacement procedure is described as follows:
• Detach Data Logger from DIN rail.
• Disconnect all terminals carefully.
• Unscrew the four screws located under the enclosure. Remove the back cover being careful not to remove the circuit
board.
• After removing the back cover, remove the battery. Avoid touching the circuit board!
AEMC® INSTRUMENTS – 99-MAN 100386 v5
92
AEMC INSTRUMENTS
DATA LOGGERS
• Insert the new battery and reinstall the back cover and its four screws.
AEMC® INSTRUMENTS – 99-MAN 100386 v5
93
AEMC INSTRUMENTS
DATA LOGGERS
SPECIFICATIONS
Power:
•
100 to 240VAC ± 10 %, 50/60 Hz. Maximum consumption: 20 VA.
Environmental Conditions: Operating temperature: 32° to 122°F (0° to 50°C). Relative Humidity: 80% to 85°F (30°C).
For temperatures above 85°F (30°C), decrease 3% per °C.
For internal use
Electrical Safety: CAT II
Pollution Degree: II
Altitude: < 2000 m
Dimensions: 164 x 117 x 70 mm
Weight: 400 g
Housing: ABS+PC
Protection: IP20
Analog Inputs: The types of input signals accepted by the Data Logger and their maximum ranges of measurement are
selected in the Configuration software and are listed below.
INPUT TYPE
MEASURING RANGE
ACCURACY
Thermocouple J
-184º to 1832ºF (-120 to 1000ºC)
± 0.2% (F.R.) ± 1ºC
Thermocouple K
-202º to 2501.6ºF (-130 to 1372ºC)
± 0.2% (F.R.) ± 1ºC
Thermocouple T
-202º to 752ºF (-130 to 400ºC)
± 0.2% (F.R.) ± 1ºC
Thermocouple E
-202º to 1436ºF (-130 a 780ºC)
± 0.2% (F.R.) ± 1ºC
Thermocouple N
-202º to 2372ºF (-130 to 1300ºC)
± 0.2% (F.R.) ± 1ºC
Thermocouple R
68º to 3214.4ºF (20 to 1768ºC)
± 0.2% (F.R.) ± 3ºC
Thermocouple S
68º to 3214.4ºF (20 to 1768ºC)
± 0.2% (F.R.) ± 3ºC
Thermocouple B
212º to 3308°F (100 to 1820ºC)
± 0.2% (F.R.) ± 3ºC
Pt100
-328º to 1562ºF (-200 to 850ºC)
± 0.15% (F.R.)
Pt1000
-328º to 1562ºF (-200 to 850ºC)
± 0.15% (F.R.)
Linear 0 to 20mA
User Programmable
± 0.15% (F.R.) *
Linear 4 to 20mA
User Programmable
± 0.15% (F.R.) *
Linear 0 to 20mV
User Programmable
± 0.15% (F.R.) *
Linear 0 to 50mV
User Programmable
± 0.15% (F.R.) *
Linear 0 to 60mV
User Programmable
± 0.15% (F.R.) *
Linear -20 to 20mV
User Programmable
± 0.15% (F.R.) *
Linear 0 to 5V
User Programmable
± 0.15% (F.R.) *
Linear 0 to 10V
User Programmable
± 0.15% (F.R.) *
F.R. = Full Range = Span
(*) Note: The full scale refers to the input of the sensor signal and not the range of configured indication.
Table 04 - List of signals accepted by the Data Logger
Accuracy is guaranteed at reading intervals greater than 0.2 seconds per channel. For faster scan rates (intervals of less
than 0.2 seconds), there will be a loss of accuracy that will increase as the scan rate increases. Although most of the
channels can indicate beyond the range limits set, the specification is not guaranteed outside the range.
Input impedance of the analog channels:
•
Thermocouples / Pt100 / Pt1000 / mV: > 2MΩ
•
mA: 15Ω + 1.5V
•
V: 1.1MΩ
Maximum compensated Pt100/Pt1000 cable resistance: 40Ω
Excitation current:
•
•
Pt100s: 360µA
Pt1000s: 320µA
Pt100/Pt1000 used curves: alfa = 0.00385
AEMC® INSTRUMENTS – 99-MAN 100386 v5
94
AEMC INSTRUMENTS
DATA LOGGERS
Digital Inputs:
•
•
•
•
Logical levels:
Logical level “0”: from 0 to 0.8VDC
Logical level “1”: from 3 to 30VDC
Maximum input voltage: 30VDC
Input Current @ 30VDC (typical): 3mA
Counting:
o Maximum pulse frequency for counting (square wave): 250Hz
o Minimum pulse time in logic level “0”: 2 ms
o Minimum pulse time in logic level “1”: 2 ms
o Number of bits for counting: 32
Digital Outputs
•
•
Maximum output voltage: 30VDC
Maximum output current: 200mA
Relays:
•
Maximum Current: 3A @ 250VAC; 3A @ 30VDC
Recording:
Can log up to 1000 samples per second. Limits: 1 channel at 1000 samples per second or 100 channels at 10
samples per second.
• Can log either in the internal flash memory (2162688 bytes → approximately 512 k measurements)
or in the SD card (*).
• Allows the option of circular logging, where, after filling up the memory, the oldest data will be overwritten by more
recent data.
• Allows data to be downloaded during logging.
(*) IMPORTANT: The effective storage rate depends heavily on the quality and speed of the SD card used. It is
preferred to use cards of well-known brands. If the desired storage rate is high, use Class IV or above SD cards.
Maximum number of channels that can be logged: 100
Supported file systems: FAT32 e FAT16, both in USB flash drives and SD cards
•
24V output: 24VDC ± 20% with a minimum load current of 4mA. Maximum load current: 160mA. This output is not
provided in the 24V model.
Clock battery: Panasonic lithium battery 3V (Part No. CR 2032).
Supported Modbus commands:
•
•
•
•
•
Read Coil Status (01h)
Read Holding Registers (03h)
Write Single Coil (05h)
Write Single Register (06h)
Write Multiple Registers (0Fh)
Number of simultaneous TCP connections: 10
Number of simultaneous UDP connections: 10
FTP (Data Logger as a server):
Supported mode: passive.
Standard: UNIX.
Number of simultaneous connections: 1.
SMTP (e-mail):
Supported authentication mode: AUTH LOGIN.
Certifications: CE.
AEMC® INSTRUMENTS – 99-MAN 100386 v5
95
AEMC INSTRUMENTS
DATA LOGGERS
REPAIR AND CALIBRATION
To ensure that your instrument meets factory specifications, we recommend that it be submitted to
our factory Service Center at one-year intervals for recalibration, or as required by other standards
or internal procedures.
For instrument repair and calibration:
You must contact our Service Center for a Customer Service Authorization number (CSA#). This
will ensure that when your instrument arrives, it will be tracked and processed promptly. Please
write the CSA# on the outside of the shipping container. If the instrument is returned for calibration,
we need to know if you want a standard calibration, or a calibration traceable to N.I.S.T. (includes
calibration certificate plus recorded calibration data).
Chauvin Arnoux®, Inc.
d.b.a. AEMC® Instruments
15 Faraday Drive
Dover, NH 03820 USA
Tel: (800) 945-2362 (Ext. 360)
(603) 749-6434 (Ext. 360)
Fax:(603) 742-2346 or (603) 749-6309
[email protected]
(Or contact your authorized distributor)
Costs for repair, standard calibration, and calibration traceable to N.I.S.T. are available.
NOTE: All customers must obtain a CSA# before returning any instrument.
TECHNICAL AND SALES ASSISTANCE
If you are experiencing any technical problems, or require any assistance with the proper operation
or application of your instrument, please call, mail, fax or e-mail our technical support hotline:
Chauvin Arnoux®, Inc.
d.b.a. AEMC® Instruments
200 Foxborough Boulevard
Foxborough, MA 02035, USA
Phone: (800) 343-1391
(508) 698-2115
Fax:
(508) 698-2118
[email protected]
www.aemc.com
NOTE: Do not ship Instruments to our Foxborough, MA address
AEMC® INSTRUMENTS – 99-MAN 100386 v5
96
AEMC INSTRUMENTS
DATA LOGGERS
LIMITED WARRANTY
The Data Logger Models DL-1080 and DL-1081 are warranted to the owner for a period of one
year from the date of original purchase against defects in manufacture. This limited warranty is
given by AEMC® Instruments, not by the distributor from whom it was purchased. This warranty is
void if the unit has been tampered with, abused or if the defect is related to service not performed
by AEMC® Instruments.
Full warranty coverage and product registration is available on our website at:
www.aemc.com/warranty.html
Please print the online Warranty Coverage Information for your records.
What AEMC® Instruments will do:
If a malfunction occurs within the warranty period, you may return the instrument to us for repair,
provided we have your warranty registration information on file or a proof of purchase. AEMC®
Instruments will, at its option, repair or replace the faulty material.
WARRANTY REPAIRS
First, request a Customer Service Authorization Number (CSA#) by phone or by fax from our
Service Department (see address below), then return the instrument along with the signed CSA
Form. Please write the CSA# on the outside of the shipping container. Return the instrument,
postage or shipment pre-paid to:
Ship To: Chauvin Arnoux®, Inc. d.b.a. AEMC® Instruments
15 Faraday Drive • Dover, NH 03820 USA
Phone: (800) 945-2362 (Ext. 360)
(603) 749-6434 (Ext. 360)
Fax:
(603) 742-2346 or (603) 749-6309
E-mail: [email protected]
Caution: To protect yourself against in-transit loss, we recommend you insure your returned
material.
NOTE: You must obtain a CSA# before returning any instrument
AEMC® INSTRUMENTS – 99-MAN 100386 v5
97
AEMC INSTRUMENTS
DATA LOGGERS
04/14
99-MAN 100386 v5
®
®
Chauvin Arnoux , Inc. d.b.a. AEMC Instruments
15 Faraday Drive • Dover, NH 03820 USA • Phone: (603) 749-6434 • Fax: (603) 742-2346
www.aemc.com
AEMC® INSTRUMENTS – 99-MAN 100386 v5
98