1
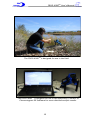
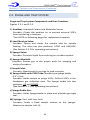
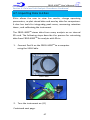
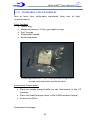
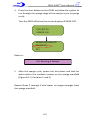
FROG-4000TM Chemical Analysis System User’s Manual Defiant Technologies, Inc. 2014 Vol.4 This page is intentionally left blank. FROG-4000TM Chemical Analysis System User’s Manual Defiant Technologies, Inc. 2014 Vol.4 www.defiant-tech.com FROG-4000TM User’s Manual Sparge Bottle 4 FROG-4000TM User’s Manual HANDLING INSTRUCTIONS FROG-4000TM is a robust, portable instrument, which can be operated in a lab setting or out in the field. The internal components of this instrument can be damaged if the unit is abused. The following precautions are given to ensure correct handling of the instrument. PRECAUTIONS DO NOT invert with sparge bottle attached. System can NOT analyze a sample when it is inverted! Permanent damage to instrument is possible! (If this does occur, the system may require maintenance. Refer to Section 8, Trouble Shooting) DO NOT handle or carry system when sample is being analyzed. For the best results, limit movement to before or after sample analysis. DO NOT transport or store the instrument with liquid in the sparge bottle. Do NOT invert 90° Angle 5 Do NOT invert 180° Angle FROG-4000TM User’s Manual This page is intentionally left blank. 6 FROG-4000TM User’s Manual TABLE OF CONTENTS Handling Instructions ............................................................................. 5 Commonly Used Acronyms .................................................................... 9 Section 1: Getting to Know the FROG-4000TM........................................ 11 1.1 Manual Overview ......................................................................... 11 1.2 Operations Overview ................................................................... 12 Section 2: Components and Systems ..................................................... 15 2.1 Instrument Components ............................................................... 16 2.2 Purge and Trap System ................................................................ 20 2.2.1 Load/Analyze Valve .............................................................. 22 2.2.2 Sparge Bottle Positions ........................................................ 23 2.3 Gas Phase Analysis System ........................................................... 24 2.4 Gas Sample Analysis Flow Diagrams ............................................ 27 2.4.1 Sample Loading .................................................................... 27 2.4.2 Sparge and Collection ........................................................... 28 2.4.3 Release, Separation and Analysis ......................................... 29 2.5 Gas Sampling Analysis Flow Diagrams Air Sampler………………..…..30 2.5.1 Sample Collection………………………………………………….………….30 2.5.2 Release, Separation and Analysis…………………….………………..31 Section 3: Overview of Ellvin Chromatography Software ...................... 32 Section 4: Field and Lab Analysis Procedures ........................................ 33 4.1 Powering On/Charging the Battery .............................................. 37 4.2 Connecting to Computer/Ellvin .................................................... 41 4.3 Instrument Settings ...................................................................... 45 4.4 Instrument Preparation ................................................................ 49 4.4.1 Rinsing the Instrument ......................................................... 49 4.4.2 Creating a Clean Baseline ..................................................... 50 4.4.3 Connecting the Air Sample Adaptor ..................................... 53 4.5 Loading a Sample .......................................................................... 57 4.6 Running a Sample ......................................................................... 61 4.7 Importing Data to Ellvin ................................................................ 67 7 FROG-4000TM User’s Manual TABLE OF CONTENTS CONTINUED Section 5: Ellvin Chromatography Software ........................................ 73 5.1 Features of Ellvin ........................................................................ 74 5.2 Applying Ellvin Features ............................................................. 80 5.2.1 OPEN Button ...................................................................... 80 5.2.2 Magnifying Glass ................................................................ 82 5.2.3 Integrator ........................................................................... 84 Section 6: Calibration ........................................................................... 91 6.1 Calibration Standards ................................................................. 92 6.1.1 Standards for Liquid or Soil Samples .................................. 92 6.1.2 Standards for Air Samples .................................................. 95 6.2 Ellvin Calibration Window Features ............................................ 99 6.2.1 List of Analytes ................................................................... 99 6.2.2 Correlation Chart and Equations ........................................ 100 6.3 Calibration Procedure ................................................................ 102 Section 7: Maintenance ...................................................................... 111 7.1 Routine Cleaning ................................................................... 111 7.1 Annual Cleaning..................................................................... 112 7.3 Cleaning the Scrubber ........................................................... 112 Section 8: Trouble Shooting ................................................................. 117 8.1 Inverting the FROG with Water in the Sparge Bottle ........................................................ 117 8.2 Degrading Chromatograph: Scrubber is NOT secured properly ............................................. 121 8.3 Cannot Achieve a Clean Baseline ............................................... 122 8.4 Black Instrument Screen ........................................................... 124 Appendix I: Accessories/Spare Parts ..................................................... 127 Appendix II: Detectable Chemicals ....................................................... 131 8 FROG-4000TM User’s Manual COMMONLY USED ACRONYMS PC: Preconcentrator PID: Photo Ionization Detector GC: Gas Chromatography Column VOCs: Volatile Organic Compounds BTEX: Benzene, Toluene, Ethylbenzene, Xylenes Ellvin: Chromatography Software FROG-4000TM 9 FROG-4000TM User’s Manual This page is intentionally left blank. 10 FROG-4000TM User’s Manual SECTION 1: GETTING TO KNOW THE FROG-4000 T M 1.1 MANUAL OVERVIEW The FROG-4000TM uses a practical approach to instrument set-up and operations. This manual includes the following: An overview of the FROG-4000TMoperational systems, components, and features. Diagrams illustrating the flow of a sample during loading, sparge, collection and analysis. Instructions for using the chromatography software (Ellvin). TM Detailed procedures for using the FROG-4000 . Instructions for calibrating the instrument. Routine maintenance information. Troubleshooting information. 11 FROG-4000TM User’s Manual 1.2 OPERATIONS OVERVIEW The FROG-4000TM instrument analyzes air, water or soil to identify volatile organic chemicals (VOCs) present in a sample and determine their concentrations. The instrument is designed to operate either in the field or in a laboratory, and either connected or not connected to a computer running the Ellvin Software. Data is stored on the user’s hard drive when the FROG is attached to a computer. Alternatively, data can be stored on the FROG’s internal memory card and imported to a computer later. The FROG-4000TM has a 5 mL sample sparger that can be used for water or solid samples. It is good practice to keep the total volume in the sparger at a constant 5 mL. For instance, if the user wishes to dilute a water sample 10 to 1, a sample volume of 0.5 mL would be diluted with 4.5 mL of clean water, resulting in total volume of 5 mL. If analyzing soil samples, the user must add water to the sparger to ensure that the sample is appropriately agitated. The basic steps for operating the system are: 1. Adjust/apply the settings as needed. 2. Ensure that the instrument displays a clean baseline. 3. Load a 5 mL sample. 4. Run an analysis, either connected or not connected to Ellvin. 5. If not connected to Ellvin during the analysis cycle, read analysis data using Ellvin at a later time. NOTE: A working knowledge of Ellvin is necessary to correctly operate the instrument. Users should be familiar with the software before attempting analyses. 12 FROG-4000TM User’s Manual The FROG-4000TM is designed for use in the field. The FROG-4000TM is designed for use in the laboratory. Connect to Chromatogram Elf Software for more detailed analysis results. 13 FROG-4000TM User’s Manual This page is intentionally left blank. 14 FROG-4000TM User’s Manual SECTION 2: COMPENENTS AND SYSTEMS The FROG-4000TM instrument has two main operational systems: The Purge and Trap System This system manages the loading of a sample, sparging sample, if liquid, to release VOCs, and the introduction of phase compounds to the Gas Phase Analysis System. components of the Purge and Trap System are visible on instrument exterior. the gas All the The Gas Phase Analysis System The Gas Phase Analysis System receives the VOCs from the Purge and Trap System and carries them through all stages of sample analysis, Collection Injection Separation Detection The instrument’s components are briefly described on the following pages. 15 FROG-4000TM User’s Manual Section 2: Components and Systems Continued 2.1. INSTRUMENT COMPONENTS Components Reference for FROG-4000TM: A. Scrubber B. Load/Analyze Valve C. Display Screen D. Sparge-Valve Line E. Sparge-Valve F. Flow Selection-Valve G. Sparge Manifold H. Pump Split I. Pump Split Cover (not shown) J. Sample Inlet K. Sparge Bottle with PEEK Tube L. Sparge Bottle Nut M. 5 mL Syringe to load sample 16 FROG-4000TM User’s Manual C B A D H G F E L J K M 17 FROG-4000TM User’s Manual 2.1. Instrument Components Continued N. USB Port for stored data O. Power Switch P. Port for Serial Data Plug Q. Port for 9V Power Plug R. Port for Battery Charge Plug S. Port for Air Sampler Plug T. Battery U. Start Button V. Pump Inlet for Carrier/Sparge Gas W. Exhaust from Gas Analysis Module 18 FROG-4000TM User’s Manual N T O P Q R S U W U V W V 19 FROG-4000TM User’s Manual Section 2: Systems and Components Continued 2.2. PURGE AND TRAP SYSTEM Purge and Trap System Components and their Functions Figures 2.2-1 and 2.2-2. A) Scrubber: Activated Carbon and Molecular Sieves Function: Cleans the ambient air to prevent external VOCs from interfering in analyses. *See NOTE on following pages for replacement supplies. B) Load/Analyze Valve: Function: Opens and closes the sample inlet for sample loading. The valve has two positions, LOAD and ANALYZE. (See Section 2.2.1 for operating instructions) E) Sparge-Valve: Function: Prevents liquid from entering air scrubber system. G) Sparge Manifold: Function: Routes gas to the proper ports for sparging and analysis functions. J) Sample Inlet: Function: Attachment for syringe to load a sample. K) Sparge Bottle with PEEK Tube: Needle type sparge bottle, 0.5” x 5mL. Function: Holds sample to purge VOCs. Collects VOCs in the headspace gas collection area. The Sparge bottle has two positions, UP and DOWN. (See Section 2.2.2 for operating instructions) L) Sparge Bottle Nut: Function: Holds Sparge bottle in place and provides gas tight seal. M) Syringe: 5mL, with Luer Lock. Function: Loads a fixed sample volume to the sparger. Attaches to sample inlet (J). 20 FROG-4000TM User’s Manual Figure 2.2-1: Purge and Trap System B J A G E E L K Figure 2.2-2: Purge and Trap System J M 21 FROG-4000TM User’s Manual 2.2 Purge and Trap System Continued 2.2.1. LOAD/ANALYZE VALVE Turn the load/analyze valve to the LOAD position to load a sample. LOAD LOAD POSITION After loading a sample, turn the handle counter clockwise to the ANALYZE position before starting an analysis cycle. ANALYZE Analyze Position 22 FROG-4000TM User’s Manual 2.2.2. SPARGE BOTTLE POSITIONS The sparge bottle moves UP and DOWN and is secured with a sparge bottle nut. The bottle must be in the DOWN position to rinse the instrument or to remove the sparge bottle. The bottle must be in the UP position to load and analyze a sample. Sparge bottle in the DOWN position. Sparge bottle in the UP position. NOTE: The Activated Carbon and Molecular Sieves may be purchased, premeasured and cleaned, through Defiant Technologies, Inc. Activated Carbon, Part Number: DT-FG4K-AC-1 Molecular Sieves, Part Number: DT-FG4K-MS-1 23 FROG-4000TM User’s Manual Section 2: Components and Systems Continued 2.3. GAS PHASE ANALYSIS SYSTEM Gas Phase Analysis System Components and their Functions Figures 2.3-1 and 2.3-2: A-Internal) Pump: Diaphragm pump Function: Circulates carrier gas through system. B-Internal) Preconcentrator (PC): Function: Collects and injects VOCs into GC column. C-Internal) Micro Gas Chromatography Column: (GC) Function: Separates VOCs. D-Internal) Photo Ionization Detector (PID): 10.6eV lamp Function: Detects VOCs. E) Sparge-Valve: Function: Directs pump flow into sparge bottle to purge VOCs from sample. F) Flow Selection Valve: Function: Determines where the flow will be directed during Sparge or Analysis Mode. G-Internal) Bypass-Valve: Function: Allows the VOCs to pass over the PC and bypass the GC and PID. H) Pump Split: Function: Provides a small leak in pump flow for improved flow control. X-Internal) Injection Split: Function: Provides a small leak to prevent rebound injection. 24 FROG-4000TM User’s Manual H Activated Charcoal A Sparge-Valve Molecular Sieves E X Preconcentrator Load Sample F Flow Selection Valve Bypass-Valve Bypass Line B Sample Sparger PID VOCs D Micro-GC C Figure 2.3-1 Gas Phase Analysis System components. PID Preconcentrator Bypass-Valve GC column Figure 2.3-2 Gas Phase Analysis System internal components. 25 FROG-4000TM User’s Manual 2.3. Gas Phase Analysis System Continued Gas Phase Analysis System Components and their Functions Figure 2.3-3 C) Display Screen: Function: Shows the user which stage of analysis is being performed and displays an estimate of analysis results. U) Start Button: Function: Initiates the analysis cycle (can also be initiated through Ellvin). V) Pump Inlet: Function: Carrier gas intake for pump. W) Exhaust: Function: System flow exits. C U W V Figure 2.3-3 Gas Phase Analysis System external components 26 FROG-4000TM User’s Manual Section 2: Systems and Components Continued 2.4. GAS FLOW DIAGRAMS This section describes and illustrates the flow of a sample from loading through the components of the Gas Phase Analysis System (Section 2.2). 2.4.1. SAMPLE LOADING (Diagram 2.4-1) The sparge bottle is in the UP position for a liquid or air sample. The load/analyze valve is in the LOAD position. A sample is loaded into the sample inlet with a 5mL syringe. Activated Charcoal Sparge-Valve Molecular Sieves Load Sample Preconcentrator Flow Selection Valve Bypass-Valve Bypass Line Sparge Bottle PID Sample Micro-GC Diagram 2.4-1: Sample Loading 27 FROG-4000TM User’s Manual 2.4. Gas Flow Diagram Continued 2.4.2. SPARGE AND COLLECTION (Diagram 2.4-2) After the sample has been loaded, the load/ analyze-valve is placed in the ANALYZE position. The start button is pressed and the pump flow starts. The carrier gas moves through: 1) the flow selection valve 2) activated charcoal, and 3) the sparge-valve. Air sparges the liquid (if a liquid sample) to release the VOCs into the headspace of the sparge bottle and onto the preconcentrator (PC). Activated Charcoal Sparge-Valve Molecular Sieves Preconcentrator Load Sample Flow Selection Valve Bypass-Valve Bypass Line Sparge Bottle PID VOCs Carrier Gas Micro-GC Diagram 2.3-2: Sparge and Collection 28 VOCs FROG-4000TM User’s Manual 2.4.3. INJECTION (RELEASE), SEPARATION, AND ANALYSIS (Diagram 2.4-3) Once the VOCs are collected onto the PC, the PC is heated to release the VOCs and inject them into the Micro-Gas Chromatograph Column (GC). The VOCs separate through the column and then continue to the Photo Ionization Detector (PID). The PID signal is analyzed and displayed through the software. The excess exits through the exhaust. Activated Charcoal Sparge-Valve Molecular Sieves Preconcentrator Load Sample Flow Selection Valve Bypass-Valve Bypass Line Sparge Bottle PID VOCs Micro-GC Carrier Gas Carrier Gas VOCs VOCs Diagram 2.4-3: Injection, Separation and Analysis 29 FROG-4000TM User’s Manual Section 2: Systems and Components Continued 2.5. GAS FLOW DIAGRAMS THROUGH AIR SAMPLER This section describes and illustrates the flow of a sample from loading through the components of the Gas Phase Analysis System through the air sampler (Section 2.2). 2.5.1. SAMPLE COLLECTION (Diagram 2.5-1) The air sampler is connected to the Frog-4000. The start button is pressed and the pump flow starts. The carrier gas moves through: 1) the flow selection valve 2) activated charcoal, and 3) the sparge-valve. The air sampler pulls sample through its own valve onto to place the VOCs onto the preconcentrator (PC). Diagram 2.5-1: Sample Collection 30 FROG-4000TM User’s Manual 2.5. Gas Flow Diagram Continued 2.5.2. INJECTION (RELEASE), SEPARATION, AND ANALYSIS (Diagram 2.5-2) Once the VOCs are collected onto the PC, the PC is heated to release the VOCs and inject them into the Micro -Gas Chromatograph Column (GC). The VOCs separate through the column and then continue to the Photo Ionization Detector (PID). The PID signal is analyzed and displayed through the software. The excess exits through the exhaust. Diagram 2.5-2: Injection, Separation and Analysis 31 FROG-4000TM User’s Manual SECTION 3: OVERVIEW OF ELLVIN, CHROMATOGRAM ELF SOFTWARE The Chromatogram Elf Software (Ellvin) has four windows that are accessed with tabs when the software is open. Window Tabs in Ellvin Live Data Window: This is the default window for Ellvin. In Live Data Window, Ellvin creates a chromatogram from sample analysis data. The data source may be: a. From a sample loaded and simultaneously analyzed by Ellvin. b. From sample data previously recorded on the instrument’s SD card, then imported to Ellvin. Analyze Window: As in Live Data Window, Ellvin creates a chromatogram from sample analysis data. In this window, Ellvin retrieves analysis data that was previously stored on a computer. In Analyze Window the user can examine chromatograms closely, integrate chromatogram peaks, and export data to Excel. Calibration Window: In this window, Ellvin uses analysis data from chemical standards to calibrate the FROG. Settings Window: In this window, Ellvin manages the settings for the FROG. The settings define temperature and duration parameters for various phases of the instrument’s analysis cycle. There are several general features of Ellvin as well as a few features specific to Analyze Window that are described in Section 5. The user should be familiar with all the features before starting a sample analysis. 32 FROG-4000TM User’s Manual SECTION 4: FIELD AND LAB ANALYSIS PROCEDURES The simplest way to use the FROG is to load samples and run analyses while the instrument is connected to a computer and Ellvin. The software analyzes sample data and displays a live chromatogram during analyses. The cycle takes about five minutes. Data is stored both on the FROG’s internal SD card and on the computer. The FROG can also analyze samples when not connected to Ellvin. An analysis cycle takes the same amount of time (five minutes) and an estimate of the results are displayed on the instrument’s screen. Data is stored on the FROG’s internal SD card and can be imported to Ellvin and analyzed at a later time if desired. Section 4.7. gives instructions for importing data from the FROG. Continued next page. 33 FROG-4000TM User’s Manual Section 4: Field and Lab Analysis Procedures Continued This section provides detailed instruction for various procedures that are essential to operating the FROG-4000TM. Procedures include: 4.1: Powering On/Charging Battery Description of components and connections. 4.2: Connecting to Computer/Ellvin Instructions/description for components and connections. 4.3: Instrument Settings Set parameters to optimize instrument function. 4.4: Instrument Preparation Remove interfering contaminants/ensure a clean instrument. 4.5: Loading a Sample Air, liquid, and soil sample preparation and loading instructions. 4.6: Running A Sample Instructions/description for an analysis cycle. 4.7: Importing Data to Ellvin Import stored data from FROG to Ellvin for analysis. 34 FROG-4000TM User’s Manual Complete the following procedures to run an analysis. NOTE: The user should be familiar with Ellvin before loading and running a sample. 1. 4.1: Powering On/Charging Battery 2. 4.4: Instrument Preparation 3. 4.5: Loading a Sample 4. 4.6: Running A Sample If not connected to Ellvin, 5. 4.7: Importing Data to Ellvin 6. Clean the instrument when all samples have been completed by repeating Step 2. 4.4: Instrument Preparation Exception: Samples of the same, known analyte may be run consecutively from low concentration to high without rinsing the instrument and creating a clean baseline. 35 FROG-4000TM User’s Manual This page is intentionally left blank. 36 FROG-4000TM User’s Manual Section 4: Field and Lab Analysis Procedures Continued 4.1: Powering On/Charging Battery Powering On Connect power cable to power port (R) 9V POWER, or use battery power. (Figure 4.1-1) Turn power switch (O) to ON (fully up) position. The instrument display screen will be visible. O To R, 9V POWER O R, 9V Power R, 9V POWER To Outlet Figure 4.1-1: Power port, power cable and power switch. When the FROG-4000TM display screen shows READY, the instrument is ready to load a sample. VOC ANALYZER GC TEMP:37C READY LOG_016 BTEX V.934 2012 37 FROG-4000TM User’s Manual 4.1. Powering On/Charging Battery Continued Charging the Battery NOTE: The instrument can NOT be used while the battery is charging. 1. Remove the sparge bottle from the instrument before charging the battery. 2. The Instrument should be powered off and disconnected from the power cable. 3. Plug battery charger into Battery charge port (S) and outlet source. 4. Place battery charger switch to 1.8A. 5. While the battery is charging, the light on the charger switch will appear red. 6. When the battery is completely charged, the light on the charger switch will appear green. 7. It is highly recommended that the battery be fully charged before the instrument is used in an outdoor setting. 38 FROG-4000TM User’s Manual S, Battery Charge To Outlet To S, Battery Charge 39 FROG-4000TM User’s Manual This page is intentionally left blank. 40 FROG-4000TM User’s Manual Section 4: Field and Lab Analysis Procedures Continued 4.2: Connecting to Computer/Ellvin There are two possible connections between the FROG and a computer. To send information such as settings and analysis commands from Ellvin to the instrument, connect a computer to the serial data port (Q) on the FROG with the Serial Data-Cable. To import data from the instrument’s internal SD card to Ellvin, connect a computer to Port N on the FROG with the USB-Cable. NOTE: Detailed instructions for exporting data with the USB cable are given in Section 4.7. N Q To Laptop USB To Laptop USB To Q To N Serial Data-Cable USB-Cable 41 FROG-4000TM User’s Manual 4.2. Connecting to Computer/Ellvin Continued Serial data-cable Connection 1. Connect the serial data-cable from the FROG’s serial data port (Q) to a USB port on a computer. 2. Set the instrument power switch (O) to the ON position. 3. If necessary, install Ellvin onto laptop or PC. 4. Open Ellvin by double clicking on the Ellvin icon. O Q To Laptop USB USB To Q Serial Data-Cable 42 FROG-4000TM User’s Manual After Ellvin has opened, the default screen that appears is the chromatogram display screen in Live Data Window. (Figure 4.2-1) Figure 4.2-2 shows details of the display screen Figure 4.2-1: Ellvin default screen. Software Features Figure 4.2-2: 3.2-2: Ellvin default screen details. Tabs 43 FROG-4000TM User’s Manual 4.2. Connecting to Computer/Ellvin Continued 5. Click “Port” on the display screen, then select a COM#. 6. The connection port should now read CONNECTED indicating that the FROG and Ellvin are connected. The user may now manage settings and run analyses from Ellvin. 44 FROG-4000TM User’s Manual Section 4: Field and Lab Analysis Procedures Continued 4.3: Instrument Settings The FROG-4000TM comes with general default setting for VOCs, which are shown in Figure 4.3-2 on the following page. The settings determine the duration of different analysis phases, as well as the desired temperature of the GC column. The settings are defined and applied using Ellvin. Table 4.3-1 on the following page describes the various settings. The FROG-4000TM default settings are best for the analysis of Benzene, Toluene, Ethylbenzene and Xylenes (BTEX), but the settings can be altered for analyzing a wide variety of compounds and concentrations. (See Appendix I for a list of detectable chemicals). The current operational settings are stored in the FROG-4000TM memory and do not revert to the default settings when the instrument is disconnected from the software or power. They are retrieved and displayed under the Settings Window when the instrument is connected to a computer through Ellvin. Instructions for adjusting the settings begin on the following pages. Connect to Ellvin to manage the settings. 45 FROG-4000TM User’s Manual 4.3. Instrument Settings Continued Table 4.3.1 Description of Settings Settings Description Ta Hold time at lower GC temperature (seconds) Tb Ramp time from GC cold to GC hot temperature (oC) Tc Hold time at hot GC temperature (oC) Ct Initial cold GC temperature (oC) NOTE: If used outdoors, the user must consider ambient conditions. Ht Final hot GC temperature (oC) COLLECT Collection time of VOCs onto PC (seconds) This corresponds to the sparge time. CLEAN Time cleaning PC by heating (seconds) PRESETTLE Time PC cools between cleaning (seconds) SETTLE Time allowed for pressure to stabilize before PC FIRE (seconds) FIRE Time PC is Heated to Release VOCs (seconds) Figure 4.3-1: Description of GC Temperature Settings. 46 FROG-4000TM User’s Manual Defining and applying the settings. 1. Connect to Ellvin. Refer to: 4.2: Connecting to Computer/Ellvin 2. Click on the Ellvin Settings Tab. 3. Type in a non-zero integer then click SET to apply the settings to the instrument. Changes to the settings are stored on the instrument and DO NOT revert to the default settings when power is removed or computer is disconnected. The minimum and maximum values are listed next to the Figure 4.3-2. Settings Figure 4.3-2: Setting Window 47 Min Max Ta 2 900 Tb 2 900 Tc 2 900 Ct 25 95 Ht 30 149 Collect 10 900 Clean 2 20 Presettle 4 20 Settle 2 20 Fire 4 20 FROG-4000TM User’s Manual Section 4: Field and Lab Analysis Procedures Continued 1 3 2 Figure 4.4-1 Rinsing the Instrument Steps 1-3 48 FROG-4000TM User’s Manual 4.4: Instrument Preparation Before running analyses, the instrument should be rinsed and display a clean baseline. 4.4.1. RINSING THE INSTRUMENT 1. Place the load/analyze valve in the LOAD position. (See Section 2.2.1) LOAD 2. Place sparge bottle in the DOWN Position. (See Section 2.2.2) 3. Attach syringe with 5 mL deionized water to FROG-4000TM. (Figure 4.4-1, opposite page) Figure 4.4-2: Load/ Analyze Valve 4. Load deionized water into FROG-4000TM. 5. Remove sparge bottle and empty deionized water into waste container. 6. Repeat steps 3-5 twice, for a total of three rinses. 7. Remove and rinse sparge bottle with deionized water. 8. Replace the sparge bottle in the DOWN position. Proceed to demonstrate a clean baseline (following pages). 49 FROG-4000TM User’s Manual 4.4. Instrument Preparation Continued 4.4.2. CREATING A CLEAN BASELINE A Clean Baseline should be achieved before analyzing a sample. This procedure ensures that there are no contaminants in the instrument that could effect the analysis results. If the instrument is connected to a computer and Ellvin, the start button and display screen are in the software. If the instrument is not connected to Ellvin, the start button and display screen are on the instrument. Rinse the instrument as described in Section 4.4.1 before attempting to achieve a clean baseline Procedure: 1. Place load/analyze valve in the LOAD position. (See Section 2.2.1) 2. Place rinsed sparge bottle in the UP position, and turn the sparge bottle nut counter clockwise, only finger tight, to secure it. (See Section 2.2.2) 3. Attach syringe with 5 mL deionized water to FROG-4000TM. 4. Load deionized water into FROG-4000TM 5. Remove the empty syringe 6. Place the load/analyze valve in the ANALYZE position. Continued following pages. 50 FROG-4000TM User’s Manual LOAD POSITION 1 3 6 4 4 2 51 FROG-4000TM User’s Manual 4.4.2. Creating a Clean Baseline Continued 7. Begin an analysis cycle using deionized water. If connected to Ellvin, click the start button in the software. If not connected to Ellvin, press the yellow start button on the instrument. Start Button Start Button in Ellvin When the analysis is finished, a clean baseline should appear. A clean baseline is basically smooth with no significant peaks. A small peak at the beginning of the chromatogram and small waves in the clean baseline are acceptable. Clean Baseline on Ellvin Screen A small peak at the beginning of the chromatogram is normal. If Peaks do appear, repeat the instrument preparation procedures (4.4.1, Rinsing the Instrument and 4.4.2, Creating a Clean Baseline) until a clean baseline is achieved. 52 FROG-4000TM User’s Manual 4.4. Instrument Preparation Continued 4.4.3. CONNECTING THE AIR SAMPLE ADAPTOR If analyzing air sample, the user must first connect the air sample adaptor to the FROG. Valve Control Exhaust Port Sparge Needle Port Wand Connection The air sample kit includes a sample wand and an air sample bag adapter. The air sample bag adapter enables direct connection to an air sample bag. 53 FROG-4000TM User’s Manual 4.4.3. Connecting the Air Sample Adaptor Continued 1. Attach the air sampler to the FROG sparge needle. Be sure the valve is pointed to the right. 2. Connect the air sampler’s valve connector to the FROG valve connection. This connection supplies power to the air sampler. 3. Attach the exhaust connector to the FROG exhaust with a twisting motion. 54 FROG-4000TM User’s Manual 6. Connect the air sample wand to the air sampler. 55 FROG-4000TM User’s Manual This page is intentionally left blank. 56 FROG-4000TM User’s Manual Section 4: Field and Lab Analysis Procedures Continued 4.5: Loading a Sample NOTE: The instrument should have a clean baseline to begin sample loading and analysis. Refer to: 4.4: Instrument Preparation To ensure optimal sample analysis, adhere to the following sampling procedures and sample parameters: Liquid Sample: Pull 5mL of the desired liquid into a 5mL syringe. Soil Sample: a. Remove the sparge bottle from the instrument. b. Add 1 g of soil to the sparge bottle with then add 5 mL of clean water. c. Rinse the sparge bottle thoroughly between samples or use Defiant’s disposable sparge bottles. Air Sample: Connect the air sampler adaptor and wand to the FROG (Section 4.4.3). When running an analysis (Section 4.6), hold the wand in the area desired for sample collection. Detailed instruction begin on the following page. 57 FROG-4000TM User’s Manual 4.5. Loading a Sample Continued If concentrations are known, during calibration for example, a series of samples of the same analyte may be run consecutively without rinsing the instrument. They must be run in order from low to high concentrations to prevent cross contamination. Procedure: LOAD 1. Place load/analyze valve in the LOAD position (open). (See Section 2.2.1) 2. Attach the sparge bottle and place it in the UP position. Liquid or Air Samples: The sparge bottle is clean and rinsed. Soil Samples: The sparge bottle is loaded with the soil sample. Turn the sparge bottle nut counter clockwise until finger tight to secure the sparge bottle. The sparge bottle should not spin in the sparge bottle nut. (See Section 2.2.2) 58 FROG-4000TM User’s Manual 3. Attach 5mL syringe to the instruments sample inlet. 4. Liquid Sample: Load the sample into the instrument. Soil Sample: First, fill the 5mL syringe with deionized water. Then, attach it to the instrument’s sample inlet and load 5mL of deionized water into the sparge bottle. Immediately place the load/analyze-valve in the ANALYZE position (closed). The syringe may now be removed. ANALYZE Position 59 FROG-4000TM User’s Manual 4.5. Loading a Sample Continued The instrument display screen shows READY throughout Steps 1-4 of Loading a Sample. The Log # is automatically generated and assigned to the data file produced by the current analysis cycle. VOC ANALYZER GC TEMP:37C READY LOG_016 BTEX V.934 2012 60 FROG-4000TM User’s Manual Section 4: Field and Lab Analysis Procedures Continued 4.6: Running A Sample This section describes the procedure for running an analysis and the instrument’s stages during an analysis cycle. Procedure: Record notes for future reference: If not connected to Ellvin, the user should record the LOG#s and other relevant information for future reference. The instrument records this number in the file name on the internal SD card. If connected to Ellvin, the user can record relevant information for sample identification in Ellvin’s Sample Notes window. Ellvin automatically stores the analysis data file in a folder labeled with the date. The file itself is labeled with the time it was created. After the sample loading is complete (Section 4.5), the user may begin sample analysis by pressing the start button. If connected to Ellvin, click the start button in the software. If not connected to Ellvin, press the yellow start button on the instrument. Start Button on the Frog Start Button in Ellvin Continued next page. 61 FROG-4000TM User’s Manual 4.6. Running a Sample Continued During an analysis cycle, the FROG screen displays the analysis steps in sequence as illustrated below and on the following pages. This information is only visible on the instrument screen (not Ellvin screen). Each sequence has a clock counting down the duration of the current analysis step. The duration of the analysis step is determined by the instrument settings. (See Section 4.3) The GC TEMP may vary slightly from the set point. Analysis Sequence 1. Cleaning Prior to Sparging: The PC is heated to drive off contaminants (analytes from previous runs). 2. Settle: The PC cools before sparge begins. 3. Sparge and Collect: VOCs are sparged and collected on the PC. 62 CLEANING 4 SETTLE 4 COLLECT 30 SPARGE ON FROG-4000TM User’s Manual 4. Release and Analyze, Settle: The sample flow is switched to the analysis channel. The pressure is allowed to stabilize before the PC fires. 5. PC Fire: The PC is heated and analytes are injected (released) into the GC column and continue through to the PID. 6. Analyzing: The PID measures analytes as they emerge sequentially from the GC. RELEASE AND ANALYZE SETTLE 2 RELEASE AND ANALYZE SPARGE OFF PC 6 RELEASE AND ANALYZE SPARGE OFF ANALYZING 180 7. Chromatogram: The analysis concludes with a chromatogram of the analytes detected. NOTE: the chromatogram does not appear on the display if the FROG is connected to Ellvin. 63 FROG-4000TM User’s Manual 4.6. Running a Sample Continued Analysis Sequence Continued 8. Instrument Estimation: When the instrument is not connected to Ellvin, it makes an estimate of the analytes’ concentrations based on calibration data. Click the yellow start button to scroll through analytes. The two estimates shown in this example are 33ppb Benzene and 63ppb Toluene. The GC retention time for Benzene is displayed as 48.33 seconds. BENZE 33PPB 48.33S Estimate #1 Click the Start Button to see the next analyte estimate. TOL U 63PPB 68.72S Estimate #2 NOTE: The instrument estimates are only available immediately after the corresponding analysis. They are NOT stored on the instrument’s SD card. Complete analysis data is stored on the SD card and can be imported to Ellvin for further analysis. 9. Log File/WAIT: The screen returns to the original display and shows the Log File # for the NEXT analysis. WAIT indicates that the GC temperature is above the lower GC set point. VOC ANALYZER GC TEMP:37C WAIT LOG_017 BTEX V.964 2012 64 FROG-4000TM User’s Manual The FROG is ready for another sample loading and analysis once the GC Temperature indicator appears green and READY is displayed on the FROG screen. VOC ANALYZER GC TEMP:37C READY LOG_017 BTEX V.964 2012 Samples of the same analyte may be run consecutively from low concentration to high without rinsing the instrument and creating a clean baseline. NOTE: Before loading another sample, the user should complete the following procedures: Liquid or Air Sample, perform: 4.4: Instrument Preparation Soil Sample: Remove and discard disposable sparge bottle. If not using a disposable bottle, remove sparge bottle from instrument and fill it with deionized water. Rinse it thoroughly to remove all dirt from bottle. Then, perform: 4.4: Instrument Preparation Continued on next page. 65 FROG-4000TM User’s Manual Final Step: If desired, use Ellvin for detailed results analysis after completing the analysis run. If the sample was run while connected to Ellvin, open the data file in Analyze Window and use Integrator 2. (See Sections 5.2.1 and 5.2.3) If the sample was not run while connected to Ellvin, import the data to Ellvin (Section 4.7), then open the file in Analyze Window and use Integrator 2. 66 FROG-4000TM User’s Manual Section 4: Field and Lab Analysis Procedures Continued 4.7. Importing Data to Ellvin Ellvin allows the user to view live results, change operating parameters, re-plot stored data and overlay data for comparison. It also has tools for integrating peak areas, measuring retention times , and calibrating the instrument. The FROG-4000TM stores data from every analysis on an internal SD card. The following steps describe the process for extracting data from FROG-4000TM for analysis with Ellvin. 1. Connect Port N on the FROG-4000TM to a computer using the USB-Cable. To Computer USB To N USB-Cable N O 2. Turn the instrument on. (O) Continued next page. 67 FROG-4000TM User’s Manual 4.7. Importing Data Continued 3. The computer screen will display an option to “Open folder and view files”. Open the folder. 4. The computer screen now displays a list of sequential files named “LOG_XXX”. The file names are created and assigned by the instrument. They appear on the instrument screen at the beginning of each analysis cycle as shown in Figure 4.7-1. VOC ANALYZER GC TEMP: 40C READY LOG_016 BTEX V. 965 2012 TM Figure 4.7-1: FROG-4000 display screen at the beginning of a sample run. NOTE: If the instrument is NOT connected to Ellvin when running analyses, the user must record the LOG file numbers of sample runs intended for future analysis. The LOG file numbers, as well as the instrument estimates, are only available on the instrument’s screen at the time the sample is run. 5. Select the LOG file of interest and drag/copy it to the computer desktop or other location of user’s choice. 6. Open Ellvin. 7. Open Live Data Window. 8. Click on the OPEN button. 68 FROG-4000TM User’s Manual 9. Browse to the location where the LOG file of interest was dragged/copied. 10. At the bottom of the “Select Data File” window, change “Files of Type” to LOG Files. 11. Select the LOG file of interest and open it. 12. The computer screen now displays a chromatogram of the file data as it is imported into Ellvin. At this time, Ellvin also converts the data to an XML format and stores it. The location path of the stored data is displayed at the top of the chromatogram in the Live Data Window (Figure 4.7-2). The data can now be opened in the Analyze Window. Data Location Path Figure 4.7-2: Live Data Window with chromatogram and data location path. 69 FROG-4000TM User’s Manual 4.7. Exporting Data Continued 12. Open the Analyze Window. The location path for the stored data is also displayed in Analyze Window. 13. Click on the OPEN icon. 14. Follow the location path displayed in the Analyze Window to the folder that contains the data file of interest. Location Path Example: C\Users\.........\............\ 20140930\1716_LOG_xxx.xml The highlighted numbers correspond to the date the storage folder and data file were created by Ellvin. In this example, September 30, 2014. 15. Open the folder with the location path date. 16. The folder contains a list of files. The file names are derived from the time Ellvin converted the data. In the example in Figure 4.7-3, the file named “1716” was converted at 5:16 PM on 9/30/2014. 17. Select the file of interest. 70 FROG-4000TM User’s Manual File name is the Time Folder name is the Date Figure 4.7-3: Data files named and stored by Ellvin. 18. A preview chromatogram of the selected file appears to the right of the file list (Figure 4.7-4). 19. Click “Select” to open the file of interest and proceed to analyze the data with Ellvin Integrator 1 or 2. (See Section 5.2.3) Figure 4.7-4: File Selection Screen 71 FROG-4000TM User’s Manual This page is intentionally left blank. 72 FROG-4000TM User’s Manual SECTION 5: ELLVIN, CHROMATOGRAM ELF SOFTWARE The chromatogram software, Ellvin, is primarily used to perform detailed analyses of sample data. Ellvin uses calibration data to: Assign analytes to chromatogram peaks based on GC retention times. Report the analytes’ concentrations based on peak heights and integrated peak areas. Ellvin also manages the instrument settings and calibrates the instrument. Several general features of Ellvin, as well as a few features specific to Analyze Window, are described in the following pages. The user should be familiar with all the features before starting a sample analysis. Software Features Figure 5-1: Ellvin default screen details. Tabs To start using Ellvin, refer to: 4.2: Connecting to Computer/Ellvin Continued next page. 73 FROG-4000TM User’s Manual Section 5. Ellvin, Chromatogram Elf Software Continued 5.1. FEATURES OF ELLVIN WINDOWS The Chromatogram Elf Software (Ellvin) has four windows that are accessed with tabs when the software is open. Window Tabs in Ellvin Live Data Window: This is the default window for Ellvin. In Live Data Window, Ellvin creates a chromatogram from sample analysis data. The data source may be: a. From a sample run on the FROG while connected to Ellvin and simultaneously imported to Ellvin. b. From sample data previously recorded on the instruments SD card, then imported to Ellvin. Analyze Window: As in Live Data Window, Ellvin creates a chromatogram from sample analysis data. In this window, Ellvin retrieves analysis data that was previously stored on a computer. In Analyze Window the user can examine chromatograms closely, integrate chromatogram peaks, and export data to Excel. Calibration Window: In this window, Ellvin uses analysis data from chemical standards to calibrate the FROG. Settings Window: In this window, Ellvin manages the settings for the FROG. The settings define temperature and duration parameters for various phases of the instrument’s analysis cycle. Refer to: 4.3: Instrument Settings 74 FROG-4000TM User’s Manual PORT Use this feature to select the correct data port connection from the FROG-4000TM. The user selects a COM# to connect to the FROG. Connection Port Based on the selection of COM, the Connection Port will notify the user if the FROG is CONNECTED or DISCONNECTED, and if the parameters have been updated. (Bottom left corner of the software display screen). GC Column Temperature Indicator This feature monitors and displays the GC temperature. The icon is GREEN when instrument is ready for Loading. It turns RED during sample analysis. 75 FROG-4000TM User’s Manual 5.1. Features of Ellvin Continued Start/Stop Button Clicking on this button causes the FROG-4000TM to start an analysis cycle. Once the analysis has begun, clicking the button will stop the analysis, but will NOT save the chromatogram. OPEN Button Click on this button to open saved files. The files can be from data stored on a computer or on the instrument’s internal SD card. EXPORT Export only works when Ellvin is in Analyze Window. The user can export an opened file into Microsoft Excel program for further analysis. 76 FROG-4000TM User’s Manual Chromatogram Display Screen The software display screen shows sample analysis data. The X-axis is time in seconds. The Y-axis shows the instrument’s PID response and GC temperature (oC). The peaks correspond to separated analytes. GC Temperature (C) Instrument PID Response J Time (seconds) Key The Key explains colored lines that are shown on display screen. 77 FROG-4000TM User’s Manual 5.1. Features of Ellvin Continued Sample Notes This tool allows the user to records notes about samples while in Live Data or Analyze Window. The notes are saved when the sample analysis is completed. It is important to record the date and time that data files are created in order to locate and retrieve them for further analysis. Magnifying Glass Use this tool to zoom into a chromatogram while data is being collected in Live Data Window, or while in Analyze Window to help with integration. Detailed instructions for using Magnifying Glass follow in Section 5.2.2. MOVE Use this tool to move the chromatogram up and down the Y-axis. 78 FROG-4000TM User’s Manual Integrator 1 This feature only operates while in Analyze Window. The user creates a baseline and integrates peaks, then calculates the peak height and area. The baseline integration limits are sets by clicking the left mouse button. Integrator 2 This feature only operates while in Analyze Window. Ellvin creates a baseline and integrates peaks, then calculates the peak height and area. Integrator 2 is recommended for the most consistent analysis results. Detailed instructions for using Integrator 2 follow in Section 5.2.3. Data Grid Use with Integrator 1 and 2. The Data Grid shows: Analyte (Toluene) Based on calibration retention times. Peak Reference Number (1) Retention Time (106.157) Peak Height (40291) Peak Area (430363) Calculated concentration (87.31) Based on calibration concentrations. 79 FROG-4000TM User’s Manual Section 5: Ellvin, Chromatogram Elf Software Continued 5.2. APPLYING ELLVIN FEATURES 5.2.1. OPEN BUTTON To open stored files in Analyze Window: Click on the Analyze Tab. Click the OPEN button. A file selection screen appears. (Figures 5.2.1-1 and 5.2.1-2) NOTE: Ellvin automatically labels folders and files as they are created. Folders of data files are labeled by the DATE they were created. Data files are labeled by the TIME they were created. In the example shown in Figure 5.2.1-1, the data file was created at 5:16 PM on September 30, 2014. To locate the data file of interest, browse to the folder labeled with the date the sample was run, or the date the data file was imported from the FROG to Ellvin. Double click to open the folder. Click on a data file of interest. A preview of the data chromatogram appears to the right of the list. Click “Select” to open the file for analysis with Integrator 2. 80 FROG-4000TM User’s Manual Folder name is the Date File name is the Time Figure 5.2.1-1 Data files Figure 5.2.1-2: File Selection Screen 81 FROG-4000TM User’s Manual 5.2. Applying Ellvin Features Continued 5.2.2. MAGNIFYING GLASS The Magnifying Class can be used in Live Data Window during data import, or while in Analyze Window. Click on the magnifying glass icon to start. To Magnify: Left click and hold Drag mouse over desired magnified area. (Figure 5.2.2-1) Release the mouse button. The area being magnified is highlighted light blue. The display screen then readjusts to show the magnified area. (Figure 5.2.2-2). To De-Magnify: Double click left side of mouse on the display area OR click the circle on the scroll bars. OR double click the magnifying glass icon. 82 FROG-4000TM User’s Manual Figure 5.2.2-1: Desired Magnified Area Figure 5.2.2-2: Magnified Area 83 FROG-4000TM User’s Manual 5.2. Applying Ellvin Features Continued 5.2.3. INTEGRATOR 2 Integrator 2 can be used only in Analyze Window. This tool calculates the area under a peak and the peak height. The area or peak height helps determine the concentration of the analyte. Click on the Integrator 2 button to start. Technique to Integrate: (Refer to Diagrams 5.2.3-1 and 5.2.3-2) Begin at the lowest point, Valley 1. Drag the mouse to draw an integration line, past the peak, to the second lowest point, Valley 2. The integration line should NOT cross the data line. Avoiding this ensures the correct calculation for the peak area. (Figure 5.2.3-2). 84 FROG-4000TM User’s Manual Peak Integration Line Valley 1 Valley 2 Diagram 5.2.3-1: Valleys and Peaks Peak Valley 1 Integration Line Valley 2 Diagram 5.2.3-2: Crossing Data Line 85 FROG-4000TM User’s Manual 5.2.3. Integrator 2 Continued Integrating a Single Peak Using the correct technique illustrated on the previous page, select the desired peak for integration. Select Integrator 2. Right click the mouse and hold at Valley 1. Drag to Valley 2 and release. The Integrator 2 tool uses the software to select the baseline on which the integration line is drawn. The highlighted area will show which area is being integrated. (Figure 5.2.3-3) The integration is complete when a solid black line ap- pears. The Data Grid shows the data that corresponds to the related peak. The user can continue integrating peaks. 86 FROG-4000TM User’s Manual Figure 5.2.3-3: Desired Peak Integrated Area 1 Figure 5.2.3-4: Integration Line Data Grid 87 FROG-4000TM User’s Manual 5.2.3. Integrator 2 Continued Integrating Multiple Peaks To integrate multiple peaks, follow the same procedures for integrating a single peak using Integrator 2. Click on the Integrator 2 button to start. Right click and hold the mouse at Valley 1. Drag to Valley 6 and release. The integrator uses Ellvin to select the baseline on which the integration line is drawn. The highlighted area shows which area is being integrated. (Figure 5.2.3-5) The integration is complete when a solid black line appears. The result shows the integration line and the splits placed between joined peaks. (Figure 5.2.3-6) The Data Grid shows the data that corresponds to the related peak. The user can continue integrating peaks. Valley 6 Valley 1 Figure 5.2.3-5: Integrated area is highlighted. 88 FROG-4000TM User’s Manual 1,2 3 8 4 5 6 7 Figure 5.2.3-6: Integration complete. Data Grid 89 FROG-4000TM User’s Manual This page is intentionally left blank. 90 FROG-4000TM User’s Manual SECTION 6: CALIBRATION This section provides detailed instructions for calibrating the instrument. The system is calibrated by testing a series of analytes at varying, known concentrations. As with all GC work, these analytes are selected from an established list of chemicals that are of foremost interest in the environment under investigation. Before beginning a calibration, it is recommended that the user become familiar with Ellvin. Refer to Section 5. The user should also be familiar with analytical techniques for GC calibration. The preparation and use of standards for calibrating the instrument differs for air, liquid, and soil samples. Section 6.1 introduces the procedure for preparing standards. Section 6.2 provides detailed instruction for using the features found in Calibration Window. Section 6.3 provides detailed instructions for calibrating the instrument. 91 FROG-4000TM User’s Manual Section 6: Calibration Continued 6.1. CALIBRATION STANDARDS NOTE: The instruction in Sections 6.1.1 and 6.1.2 correspond to Step B-3 in Section 6.3. 6.1.1. STANDARDS FOR LIQUID OR SOIL SAMPLES Run at least four calibration samples from low to high concentrations. Preparation: 1. Calculate the dilutions for the intended calibration samples. Traditionally, a ppb concentrations of analytes in water are expressed in micrograms of analyte per liter of water (1 Kg water). Standards typically come pre-diluted in methanol, which cannot be ionized (and therefore not detected) by the instrument’s PID. The following page provides examples for calculating dilutions. µg/mL =ppm (mass) ug /L = ppb (mass) BTEX = Benzene, Toluene, Ethylbenzene, p/m-Xylene, o-Xylene 92 FROG-4000TM User’s Manual Diluting from a Standard Using the 2000 µg/mL BTEX in MEOH standard you want to make a 200 µg/mL BTEX in MEOH standard in 5mL MEOH. How much 2000ug/mL BTEX in MEOH is needed to make this dilution? Inject 500uL of the 2000 µg/mL BTEX in MEOH into 5mL MEOH to create a 200µg/mL BTEX in MEOH. Diluting 5mL Water with Standard Convert mL to µL. 5mL water filled syringe into 5000µL Spiking the 5000µL water filled syringe You have a 200ppm BTEX standard. What is the resulting concentration from injecting 2µL of the 200ppm BTEX standard into the 5000µL water filled syringe? 93 FROG-4000TM User’s Manual 6.1.1. Standards for Liquid and Soil Samples Continued Preparation Continued: 2. Fill a syringe with 5mL deionized water. 3. Load a known volume, as calculated on the previous pages, of a liquid standard into the syringe. 4. Connect to Ellvin and follow the sample loading instructions in Section 4.5. 4.5: Loading a Sample 94 FROG-4000TM User’s Manual 6.1.2. STANDARDS FOR AIR SAMPLES Run at least four calibration standards from low to high concentrations. Tools Needed: Tedlar bag Metered pump or 1 Liter, gas-tight syringe 5mL Syringe Disposable needle Deionized water Tedlar bag filled with 1 Liter of compressed nitrogen and syringe with disposable needle attached. Instrument Preparation: Place an empty sparge bottle on the instrument in the UP position. Place the load/analyze-valve in the LOAD position (open). Connect to Ellvin. Continued next page. 95 FROG-4000TM User’s Manual 6.1.2. Standards for Air Samples Continued. Standard Preparation and Loading: 1. Use the ideal gas law to calculate the concentration in ppb of the calibration samples. Calibrating the instrument for air sampling requires converting concentrations in ppb by volume using the ideal gas law. Most standards come in liquid form, and the mass of analyte must be converted into an equivalent volume to determine the concentration on a volume by unit volume basis. In a typical calibration process, a volume of the liquid standard is injected into an air filled 1-liter Tedlar bag, and the analyte in the injection is allowed to come to equilibrium with the air in the bag. If the mass of the analyte in a liquid injection is M1, then the volume of the analyte after reaching equilibrium in the Tedlar bag is: Where: V1 = volume of analyte (L) M1 = mass of analyte (g) R = gas constant = 0.0821 L atm/K mol P = pressure (atm) T = Temperature (K) MW = molecular weight of analyte (g/mol) Once this volume is known, the concentration on a volume/unit volume is: Where: V2 = volume of the dilution gas. In the case of a 1-Liter Tedlar bag filled with air, V2 is 1 L. 96 FROG-4000TM User’s Manual Standard Preparation and Loading Continued: 2. Fill Tedlar bag with one liter air. Use a metered pump or a 1 liter, gas-tight syringe. 3. Load Tedlar bag with a volume of liquid standard. The concentration in ppb(v) has been calculated and recorded. (See previous page) 4. Let the Tedlar bag to rest for five minutes to equilibrate the gases. 5. Attach a disposable needle to the empty 5mL syringe. Insert the needle into septa of Tedlar bag and draw up 5mL air. Immediately after drawing up 5mL Air, 6. Remove the needle and syringe from the septa on Tedlar bag. 7. Remove the disposable needle Insert syringe with needle from the syringe and attach the into septa of Tedlar bag. syringe to the sample inlet of the Draw up with 5mL of air. instrument. 8. Load the air sample into the instrument. 9. Immediately after the loading, place the load/analyze-valve in the ANALYZE position (closed). 10. Press the start button and run sample. Refer to: 4.6: Running A Sample 11. Repeat for other sample concentrations. 97 FROG-4000TM User’s Manual Section 6: Calibration Continued 6.2. ELLVIN CALIBRATION WINDOW FEATURES To start using Calibration Window, open Ellvin and click on the Calibration Tab. 6.2.1. LIST OF ANALYTES This feature allows the user to create a List of Analytes that may be used to calibrate the instrument. The analyte names in the List of Analytes will later be associated with analyte peaks from calibration standard runs. (See Figure 6.2.1) The Retention Time, Peak Height, and Peak Area in Figure 6.2.1 are generated from previous analyses of standard solutions with known concentrations. Figure 6.2.1: List of Analytes 98 FROG-4000TM User’s Manual Create the List of Analytes Enter the name of the calibration analyte you desire to add in the “Analyte Name’ window. Create and enter an abbreviated name for the analyte in the ‘Analyte Alias” (maximum of 5 Characters). The Analyte Alias will be displayed on instrument screen. To make an addition to the List of Analytes, click the ADD button. To delete an analyte from the list, click on the analyte in the List of Analytes. The desired analyte will be highlighted blue when selected. Click Delete on keyboard to delete the analytes from the list. 99 FROG-4000TM User’s Manual 6.2. Calibration Window Features Continued 6.2.2. CORRELATION CHART AND EQUATIONS This feature in the Calibration Window displays the degree of correlation between analyte standards of varying concentrations and the instrument’s response to them. (See Figure 6.2.2) The correlation is calculated as both a linear equation and a 2nd order quadratic equation. The user may choose to view the equations and a chart for either Peak Area correlation or for Peak Height correlation. This correlation is important because Ellvin uses these parameters to calculate concentrations for future samples. 100 Figure 6.2.2: Correlation Equations and Chart FROG-4000TM User’s Manual 101 FROG-4000TM User’s Manual Section 6: Calibration Continued 6.3. CALIBRATION PROCEDURE The Calibration Procedure consists of running a series of analysis cycles with standards of varying concentrations for a given analyte. Ellvin then uses the analysis data for the standard solutions to calibrate the instrument. Before beginning a calibration, the user should be familiar with: 4.3: Instrument Settings 4.4: Instrument Preparation 4.5: Loading a Sample 4.6: Running A Sample And, Using Ellvin. (See Section 5) 102 FROG-4000TM User’s Manual It is recommended to run a minimum of four standards, from low to high concentration, to create data points for calibrating the instrument. The concentration range for calibration standards depends on the analyte and its unique retention time. Example standards concentrations for a calibration: 2, 10, 50, 100ppb. Calibration Procedure Steps A. Add the Calibration Analytes to the List of Analytes. (See Section 6.2.1) The steps in this section prepare the software to calibrate using selected analytes. A-1 Open the Calibration Window. A-2 Begin by adding each of the analytes chosen for calibration, one at a time, to the Analyte List. (See Section 6.2.1) No data will be displayed and the chart display area will be blank. Disregard any equations displayed. Continued on Next Page 103 FROG-4000TM User’s Manual 6.3. Calibration Procedure Continued B. Run the Calibration Standards In this section the calibration samples are loaded and instrument response data is stored. Open the Live Data Window B-1. Create a clean baseline before running any calibration samples. Refer to: 4.4: Instrument Preparation B-2. To begin the calibration, load and run a sample containing only deionized water. Refer to: 4.5: Loading a Sample 4.6: Running A Sample B-3. Load and run a minimum of four calibration standards of the selected analytes. The samples should be of varying concentrations and should be run in order from low to high concentrations. See Section 6.1 for sample preparation. B-4. For each of the calibration standards, record the concentrations in the Sample Notes window. This will help identify the files during analysis and calibration. 104 FROG-4000TM User’s Manual After the instrument has completed running the four (or more) calibration standards, go to the Analyze Window in Ellvin to analyze the instrument response data. C. Analyze the Data In this section Ellvin analyzes the stored instrument response data to create the information needed for calibration. Open the Analysis Window C-1. Click on the OPEN button to access a list of previously run sample files. (Figure 6.3-1) (See Section 5.2.1 for details) C-2. Select the calibration sample file desired for data analysis. The files are labeled by the time they were created. Figure 6.3-1: Open Sample Files 105 FROG-4000TM User’s Manual 6.3. Calibration Procedure Continued C-3. In the Analyze Window, click on the Integrator 2 button to integrate the sample peaks in the chromatogram. (Refer to Section 5.2.3 for detailed instructions on using the Integrator 2) The results of the data analysis are displayed on the chromatogram and in the Data Grid. (Figure 6.3-2) The example shown in Figure 6.3-2 is for a sample of BTEX. Analytes may be run one at a time to determine or confirm retention times. Figure 6.3-2: Analysis Chromatogram and Data Grid 106 FROG-4000TM User’s Manual D. Calibrate the Instrument In this section the data analyzed in Section C is transferred to the Calibration Window. Ellvin uses the data to calibrate the instrument for each analyte. D-1. To transfer data to the Calibration Window: Right click the Data Grid. The List of Analytes previously recorded in the Section A of the Calibration Procedures appears. D-2. Use the Analyte drop down list to select the analyte that corresponds to each peak based on retention time. Match all the peaks with an analyte. In the example shown in Figures 6.3-3 and 6.3-4, benzene is selected for Peak #1 because in previous single-analyte tests, benzene had a retention time of 52 seconds. NOTE: Retention times are dependent on instrument and temperature profile, and will vary from instrument to instrument. Benzene Figure 6.3-3: Assigning Analytes to Chromatogram Peaks 1 Figure 6.3-4: Benzene is Selected for Peak #1. 107 FROG-4000TM User’s Manual 6.3. Calibration Procedure Continued D-3. To view the imported data, open the Calibration Window, click on List of Analytes, and select the desired analyte. The imported data for this analyte will be displayed In the example in Figure 6.3-5, Benzene has been selected. Figure 6.3-5: Select the Desired Analyte from the List of Analytes D-4. In the Calibration Window, enter in the corresponding concentration for the calibration standard in the column titled “Concentration”. Standard concentrations were recorded in the Sample Notes window in Section B of the Calibration Procedures. (See B-4) 108 FROG-4000TM User’s Manual Repeat Steps C-1 through D-4 of the Calibration Procedures to import and enter all the standard data to the Calibration Window. The Correlation Chart and Equations (Section 6.2.2) will NOT appear until three different concentrations per analyte are imported into the Calibration Window. Once three or more calibration data points are complete, correlation equations are generated by the Ellvin. A graph of the data points and the curve fit will be displayed in the calibration window for the user to inspect the fit equation. Downloading the Calibration to the Instrument Connect the instrument to Ellvin with the USB cable. Refer to: 4.2: Connecting to Computer/Ellvin 1. All analytes listed in the calibration should show a R2 correlation close to 1.0. The closer the R2 value is to 1.0, then the better the software can calculate the concentration of an unknown sample. 2. Open the Settings Window. Continued next page. 109 FROG-4000TM User’s Manual 6.3. Calibration Procedure Continued 3. Click on ‘Download Calibration to Device’ 4. This will allow the instrument to estimate the concentration of analytes uploaded into the calibration using the peak height linear function. NOTE: The Ellvin software can compute concentrations using either peak height or area under the peak. However, when the instrument is running independently, its processing power is more limited, so peak height is used in the calibration. 110 FROG-4000TM User’s Manual SECTION 7: MAINTENANCE 7.1. ROUTINE CLEANING It is important to clean the FROG-4000TM after analyzing samples in order to prevent cross-sample contamination. The FROG-4000TM does need to be cleaned if: More than one type of analyte is being tested. The user must clean the instrument between sets of the different analytes. The FROG-4000TM does NOT need to be cleaned immediately if: Same analyte is being tested. The user can run a set of samples of the same analyte from a LOW concentration to a HIGH concentration consecutively. The user cleans the instrument at the end of the set. Rinsing the sparge bottle and syringe between uses is always recommended. To clean the instrument, perform the following procedures: 4.4: Instrument Preparation The instrument is clean when a clean baseline has been achieved. 111 FROG-4000TM User’s Manual Section 7: Maintenance Continued 7.2. ANNUAL CLEANING It is recommended to have the FROG-4000TM cleaned yearly by an authorized representative. Please contact Defiant Technologies for support. Email: [email protected] Phone: 505-999-5880 7.3. CLEANING THE SCRUBBER It is recommended to clean the carrier gas scrubber every three months, or as needed to create a clean baseline. Tools needed to clean the scrubber include: 1. *Clean Activated Carbon 2. *Clean Molecular Sieves 3. 3/32” allen wrench Figure 7.3-1: Tools needed. *NOTE: Replacement activated carbon and molecular sieves may be purchased, premeasured and cleaned, through Defiant Technologies, Inc. Activated Carbon, Part # DT-FG4K-AC-1 Molecular Sieves, Part # DT-FG4K-MS-1 112 FROG-4000TM User’s Manual 1. Remove the four corner 4-40 screws with the 3/32” allen wrench. 2. Lightly pull scrubber off FROG; place any O-rings back in place if they come out. Figure 7.3-2: Four corner screws removed and scrubber removed from FROG 3. Turn the scrubber block upside down. Position 1 has widely spaced ports. This chamber holds the molecular sieves. Position 2 has narrowly spaced ports. This chamber holds the activated carbon. Position 1 Position2 Position 1 Position 2 Figure 7.3-3: Upside down scrubber with ports visible. 113 FROG-4000TM User’s Manual 7.3. Cleaning the Scrubber Continued 4. Turn the scrubber right-side up and remove the two, center position, 4-40 screws with the 3/32” allen wrench. Figure 7.3-4: Two Center Screws. 5. Remove the scrubber lid; put any O-rings back in place if they come out. Position 1 Position2 Figure 7.3-5 Open scrubber 114 FROG-4000TM User’s Manual 6. Dispose of dirty activated carbon and molecular sieves. 7. Use a paper funnel to put new activated carbon into Position 1. 8. Use a paper funnel to put new molecular sieves into Position 2. 9. Replace the lid. 10. Tightly replace the two, center position, 4-40 screws with the 3/32” allen wrench. 11. Place the scrubber back onto FROG (make sure Position 1 is in correct spot). 12. Snuggly replace the four corner 4-40 screws with the 3/32” allen wrench. 13. There should be NO space in between the scrubber holder on the instrument body and the scrubber block! (Figures 7.3-6 and 7.3-7) 14. To fix space in between, remove the block and make sure O-rings are in the proper position. No Space Space Figure 7.3-6: Correct scrubber position. 115 Figure 7.3-7: Incorrect scrubber position. FROG-4000TM User’s Manual This page is intentionally left blank. 116 FROG-4000TM User’s Manual SECTION 8: TROUBLE SHOOTING 8.1. INVERTING THE FROG WITH WATER IN THE SPARGE BOTTLE If the FROG has been inverted with water in the sparge bottle, it is likely that water will enter the sparge manifold. Scrubber Sparge Manifold The steps on the following pages can be used to remove the water. 117 FROG-4000TM User’s Manual 8.1. Inverting the FROG Continued 1. Remove the scrubber. Look for liquid in Position 1 or Position 2 on the sparge manifold. Sparge Figure 8.1-2: Look Manifold for liquid. 2. Turn the load/analyze valve to the ANALYZE position. ANALYZE 3. With the scrubber removed, install an empty sparge bottle. Figure 8.1-3: Close the valve to the ANALYZE position 118 FROG-4000TM User’s Manual 4. Press the start button on the FROG and allow the system to run through the sparge stage of the analysis cycle (a sparge cycle). Turn the FROG off when the screen displays SPARGE OFF. COLLECT 30 SPARGE ON RELEASE AND ANALYZE SPARGE OFF PC 6 Refer to: 4.6: Running A Sample 5. After the sparge cycle, power the unit down and look for water where the scrubber mounts on the sparge manifold (Figure 8.1-2, Positions 1 and 2). Repeat Steps 2 through 5 until water no longer emerges from the sparge manifold. 119 FROG-4000TM User’s Manual 8.1. Inverting the FROG Continued 6. Replace the activated carbon and molecular sieves in the scrubber, then reinstall the scrubber block. (See Section 8.1.3, Cleaning the Scrubber for procedure details) 7. Load a blank sample (deionized water) and run a third Sparge Cycle. Look for bubbles in the sparge bottle. If bubbles appear, the liquid was successfully removed from the sparge manifold. If bubbles do not appear, then contact Defiant consultation. Technologies for Email: [email protected] Phone: 505-999-5880 Figure 8.1-4: Look for Bubbles in the sparge bottle. 120 FROG-4000TM User’s Manual Section 8: Troubleshooting Continued 8.2. DEGRADING CHROMATOGRAPHY : SCRUBBER IS NOT SECURED PROPERLY If the Chromatography is degrading over time: Check the scrubber block. The scrubber block may NOT be sealed correctly. There should be no space in between the scrubber block and the scrubber holder. (Figures 8.2-1 and 8.2-2) (Refer to Section 8.1.3, Cleaning the Scrubber) No Space No Space Space Figure 8.2-2: Incorrect scrubber position. Figure 8.2-1: Correct scrubber position. Performance can also be affected by high concentrations of analytes, or high background concentrations in the surrounding environment (See next section). 121 FROG-4000TM User’s Manual Section 8: Troubleshooting Continued 8.3. CANNOT ACHIEVE A CLEAN BASELINE If a clean baseline cannot be achieved after repeatedly following the procedures in Sections 4.4.1 and 4.4.2 (Rinsing the Instrument and Creating a Clean Baseline), contamination problems may stem from having loaded a sample with a high concentration of analyte, or from the presence airborne contaminants. NOTE: A small peak at the beginning of the chromatogram is normal for a clean baseline. Complete the following procedures to eliminate contamination interfering with a clean baseline. Perform procedure 4.4 while connected to Ellvin and using warm deionized water. Refer to: 4.4: Instrument Preparation Repeat this procedure up to three times if necessary to achieve a clean baseline. Airborne Contaminants If it is still NOT possible to achieve a clean baseline, there may be airborne contaminants present in the ambient air. An airborne contaminant can enter the sparge bottle when it is lowered. This volume of air cannot be scrubbed and will be collected by the PC. Airborne contaminants can also enter through the pump with the sparge and carrier gas. 122 FROG-4000TM User’s Manual Solutions: 1. Either circulate air in the testing environment, or move to a new location, then perform: 4.4: Instrument Preparation If, a clean baseline is still not achievable, 2. Clean the scrubber. (See Section 7.3) If, a clean baseline is still not achievable, 3. Provide and activated charcoal trap at the pump inlet (V). V 123 FROG-4000TM User’s Manual Section 8: Troubleshooting Continued 8.4. BLACK INSTRUMENT SCREEN Periodically, the instrument display screen will appear black. However, it should reset to appear normal at the end of an analysis run. If the display screen on the FROG remains black, it can be a sign that the instrument is overheating. Take the following steps to cool the FROG: Place instrument in the shade or indoors to help cool the GC Temp to READY status. 2. Increase the initial cold GC temperature, Ct, to a maximum of 50 oC. a. Go to Settings Window. Refer to: 4.3: Instrument Settings b. Change GC initial cold temperature (Ct) to the following range: minimum of 40oC maximum of 50oC (Figure 8.3-1) c. Click “SET” to save changes. 124 FROG-4000TM User’s Manual Figure 8.3-1: Change the GC Settings. NOTE: Increasing GC Temp will affect retention times. The instrument will operate within temperature and relative humidity conditions of 0-55oC and 0 to 90% respectively; however, an environment comfortable for human habitation (reasonable constant temperature and humidity conditions) is recommended for optimum performance. 125 FROG-4000TM User’s Manual This page is intentionally left blank. O 126 FROG-4000TM User’s Manual APPENDIX I: AVAILABLE ACCESSORIES/SPARE PARTS Item Defiant Part # Description DT-FG4K-AC-1 Replacement Activated Carbon for FROG 4000 air scrubber. Pre-measured and pre-cleaned. DT-FG4K-MS-1 Replacement Molecular Sieves for FROG 4000 air scrubber. Pre-measured and pre-cleaned. DT-FG4K-SBGN-1 Sparge Bottle with globe neck. DT-FG4K-SBN-1 Nut to connect Sparge Bottle to instrument. DT-FG4K-SB6P-1 Disposable Sparge Bottle 6 Pack (These items require the disposable sparge bottle adapter.) DT-FG4K-SBA-1 Disposable Sparge Bottle Adapter (For use with the disposable sparge bottles.) Activated Carbon To N Molecular Sieves Sparge Bottle Sparge Bottle Nut Disposable Sparge Bottles Disposable Sparge Bottle Adaptor 127 FROG-4000TM User’s Manual APPENDIX I: AVAILABLE ACCESSORIES/SPARE PARTS Item Defiant Part # Description DT-FG4K-SYGG-1 5mL glass syringe with Luer Lock tip. DT-FG4K-SYGP-1 5mL plastic syringe with Luer Lock tip. DT-FG4K-SYGN-1 60mL syringe with Luer Lock tip for rinsing Sparge Needle. DT-FG4K-LL-1 Attachment for syringe. DT-FG4K-WTB-1 Water Trap Bottle with Insert. DT-FG4K-TK-1 Assorted tools for maintenance of FROG-4000. 5mL Glass Syringe 5mL Plastic Syringe 60mL Rinsing Syringe Luer Lock Inlet Water Trap Tool Kit 128 FROG-4000TM User’s Manual APPENDIX I: AVAILABLE ACCESSORIES/SPARE PARTS Item Defiant Part # Description Battery To N DT-BT-NIMH9V5K -1 Rechargeable NiMH Battery 9V, 5000 mAhr Serial Data Cable DT-DC-1 Ellvin (software) communication cable. USB Cable DT-USB-1 Cable USB A / MINI B ASSY stored data import cable. Power Supply DT-PS9V3A-1 FROG-4000 Power Supply, 9V 3A DT-BTCHG-1 Nickel-metal hydride battery charger. DT-FG4KHL-1 Holster for holding sparge bottles and syringes. Battery Charger 129 FROG-4000TM User’s Manual This page is intentionally left blank. 130 FROG-4000TM User’s Manual APPENDIX II: DETECTABLE CHEMICALS Common Chemicals Detectable by FROG 4000 CAS Number IE (eV) 1,1-Dichloroethene 75-35-4 10.0 1,2,4-Trichlorobenzene 120-82-1 9.0 1,2-Dibromoethane 106-93-4 10.4 1,2-Dichlorobenzene 95-50-1 9.1 1,3-Dichlorobenzene 541-73-1 9.1 1,4-Dichlorobenzene 106-46-7 9.0 1,4-Dioxane 123-91-1 9.2 1-Propanol 71-23-8 10.2 2-Butanone (MEK) 78-93-3 9.5 2-Chloroethanol 107-07-3 10.5 2-Hexanone 591-78-6 9.4 2-Pentanone 107-87-9 9.4 2-Picoline 109-06-8 9.4 2-Propanol 67-63-0 10.2 4-Methyl-2-pentanone 108-10-1 9.3 Acetone 67-64-1 9.7 Acrolein 107-02-8 10.1 Allyl alcohol 107-18-6 9.6 Allyl chloride 107-05-1 10.1 Benzene 71-43-2 9.2 Benzyl chloride 100-44-7 9.1 Bromoacetone 598-31-2 9.7 Bromodichloromethane 75-27-4 10.6 Bromoform 75-25-2 10.5 Bromomethane 74-83-9 10.5 Carbon disulfide 75-15-0 10.1 Chlorobenzene 108-90-7 9.1 Chlorodibromomethane 124-48-1 10.6 Chloroethane Chloroprene 75-00-3 126-99-8 10.0 8.8 131 FROG-4000TM User’s Manual APPENDIX II: DETECTABLE CHEMICALS CONTINUED Common Chemicals Detectable by FROG 4000 CAS Number IE (eV) 4170-30-3 9.7 Dibromomethane 74-95-3 10.5 Diethyl ether 60-29-7 9.5 Diisopropyl ether (DIPE) 108-20-3 9.2 Epichlorohydrin 106-89-8 10.6 Ethanol 64-17-5 10.6 Ethyl acetate 141-78-6 10.0 Ethyl tert butyl ether 637-92-3 9.4 Ethylbenzene 100-41-4 8.8 Ethylene oxide 75-21-8 10.6 Iodomethane 74-88-4 9.5 Isobutyl alcohol 78-83-1 10.1 Isopropylbenzene 98-82-8 8.8 Methacrylonitrile 126-98-7 10.3 Methyl methacrylate 80-62-6 9.7 Methyl tert-butyl ether 1634-04-4 9.2 m-Xylene 108-38-3 8.6 Naphthalene 91-20-3 8.1 n-Butanol 71-36-3 10.0 Nitrobenzene 98-95-3 9.9 n-Propylamine 107-10-8 8.8 o-Toluidine 95-53-4 7.4 o-Xylene 95-47-6 8.6 Propargyl alcohol 107-19-7 10.5 p-Xylene 106-42-3 8.5 Pyridine 110-86-1 9.3 Styrene 100-42-5 8.4 t-Butyl alcohol 75-65-0 10.3 Tetrachloroethene Toluene 127-18-4 108-88-3 9.3 8.8 Crotonaldehyde 132 FROG-4000TM User’s Manual APPENDIX II: DETECTABLE CHEMICALS CONTINUED Common Chemicals Detectable by FROG 4000 CAS Number IE (eV) trans-1,2-Dichloroethene 156-60-5 9.7 Trichloroethene 79-01-6 9.5 Vinyl acetate 108-05-4 9.2 Vinyl chloride β-Propiolactone 75-01-4 57-57-8 10.0 9.7 NOTE: This list is by no means exhaustive. The FROG-4000TM uses a 10.6eV lamp, so many analytes with activation energies below 10.6eV may be detectable with the instrument. 133 FROG-4000TM User’s Manual Notes 134 FROG-4000TM User’s Manual Notes 135 FROG-4000TM User’s Manual Notes 136