1
Iqsim-user manual v.2.0
2010.11.30
IQSim
USER MANUAL
1 of 45
Iqsim-user manual v.2.0
2010.11.30
2 of 45
List of Content
Introduction............................................................................................................................ 3
The idea.........................................................................................................................3
System Requirements:.................................................................................................. 3
Project Lead Organization:........................................................................................... 3
Participating organizations:...........................................................................................4
Start the system...................................................................................................................... 6
General user input.................................................................................................................. 7
Different alternative simulations............................................................................................ 8
A
Material composition..........................................................................................8
A – B – C Material composition versus hardness and cooling rate...........................8
D - E Geometrical properties........................................................................................ 8
D – E – F Geometrical properties versus welding costs............................................... 8
G – H Welding parameters versus hardness and cooling time......................................9
I - J – K – L Geometry and welding parameters versus welding costs......................9
Evaluation and its consequences.................................................................................10
Moving the icons in the canvas............................................................................................ 11
Evaluation of the chemical composition.............................................................................. 12
Evaluation of the weld geometry..........................................................................................15
General input for the bevel data........................................................................................... 17
BUTT WELD – I-Bevel....................................................................................................... 19
BUTT WELD - V-Bevel......................................................................................................20
BUTT WELD - X-Bevel..................................................................................................... 21
FILLET WELD.................................................................................................................... 22
Welding Parameters..............................................................................................................23
Welding parameters and HAZ/cooling time.........................................................................25
HAZ and cooling time.......................................................................................................... 26
Economic evaluations...........................................................................................................31
Administration of material data............................................................................................34
References................................................................................................................................. 35
For calculation of HAZ and cooling time:................................................................................ 35
Calculation of preheat: EN1011-2.............................................................................................35
Appendix A............................................................................................................................... 36
Appendix B.............................................................................................................................. 45
Iqsim-user manual v.2.0
2010.11.30
3 of 45
Introduction.
The idea.
The idea behind the IQSim project is that teachers and students need to evaluate a set of parameters in order
to find out which parameters are the most important to focus on, in a given context.
The IQSim tool is consequently a dynamic tool to be used in an evaluation process. It is not intended as a
tool for calculating a specific result, instead the tools should be used to ask questions like: What happens if I
select this parameter instead of another ?
IQSim is a tool for evaluation of consequences within the welding sector. That means we have been
interested in asking: What happen if ….??. From a pedagogical point of view we want the students to
make modifications and evaluate the consequences that these modifications will produce. This means we
are not interested in the exact answer, but in the differences or relations that the modifications will give.
This is a tool developed through the IQSim project. This project is sponsored by the Leonardo pilot Project
programme within the EU.
NOTE: This manual has been written for potential users of the program. However it is assumed that
the user has the basic knowledge of welding. All welding terms and expressions herein are NOT
explained. A person unfamiliar with welding may therefore face difficulties with some of the
expressions and the logic.
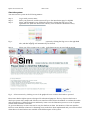
iQSim develops and disseminates a new generation of simulation services that will generate new training
methodologies that are applicable to European wide mechanical industry sectors. The on-line simulator
services that are interconnected to state-of-the art Computer Algebra Services (CAS) provide easy to use
graphical interfaces that optimize cost- and time effective transfer of industrial production process and
technology know-how to VET students. The combination of new pedagogical methodologies and simulator
services, extend existing training methods.
Partnership:
The IQSim consortium has a large industrial presence with strong ties to research within utilisation of new
pedagogical methodologies (HiST), development of simulator tools that utilise CAS tools (HCR and UTH),
and connections towards mechanical industry (HiST, CFL, KU and MHtE) for effective delivery of instructor
training. HiST offers expertise in distance learning methodologies, blended learning, and visual
communication and collaboration services.
For Teachers:
Please note that the IQSim tool can be operated on a Smartboard (Tm)(digital pressure sensitive board)
together with the other Smartboard tools. The sliders and icons can then be operated tapping on the
Smartboard surface.
A set of Teacher Use Cases have been developed in order to help the teacher formulating different questions
to the students. This document can be obtained from the project organization.
System Requirements:
Web browser, preferably Firefox 3.5+, Internet Explorer 7+,
Adobe Flash 10+ plug-in must be installed
Project Lead Organization:
Sør-Trøndelag University College, Faculty of Technology , Norway
Iqsim-user manual v.2.0
2010.11.30
4 of 45
Participating organizations:
•
•
•
•
•
HiST Contract Research, Norway
Centrum för flexibelt lärande (CFL), Sweden
Hungary Magyar Hegesztéstechnikai és Anyagvizsgálati Egyesülés (MhtE) , Hungarian Association
of welding and Material testing , Hungary
Klaipeda University, Faculty of Marine Technology , Lithuania
University of Thessaly, Greece
Iqsim-user manual v.2.0
2010.11.30
5 of 45
Iqsim-user manual v.2.0
2010.11.30
6 of 45
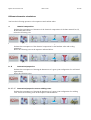
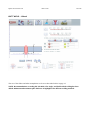
Start the system
You enter into the system in the following manner:
Step 1.
Step 2.
Step 3.
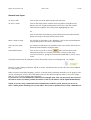
Log in with you user name
Enter your password, and the system will go to the introduction page for IQSIM.
Select which language to use within the system by clicking the flag icon on the
right hand side. (This also defines the currency to be used in the calculations later)
Fig 1.
Select which language to use within the system by clicking the flag icon on the right hand
side, and that language will automatically be selected.
Step 4.
Select one of the system icons, or tabs, in the banner area to proceed with an action.
Fig 2. Select an action by clicking on one of the graphical icons or tabs in the border to proceed.
Please note that the IQSim system is designed for educational purposes. The key objective has been to
develop a system with a simple and effective user interface which allows the students to evaluate the results
and consequences of different decisions and thereby learn to see the fabrication process as a set of separate
actions which influence each other.
To get exact data may in some cases not be easy, but that has not been the intention of this user interface.
However some different solutions for obtaining exact results have been implemented and you will be notified
when these tools and facilities are available in the different parts of the system.
Iqsim-user manual v.2.0
2010.11.30
7 of 45
General user input.
To select a task
Click on the icon in the frame and the task will open.
To move a slider
Click on the slider pointer with the left mouse button. Drag the mouse
button to the left or right and the pointer will follow. Note that a small
information box appears above the pointer, highlighting its value.
Or:
Click on the slider at an arbitrary point with the left mouse button and the
pointer will jump to the point selected at the slider.
Move a slider in steps
For selection of electrode or wire diameters, click on the relevant diameter
value and the pointer will move to that diameter.
Select an exact value
box
For chemical composition it is possible to enter exact values in the text box
beside the slider instead of using the slider.
Activate/Deactivate
Click on the icon (yellow colour)
and it will deactivate some
information and the icon will then turn white. Clicking on the white
icon will reactivate it, giving the icon and associated tasks a yellow, active,
colour.
Calculated results from the simulation will be shown with yellow colour background, for example:
However, in the welding calculations and the economic calculations other colour codes are used in addition
for clarity purposes.
When you have selected the language, you have to decide which evaluations and tasks you are going to carry
out. By selecting one of the icons in the banner area you have different options either to carry out a single
task or to carry on with multiple task simulations.
If you want to carry out simulations which involves multiple tasks, then you may freely move between
the tasks in order to evaluate possible alterations on-the-fly. All datasets will be updated immediately.
NOTE: If you are using a Smartboard for communication with the system, then tap on an icon or
select a slider pointer and drag it across the slider. The system is optimized for use with a Smartboard.
Iqsim-user manual v.2.0
2010.11.30
8 of 45
Different alternative simulations
You have the following options to select sequences and combine tasks:
A
Material composition.
Evaluate the consequences of alteration of the chemical compositions of the base material for CE,
PCM values and so forth.
Select the following icon:
A–B–C
Material composition versus hardness and cooling rate
Evaluate the consequences of the chemical composition for the hardness value and cooling
parameters.
Select the following icons in the sequence indicated below.
D-E
Geometrical properties.
Evaluate the consequences of altering the dimensions of a given joint configuration for weld metal
requirements.
Select the following icons:
D–E–F
Geometrical properties versus welding costs.
Evaluate the consequences of altering the dimensions of a given joint configuration for welding
costs. Select the following icons in the sequence indicated below
.
Iqsim-user manual v.2.0
G–H
2010.11.30
9 of 45
Welding parameters versus hardness and cooling time.
Evaluate the consequences of altering the welding parameters for the hardness and cooling.
Select the following icons in the sequence indicated below.
I- J–K–L
Geometry and welding parameters versus welding costs.
Evaluate the consequences of altering the welding parameters for the welding costs.
Select the following icons in the sequence indicated below.
Please NOTE: Altering the welding parameters do not calculate the filler deposition !!
If you want to alter some of the previous settings, then move back to the icon where the settings are
specified, carry out the alterations and move back to the icon where you want to evaluate the consequences
of the previous alteration.
You may also, during the simulation, decide to view two sessions or tasks, in parallel. That means you may
choose to see the influence of altering the welding details on the HAZ values and the temperature curve for
cooling time.
For example, the HAZ icon may be dragged into the canvas and scaled to the size you want.
Each of the sessions may be scaled individually.
Later you may choose to put one of the icons back into the frame where the other icons resides in order to
continue with one dataset only.
Iqsim-user manual v.2.0
2010.11.30
10 of 45
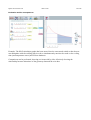
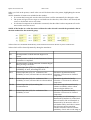
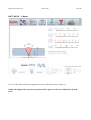
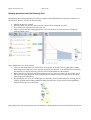
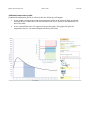
Evaluation and its consequences.
Example. The HAZ calculation graphs has been moved into the canvas and scaled so that the user
can manipulate with the welding data in order to simultaneously monitor the result on the cooling
time (and temperature curve) and Vickers hardness.
Comparisons can be performed, showing two items side by side, effectively showing the
relationship between alterations of the geometry data and the cost data.
Iqsim-user manual v.2.0
2010.11.30
11 of 45
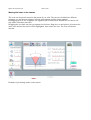
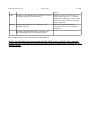
Moving the icons in the canvas
The icons can be moved around in the canvas if you wish. The canvas is divided into different
segments, top and bottom segment, left and right segment and the centre segment.
By dragging an icon into a segment, the segment will circumscribed. Release the icon and it will
stay where it has been moved to.
Dragging the icon back into the top segment can be done. Drag the icon and place it in between the
other icons and see that a box will be highlighted, then release the icon. The icon will then be
inserted
Example of presenting results on the canvas.
Iqsim-user manual v.2.0
2010.11.30
12 of 45
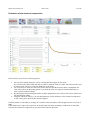
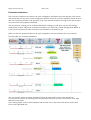
Evaluation of the chemical composition
In this window you have the following options:
1. You can select which material to use by scrolling and selecting from the menu.
You can move the sliders back and forth in order to reach the value you want. The selected value will
be shown in the value box on the left hand side of the slider
2. You can choose to insert the value itself in the value box and then use the slider to manipulate the
value. This can be an interesting option if you need the value for a specific material data sheet or
from a specific material charge.
3. By entering the data and using the sliders for data manipulation, the values in the yellow result boxes
will dynamically update.
4. Using the sliders as controls, you can simultaneously see the influence of the chemical composition
on the cooling curve between 800 and 500 degrees.
Grab the pointer on the slider by clicking on it with the left mouse button. Then drag the mouse to the left or
right.
If the slider has no value in the value box on the left hand side and no marking or indications on the slider
line, then this chemical composition is not valid for the material specified.
Iqsim-user manual v.2.0
2010.11.30
13 of 45
When you click on the pointer, a small value icon will be shown above the pointer, highlighting the current
value.
NOTE: A number of features are included in this window:
• If a comma has been typed into the value field, then it will be automatically be changed to a dot.
• The system will give an error sign, as a red border in the value box, if the value is not allowed, and
coerce to the default min or max value.
• If a chemical component is not defined in a material, then the slider for that component will not be
active and it can not be moved.
NOTE: If the border in a value box turns red then the value selected is outside the permitted value in
the ISO standard for that material group.
Values which are calculated automatically in the material section are shown in yellow result boxes.
Values which will be altered dynamically during the simulation :
AC1
The temperature at which austenite begins to be
formed
AC3
The temperature at which the transformation of ferrite
to austenite is completed.
Ms
The temperature at which martensite formation begins
during cooling of austenite.
CE I
Carbon Equivalent (CE) for evaluation of the
weldability of steel, according ISO 1011
CE II
Carbon Equivalent (CE) for evaluation of the
Alternative algorithm defined by
weldability of steel, reference ISO 1011-but modified N.Yurioka. Corrections for chemical
composition
CE III
Carbon Equivalent (CE) for evaluation of the
Alternative algorithm defined by
weldability of steel, reference ISO 1011-but modified N.Yurioka. Corrections for chemical
composition
CE IIW
Carbon Equivalent (CE) according IIW
recommendations
This carbon equivalent satisfactorily
evaluates weldability whose carbon
content is higher than 0.12%.
CET
Carbon Equivalent (CE) for evaluation of the
weldability of steel
Alternative algorithm defined by
N.Yurioka. Corrections for chemical
composition
CEen
Susceptibility to cold cracking is
determined by hardness of welds (HAZ
and weld metal). The weld hardness is
determined by an interactive effect of
weld harden-ability and carbon content..
The following carbon equivalent
considers this effect and can evaluate
weldability of steel with a wide range of
Iqsim-user manual v.2.0
2010.11.30
14 of 45
carbon.
PCM
Parameter Crack Measurement, substitutes Ce values
for carbon contents lower than 0.12%
CEWES Carbon Equivalent (CE) for evaluation of the
weldability of steel
Modern low alloy steel is mostly of a
carbon reduced type (C <= 0.12wt%).
Weldability of this type of steel is more
adequately evaluated by the following
carbon equivalent.
Alternative algorithm defined by
N.Yurioka. Corrections for chemical
composition
Alternative algorithm defined by N.Yurioka. See:
http://homepage3.nifty.com/yurioka/exp.html
For Formulas used for the calculations, see Appendix A
NOTE: All calculations are based on material ISO 15608, Group 1 ONLY. Other material
groups can not be added in the current version due to the use of algorithms optimized for this
material group.
Iqsim-user manual v.2.0
2010.11.30
15 of 45
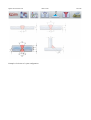
Evaluation of the weld geometry
The weld geometry may be evaluated in order to see the consequences of the alteration of the
geometry dimensions for the welding itself. If you choose only to evaluate the geometrical changes
then the result will be calculated as cross area section and weld requirements per meter weld.
However you may choose to combine this evaluation also with the cost evaluation in order to see
the consequences of geometrical changes for the weld economy.
1. Select the icon for bevel configuration. The canvas will show the alternative joint configurations.
2. Click on the joint configuration you want to use. You may select one of the four configurations. The
selected configuration will then be highlighted
3. Then select the icon for the weld bevel in the canvas and a new bevel interface will appear showing
the evaluation parameters and the resulting data from the evaluation.
Iqsim-user manual v.2.0
Example of selection of a joint configuration.
2010.11.30
16 of 45
Iqsim-user manual v.2.0
2010.11.30
17 of 45
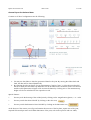
General input for the bevel data.
Common to all bevel configurations are the following:
1. You may use the sliders to alter the geometrical data for the joint. By moving the sliders back and
forth, the data will be altered dynamically
2. By selecting the relevant classes for cap requirements, Class B, Class C or Class D (according EN
ISO 5617:2005) the maximum cap dimension will be included in the calculation of the cross section
and the weld requirements in kg/m weld. Activate the button by clicking into it. The maximum cap
height will also be calculated for the cap and root side.
Special features:
*
You may scale the drawing of the welded joint by clicking on the magnification glasses, + or - value
*
You may switch the rulers ON/OFF by clicking on the ruler icon,
*
You may switch the dimension lines ON/OFF by clicking on the dimension icon,
At the bottom of the canvas you will get information about some of the key data; square area of the joint,
required filler metal per meter weld. Main dimension of the joint, with in the top bevel and root width,
Iqsim-user manual v.2.0
2010.11.30
18 of 45
maximum height of cap and root according the selected quality level according EN ISO 5617:2005.
Grab the pointer on the slider by pointing at it and pressing the left mouse button down. Then move the
mouse to the left or right.
When you click on the pointer and held the mouse button down, a small value icon will be shown above the
pointer, highlighting the current value, this value icon will follow the pointer and give you the correct pointer
value in decimals.
Note: Some logical limitations are built into the system. Ex. Nose height can not be larger than the
material thickness. Likewise, the nose height and the distance to the nose can not be larger than the
material thickness.
Values which are calculated automatically by the system are shown above and the values are shown with
yellow background
Iqsim-user manual v.2.0
2010.11.30
19 of 45
BUTT WELD – I-Bevel
The use of the sliders and other manipulation tools are as described earlier in page 12.
NOTE. Recommendations according EN ISO 9692-1 for single- and double-sided welding has been
added. Minimum and maximum plate thickness is highlighted for different welding methods.
Iqsim-user manual v.2.0
2010.11.30
20 of 45
BUTT WELD - V-Bevel
The use of the sliders and other manipulation tools are as described earlier in page 12.
NOTE The height of the cap on the cap and root side is given as well as the width of the top of the
bevel.
Iqsim-user manual v.2.0
2010.11.30
21 of 45
BUTT WELD - X-Bevel
The use of the sliders and other manipulation tools are as described earlier in page 12.
NOTE: The sum of value c and value h can not be larger than material thickness. The width of the
bevels are given as well as the cap height on the cap and root side.
Iqsim-user manual v.2.0
2010.11.30
22 of 45
FILLET WELD
The use of the sliders and other manipulation tools are as described earlier in page 12.
NOTE: The fillet weld can be set to be concave or convex by clicking on the icons. The selected icon
will be highlighted.
Iqsim-user manual v.2.0
2010.11.30
23 of 45
Welding Parameters
The simulation of welding parameters directly influences the HAZ calculation and the cooling time.
You may choose to combine this simulation with the HAZ calculation and the temperature cooling graph
and calculation of cooling time. If so, it is advisable to drag the HAZ calculation into the canvas so that you
can directly observe the consequences of your manipulation of the welding data on the HAZ data set.
Based on the variables in the user interface, the arc energy and heat input are shown as a result.
You may manipulate with the following variables, by using the sliders, in this interface:
1.
2.
3.
4.
5.
6.
Amperage
Voltage
Welding speed
Ambient temperature
Preheat temperature
Welding process is selected through the pull down menu in the top of the user interface
The selected values will be shown in the yellow result boxes on the right hand side of the sliders.
The efficiency factor will be altered according the welding process you choose.
Arc energy and heat input will be calculated automatically as you are manipulate the sliders.
You may alter the following parameters:
1. The amperage
2. The voltage
3. The welding speed or wire speed
Iqsim-user manual v.2.0
2010.11.30
24 of 45
4. The ambient temperature
5. The preheat temperature
Note 1: Ambient temperature and preheat temperature do not influence the heat input calculation.
Efficiency factor are dependent on the welding process and is set automatically. Ambient temperature
is equal to material temperature.
Note 2: The alteration of amperage, voltage and welding speed will of course also alter the deposition
rate of filler material. But be aware that we - for the sake of simplicity - do not update the deposition
rate in the economic calculation based on the changes here !
Iqsim-user manual v.2.0
2010.11.30
25 of 45
Welding parameters and HAZ/cooling time
Manipulating the welding parameters will directly influence the HAZ and the cooling time. In order to see
this influence directly, you may do the following:
1.
2.
3.
4.
Enlarge the browser window
Move the HAZ icon into the canvas and the canvas will be divided in two parts
Scale these parts in proportions which suit you
When you now alter the welding parameters, these will directly be reflected in the cooling time
graph and HAZ values.
This simulation has two extra features.
1. Click into the small slider box at the bottom of the graph. By doing so a new graph will be shown,
illustrating the cooling curve at the selected distance in the material, from the HAZ itself. By using
this function you will get a pretty good idea of the heat distribution in the material.
2. Both values for cooling time and Vickers hardness, HV10, have two values, shown in black and in
red. The black value shows the result from the current simulation. The red value shows the results
from the previous simulation.
3. By opening the two icons, for welding process and HAZ, you may differentiate the welding process,
welding, methods and welding parameters and at the same time see the result of the manipulation
with the sliders directly in the graph.
Red numbers give the result from the previous simulation. Black numbers are the result from the current one.
Iqsim-user manual v.2.0
2010.11.30
26 of 45
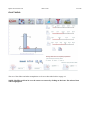
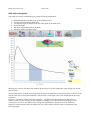
HAZ and cooling time.
The window for these calculations gives you the following information.
1.
2.
3.
4.
5.
6.
Maximum hardness (in HV10) in the heat affected zone.
Cooling time from 800 to 500 degree.
Cooling time a given distance form the centre point in the weld itself.
Tensile strength
Hardness at given distances in the HAZ
Calculate width of the HAZ itself
Moving your cursor to the line at any arbitrary point will give you the temperature and cooling time at that
specific point.
Note that the values for HAZ and cooling time are shown in black and red. The black value, to the left, is the
current value you get from this simulation. The red value, to the right, is the value obtained in the previous
simulation.
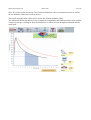
However--- the button: Define current as reference” will define both the current curve and values as
reference when you are carrying out the evaluation. Creating a new evaluation will then bring in a new
cooling curve as well as new data for the cooling time and hardness. The previous curve, defined as
reference, will be shown in red text and the new one will be shown in black colour, as illustrated in the
following figure.
Iqsim-user manual v.2.0
2010.11.30
27 of 45
NOTE: The accuracy of the calculations has to verified by an appropriate test weld followed by a
hardness test.
For the HAZ and cooling time calculation you have also two options
By ticking off in the selection box, available through the Advanced mode, you can choose to view the
temperature development at a certain distance outside the HAZ region. Select the distance by using the
slider. The result will be seen as a new graph, drawn in black. Alternatively, you may choose to see the
maximum temperature profile through the weld by clicking on the selection box.
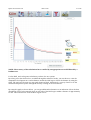
By using this graph, as shown below, you can get additional information or an indication of how the heat
distribution will be in the material itself on each side of the HAZ region within a distance of approximately
12 mm. This indicates how wide the HAZ region will be.
Iqsim-user manual v.2.0
2010.11.30
28 of 45
The picture on the canvas indicates where the temperature and the HAZ is measured. If you click on
the Advanced button, then additional information will be available and also additional possibilities
will be available. The following information is calculated automatically:
•
Distance from origo to the 1550 C line.
•
Distance from origo to the 500 C degree line.
•
Estimated width of the HAZ
In addition you will get the following possibilities:
•
Show max temperature profile
•
Additional temperature profile
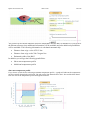
Show max temperature profile
If you choose to tick the box selecting maximum temperature profile, a graph will indicate the temperature
profile vertically through the weld itself. The red vertical line illustrate the 1550 C line and the blue dotted
line will will be the temperature profile through the material.
Iqsim-user manual v.2.0
2010.11.30
29 of 45
Additional temperature profile
If additional temperature profile is selected, then the following will happen.
•
A new graph will appear showing the temperature profile at the material depth as defined
through the use of the slider. The selected value will also be shown in the dimension box
above the slider.
•
A new vertical black line will appear on the profile graph. This graph will give the
temperature line for the material depth selected by the slider.
Iqsim-user manual v.2.0
2010.11.30
30 of 45
Note: If you also select the button: Use Current as Reference, then a red reference curve as well as
the red reference value boxes will be shown.
The tensile strength value will be shown below the Vickers hardness values.
The Advanced button thus allows you to evaluate the temperature and hardness values in the welded
connection and get a feeling for how the distribution of values will be through the material and the
weld itself.
Iqsim-user manual v.2.0
2010.11.30
31 of 45
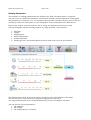
Economic evaluations
The economic evaluations are related to the joint configuration and import data from that part of the system.
This means that you may select a joint configuration and then create an economic simulation, based on those
data. You can then move back to the geometry of the joint and alter the date in moving back to the economy
to see the result of the graphical alterations.
Also note that the welding process is defined behind the welding icon and when you alter the welding
method, then the basic input in the economical calculation are altered. E.g. When changing from MMA -11
to TIG-141 the interface will alter electrode to wire and add cost elements for gas.
When you alter the geometrical data for the joint configuration, this will influence the cost calculation.
User interface for economy simulation.
The user interface for the economic simulation follows the same path as for the other simulations.
As you move the sliders, the resulting values are altered and shown in the yellow result boxes on the right
hand side of the sliders.
The resulting impact on the overall simulation and the total cost for the weld is then shown on the result
boxes on the right hand side.
Iqsim-user manual v.2.0
2010.11.30
32 of 45
NOTE 1: A set of ON/OFF buttons are situated at the upper right corner of the canvas. The number of
buttons will depend on the welding process. By clicking on one of these buttons you will hide the
related cost elements separately from the cost simulation. This will enable you to work within a smaller
area of the overall calculation and concentrate on fewer variables, thus creating a smaller canvas area.
NOTE 2: For the wire or electrode diameter, the pointer will jump between the defined values of the
slider. Just click the slider value and the pointer will move.
NOTE 3: The total welding cost will be automatically updated if you go back into the geometry part
and alter the geometrical information.
NOTE 4: Variation of amperage, voltage and welding speed will not alter the deposition rate of the
filler material.
NOTE 5: The total cost is shown without any digits, therefore the total costs are calculated from the
background data in the system where the data are stored with digits. Consequently it may seems that
the calculation are not 100% correct. This is due to the way the data are shown. Total hours are the
number of hours to be used for welding of the selected number of metre weld.
NOTE 6: When selecting the language during start up of the system, the currency is automatically
defined as the local currency.
Iqsim-user manual v.2.0
2010.11.30
33 of 45
Data input:
Wire diameter
A set of predefined wire diameters are given in the slider. Click on the
diameters and the slider will jump to the selected diameter. Only the
predefined values can be used.
Wire feed speed
Select the wire feed speed according your requirements. The selected value
will also be seen in the value box on the right hand side. The speed is
defined in metres per minutes.
Efficiency
Efficiency factor for the wire, taking into consideration possible losses in
weight from wire to weld metal
Wire price/kg
Price in Euro per kilo for the wire.
Gas flow
In litre per minute.
Gas price/m3
Price in Euro per cubic meter of gas.
Electrode diameter
A set of predefined electrode diameters are given in the slider. Click
on the diameters and the slider will jump to the selected diameter.
Only the predefined values can be used.
Kilo weld metal/kg electrode
Select the deposit value for the electrode.
Deposition rate
Deposition rate for the selected electrode per hour.
Welding speed
Welding speed in centimetre per minutes
Duty cycle
Duty cycle or arc time, in %, for the welding process. This means effective
welding % per hour.
Labour costs/hour
Labour cost per hour. Note: It is wise to use the total price here. That means
the company costs and overhead should be added. Alternatively one may use
the company sales price per hour.
Repair %
Repair % per meter weld. Average number to be used.
Repair costs/meter
Repair costs per meter should at least include the following elements:
• Cost for gauging and grinding in order to remove the weldment,
• Costs for re-weld,
• Costs for renewed control with relevant NDT methods and
documentation.
• Additional cost for handling equipment back and forth for control and
welding purposes should also be included.
• Cost for documentation of the repair
Cost for heating per meter. This could be preheat and other heating activities
required during the weld
Heating costs
Meters of weld
Meters of weld to be welded by this welding method.
Iqsim-user manual v.2.0
2010.11.30
34 of 45
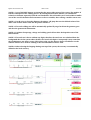
Administration of material data
The material data can also be run in an Advanced mode.
By doing so you may do the following:
• Adjust the minimum and maximum values for the chemical elements
• You may alter the steps in the slider
• You may add chemical elements which were not included in the material composition of the
material you selected.
Please note: If a chemical element has a minimum and maximum value equal to zero then the slider
will be void and can not be used.
If a numerical value is entered which is above or below the max or min value then a red border will
be seen on the value box,
Iqsim-user manual v.2.0
2010.11.30
35 of 45
References.
For calculation of HAZ and cooling time:
Yurioka
references
http://homepage3.nifty.com/yurioka/exp.html#E1 . Basic formulas found here with
to additional papers
Rosentahl
Calculation of preheat: EN1011-2.
Iqsim-user manual v.2.0
2010.11.30
36 of 45
Appendix A
Understanding equivalent carbon content – Ce.
A review of literature
General
The welded joints in a welded structure should serve the planned loading of the structure with safety.
If there are some non-conformities around welding then the welded joint(s) under load can fail.
The welded joints could be classified according their quality. If high load and high safety is needed
then high quality welded joint(s) should be produced, etc.
During production some non-conformities could occur, because welded design is not “friendly” for
the appropriate welding activity or on the other hand, the parent material(s) used (prescribed) are
technologically (e.g. during welding) not properly treated, and welding parameters used may be not
suitable. In this latest case it means that the heat input and thermal history could be not correct.
In this context the characteristics of parent material mean chemical composition, thickness of parent
materials and mechanical strength of steel grade, etc.
Alloying, chemical composition, hardness and weldability [12]
Alloying and chemical composition
The basic characteristic features of a metal can be changed in molten (fluid) state by adding some
other elements – this is alloying and the added element(s) are alloying elements.
If adding some small quantities of other molten metal or metals to the molten base metal, this
activity is called alloying. The result after cooling is a solid stage called: alloy (or one or more
component alloyed metal).
This activity will change or modify the basic characteristics of the parent metal - now in our case that of the Fe (which will be modified and/or changed).
Therefore for the welded steel structure production chemically pure Fe is not used. The welding
industry producing steel structures uses significantly Fe based alloys (Fe is the dominant element).
These materials of different chemical composition form different types of steels. These are named in
welded steel structure industry – base or parent metal.
Un-alloyed (plain, mild), alloyed and high alloyed steels:
If the accumulated ingredients (alloying elements) are ≤ 5% and the rest is Fe, then this kind of steel
is generally named un-alloyed steel.
If the volume of ingredients is about 5 % - the steel is low (or medium) alloyed steel.
If volume of ingredients is ≥ 5% the steel is highly alloyed steel.
Hardness and weldability
All alloying elements and thermal history (heat input and cooling rate) influence the properties of
parent material(s) and weld (welded joint) as well.
This effect could be estimated as positive e.g. having higher strength and corrosion resistance etc. but
some of the effects could have negative influence on the load bearing capacity of a welded joint, e.g.
bringing crack (formation) into action and/or causing the welded joint under load to break (fail).
According to practice such negative effect could be significantly influenced by the chemical
composition of steel and by some other factors - not discussed here.
This means the chemical composition of the steel will influence the hardness and the weldability of
the steel (the definition of weldability here is not discussed) and as a result of this the quality of the
joint will be remarkably influenced.
Higher concentrations of C and other alloying elements such as Mn, Si, Mo, V, Cu, Ni will increase
the hardness and decrease the weldability of the parent material(s).
Each of these alloying elements tends to influence the hardness (e.g. measured in HV and its value
preferred to be about 320 – 340 HV 10), and weldability of the steel to different magnitudes.
However there is a need for making a method of comparison to judge the difference in hardness
Iqsim-user manual v.2.0
2010.11.30
37 of 45
between two alloys made of different alloying elements.
Cracking
The metallurgical characteristics of steels are mainly dominated by their chemical composition. Any
small changes in chemical composition of the base and filler metals could substantially increase
cracking tendency.
The risk of cracking also increases with increasing hardness of the Heat Affected Zone (HAZ) in
welding for a particular H (hydrogen) level and welded joint restraint.
A general indicator, which is Ce, is a useful guide to estimate and assess the possibility of cracking in
(alloy) steels by comparison with the equivalent plain (un-alloyed) carbon steel.
The two main problems faced in the cracking of the welded metals (welds) are hot and cold cracking.
Hot cracking occurs immediately after solidification in a weld, caused by the segregation of certain
alloying elements during the solidification process. S, B and other elements tend to segregate
excessively. They are reduced in order to prevent hot cracking.
Cold cracking also known as delayed or hydrogen-induced cracking, developing after solidification
of the fusion zone nearby the HAZ as a result of residual stress.
Generally it occurs below 200ºC, sometimes even several days after welding.
Ce is sometimes useful in planning welding procedures. Adabtability (usability) of Ce is limited if
only the chemical composition of steel is considered, because the section size being welded and joint
restrain is of equal or sometimes greater importance than the value of Ce, because of their strong
relations to heat input and cooling rate (there are issues in the details not discussed here).
Susceptibility to cold cracking is determined by hardness of welds (HAZ and weld metal – see
above). The weld hardness is determined by an interactive effect of weld hardenability and carbon
content.
Preheating [11]
The objective of preheating is to effuse diffusible hydrogen out of welds to prevent hydrogen
assisted cold cracking.
The occurrence of cold cracking is influenced by the following factors:
-
chemical composition of steel,
thickness of parent metal(s) or plate, or wall thickness,
weld metal diffusible hydrogen content,
welding heat input,
welding residual stresses or weld metal yield strength,
weld joint restraint,
notch concentration factor at weld toe and weld root or groove shape,
weld pass number,
preheating method (heating rate, heating width),
ambient temperature,
immediate post-heating.
In this software we are dealing only with chemical composition.
Iqsim-user manual v.2.0
2010.11.30
38 of 45
Carbon equivalent (Ce)
Steels can be assessed in terms of the Ce which scales the concentration of each element by its
ability to retard the γ/α transformation.
“Ce” is an empirical value, relating to the combined effects of different alloying elements used in
making of carbon and/or alloyed steels, to an equivalent amount of carbon.
The resulting equivalent carbon coefficient allows the alloy to be compared with un-alloyed (plain)
carbon steels to predict their weldability and hardness properties.
Relating to welding Ce governs the hardenability of the parent metal. It is a rating of weldability
related to C, Mn, Mo, Cr, Ni, Cu, and V content.
Application of the Ce is modified by the inclusion in a steel as inclusions can effect hardenability
and susceptibility for forming crack.
The most common formulae for Ce to evaluate weldability depend on whether the metal is any
alloyed steel or modern carbon steel (see later).
The order of magnitude for Ce can be calculated using mathematical equations. There are also
several commonly used and empirically derived Ce equations as well. These Ce values for
expressing carbon equivalent are developed by different welding research organizations and
metallurgical industry (see later).
In practice it could be possible for individual steel grades to develop a special Ce value based on
experimental laboratory practices, because these relationships could not be derived purely
theoretically.
The alloying (constituent) elements in steel are expressed in weight percent amount (wt%; %), the
unit of chemical composition in wt% of steel.
However steels could be classified on practical base and industrial practice, therefore generally it is
enough for individual steel grades (un-alloyed, alloyed steel , etc.) to derive a formula for Ce which
can later be standardly applied for that particular grade of steels (see later).
The Ce is a measure of the tendency of the weld to form martensite on cooling and suffer hydrogen
induced cracking therefore some preheat predictive method uses Ce as well to determine the thermal
history.
By varying the amount of carbon and other alloying elements in steel, the designed strength levels
can be achieved by proper heat treatment.
A better weldability and low temperature notch toughness can also be obtained.
Since Cr and Mn increase the susceptibility to hydrogen assisted cracking and hardenability of steel,
the value of both indicators Pcm and CeIIW (see later) are strongly influenced by these alloying
elements.
Iqsim-user manual v.2.0
2010.11.30
39 of 45
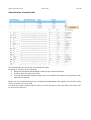
Ce values for different steel grades and industry usage:
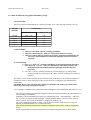
1/ General rules:
There are some recommendations for content by weight % for some alloying elements: [10, 12]
Alloying
elements
Carbon
Manganese
Silicon
Sulphur
Phosphorus
Composition
Preffered (in %)
High (in %)
0,06 – 0,25
0,35 – 0, 80
0,10 – or less
0,035 – or less
0,030 – or less
0,35
1,40
0,3
0,05
0,04
I. rule of thumb:
when Ce is less than 0,40 (%) cracking is unlikely,
when Ce is between 0,40 – 0,60 (%) weld preheat may be necessary,
when Ce is above 0,60 (%) preheat is necessary, post-heat treatment may be
necessary and techniques to control the hydrogen content of weld are
required.
II. rule of thumb:
if Ce (%) < 0,14 (%) - excellent weldability, no special precautions necessary,
if Ce: 0,14 (%) < Ce(%) < 0,45 (%) martensite is more likely to form, and
modest preheats and welding with low hydrogen electrodes become
necessary,
if Ce (%) > 0,45 (%) extreme precautions, weld cracking is very likely, hence
preheat (see above) in the range 100 - 400ºC and low hydrogen electrodes are
required.
The ability to form hard metallurgical microstructures like martensites or any other hard phases is
dependent on the Ce and cooling rate of the steel involved in cooling from γ/α transformation
temperature.
The higher the Ce value, the faster the cooling rate, the higher the tendency for hard, brittle
phases to form during cooling period of time.
2/ Ce formula for common (low) carbon and carbon-manganese steels implemented by IIW [4, 5, 11]
The following carbon equivalent has long been used as an index representing the susceptibility to
cold cracking or weldability.
Originally O’Neil and Dearden’s formula was simplified by IIW – subcommission – and in the
last 25 years it is known as IIW Hydrogen cracking formula and it is valid for steels with low
carbon content. This CeIIW is intended for singée pass welding. [4]
The carbon equivalent formula, CeIIW, is one of the most widely used because it is a good
measure of the hardenability for conventional steels.
This carbon equivalent satisfactorily evaluates weldability whose carbon content is higher than
0.12%.
CeIIW is preferable for common carbon steels and carbon-manganese steels, while Pcm is
Iqsim-user manual v.2.0
2010.11.30
40 of 45
designed for modern low-carbon low alloy steels.
Steels with a CeIIW greater than 0,4 % cannot be welded successfully unless precautions are
taken.
In the CeIIW formula, the alloying elements are heavily weighted compared to carbon, as shown
below:
For steels C > 0,12 – 0,18 % C: [4, 13]
CeIIW = C + + + (%)
(1)
For steels having Si in a “significant” volume: [4]
If Si content in the steel is similar to that present in older steels, then a modified IIW formula
(CeH) is used which takes into account the effect of Si.
CeH = + + (%)
(2)
3/ Ce value for for low carbon, microalloyed steels, if Ce ≤ 0,18 % C
3a/ Pcm (Ce) formula for modern steels, particularly for pipeline manufacture and C < 0,11 – 0,12% (no
more).
Ito-Besseyo Carbon equivalent: [4, 10, 11]
Pcm is designed for newer steels with low carbon, low alloy content. Modern low alloy steel is
mostly of a carbon reduced type (C ≤ 0, 11 – 0, 12 wt%).
Weldability of this type of steel is more adequately evaluated by the Pcm carbon equivalent,
which was implemented by Ito and Besseyo in Japan and called: Pcm.
The effect of carbon becomes critical to HAZ if it contains large amounts of
martensite.
Thus, Pcm is a good indicator of hydrogen-assisted cracking in the HAZ because carbon is a
heavily weighted factor in this formula, as shown
in Pcm = CeIto-Besseyo equation (3).
In the Pcm formula in equation (3), Ni does not raise the susceptibility to
hydrogen-assisted cracking to the degree that it increases hardenability.
Pcm = CeIto-Besseyo = C + + + + + 5B (%); (3)
3b/ Düren’s formula (from Germany) is similar for steel grades mentioned above in 3a: [4, 10, 11]
Ceq = C+ + + + + + (%)
(4)
4/ Ce formula for modern low carbon and/or microalloyed steels is: [10]
Ce = C + + + + (%),
6/ Some other formulas:
6.1. Ce values for shipbuilding steels:
(5)
Iqsim-user manual v.2.0
2010.11.30
41 of 45
CeIIW = C + + + (%)
(6)
Pcm = CeIto-Besseyo = C + + + + + 5B (%);
(7)
Example:
for steel AH36 from Co. Oakley Steel – Ce = 0,38 for plate thickness less than 50 mm and
Ce = 0,4% for plate between 50 – 100 mm thickness.
6.2. Ce values for stainless steels: [9]
For stainless steels and welds between carbon steels and stainless steels, the equivalent nickel
content (Nie) and equivalent chromium content (Cre) - usually used together and in conjunction
with the Schäffler-Delong diagram - are considered more accurate for measuring/estimating
weldability.
6.3. Some new types of Ce formulas
6.3.a. Ce for steel grades: WES – 135 and WES – 136: [7],[8],[11]
CeWES = C + + + + + + (%)
(8)
6.3.b. Cen :[11]
In the recent years complicated formulae have been developed including welding parameters, effects
of inclusions, chemical composition etc. It is generally perceived that for workshop usage without
access to a PC to perform calculations, this is not practical.
The following carbon equivalent considers this effect and can evaluates weldability of steel with a
wide range of carbon:
Cen = C + f(C) { + + + + } (%)
(9)
where, f(C) = 0.5 + 0.25 tanh { 20 (C - 0.12) } (%)
With decreasing carbon content, f(C) decreases from 1.0 to 0.5. Therefore, Cen is close to CeIIW
when C is higher than 0.15% and Cen approaches to Pcm as a carbon content decreases.
Cen is stipulated in ATM A 1005/A-00 and ASME B16.49-2000.
The newest carbon equivalent formula: [5]
Cen applies to both traditional steels (covered by CeIIW) and low carbon low alloy steels (covered
by Pcm) because of the hyperbolic tangent “tanh” term in the accommodation factor, A(C), shown
below:
Cen = C + A(C) { + + + + + 5B }(%)
(10)
where:
A(C) = 0.75 + 0.25 tanh{20(C-0.12)}
In the higher C range, A(C) approaches 1 and Cen approaches CeIIW.
Conversely, at low carbon levels, the Cen approaches Pcm. This behavior of
the Cen equation is due to the “tanh” (hyperbolic tangent) function.
Iqsim-user manual v.2.0
2010.11.30
42 of 45
6.3.c. CeI, II, III values
The formulae given here are also for prediction of weld metal hardness and strength as reference on
the martensite or bainite formation show.
They are dependent on different chemical compositions, microstructure and cooling time (t8/5) of
steel.
The martensite hardness is determined solely by the carbon content and there is a relation to HAZ –
and it is assumed that the same relation holds in weld metal.
The index for hardenability is a function of carbon equivalency and for different microstructure there
can be different equations as it can be seen and study below.
a/ CeI:
The formula (13) is obtained by a best fitting manner against the present database the effect of Mn is
non-linear as indicated as Mn/(1+Mn). This means that activity of Mn decreases as Mn content
increases. Ni and Cr are considered to show the same tendency – but their effects could be
considered to be linear for Ni less than 3.5% and Cr less than 1.25% as it was indicated by the used
database and Cu was considered not to contribute to hardenability thus Cu was ignored in (13).
CeI for calculating weld metal tensile strength [3, 11]:
CeI = C + + + + + (%)
(11)
CeI for calculating HAZ maximum hardness [11]:
f(B): an increase in HAZ hardenability due to boron, (C <= 0.8%, N <= 0.01%).
(11a)
b/ CeII:
The case when the hardness of 0% martensite phase plus that due to precipitation hardening which
arises only when t8/5 becomes long –it is also function of Ce – in the following equation (14) the
effect of precipitation hardening elements of Cu, Mo, V, Nb, Ti are relatively high, and the non-linear
effect of Nb considered as 2.2Nb/(1+5Nb).
CeII for calculating weld metal tensile strength: [3, 11]
CeII = C + + + + + + + + 2V + + (%)
CeII for calculating HAZ maximum hardness: [11]
(12)
Iqsim-user manual v.2.0
2010.11.30
43 of 45
(12a)
c/ CeIII:
The critical cooling time when martensite phases diminish and considered as an index of easiness of
bainite formation – in this case Ce is as it follows:
CeIII for calculating weld metal tensile strength: [3, 11]
CeIII = C + + + + (%)
(13).
CeIII for calculating HAZ maximum hardness: [11]
(13 a).
LITERATURE References:
[1] N. Yurioka:
"Comparison of preheat predictive methods"
Welding in the World, vol. 48 (2004), p. 21-27
[2] N. Yurioka and T. Kasuya:
“A chart method to determine necessary preheat in steel welding”
Welding in the World, vol. 35 (1995), p. 327 – 334.
[3] N. Yurioka:
Prediction of Weld Metal Strength (Report III.)
IIW Doc. IX – 2058 – 03 p. 3.
[4] Norman Bailey:
Weldability of ferritic steels
Abongton Publishing – Woodhead Publishing 1994, United Kingdom (ISBN 1 85573 0928), p. 35 – 37, (on
web test pages),
[5] J.H. Devletian: “Carbon equivalent Pcm limits for thick Carbon and Low Alloy Steels
Final Report, 2000,April 4 - Oregon Graduate Institute of Science and Technology p. 2 – 4.
[6] H. Kihara, T. Kanazawa and H. Tamura:
Weldability and Toughness Specifications for Structural Steels in Japan-With Special Reference to WES-135
and -136
• Philosophical Transactions of the Royal Society of London. Series A, Mathematical and
Physical Sciences, Vol. 282, No. 1307, Rosenhain Centenary Conference: The
Contribution of Physical Metallurgy to Engineering Practice (Jul. 8, 1976), pp. 247-258
(article consists of 12 pages)
• Published by: The Royal Society
Iqsim-user manual v.2.0
2010.11.30
44 of 45
Stable URL: http://www.jstor.org/stable/74540.
[7] JIS G 3106:2008 – “rolled steel for welded structures”, - WES 135 and WES 136,
[8] JIS G 3115:2005 – “Steels plates for pressure vessels for intermediate temperature service –WES 135;
WES 136.
[9] en.wikipedia,
[10] www.eng-tips.com/faqs.,
[11] N. Yurioka: Prediction of HAZ hardness of steels.
Metal Construction vol. 19. 1987. (p.217R).
http://homepage3.nifty.com/Yurioka/exp.-Master code by N. Yurioka – Welding Calculation – updated 2007. May.
[12] www.leonghuat.com/articles/carbon%20equivalent.htm.
[13] www.staff.ncl.ac.uk/s.j.bull/mmm373/WELDMAT.
Iqsim-user manual v.2.0
2010.11.30
45 of 45
Appendix B
Formulas used in the calculations:
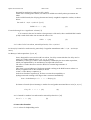
Ac1
750.8-26.6C+17.6Si-11.6Mn-22.9Cu-23Ni+24.1Cr+22.5Mo-39.7V-5.7Ti+232.4Nb-169.4Al894.7B
AC3
937.2-436.5C+56Si-19.7Mn-16.3Cu-26.6Ni-4.9Cr+38.1Mo+124.8V+136.3Ti19.1Nb+198.4Al+3315B
Ms
CEI
CEII
521-353C-22Si-24.3Mn-7.7Cu-17.3Ni-17.7Cr-25.8Mo
CE I = C +
Si Mn Cu Ni Cr (1 − 0.16 Cr ) Mo
+
+
+
+
+
+ f ( B)
24 6
15 30
8
4
CE II = C +
Si
Mn
Cu Ni Cr Mo
2.2 Nb Ti
+
+
+
+
+
+ 2V +
+
24 2.16(1 − Mn) 10 45 10
5
1 + 5 Nb) 10