1
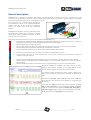
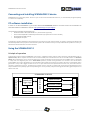
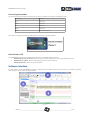
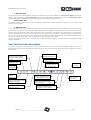
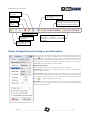
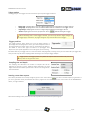
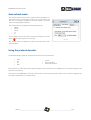
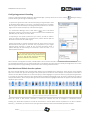
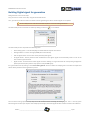
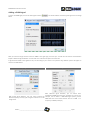
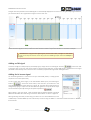
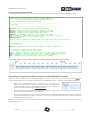
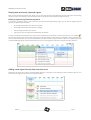
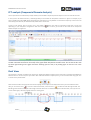
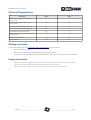
SCANALOGIC-2
Logic Analyzer / Digital Signal generator
Small, useful, complete
Product manual – Rev 1.3 - 27. March 2012
Characteristics summary:
Basic information:
Maximum Sampling Rate
20 MSPS (Million Samples Per Second).
Maximum Sampling depth
256K Samples per channel.
Number of input/output channels
4
Generator mode and Mixed (Input/Output) mode:
Simultaneous capture and generation
Generate data on 1 or 2 channels, and record the
response on the 2 remaining channels.
Maximum output frequency
10 MHz.
Generator options
Square signals, PWM signal, FM signals, Modulated
signals with adjustable envelope, user defined bit
pattern, serial UART data.
Possible configurations
4 inputs, 4 outputs, 2 inputs and 2 outputs.
Trigger options:
Pre-Trigger data display
0% to 100% (allows to focus on post or pre-trigger data).
Trigger modes
Rising edge, Falling edge, Logic change on a specific
channel, logic change on any channel.
Input and output characteristics:
Supported input logic levels
2.8V, 3V, 3.3V, 3.6V and 5V.
Allowed input voltage range
-0.7V to 5.5V.
Output voltage levels
0V to 3.6V.
Software characteristics summary *:
Compatible software suite
ScanaStudio (Used for device configuration, signal
visualization and protocol decoding).
Supported protocols (regularly updated)
UART, SPI, I2C, 1-wire, CAN, LIN 1.x & LIN2.x.
Dual data view
Used to compare various data captures by superposing
them on the same chart view.
Markers and time measurements
Unlimited markers and time measurements, with
automatic displaying of Time, Frequency and Duty cycle
between two markers.
Export printer friendly images
With customizable legend on each channel. Perfectly
adapted to report writing.
Workspace save/reload
Workspace is saved with all markers, time selections
and user commends. Saved file is compressed and can
be easily sent to another user by mail.
Data generator wizard
Allow user-friendly visual configuration of signals to be
generated.
* ScanaStudio software is regularly updated to add new features to your SCANALOGIC-2 Logic Analyzer.
Additional features:
Auto-refresh capability
Start a new data acquisition periodically.
FFT
Fast Fourier transformation allows in depth Frequencial
analysis of PWM and FM signals.
For more information: www.ikalogic.com
________________________________________________________________________________________________________
© 2012 IKALOGIC S.A.S. - 1 AVENUE D'ESTER - 87069 LIMOGES - FRANCE - TEL: +33 (0)5 55 35 80 28 - FAX: +33 (0)9 72 12 58 30
SCANALOGIC-2 Product manual
Contents
General description.....................................................................................................................................3
Connecting and installing SCANALOGIC-2 device.........................................................................................4
PC software installation...............................................................................................................................4
Using the SCANALOGIC-2 ...........................................................................................................................4
Principle of operation......................................................................................................................................................4
Connecting the probes....................................................................................................................................................5
Device Status LED............................................................................................................................................................5
Software Interface.......................................................................................................................................5
1- The panel area......................................................................................................................................................6
2-The toolbar area....................................................................................................................................................6
3- The chart area.......................................................................................................................................................6
User interface icons description..................................................................................................................6
Device Configuration and starting a new data capture................................................................................7
Mode of operation....................................................................................................................................................7
Trigger option............................................................................................................................................................8
Trigger position..........................................................................................................................................................8
Sampling rate and depth...........................................................................................................................................8
Starting a new data capture......................................................................................................................................8
Auto-refresh mode......................................................................................................................................9
Using the protocol decoder..........................................................................................................................9
Configuring protocol decoding......................................................................................................................................10
Byte Watch and Global decoder options......................................................................................................................10
Building Digital signal for generation.........................................................................................................11
Adding a PWM signal....................................................................................................................................................12
Adding an FM signal......................................................................................................................................................13
Adding Serial stream signal...........................................................................................................................................13
Serial stream generation syntax..............................................................................................................................14
Generating the signal built with the wizard on the SCANALOGIC-2 outputs................................................................14
Playing back previously captured signals......................................................................................................................15
Editing a captured signal before play-back..............................................................................................................15
Adding a new signal directly from the chart area.........................................................................................................15
FFT analysis (Frequencial Domain Analysis)...............................................................................................16
Dual View..................................................................................................................................................16
Electrical Characteristics............................................................................................................................17
Getting more Help.....................................................................................................................................17
Usage precautions.....................................................................................................................................17
Note: Software screen-shots to illustrate this documentation are taken using the “printer friendly” feature of
ScanaStudio, that's why they all appear on a white background. User can select various color profiles while using the
software.
REV1.3 ____________________________________
________________________________ 2/17
SCANALOGIC-2 Product manual
General description
SCANALOGIC-2 is a compact and portable logic analyzer and signal generator. It directly connects to a computer via an USB
connection. The ScanaStudio PC software is used to display the captured signals and decode it, generate signals and configure
capture parameters (like trigger options, sampling frequency, etc.)
It's very simple to use, it is easily mastered by beginners
and professionals, thanks to the intuitive ScanaStudio
software, featuring all the scrolling and navigation
options you would expect from any professional
software.
SCANALOGIC-2 introduces new, very useful features like
the mixed mode, allowing you to generate or playback
digital signals, while recording the response on other
channels, all at the same time!
GENERATE
PLAYBACK
CAPTURE
Some of the most important functions you can achieve with the SCANALOGIC-2 are:
•
Serial protocols sampling, decoding, debugging and analysis (like UART, SPI, I2C, 1-Wire, LIN bus, CAN,...). Analysis of
PWM signals, their frequencies and envelopes (Using the Fourier analysis feature).
•
Monitor logic changes on digital signal lines.
•
Store the captured data on files, to send them over the internet to other users or for later analysis playback!
•
Captures images of the signals with all the timings, decoded data and markers.
•
The Dual View features allows you can easily visually compare different data captures.
•
•
Record serial data and play it back, as simply as you would record & playback a speech!
Using the mixed mode you can record communication on one of the 4 channels, play it back while recording the
response on the other channel
•
•
Generate all kind of PWM (pulse width modulation) signals to control motors drivers, RGB LEDs or other devices.
Generate all kinds of FM (frequency modulation) signals. Can be used to test speakers or for ultrasound detection
systems testing.
Generate Serial data and pulses sequences to test your equipment/project using a very user friendly syntax.
•
ScanaStudio software is designed to be easily used by students,
engineers and hobbyists. Therefore, it can quickly generate printer
friendly, sharp clear graphs to be directly included in reports.
The software evolves constantly via online updates, allowing new
features to be added like new protocols decoding and better visual
effect.
The device supports 2.8V, 3.3V and 5V logic levels, works on USB 1 or
2, and does not need any driver to be installed, it's plug-n-play just
like a mouse.
It can store up to 256K samples per channel at a maximum rate of 20
MHz, and has 4 channels that can be configured as inputs or outputs.
Trigger on any channel can be adjusted to Falling edge, Rising edge or
Logic state change. Trigger position can be adjusted from 0 to 100%,
allowing large amount of pre-trigger data to be analyzed.
REV1.3 ____________________________________
________________________________ 3/17
SCANALOGIC-2 Product manual
Connecting and installing SCANALOGIC-2 device
SCANALOGIC-2 is a plug-n-play device. As soon as you connect it with the USB cable to the PC, it is automatically recognized (exactly
as a mouse or a keyboard).
PC software installation
In order to use the SCANALOGIC-2, you need to download ScanaStudio software. The latest version of ScanaStudio can
be downloaded from IKALOGIC's website http://www.ikalogic.com/scanalogic2/
The minimum operating requirements are:
•
•
•
•
Windows XP SP2 or later (WIN VISTA and 7, 64 and 32 bit supported)
.NET Framework(Will be automatically downloaded if you system don't have it installed)
512 Megabyte of RAM memory
10 Megabyte disk space
ScanaStudio is regularly updated to add new features and enhance the user interface. When an update is released, ScanaStudio will
automatically detect it and propose to download the update. We recommend that you accept all ScanaStudio updates to ensure you
benefit from the latest features and enhancements.
Using the SCANALOGIC-2
Principle of operation
As illustrated in figure 1 below, SCANALOGIC-2 can work in 3 different modes: Capture mode, Generator mode & Mixed mode. In
Capture mode, data is sampled and stored into the internal RAM, then transferred to the PC via the USB interface. In Generator
Mode, data created by the user is sent to the device (as a stream of samples) and stored into the internal RAM. Then it is generated
in a loop until it is stopped by the user. In mixed mode operation, the data to be generated on 2 channels is sent to the device
internal RAM. Then, Data is generated on 2 channels while input samples are stored on the 2 other channels. In mixed mode, data is
generated in a loop until a trigger condition occurs on an input channels and all required data is stored. Then, the content of the 4
channels is transferred to the PC. Transferring the content of the 4 channels in mixed mode ensure that the displayed Input and
Output waveforms are perfectly synchronized, allowing the user to precisely analyze stimulus (generated data) against response of a
device under test.
Precision
20 MHz Clock
Capture mode
Generator mode
Mixed mode
I/O Buffer
Control and
Trigger logic
256K RAM x 4
USB Interface
SCANALOGIC-2 DEVICE
Figure 1
REV1.3 ____________________________________
________________________________ 4/17
SCANALOGIC-2 Product manual
Connecting the probes
The probes connects to the device using a 5 pins connector. The probes are colored in the following order:
Probe color
Function
Blue
Channel 1
Yellow
Channel 2
Red
Channel 3
Green
Channel 4
Black
Ground connection
The position of the ground connection and Channel 1 are shown in the picture below:
Figure 2
Device Status LED
The SCANALOGIC-2 device has one yellow status LED, which can indicate different statuses:
– LED Blinking one time per second : Device is in stand by mode. All probes are in HI-Z (high impedance) mode.
– LED Blinking very quickly : Device is transferring data from or to the computer.
– LED ON continuously : Device is in generator mode
Software Interface
The user interface of the SCANALOGIC-2 software is composed of three different parts: the panel area (1) , the toolbar (2) and the
chart area (3) as you can see in the picture below:
Figure 3
REV1.3 ____________________________________
________________________________ 5/17
SCANALOGIC-2 Product manual
1- The panel area
The panel area is a space where different panels can be docked. The main panels available are: Device control panel (used to setup
sampling rate, trigger options), Decoder Manager (used to add/configure/remove different decoders) and the Data builder wizard
(used to add/configure/remove signals that can be later generated by the Scanalogic-2 device).
2-The toolbar area
The toolbar contains shortcut buttons to all the features of ScanaStudio. It will be explained in detail in the next section: User
interface icons description.
3- The chart area
As the name implies, this part of the software allows you to visualize the digital signals that are sampled, or the data that will be
generated. You can move the chart right and left by simply clicking and dragging the waveform. You can also interact with this part
of the screen using the mouse's right button. Depending on the circumstances, right buttons clicks will allow you to: Add markers,
Add time selections, delete markers and time selections or move marker and time selections. The mouse wheel scrolling will allow
you to zoom in and out. Pressing the CTRL or ALT button on your keyboard while zooming with the mouse wheel will allow precise
zooming. You can also left-click on a channel's legend to change it according to your needs.
When you are placing a marker, you can still move the chart right and left by holding the mouse wheel button pressed while moving
the mouse right/left.
User interface icons description
The top tool bar groups a set of shortcuts icons to the most recurrent functions of the ScanaStudio logic analyzer software. The
following two schematics describe briefly the usage of each icon. The detail of each function or feature will be explained in detail in
this document.
Us ed to open the Logi c
Ana l yzer confi gurati on
panel
Save works pa ce.
Us ed to open data
bui l der wi zard panel
Us ed to open
bui l der wi za rd.
s top the current
devi ce opera ti on
Sta rt new
works pace
Load
works pa ce.
Us ed to Export the current
vi ew a s a n i mage.
Us ed open the Decoders
Ma na ger pa nel .
Zoom i n, zoom Out or fi t
the waveform to s creen.
da ta
Run FFT
anal ys i s
Hi de unus ed
channel s
Show / Hi de verti cal and
hori zonta l gri ds .
Confi gure a nd/or s el ect
di fferent col ors profi l es .
REV1.3 ____________________________________
________________________________ 6/17
SCANALOGIC-2 Product manual
Launch wi ndows
cal cul a tor.
Vi s i t IKALOGIC webs i te for
l a tes t news .
Add a new ti me
s el ecti on.
Wi l l a ppea r onl y i f a new vers i on i s
a va i l abl e for downl oa d. Cl i ck to
update your ScanaStudi o s oftwa re.
Add a new
ma rker.
Skew dua l data
Wi l l appear onl y i f a comment i s
previ ous l y
atta ched
to
the
works pace. Cl i ck to vi ew or edi t the
comment.
Show/hi de the dual
data s tream.
Loa d data for the
dua l vi ew mode.
Device Configuration and starting a new data capture
To start a new data acquisition (capture), click on the device configuration icon in the
toolbar ( ) to show the device configuration tab. You will notice 3 main tabs in the
Scanalogic-2 panel: “Configuration”, “Auto refresh” and “Device”. We will start by
explaining options under the “Configuration” tab. As you can see on that picture, the
configuration tab is composed of a series of list boxes, allowing you to setup your
SCANALOGIC-2 device the way you need it to behave.
Mode of operation
The first list box allows you to choose between 4 modes of operation:
Capture Mode: In this mode, the 4 channels of the device work as a standard logic
analyzer. They are all inputs.
Generator Mode: In this mode, the 4 channels of the device work as a generator. They
are all outputs. The data generated is exactly as the data you see in the chart area. If
you don't see any data, then you need to create some data using the signal builder
wizard (
) or capture some data to play it back.
Mixed Mode: In this mode, 2 channels work as inputs, and the two other as outputs.
This mode is useful to generate some data on a channel while watching some
response on another channel.
Figure 4
REV1.3 ____________________________________
________________________________ 7/17
SCANALOGIC-2 Product manual
Trigger option
The "trigger type" and "trigger channel" list boxes let you setup the trigger conditions:
Figure 5
•
•
•
•
Falling edge : Sampling start as soon as a HIGH to LOW transition is detected on the trigger channel.
Rising edge : Sampling start as soon as a LOW to HIGH transition is detected on the trigger channel.
Logic change : Sampling start as soon as a logic change is detected on the trigger channel.
At start: Sampling start as soon as you press the "start" (
) without waiting for a trigger.
When choosing "ALL" as the trigger channel, you can only choose "Logic change" as
the trigger type, and hence, any logic change on any channel will cause a trigger.
Trigger position
The "trigger position" slider, allows you to set the trigger position, in
percentage of the sampling depth. That is, if you want to capture some of
the signals before the trigger event, then you should move this slider to
the middle or even to the right. The amount of "pre-trigger" data
depends on your specific application and on the signals you're recording.
Figure 6
Be advised that the pre-trigger data is a ratio of the whole sampling buffer, meaning that if you have about 25% pre-trigger data,
then you have only 75% of the sampling buffer remaining to store the post-trigger samples.
Trigger options and trigger position only affect the Capture mode and mixed mode, but don't
have any effect on the generator mode
Sampling rate and depth
The sampling rate determines the number of samples that will be
captured per seconds, and the sampling depth determines the total
length of the data that will be captured. This is also true for the generator
and mixed modes.
Figure 7
Starting a new data capture
Once all the parameters are correctly configured, press on the "start" button(
) to start a new data capture (or generation if
you are in generator mode). ScanaStudio will show a progress bar and inform you on the current status of the SCANALOGIC-2
device, as in figure 8 below:
When data retrieving is done, the chart area will be updated to show the latest captured signals.
REV1.3 ____________________________________
________________________________ 8/17
SCANALOGIC-2 Product manual
Auto-refresh mode
Auto-refresh mode is used to launch a new data capture periodically at a
predetermined rate. If some trigger conditions are set, ScanaStudio will
wait until a new trigger condition occurs before starting a new data
capture and displaying the waveforms.
Auto-refresh mode can be adjusted to the following intervals:
•
100 ms
•
200 ms
•
500 ms
•
1s
•
5s
You can always stop the auto refresh sequence by clicking on the stop
button ( ) or by pressing its short cut key (F4).
Figure 9
Auto-refresh mode is compatible with Capture mode, Generator mode
and mixed mode.
Using the protocol decoder.
The Decoders Manager, allows you to decode various kinds of serial protocols like:
•
•
•
•
UART
SPI
I2C
CAN
•
•
•
1-Wire
LIN1.x and LIN2.x
Manchester Bi-phase
More protocols are added with periodic software updates that are released for free. IKALOGIC team is constantly working to add
support for new protocols.
If you need to use SCANALOGIC-2 to decode a protocol that is not yet supported, please contact us and our team of engineers will
do its best to implement it in the shortest delays.
REV1.3 ____________________________________
________________________________ 9/17
SCANALOGIC-2 Product manual
Configuring protocol decoding
To setup or edit existing decoder, display the “Decoders Manager” panel by click on its icon in the toolbar (
protocol decoder goes through the following steps.
). Adding or editing a
1- Capture the signals that need to be decoded (using the Logic Analyzer mode
as described above). Make sure to choose a sampling frequency that is suitable
with the signals to be decoded (The sampling frequency should be 5 to 10 times
higher than the maximum frequency of the measured signal).
2- In the Decoders Manager, click on “Add” button (
), then a new wizard
will appear. Chose the protocol that you want to decode from the available tabs
(like UART, SPI, I2C, CAN,etc.) and click “Next”
3- Depending on the specific protocol that you choose, you will be asked to
setup the specific parameters that characterize the protocol decoder (like the
baud rate and bits order for a UART signal)
4- When the decoder is correctly configured, Press the “Finish” button, then the
decoded data should appear on the chart area, superposed on your original
captured signals. Zooming in usually let you see more information about a
specific data byte, like the meaning of a command, a check sum result, or an
ASCII equivalent character.
If at this point you don't see any decoded
data on the chart area you may need to zoom in
or out. It may be also caused by data being
incoherent with the chosen decoder.
Figure 10
When a decoder is configured and active, it will be visible in the list of active decoders. The check box next to the decoder name lets
you show/hide the decoder. You can always double click on the decoder name from this list to modify its configuration. You can also
permanently remove it by right-clicking on the decoder name a clicking “Remove decoder”.
Byte Watch and Global decoder options.
Still in the Decoder Manager panel, the byte watch feature lets you highlight various data bytes, among the rest of the decoded
bytes. This is useful when you are searching for some specific bytes in a continuous stream of bytes. It is composed of a table with 3
columns: Decimal, HEX and ASCII. You can enter the byte you need to highlight in any of those 3 forms, by simply entering the value
in an empty cell, the others cells of the other formats will be completed automatically. Figure 11 shows an example of the usage of
the byte watch feature, where the bytes having the value of 0x53 or 0x43 are highlighted. Note that this applies to all active decoder
despite its type or channel.
Figure 11: Example of the byte watch feature
When the “Show in HEX format” check-box is checked, the decoded data will be displayed in hexadecimal format.
Checking the “Show ASCII equivalent” box will tell the decoder to add the ASCII character equivalent for the data in between
brackets '[..]'. Sometimes you need to zoom in (using the mouse wheel) in order to view the ASCII equivalent character.
REV1.3 ____________________________________
________________________________ 10/17
SCANALOGIC-2 Product manual
Building Digital signal for generation
Data generation is done in two steps:
First, you have to "create" some data, using the data builder wizard
Then, you have to transfer this data to the device and start generating the data as electrical signals on the probes.
You can always click on “File> Start new data sequence” to clear all existing waveforms.
The data builder panel can be shown or hidden by clicking on this icon (
) in the toolbar:
Figure 12
The data builder panel is composed of the following items:
•
Device timing option : To set the Sampling rate and Number of samples of the device
•
Add signal button : to add a new signal (PWM, FM or Serial Stream)
•
Clear all signals button : Used to clear all the previously built signals.
•
Fix Signals button : Used to prevent further modifications to the signals. Signals are automatically “fixed” as soon as the
user chooses to generate them.
•
Signals list box : A list box where all built signals are listed. Clicking on a signal will show the corresponding configuration
options (like the frequency and the duty cycle for a simple PWM signal).
It's a good habit to start by clicking on the “Device timing options” button to define the sampling rate and number of samples that
will be used by the device for the generation process:
Figure 13
Once the device timing options are set, they cannot be modified without removing all existing signals. This is a security option
because signals are built upon samples: if the sample period changes, the whole signal becomes invalid and needs to be redefined.
REV1.3 ____________________________________
________________________________ 11/17
SCANALOGIC-2 Product manual
Adding a PWM signal
To add a new PWM signal, click on the “Add signal” buttons (
below:
). You will be asked to chose the type of signal as in the image
Figure 14
After you select the target channel and chose PWM as the signal type, click next you. You will then be asked to chose between
Simple or Advanced signal definition. choose either one of the the two options and click “OK”.
A signal will be added to the signals list box, and according to your choice in the previous step, different options will appear as
shown in the table below:
Simple Signal definition
Advanced signal definition
With advanced signal definition, you can define more
sophisticated PWM signal having an envelope and a carrier. For
With simple signal definition, you only need to define the
example, one can build a 5 KHz PWM signal (carrier), whose
desired frequency and duty cycle using the scroll bars as in the
PWM will show sinus based variation from 0 to 100% at a
image above.
frequency of 255Hz (envelope).
REV1.3 ____________________________________
________________________________ 12/17
SCANALOGIC-2 Product manual
Changes made the parameters of the PWM signal are automatically displayed on the chart area. Using the simple signal definition,
you should be able to see a signal similar to figure 15 in the chart area.
Figure 15: Example PWM created by the signal builder
Please note that in figure 15 above, all other channels have been hidden to emphasize CH1 which is used for this example.
SCANALOGIC-2 only generates digital signals, and the terms “SIN”, “Triangle” or “Saw-Tooth”
only refer to the slope of variation of the duty cycle of the PWM signal (also called the envelope of
the signal).
Adding an FM signal
To add and configure an FM (Frequency modulated) signal, simply click on the “Add signal” buttons (
) and choose “FM”
as the signal type. In the next step choose simple or advanced signal definition. As with PWM signals, modifications to the signal
parameters can be directly seen on the chart area. This allows you preview the signals that will be generated.
Adding Serial stream signal
The serial data generation is a tool that can let you create UART packets, or simply precise
sequences of 1's and 0's (bit stream).
To add a serial data stream signal, in the Data Builder Wizard panel, click “Add signal”
buttons (
) and choose “serial stream”, then click “OK”. you should see a new
serial signal added to the signals list box as in figure 16. The serial data stream generator is
configured by typing a script in the text box below the signals list. the syntax of this script
can be reviewed any time by clicking on the Syntax help button (
).
When adding a new serial signal, a few commands will be added by default to generate
9600 baud rate UART data of the string of characters “Hello World!” as shown in figure 16.
When generating serial data, the first thing you need to do is to set the BAUD rate (in case
of UART data) or the BIT PERIOD (in case of bit stream). this done using the “BAUD =” command for UART serial data or “PERIOD=”
for bit streams.
REV1.3 ____________________________________
________________________________ 13/17
SCANALOGIC-2 Product manual
Serial stream generation syntax
The following series of example scripts, shows the exhaustive list of possible commands to be used with the data generator:
// After the '//' you can insert comments till the end of the line (C style)
// You can mix UART mode commands with BIT STREAM commands
// If you don't set a parameter - default setting will be used
// BAUD= or PERIOD= must always be specified !!!!
//
//-----------------------------------------------------------------// UART mode
//-----------------------------------------------------------------//
BAUD=9600 // Max. allowed depends on sampling parameters!
USTOP=2 // Define the number of STOP bits (default 1 is used)
MSB_FIRST // Define the bit order (default LSB_FIRST is used)
PARITY=N // E-EVEN, 0-ODD, N-NONE (default N is used)
POLARITY=0// 0-Standard, 1-Inversed logic (default 0 is used)
U0xAA // generate a UART packet (start bit, 8 bits (for 0xAA), stop bits)
U170 // Same as U0xAA but using a decimal number
UCHR=Hello World
//Send a string of character as UART packets, each one having start bit and stop bit.
//
//-----------------------------------------------------------------// BIT STREAM mode
//-----------------------------------------------------------------//
PERIOD=1 // PERIOD=x.xx[ms] Min. allowed depends on sampling parameters!
//
b0 // generate a single bit with logic level 0
b1 // generate a single bit with logic level 1
b0=15 // generate a single bit with logic level 0 and the length of 15 periods
b1=22 // generate a single bit with logic level 1 and the length of 22 periods
B0xFF // generate 8 bits with the binary value of 0xFF (Hexadecimal)
B126 // generate 8 bits with the binary value of 126 (decimal)
As an example, Figure 17 shows the default "Hello World" UART packet generated by the Data Builder Wizard:
Figure 17
Generating the signal built with the wizard on the SCANALOGIC-2 outputs
Finally, once you are satisfied with the data being displayed on the chart area, you have to click on the start button (
order to effectively generate electric signal on the probes of the SCANALOGIC-2 device. This is done via the following steps:
) in
1.
Make sure the Input/Output direction is correctly set. you can verify this by
looking at the channel label. if a channel is set to be an output, you should see an
“output” label like in figure 18. Alternatively, you can change this as described in
the device configuration panel under “Mode of operation“.
2.
Start data generation by clicking on the “Start” button in the device configuration panel, by clicking on this button in the
toolbar, or by hitting the F5 button on your keyboard.
3.
The samples to be generated will be transferred to the device internal RAM (this might take a few seconds to a few dozen
of seconds depending on the number of samples). Then, as soon as data has been transferred to the device, generation
will effectively start on the probes.
Please refer to the section “Principle of operation“ for more information about how the Mixed mode mode works with respect to
different trigger option.
REV1.3 ____________________________________
________________________________ 14/17
SCANALOGIC-2 Product manual
Playing back previously captured signals
After you have sampled (captured) some signals, you can very easily play them back (generate them) by setting the corresponding
channel as output, then clicking on the start button. All of this can be done via the Device configuration panel.
Editing a captured signal before play-back
In some cases, it might be useful to edit a signal that was captured before generating it again. You can alter the original captured
signal in the different ways that follow:
•
Set the logic level between two markers to 0 (LOW)
•
Set the logic level between two markers to 1 (High)
•
Inverse the signal between two markers
•
Copy / paste a part of a signal that is delimited by two markers.
In order to modify the captured signal, you need to add a time block that is defined by 2 markers using this icon in the toolbar ( ).
This time block should cover the part of the signal that need to be modified or copied. After the time block is added, right click on it,
then on “Edit selected block”, then select the modification you wish to perform. Figure 19 shows a portion of a signal being edited
to become LOW (logic 0) over all the selected time block. You can also copy/paste time block using the same right-click menu.
Figure 19: Editing a captured signal
Adding a new signal directly from the chart area
Another way to quickly add a signal in the Signal Builder Wizard is to right click on the channel you wish to build the signal on, and
click “Build a new signal on this channel” as in figure 20 below.
REV1.3 ____________________________________
________________________________ 15/17
SCANALOGIC-2 Product manual
FFT analysis (Frequencial Domain Analysis)
The FFT (Fast Fourier Transformation) analysis allows you to establish in depth frequencial analysis on some or all of the channels.
In case you are not familiar with FFT, it will simply allow you to visualize the frequencies enclosed in a signal. For example, if you
have a variable duty cycle PWM signals generated from some device, it's very difficult to measure the frequency of the carrier and
the envelope, but with FFT, this becomes easily doable with a mouse click.
To start an FFT analysis, click on the FFT icon in the toolbar (
). Please note that FFT calculations might take a lot of time
depending on your computer's configuration. After the FFT calculations are done, you should see the result of the Frequencial
Domain analysis as in figure 21.
Figure 21: FFT Analysis of a 178KHz signal on CH1 and a 198KHz signal on CH2
You will notice that the time-bar at the top of the graph shows frequencies instead of time. You can exit the FFT view
by either right-clicking on the graph area then selecting quit FFT view, or by clicking again on the FFT icon in the
toolbar.
Dual View
The dual view, is another innovative tool, that lets you display two different captures at the same time and examine the differences
between them. To use this tool, first you need to have some data loaded or captured, then, you can load dual data using open icon
as shown in the picture below:
Note that the dual data must have the exact same sampling rate and depth as the original data. Once you have loaded the dual
data, you can use this icon (
) to show or hide the dual data, or the hand icon (
) to skew the dual data right and left. The
following picture shows an example of the usage of the dual view tool. The white lines represent the dual data, and as you can see
on the circled region, the blue (original) data has a missing pulse.
REV1.3 ____________________________________
________________________________ 16/17
SCANALOGIC-2 Product manual
Electrical Characteristics
Parameter
Value
Unit
Maximum Input voltage on any channel
(capture mode)
5.5
V
Minimum Input voltage on any channel
(capture mode)
-0.7
V
Minimum input for high level (Threshold)
1.9
V
Maximum input for low level (Threshold)
0.4
V
Output HIGH level (Generator mode)
3.6
V
Maximum Source or Sink current per channel
(generator mode)
25
mA
Maximum input capacitance
7
pF
100
KΩ
Input impedance
Getting more Help
For more information please visit: http://www.ikalogic.com/scanalogic2/ where you can find:
•
Regularly updated F.A.Q. page.
•
Latest news and updates about the SCANALOGIC-2 and ScanaStudio software.
•
An active forum where IKALOGIC team and fellow SCANALOGIC-2 users share their experiences and provide support.
Usage precautions
•
Always make sure probes are plugged in the right direction: The ground probe (black) should be in front of the ground symbol.
•
Do not connect the logic analyzer probes to voltage levels higher than 5.5V or lower than 0.5V.
•
Always double check the connection of the probes to your system when using the generator or mixed mode.
REV1.3 ____________________________________
________________________________ 17/17