1
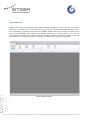
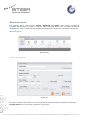
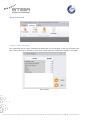
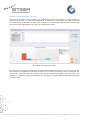
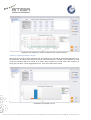
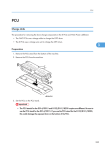
COPERT Street Level
User’s Manual
Version 2.0
21 Antoni Tritsi str.|PO Box 8138|GR 57001|Thessaloniki|T +30 2310 473352|F +30 2310 804110|E [email protected]|W http://www.emisia.com
Contents
Introduction ........................................................................................................................3
Installing COPERT street level ................................................................................................4
Main menu items ..................................................................................................................5
Menu Project .....................................................................................................................5
Project > File > Create file ...............................................................................................5
Project > File > Load .......................................................................................................7
Project > File > Save ......................................................................................................7
Project > File > Close file .................................................................................................7
Project > Import > Imported data .....................................................................................7
Project > Results > By row ..............................................................................................8
Project > Results > On map .............................................................................................8
Menu Advanced .................................................................................................................9
Advanced > PCUs > PCU weights ......................................................................................9
Advanced > Vehicle percentages > By sector .................................................................... 10
Advanced > Vehicle percentages > By fuel ....................................................................... 11
Advanced > Vehicle percentages > By technology ............................................................. 12
Menu About .................................................................................................................... 12
21 Antoni Tritsi str.|PO Box 8138|GR 57001|Thessaloniki|T +30 2310 473352|F +30 2310 804110|E [email protected]|W http://www.emisia.com
Introduction
COPERT street level is a standalone MS Windows software designed for users who wish to calculate
emissions on a street basis. It is structured in such a way as to work alongside traffic analysis tools.
The methodology is based on the well known COPERT software but brings a whole new approach to
the level of calculations. The software can calculate emissions on a single street or on a full city
street network. It requires the minimum set of input data to produce results and is optimized for fast
execution times. Emissions can also be displayed on a GIS map to improve visualization.
Main software window
21 Antoni Tritsi str.|PO Box 8138|GR 57001|Thessaloniki|T +30 2310 473352|F +30 2310 804110|E [email protected]|W http://www.emisia.com
Installing COPERT street level
To install COPERT street level, simply double click on the executable file and a typical MS Windows
installation will start automatically. The software requires approximately 100 MB of hard disk space.
An active license key is required.
IMPORTANT INFORMATION:
Please note that when working with COPERT street level an active internet connection is required
at each start-up to validate the license key.
21 Antoni Tritsi str.|PO Box 8138|GR 57001|Thessaloniki|T +30 2310 473352|F +30 2310 804110|E [email protected]|W http://www.emisia.com
Main menu items
The software has 3 main menus: Project, Advanced and About. Menu Project includes all
necessary functionalities to perform a full run. Menu Advanced allows users to modify the default
parameters in order to customize the calculations. Menu About includes the registration information.
Menu Project
Menu Project
Project > File > Create file
Create File
In order to create a new CSL file you must first provide all the necessary information in this form.
Project name: here you provide a name for your project
21 Antoni Tritsi str.|PO Box 8138|GR 57001|Thessaloniki|T +30 2310 473352|F +30 2310 804110|E [email protected]|W http://www.emisia.com
One file per hour check box: input data can correspond to a specific time within a day, or span
across multiple hours. If this is the case and you have different files for each hour you can check this
box and provide the different paths for the files containing the information for each hour.
Input path: by clicking on this item you are prompted to locate your file containing the input data.
If you have checked the One file per hour check box this item expands to include more than one
paths.
Baseline population: this is a list box displaying all countries for which CSL contains default fleet
information.
Year: this is a list box displaying the years for which CSL contains default fleet information.
Sheet name: input data can be imported from an MS Excel file. If data is on the first sheet of the
file than this text box can be left empty, however if the information is on different sheets than this
must be filled with the corresponding sheet name.
In order to better understand the way the software defines the input data structure it is helpful to
work with an example, in this case an MS Excel file containing all relevant information. In this file
column A contains the link id of a specific road segment, column B the length of the link, column C
the number of vehicles driving through, column D the vehicle speed, column E the hour this activity
refers to and column F the type of link (eg one way, road with two lanes etc). Columns G through J
are the GIS required information in order for the software to display the data on the map.
Columns A, B, C, and E are the minimum required for the calculations to be performed. This means
that if there is only one type of link, if data refers to a one specific hour and no GIS visualization is
required no other information is necessary. Moreover since the user defines which columns contain
which information column listing can vary.
MS Excel input file
In order to define which columns contain which information the following items are included in the
form:
Basic columns: these drop down lists define the corresponding columns for the link ID, speed, link
length and vehicle volume
Type column: this drop down list defines the column for the link type. It is only enabled if the check
box next to the Type column legend is checked.
Hour column: this drop down list defines the column for the hour the activity data in each row
refers to. It is only enabled if the check box next to the Hour column legend is checked. Please
21 Antoni Tritsi str.|PO Box 8138|GR 57001|Thessaloniki|T +30 2310 473352|F +30 2310 804110|E [email protected]|W http://www.emisia.com
keep in mind that there is another way to provide datasets for different time periods and this is by
providing different input files by checking the One file per hour check box as previously mentioned.
GIS columns: these drop down lists define the GIS information required for the visualization of the
emissions on a map. They are only enabled if the check box next to the GIS columns legend is
checked.
Node columns: these drop down lists define the correlation between the different links. They are
not required either for the calculations or for the visualization on a map. They are only enabled if the
check box next to the Node columns legend is checked.
Project > File > Load
This menu item allows you to open a previously created CSL file.
Project > File > Save
This menu item saves your work in a CSL file for later access and use.
Project > File > Close file
This menu item closes the CSL file you are working on.
Project > Import > Imported data
This menu item opens a form containing the data included in the CSL file. This includes all data
imported from the original file.
View import data
21 Antoni Tritsi str.|PO Box 8138|GR 57001|Thessaloniki|T +30 2310 473352|F +30 2310 804110|E [email protected]|W http://www.emisia.com
Project > Results > By row
This menu items opens a form containing the emission results. The user can view the emissions as
well as the fuel consumption per link ID but also export the data to an MS Excel or csv file.
Results form
Project > Results > On map
This menu item opens a form displaying the results on a GIS map. This item is disabled if no GIS
input data are defined.
Results on a GIS map
21 Antoni Tritsi str.|PO Box 8138|GR 57001|Thessaloniki|T +30 2310 473352|F +30 2310 804110|E [email protected]|W http://www.emisia.com
Menu Advanced
Advanced > PCUs > PCU weights
This menu item opens a form containing the Passenger Car Unit weights. If the user provides input
data in PCU’s and not in vehicles per hour these values should be modified accordingly in this table.
PCU weights
21 Antoni Tritsi str.|PO Box 8138|GR 57001|Thessaloniki|T +30 2310 473352|F +30 2310 804110|E [email protected]|W http://www.emisia.com
Advanced > Vehicle percentages > By sector
This menu item opens a form containing the percentages of each vehicle sector in the total fleet. All
values must add up to 100%. This information is included in the software for each of the EU
countries and for a period up to 2030. Their purpose is to break down total vehicles (or PCUs) per
link ID to a lower aggregation level. User can modify these values.
Population percentage per sector
As previously mentioned a minimum set of input data includes information for one link type and one
hour. However it is possible to calculate emissions for more than one link type and or more than one
hour. If this is the case than the previous form will be modified accordingly so that the user, if he
chooses so, is able to change the population percentages for all these different information datasets
in a single form.
21 Antoni Tritsi str.|PO Box 8138|GR 57001|Thessaloniki|T +30 2310 473352|F +30 2310 804110|E [email protected]|W http://www.emisia.com
Population percentage per sector for different link types and hours
Advanced > Vehicle percentages > By fuel
This menu item opens a form containing the percentages of each vehicle consuming different fuel in
the total fleet. All values must add up to 100%. This information is included in the software for each
of the EU countries and for a period up to 2030. Their purpose is to break down total vehicles (or
PCUs) per link ID to a lower aggregation level. User can modify these values.
Population percentage per fuel
21 Antoni Tritsi str.|PO Box 8138|GR 57001|Thessaloniki|T +30 2310 473352|F +30 2310 804110|E [email protected]|W http://www.emisia.com
Advanced > Vehicle percentages > By technology
This menu item opens a form containing the percentages of each vehicle technology in the total
fleet. All values must add up to 100%. This information is included in the software for each of the EU
countries and for a period up to 2030. Their purpose is to break down total vehicles (or PCUs) per
link ID to a lower aggregation level. User can modify these values.
Population percentage per engine technology
Menu About
This menu item opens a form containing information on the license of the software.
About form
21 Antoni Tritsi str.|PO Box 8138|GR 57001|Thessaloniki|T +30 2310 473352|F +30 2310 804110|E [email protected]|W http://www.emisia.com