1
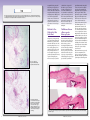
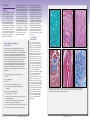
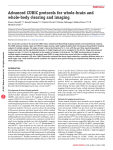
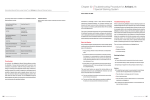
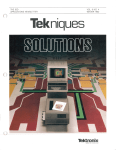
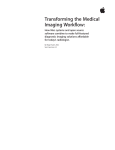
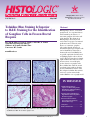
Vol. XL, No. 1 May 2007 Toluidine Blue Staining Is Superior to H&E Staining for the Identification of Ganglion Cells in Frozen Rectal Biopsies M. Canil, K. Meir, G. Jevon, T. Sturby, S. Moerike, A. Gomez Anatomical and Surgical Pathology Children’s & Women’s Health Centre Vancouver, BC, Canada [email protected] A B Managing Editor, Gilles Lefebvre Scientific Editor, Vinnie Della Speranza, MS, HTL(ASCP) HT, MT Abstract Hirschsprung’s disease, or intestinal aganglionosis, is a congenital disease characterized by the absence of autonomic ganglion cells in the wall of the intestine. The diagnosis of Hirschsprung’s disease by frozen section microscopy poses an unusual problem because it is based on the absence of a structure, ganglion cells, rather than the presence of abnormal morphology. Ganglion cells can be identified by stains such as hematoxylin and eosin (H&E), but no specific, rapid stain is widely used to highlight ganglion cells on frozen section. We have introduced a simple, rapid toluidine blue method to stain frozen sections of rectal biopsies for the detection of ganglion cells. The toluidine blue stains the neural cytoplasm of the ganglion, allowing for easy identification of these cells. We compared toluidine blue stained sections to sections stained with routine H&E for ease of ganglion cell IN THIS ISSUE Toluidine Blue Staining Is Superior to H&E Staining for the Identification of Ganglion Cells in Frozen Rectal Biopsies. . . . . . . . . . . . . 1 Histology as Art: Problems and Opportunities in Creating Giant Photomicrographs. . . . . . . . . . . . . . . . . 4 Microwave-Assisted Tissue Processing for Transmission Electron Microscopy. . . . . . . . . . . . . 16 C Safety First. . . . . . . . . . . . . . . . . . . . . . . . 19 D Mark Your Calendar!. . . . . . . . . . . . . . 22 Fig. 1. (A) Toluidine blue stain, 100X; (B) Toluidine blue stain, 200X; (C) H&E stain, 200X; (D) H&E stain, 400X. Arrows indicate ganglion cells. HISTOLOGIC, Vol. XL, No. 1 Conclusion Stain Preparation Toluidine Blue Solution Procedure The toluidine blue method is a reproducible and reliable way of demonstrating ganglion cells in frozen rectal biopsies. This method provides faster and easier identification of ganglion cells than with H&E staining, which can ultimately be used to exclude a diagnosis of Hirschsprung’s disease. This technique provides valuable information for the pathologist and would be easy enough for other general laboratories to incorporate into their routine without extensive modification. 1. Freeze biopsy in OCT™*; cut sections at 6 µm. Bibliography Toluidine blue 2.8 g Urea 4.0 g Ethyl alcohol 280 mL Distilled water120 mL Dissolve urea in water. Slowly stir in alcohol. Add toluidine blue dye. Mix well and filter. Shelf life is approximately 2 years. Fig. 2. Patient C. Toluidine blue stain, 100X. Arrow indicates ganglion cells. A Coffin CM, Spilker K, Zhou H, Lowichik A, Pysher TJ. Frozen section diagnosis in pediatric surgical pathology: a decade’s experience in a children’s hospital. Arch Pathol Lab Med. 2005;129:1619-1625. 2. Stain slides quickly in toluidine blue solution—10 dips. 3. Rapidly rinse in tap water; water mount with coverslip. Shayan K, Smith C, Langer JC. Reliability of intraoperative frozen sections in the management of Hirschsprung’s disease. J Pediatr Surg. 2004;39:1345-1348. Results B The pathologists were asked to comment on the ease of identifying ganglion cells, if any were present, and slides were graded as follows: 1+ Somewhat easy to identify Fig. 3. Patient D. Toluidine blue stain, 200X. Arrow indicates ganglion cells. 3+ Very easy to identify identification (Figs. 1-4). In six out of six cases in which ganglion cells were present, toluidine blue was superior to H&E for the identification of ganglion cells. This finding was subsequently confirmed on permanent H&E stained sections and with acetylcholinesterase (ACE) staining. We conclude that toluidine blue offers superior histological detail for identification of ganglion cells on rectal frozen sections compared to H&E staining. Materials and Methods Seven patients were used in this study; the age range was from 1 day to 3 years with a median age of 1 week; there were four males and three females. Each patient had rectal suction biopsies performed from both the 3 cm and 5 cm areas of the rectum. All samples had frozen section analysis using both a routine H&E stain and the toluidine blue stain. For the purpose of our study, all specimens had further staining done by ACE. The specimens were then routinely processed for permanent sectioning. 2+ Easy to identify — No ganglion cells seen The following is a summary of our results. Patient H&E A1+ B Toluidine Perm Blue Section 2+ C ACE 2+ Neg 2+3+3+ Neg C1+3+ 2+ Neg D1+ 2+ 2+ Neg E — — — Pos F1+ 2+ 2+ Neg G1+ 2+ 2+ Neg D Fig. 4. Patient G. (A) Toluidine blue stain, 100X; (B) Toluidine blue stain, 400X; (C) H&E stain, 100X; (D) H&E stain, 400X. Arrows indicate ganglion cells. *Tissue-Tek® OCTTM (Sakura Finetek, U.S.A., Inc., Torrance, CA). HISTOLOGIC, Vol. XL, No. 1 HISTOLOGIC, Vol. XL, No. 1 Fig. 1. The panels on display in the main corridor of the Medical University of South Carolina, Department of Pathology and Laboratory Medicine offices located in Charleston, SC. Histology as Art: Problems and Opportunities in Creating Giant Photomicrographs James H. Nicholson Research Image Core Facility Department of Pathology and Laboratory Medicine Medical University of South Carolina Charleston, SC [email protected] Histologists, histotechnologists, and pathologists share a secret art form not known to the wider public; they know that histologic slides can often be beautiful and colorful abstract patterns above and beyond their medical utility. Who among us hasn’t been captivated by a particularly graceful etched black pattern in a silver stain…the delicate magenta and blue sunrise tones of a PAS (periodic acid-Schiff), or the brassy boldness of a Masson trichrome? Yet this splendor is seldom exhibited beyond the calendars distributed by microscope manufacturers—beautiful, but mostly given to the very same people who already make and use histologic slides. Microscopic imaging, or photomicrography as we used to call it, has been putting bread on my table for well over three decades. I stay current on the latest technology, and I thought I had been asked to do just about everything one could possibly do with light and glass throughout my career. My work has illustrated countless exhibits, posters, articles, lectures, chapters, and atlases, but the truth is, in all this time, I’ve never had an opportunity to do a permanent display in a public place. My chance finally came, and it proved to be not only a great opportunity, but a great technical challenge as well. One afternoon our business manager called to ask if I had some “pretty microscope pictures.” I sent him a few files of spectacular images I keep for just such requests, suitably sized to drop right into a PowerPoint presentation. A few days later he came by with Steve Coe, the architect who was designing our new departmental offices, who told me, “Your pictures are very beautiful and would be exactly what I was looking for, but when I HISTOLOGIC, Vol. XL, No. 1 enlarge them to 3 × 5 feet, they get fuzzy and pixilated.” After 30 years in the business, not many things surprise me, but this one did. I stared at him and asked “Did you say feet? Three by five FEET?” “Yes, they’re going to be the key architectural feature in the main hall. They will be at eye level where people can walk right up and touch them, and your department chairman was very particular that these photographs have to be absolutely perfect to reflect well on the department.” (Fig. 1.) “Do you have any bigger files that we can use?” asked the business manager. “Not really, we’re just not set up to make photomicrographs that size. You have to understand that it doesn’t come up very often. We’ll have to make all new pictures. What’s the deadline?” “I need them immediately,” said the architect. “They’re going to put us behind schedule.” “Give me 72 hours and I’ll have your pictures,” I said with more confidence than I felt. I had some idea of the problems involved, but I didn’t want to take a chance on the project getting dropped or changed. I locked the door, poured a large cup of coffee, and wrote down the problems to be solved. Fig. 2. Using a 12 megapixel camera, the enlargement is limited by optics, not the camera. (A) At the 4" × 5" size typical of publication, the image is at 780 DPI (dots per inch) and the quality is superb. (B) Enlarged to 8" × 10", the image is at 390 DPI and the resolution is still outstanding. (C) Even at 16" × 20", an unusually large print for microscopy, the camera is holding up well at 200 DPI. The image itself is beginning to look a little soft and hazy. The nuclear detail is visible but not sharp. (D) At 32" × 40", the camera is reaching its limits at 100 DPI, but the microscopic image has deteriorated even more, looking quite blurry. (E) At the enlargement necessary for the display panels, it is apparent that the image is completely devoid of detail. 1. Get some fantastic special stain slides and find the best fields. 2. Get the highest resolution camera available. 3. Carefully process images for maximum quality and enlargeability. 4. Blame Isaac Newton—I knew that what they wanted was virtually impossible because of immutable limitations in the resolving power of optics. Step 1: Where to Go for a Supply of Special Stains I get many inquiries based on the expectation that a photomicrography lab must have a vast collection of glass slides on hand. The only histological slides I have are those that people have left behind. If anyone has an unpilfered slide collection, it’s precisely because no one knows about it. However, the Medical University of South Carolina HISTOLOGIC, Vol. XL, No. 1 has the nation’s only accredited postbaccalaureate histotechnology training program. Because I am on the school’s advisory board, I know that the curriculum involves processing many special stains slides. When I approached the director, he found the project so interesting that he not only arranged for me to borrow the slides but also for the services of two students to go along with them. Without the beautiful histologic work and the enthusiastic assistance of these two exceptional students, the project would not have been successful. I started as their mentor, but they became my collaborators, taking an active role in every step of the process. They selected the microscopic fields, photographed the images, and did the computer processing. Comments about this project from one of the students are included in this article. 1x Field Step 2: High Resolution Photomicrography I’ve always found the local microscope representatives to be extremely cooperative in helping out on special projects, and my very first call for help brought a response. A representative just getting home after days on the road volunteered to drive in after hours to loan me his company’s high resolution camera. This allowed me to jump from my routine camera’s usually adequate 1.9 megapixel image (1600 × 1200) to an extraordinary 12 megapixel image (3000 × 4000), the highest resolution available in a microscope camera at the time. Step 3: Processing for Maximum Enlargeability There are techniques that are useful for making large digital prints. Usually all that is needed for an acceptable result is to make sure that individual pixels are never visible. Seeing visible Objective Magnification / NA Highest Real Magnification 2.5x / 0.075 75x 4x / 0.1 100x 10x / 0.25 250x 20x / 0.45 450x 40x / 0.65 650x 100x / 1.25 1250x Step into a new world of embedding efficiency and take your productivity to new heights. The Tissue-Tek® AutoTEC ® Automated Embedding System, coupled with the Paraform® Sectionable Cassette System, enables embedding speeds unattainable with manual techniques. AutoTEC ® virtually eliminates manual embedding and meets objective Lean criteria. Never before has automation had such a dramatic impact on daily workflow in the histology lab. Enlarged to 1000x Fig. 3. Common objective types and their numerical apertures (NA), showing the maximum useful magnification they can produce. The left-hand column shows the typical field size when they are enlarged normally. The right-hand column shows the result of arbitrarily magnifying each to 1000X. The image doesn’t become really recognizable until the NA of the objective × 1000 reaches approximately half of the 1000X. It doesn’t become really sharp enough to be usable until the NA reaches 0.65. Automate embedding and watch your work flow Automation. Efficiency. Excellence. Visit our web site at www.sakuraus.com Sakura Finetek U.S.A., Inc. • 1750 West 214th Street Torrance, CA 90501 U.S.A. • Phone: (800) 725-8723 ©2006 Sakura Finetek U.S.A., Inc. HISTOLOGIC, Vol. XL, No. 1 Fig. 4. The microscopic field of a 20X objective. The proper way to measure the field would be to use a micrometer slide but the units can be confusing. Noticing that the result was almost exactly 1 mm, I substituted a dime-store ruler. Now it is quite clear, if we enlarge an image from this objective 200X, and print the full field, the result will be 200 mm across. rectangular blocks in a picture will make an image look degraded even in the absence of fine detail, such as in the sky. The solution is easily found in programs such as Photoshop, where resampling generates additional pixels based on an interpolation. While software can never add detail, it can greatly improve the appearance of a picture. If overdone, however, the picture starts to look soft and vague (Fig. 2). considered fine to a layperson. To the trained eye up close, they were obviously overenlarged, soft, and devoid of fine detail. Probably no one around knew or cared that it was possible to throw away the book and find a better way. But I did know, and I was mentoring two future histology professionals, so for their sake and mine, we went back to square one and started over with a new set of assumptions. The Result So Far— Is This the Best That Can Be Done? The Difference Between a Microscope and a Microscope System At this point, by choosing some truly gorgeous special stains and using the finest microscope optics and camera made, what resulted were some of the most amazing images I had ever seen. In fact, in a huge print up to about 26 inches, I would go so far as to call them perfect images. However, for the size required for these proposed panels, I would classify them as merely acceptable. With a quick glance from a few feet away, they would be The traditional relationship between the microscope and the camera is one where the camera records the image that the microscope produces. Accordingly, the magnification and resolution of the image are limited by what can be visualized through the microscope, forcing a choice between field size and resolution. Low power objectives give a large field and poor detail, while high power objectives give great detail but a very small field. Optical limitations make it impossible to have both at once. In the simplest terms, the problem with making big enlargements of photomicrographs is that a lower power field becomes so large that the eye expects to see the kind of high power detail that just isn’t there. It is all based on the resolution of the objective, which is measured by a number called the numerical aperture (NA). Numerical aperture, a very important number, is defined as the sine of the vertex angle of the largest cone of meridional rays that can enter or leave an optical system or element, multiplied by the refractive index of the medium in which the vertex of the cone is located. All you really need to know is that it’s a number that is stamped on the objective right after the magnification. It’s usually ignored, but this is actually the more important of the two numbers. It tells you the objective’s ability to resolve fine detail. Resolution is what microscopy is really all about—not magnification. An objective of a lower power but with a higher NA will actually outperform and produce higher resolution images than Fig. 5. (A) A microscopic image taken without using the background, or flatfield correction. (B) The same field with the correction used. The results speak for themselves. I’m always puzzled how few people use this feature because it is one of the biggest advantages of digital cameras over film. Few other simple steps will do as much to improve the quality of your images. HISTOLOGIC, Vol. XL, No. 1 Fig. 6. (A) The result of attempting to merge files made without a background correction. (B) The results of using images made without disabling automatic exposure. HISTOLOGIC, Vol. XL, No. 1 a higher power objective (Fig. 3). On my confocal microscope I have three oil immersion lenses: 40X, 63X, and 100X. The 100X objective actually has the lowest NA of the three because it is of a lesser quality. The higher the NA of the objective, the greater the resolving power and the higher the enlargeability of the image. The following classic rule is a reliable guide: Rule: The total magnification in the final print of an image can never exceed 1000X the numerical aperture of the microscope objective used, or the image will contain empty magnification and appear blurry. Fig. 7. A screen capture showing Adobe Photoshop CS2 in the process of merging a set of files. This set was actually used in the display. In other words, any image taken with any objective at any NA can be enlarged to any magnification. For example, an image taken at 10X can be enlarged to 1000X, but the effort would be futile because all that would appear is a fuzzy blur. The image will not begin to resemble the clear sharp image taken with a 100X lens until the NA × 1000 is at least above 500. This is not changed by the type of camera or the megapixels of the image. That is a separate issue. Based on the explanation above, it is essentially impossible to make a 60-inch print with full resolution using any camera. For example, an image made with a 20X objective with an NA of 0.45 has a measurable field of the objective that is almost exactly 1 mm wide (Fig. 4). According to calculations, 1000 × 0.45 = 450, so the greatest enlargement possible under our rule would be 450 mm, or about 18 inches. Some imaging specialists allow a factor on very large prints of up to twice the allowable enlargement, but even that would leave you at about half the desired magnification. The bottom line is that the desired result cannot be achieved from a single image. The Microscope— Digital Camera— Computer System Fig. 8. A comparison of the relative image sizes produced by the three methods used in this project. (A) The 350 MB image created by merging 40 separate images created by (C) the 2 megapixel camera. (B) The image produced by the 12 megapixel camera. 10 HISTOLOGIC, Vol. XL, No. 1 Can the computer change any of the laws of optics? Of course not. Isaac Newton is not to be trifled with. NA is still NA and resolution is still limited by it. The computer can sometimes make Fig. 9. Life-size samples of the three image types enlarged to the scale necessary for the display. (A) The 2 megapixel camera shows pixelization and empty magnification. (B) The 12 megapixel camera completely eliminates the pixelization problem but it really does not improve the resolution of the image, which is optically limited. (C) The merged file having been made with a higher NA objective shows significantly more fine detail. It looks like a high-quality photomicrograph even at this extreme size. the optical limits irrelevant. The fact that horses can travel only 30 miles a day is as true today as it was 150 years ago, but it no longer limits our rate of travel. It’s true but not relevant because we have found other ways to travel. The only way to get around the constraints imposed by the limits of resolution is to find another solution. The answer is surprisingly simple. For example, if you were asked to carry 100 gallons of water up a hill and you only considered the option of carrying it all at once, then the task would be impossible. Instead, you could get several smaller buckets and carry it up in manageable loads. Similarly, if an image can’t be enlarged clearly enough in one step, then it should be broken down into multiple images. Each of these smaller images can be taken with a higher power objective with a higher NA, and only have to be enlarged a fraction as much. But then how do they get put together? If you are fortunate enough to have access to a virtual slide scanner such as the Aperio ScanScope (www.aperio.com) or the Nikon COOLSCOPE (www.coolscope.com), you merely have to scan the slides. Some virtual slide makers produce a large image file ready to be handled like any other image file. Others produce a special slide format designed to supply images on demand so that computers and networks will not have to handle the entire huge image file all at once. This type of file can be exported as a printable image file. HISTOLOGIC, Vol. XL, No. 1 Composite prints have been around since at least the 1860s. They were crude and labor-intensive. The individual pictures were very obvious. Now the process is easy—the results are pixelperfect and the images are merged seamlessly. In fact, if I had known how easy it was going to be, I would have faced it with considerably less apprehension than I did. The software that can do this was originally designed to enable the creation of panoramas. Simple versions often are included in the software that comes with an amateur digital camera. Some software will let you do only a single row of images and is not suitable. Other software takes microscopic images in stride. 11 The Procedure Equipment Any good quality microscope will do. The digital camera does not need to have exceptionally high resolution because the images are functioning as pieces of a composite. In fact, too high a resolution will make the files too large to handle. In our case, we returned the borrowed high resolution camera because the lower resolution camera we had was actually better suited for this work. Our camera and its software had two essential features: flatfield correction and the ability to disable the automatic exposure. Flatfield or background correction is a feature where the camera uses a stored image of a blank background to correct for unevenness in illumination. This common, but often unused, feature is essential for satisfactory results (Fig. 5). Most cameras intended for photomicrography include the ability to get perfect illumination, and yet journals are filled with pictures with uneven lighting. This feature must be used properly or the results will be very disappointing—every image will stand out like bricks in a wall. Consult the user’s manual for your camera, or ask your microscope vendor’s representative to help you. Automatic exposure is normally a great convenience, but it can’t be used when gathering images to be merged. The automatic feature will constantly make small adjustments in exposure in response to the darkness or amount of tissue in the field. Although slight, these changes are enough to make an obvious checkerboard pattern in your merged image (Fig. 6). Many cameras have a “use last exposure” option, which is ideal. Make sure the first field is reasonably representative, and then use the same exposure for every other image. If your camera does not have this option, you will need to use manual exposure. Choose the Field and the Objective From the Histotechnology Student— Eowyn Corcrain When I was approached about supplying stained tissue for this project, I was really excited. I had heard of the technology being used in astronomy and was intrigued by the idea of applying a similar concept to microscopic imaging. As a student in the postgraduate histotechnology certification program at MUSC, I was eager to learn about the process. I was also pleased that I would have the opportunity to use some of my own histology work in the project. I was really excited about stained tissue sections being displayed as art in the University’s Pathology Department. I have often found myself awed by the beauty of the microscopic structures we illuminate through histology, but I never thought of its value as art, which could be appreciated not only by my colleagues in pathology but also by the general public. Q: Did you find the computer processing interesting to do? A: Yes I did. Q: Was it difficult to learn? A: Not at all. Q: What was your criteria for picking slides to image? A: I looked for blue as requested by the architect and bold graphic lines. Q: Do you take pride in the finished work? A: Yes, I take people to see it all the time. Q: Did the project give more meaning to the work you had done in the histotechnology school? Once you have chosen a field, do the composite at the next higher objective. Going any higher than that will generate an impractical number of images. You may want to mark the corners of the field or look for landmarks. Generally, 20 to 30 images will make a reasonable composite, unless you are attempting a very full field. Start in one of the corners and do a single row until you reach your mark on the other side. This will tell you if your field size is impractical. If not, then move vertically one field and count the same number of fields back. You will be surprised how accurate field counting is for measuring the distance; however, always allow some room around your area of interest. Moving fields by eye is quite satisfactory, but allow at least a 15% overlap of fields. A larger overlap may be advisable if the tissue is particularly homogenous without good landmarks. If the camera software allows, set up an automatically numbered file system. If not, it is advisable to number the fields sequentially. It is even better to indicate row and number. This will come in handy if the computer is not able to assemble the image automatically. Fig. 10. The images chosen for display. The images were chosen strictly on the basis of color and pattern. (A) Grocott methenamine silver (GMS) – testis; (B) Masson trichrome – kidney; (C) Periodic acid-Schiff (PAS) – colon; (D) Lendrum fibrin stain – muscle; (E) Masson trichrome – dysplastic kidney; (F) Alcian blue – DPAS – colon. A: Yes, much of the work is repetitive. This provided a unique challenge and a chance to use some of our work. Q: Do you think special projects can be a useful part of future classes? A: Yes, it gives the student a goal and something real to work on. 12 HISTOLOGIC, Vol. XL, No. 1 HISTOLOGIC, Vol. XL, No. 1 13 Merging the Images I chose Photoshop CS2 (Adobe Systems Inc., San Jose, CA) to merge images because that is what I use for all of my image processing, so I feel most comfortable using it. I have at least four other software packages that I could have chosen, any one of which may have worked just as well. The Photoshop version supports either a fully automatic or a manual operation. Even in manual mode the image snaps into exact position as soon as you bring it close (Fig. 7). Almost without exception the assembly was fully automatic, requiring no active intervention by the operator. Having little or no experience in computer image processing should not discourage one from trying. This program is almost completely automatic and easy to learn. Both of the histotechnology students became quite proficient without having had any prior experience in image processing. In fact, it seemed to be the favorite part of the project for them. The only limitation I found with the Photoshop version was that the total number of images is limited by the system RAM in your computer. 14 The result is a huge final image that is very much like the ones created by a camera, except for the size (Fig. 8). In camera terminology, we have the equivalent of a 1200 megapixel camera. In order to handle images of this size, a fast computer with a lot of RAM and disk space is required. The Results—Worth the Extra Effort? Looking at these life-size samples (Fig. 9), one can imagine their impact when interpolated to the size needed for the oversized panels. Since creating the panels, we have found other new and useful applications for this technique in the fields of teaching and research. And there are other applications where a large field and high resolution can be achieved. In the end, this project taught my students some very important lessons. It gave them a chance to use their special stains techniques (Fig. 10) and they learned some new microscope and computer skills. Now they definitely know more about optics and resolution than most students. And, like me, they have the pleasure of taking friends and relatives to see the panels. We all share a good feeling that comes from knowing that something is the best that it can be, even though we could have done less and no one would have known. Making the effort to get high-quality images pays off in many ways. There is certainly a visible difference to the trained eye; I truly enjoy the reaction from other professionals in our field when they see the panels. I can almost identify a person’s profession from his or her reaction. Observer Group Typical Comments General public “Look at the pretty panels.” Histologist, Histotechnologist “Wow, great stains; see that alcian blue DPAS.” Pathologist “Great images; look at that kidney. I think he may have early….” Photomicrographer “Fantastic resolution. Those images aren’t even possible. You can’t get that much resolution at this kind of enlargement.” No one yet “Nice job of merging images.” HISTOLOGIC, Vol. XL, No. 1 From the Architect— Steve Coe This renovation project converted one floor of a 1950s laboratory building into departmental offices for the Pathology Department at MUSC. At the beginning of the project, the client stated that the goals of the project would be to provide as much natural light as possible to create a warm and inviting workplace and to somehow incorporate the research done within the department into the aesthetic of the design. The design team’s response was to flood the space with natural light through the use of floorto-ceiling glass panels allowing light from exterior windows to penetrate into the building’s core. Working with the Research Image Core Facility, the architect chose microscopic images of various cell structures based on geometric and color variations; they were printed and embedded in epoxy resin Fig. 11. A comparison of the finished project to the original hallway (upper right). panels and hung on the walls Photos by Brian Dressler. in the main corridor (Fig. 11). The panels are constructed from 40% recycled materials, resulting in a durable, nontoxic resin. The A: Very proud. It is featured on Q: Were you surprised at the architect’s design process included beauty of the microscope our website. 3D computerized rendering tools images? Q: With future medical clients, allowing the client to visualize the would you be inclined to A: They amazed me. They were space before any construction began. like modern art. consider the same technique? Q: Whose idea was it to use large image panels in this way? A: The idea was mine. Q: Had you seen something like this? A: Not really. I had seen some panels of just colored patterns so I knew the technology existed. It seemed natural to incorporate their own images. Q: From the viewpoint of a professional architect, are you pleased with the aesthetic result? A: Definitely. A: Yes, very pleased. I’m quite happy with the way it turned out. Q: I take it that this is an architectural project that you are proud of? HISTOLOGIC, Vol. XL, No. 1 15 MicrowaveAssisted Tissue Processing for Transmission Electron Microscopy G. Boucher, M. Banker, J. Munzner Pfizer Global Research & Development Groton/New London Laboratories Groton, CT [email protected] Conventional Processing Abstract Introduction A microwave-assisted processing protocol for transmission electron microscopy (TEM) is described. This procedure is an adaptation of traditional protocols. It requires an average time of 3 hours and produces uniformly polymerized blocks. Sections are compared with those from conventionally processed samples and ultrastructural morphology is assessed. The significant reduction in sample preparation time coupled with excellent preservation of tissue ultrastructure allows for rapid diagnosis. This is often of critical importance in the diagnostic laboratory. Transmission electron microscopy has long been recognized as a valuable tool in research laboratories to study cellular ultrastructure. One area where ultrastructural analysis of samples by TEM is very useful is in the diagnosis of phospholipidosis. Unfortunately, diagnostic TEM is limited by the time necessary to prepare tissues for examination. Conventional processing for TEM can take up to 72 hours. A method that could decrease the time involved in sample preparation while still maintaining excellent ultrastructural morphology would certainly enhance the usefulness of TEM as a diagnostic tool. To this end, our lab decided to evaluate microwave-assisted tissue Conventional Processing Microwave-Assisted Processing •Control THLE* cells •2000X Microwave-Assisted Processing •Control liver •2000X •Nucleus and •Control THLE cells •10,000X other organelles such as mitochondria and endoplasmic reticulum are easily seen •Perhexilenetreated THLE cells •10,000X •Note the multiple lamellar structures characteristic of phospholipidosis •Control liver •10,000X •Structural detail of cellular organelles is evident Fig. 1. Microwave-assisted processing for TEM compared to conventional processing. *Transfected human liver epithelium. 16 HISTOLOGIC, Vol. XL, No. 1 HISTOLOGIC, Vol. XL, No. 1 17 processing as a way to decrease the time needed for sample preparation.1,2 Microwave technology can reduce sample preparation time to less than 4 hours. However, some older microwave models produced an uneven environment within the microwave cavity leading to sample processing variability. We used a PELCO BioWave® microwave oven (Ted Pella, Inc., Redding, CA) that has a combination of features not found in other microwave ovens. These include a water recirculation system, true variable wattage settings, and a temperature-restrictive temperature probe. The water recirculation system maintains a uniform microwave environment, eliminating hot and cold spots during processing. The variable wattage system has six different power levels that can be user calibrated. This allows microwave processing at very low wattages (eg, 80 watts), which can considerably reduce tissue damage. The temperature probe ensures accurate temperature control in aqueous solutions within 1ºC.3 Methods Tissues The Institutional Animal Care and Use Committee of Pfizer Global Research and Development–Groton Laboratories reviewed and approved all animal procedures used in this study. Liver specimens from 10% neutral buffered formalin (NBF) stock were postfixed in 2.5% glutaraldehyde in 0.1M sodium phosphate buffer and then processed either by conventional methods or by microwave-assisted methods. See Table 1 for details of processing. Cells Transfected human liver epithelial (THLE) cells grown in PFMR-4 medium (Pasadena Foundation for Medical Research medium 4) were plated in one-well permanox chamber slides at 450,000 cells per milliliter and incubated overnight at 37°C with 3.5% CO2. The cells were then dosed with final concentrations of 3 and 10 micromolar perhexilene for 24 hours. After dosing, the cells were washed once with Dulbecco’s phosphate buffered saline, drained, and fixed in a solution containing 2.5% glutaraldehyde and 2% paraformaldehyde in 0.1M sodium phosphate buffer. The cells were allowed to fix for 10 minutes before being scraped off the slide, transferred to a 1.5 mL Eppendorf tube, and centrifuged at 14,000 rpm for 10 minutes. The resulting cell pellets were processed either by conventional methods or by using microwaveassisted methods. See Table 1. Table 1. Comparison of Conventional Processing and Microwave-Assisted Processing Table 1 — Comparison of Conventional Processing and Microwave-Assisted Processing Conventional Processing Microwave-Assisted Processing Fixation Overnight Overnight Buffer rinse 2 × 10 minutes 2 changes, 5 minutes total Osmium postfixation (reduced osmium) 2 hours at 4°C 2 minutes on, 2 minutes off, 2 minutes on 37°C, 80 watts × 2 changes Water rinse 2 changes 2 changes Graded alcohols RT 37°C, 250 watts 50% EtOH 40 seconds 70% EtOH 2 × 10 minutes 40 seconds 95% EtOH 2 × 10 minutes 40 seconds 100% EtOH 2 × 15 minutes 2 × 40 seconds Propylene oxide 2 × 20 minutes Resin: Solvent Spurr’s, RT LR White, 45°C, 250 watts 1:3 3 × 3 minutes 1:1 3 × 3 minutes 2:1 Overnight Pure Overnight 3 × 3 minutes Polymerization 18 – 24 hours, 70°C oven 10 minutes, 60°C, 750 watts 10 minutes, 70°C, 750 watts 10 minutes, 80°C, 750 watts under water, oxygen excluded Total time Up to 72 hours Approximately 3 – 31/2 hours Conclusions • Microwave-assisted processing provides good ultrastructural detail that is indistinguishable from conventionally processed samples • Time savings realized are significant: 3 hours for microwaveassisted processing vs 3 days for conventional processing • Reagent savings are significant: approximately 1 mL per sample for microwave-assisted processing vs 5 mL per sample for conventional processing • Microwave-assisted processing can provide a rapid diagnosis for phospholipidosis • The technique is applicable to both tissue- and cell-based assays References 1. Giberson RT, Austin RL, Charlesworth J, Adamson G, Herrera GA. Microwave and digital imaging technology reduce turnaround times for diagnostic electron microscopy. Ultrastruct Pathol. 2003;27(3):187-196. 2. Nordhausen RW, Barr BC. Specimen preparation for thinsection electron microscopy utilizing microwave-assisted rapid processing in a veterinary diagnostic laboratory. In: Giberson RT, Demaree RS Jr, eds. Microwave Techniques and Protocols. Totowa, NJ: Humana Press; 2001:49-65. 3. Pelco BioWave Laboratory. Microwave System Operation Manual. 2001. Safety First! Rena Fail, HT(ASCP) Medical University of South Carolina Charleston, SC [email protected] I have agonized over writing this article out of concern for the feelings of those who work in my laboratory. I hope that my colleagues will understand that this was submitted neither to embarrass them as individuals nor to embarrass our facility, but to open a dialogue on safety issues. A few months ago we had a series of events occur related to safety and contamination that were cause for concern. As the senior technologist in this laboratory, I feel that I may not have sufficiently stressed the importance of understanding the hazards of the chemicals we use. Most of the incidents that occurred in 18 HISTOLOGIC, Vol. XL, No. 1 Fig. 1. Wooden tongue depressor left in a bottle of hydroquinone. the lab could have been avoided by paying attention to detail, being aware of what is going on around us, using good safety practices, and reading the material safety data sheet (MSDS) forms. Sometimes these errors occurred because of miscommunication or as a result of hurrying, and sometimes they were brought about by distractions such as too many people talking at once or noisy machines making it difficult to hear. But another important factor to consider is complacency. Yes, complacency—the familiarity that comes from working with these chemicals on a daily basis that lulls us into believing that we don’t need to check the MSDS form. My introduction to what can happen if one does not follow correct procedure for handling hazardous chemicals occurred on my first day as a histology student 30 years ago. A technician was making Erlich’s hematoxylin using heat. She heated it to boiling and shortly thereafter called the instructor’s attention to what was happening. He immediately ordered us to vacate the room. Most of the hematoxylin ended up on the ceiling. I am still surprised that my entire class came back the second day. I was responsible for one of the recent events in our lab. I spilled about 200 milliliters of xylene while turning to HISTOLOGIC, Vol. XL, No. 1 look at someone who was addressing me rather than looking at what I was doing. What I thought was a small spill, due to the small amount of liquid I could see on our floor, was creating havoc in the laboratory one floor below us as most of the xylene had found its way through a penetration point in the floor and leaked into a ceiling light fixture. The heat from the lights heated the xylene and the resulting fumes cleared the room. We never imagined the mayhem it caused until we received visits from two managers and the lab director, most of the personnel from our facility’s Safety Department, six security officers sent to investigate, and hospital administration. It was a very frightening experience for individuals smelling xylene for the first time and one that could easily have been avoided had I been paying more attention to what I was doing. Some of the incidents I’ll share with you here involved solution preparation. We all know that many factors contribute to good staining results including proper technique, accurate solution preparation, the quality of the chemicals, etc. It is important to use clean glassware and utensils free of soap residue, and to understand the operation of instrumentation for precise measurement to ensure accurate preparation. Of course it is of paramount importance that the 19 Fig. 1 was being preserved for future use as it was found in a bottle of hydroquinone, which, after all, is used in wood preservative. Fig. 2. Plastic transfer pipette left in concentrated sulfuric acid. correct chemical be chosen to prepare the solution. Do not assume that just because chemicals or dyes have similar names that they are in fact the same. Synonyms are included on the MSDS form. One individual failed to carefully review the specifics of the protocol and prepared chromic acid solution from potassium dichromate thinking it was the same as chromium trioxide. Each of these chemicals looks different in crystalline form but have the same orange hue when mixed with water. You can imagine our frustration when our fungal stain stopped working for no apparent reason. It took a few weeks and many, many repeats using freshly made chromic acid before it was discovered the wrong chemical had been used for the stock solution. Contamination of chemicals from poor work habits can be costly and cause delay in patient testing. Maintaining stock chemical purity is absolutely key to running a successful staining lab. Capping a dry chemical tightly can help prevent the introduction of moisture in a humid climate. Cleaning your work area between each task can minimize accidents. Making sure your spatulas are clean and dry can also prevent the introduction of contaminants. We thought we had eliminated the problem of contamination from spatulas by using disposable wooden tongue depressors to measure out powders. I did wonder if the one shown in 20 The tongue depressor, though somewhat disconcerting, did not cause alarm, but finding a plastic transfer pipette in the sulfuric acid stock bottle was cause for great concern (Fig. 2). The use of plastic pipettes instead of glass pipettes to transfer acid is a dangerous practice that may cause bodily harm from acid burns. And secondary to the safety hazard this poses to the individual is the contamination of the chemical. As you can see, a plastic pipette was left in the concentrated acid bottle. The acid in the jar on the left is clear and free of contaminants, but the acid in the jar on the right is slightly discolored and the pipette brown, possibly the result of the acid acting on the plastic. It was lucky no one suffered from an acid burn as a result of the mistake, which pointed out to me that the individual responsible did not understand the risk of using a plastic pipette with concentrated mineral acid. It is never a good practice to open more than one chemical at a time when preparing solutions. You can only measure out one at a time, and having multiple chemicals open can lead to mishaps. Caps on acids and alkaline solutions are color coded to their labels, but they are of the same size and can easily be switched if you don’t pay close attention. Again, this could result in an injury due to incompatible chemicals being mixed. In this case, it was a “clean” cap from hydrochloric acid that was placed on the ammonium hydroxide bottle (Fig. 3). Figure 4 shows just how easily a solution can become contaminated from having the wrong cap placed on the jar. The cap from an auraminerhodamine solution was inadvertently placed on the stock glycerin bottle. It does not take much to contaminate a whole jar. Contamination is costly. The result of this cap switch can easily be seen, but in the case of colorless liquids, contamination will likely go unnoticed. Mixing up caps from incompatible substances such as placing a cap from an alcohol container onto a chromic acid bottle could result in fire. HISTOLOGIC, Vol. XL, No. 1 This sort of carelessness in an immunohistochemistry laboratory can wreak havoc if one antibody mistakenly becomes introduced into another. The resulting aberrant staining will cause a good deal of confusion, not to mention additional costs associated with repeated tests using these expensive reagents. You are probably thinking this could never happen in your lab. But imagine the following scenario. Our diluted primary antibodies are routinely vortexed prior to being loaded onto the immunostainer. Mixing can cause small bubbles to form, which can confuse the instrument. A technician who noticed the bubbles in AE1/AE3 used an applicator stick to pop them. A drop of AE1/AE3 fell into the next vial—and that one drop did make a crucial difference. The cytomegalovirus colon control had both inclusion body and epithelial staining (Fig. 5), proving that even a microscopic amount of contamination can create erroneous results. The next morning as I was reviewing the slides and puzzling over what was causing the aberrant staining, the technician recalled the incident and because of his candor, we were quickly able to pinpoint the problem. Sometimes altering a procedure slightly may seem like a time-saver, but rushing Fig. 3. Labels and bottle tops of hazardous materials are often color coded. Here, a cap from hydrochloric acid was placed onto an ammonium hydroxide bottle. can and does cause accidents. Glass pipettes need to be twisted firmly into the pi-pumps. Trying to force the pi-pump onto a glass pipette may cause the pipette to break, resulting in serious injury. While the pipette must be firmly inserted into the pi-pump, sometimes even a little force can cause the pipette to snap. While I was waiting for a colleague to be sutured from just such an accident, a physician’s assistant in our Emergency Room told us of a research assistant who stabbed herself in the foot with a pipette. She had been wearing flip-flops. It is important that each of us understands how the fume hood should be used and how storing items in the hood can reduce its effectiveness. Sometimes we need reminding that the glass is supposed to be between us and the hazardous chemical we are working with. It isn’t all that uncommon to witness individuals working with their head inside the hood. This definitely compromises any protection that a fume hood is designed to offer. Accidents do and will happen in every laboratory. Things will get spilled, glass will break, people will cut themselves. We have all seen cuts from microtome blades, razor blades, scalpels, the edges of glass slides, and coverslips, but the likelihood of injury can be reduced by practicing good work habits. Even an apparently minor spill can have much larger repercussions. Read the MSDS forms, exercise care to protect yourself and others, and always read and listen carefully to instructions. Wear personal protective equipment. Follow standard operating procedure for safe solution preparation. Be aware of what is going on around you, so you don’t become startled by others coming into the laboratory. And perhaps most important, acknowledge your gaffe. Admitting your error can help others learn to avoid making the same mistake and you may very well benefit from a review in safety procedures. Don’t confuse speed with accuracy—the quantity you produce is less important than the accuracy of your tests and your safety. Be mindful and considerate of what others are doing. snap freezing tissues, could be cooled down in some other manner if we ran out of liquid nitrogen. The technician suggested we could cool the isopentane in a low temperature freezer. This seems like a logical thought process but I explained why this is not a good idea with pictures of a lab that had been destroyed by storing isopentane in a freezer.1 Fortunately, this employee asked before acting, but it is easy to see how a practical suggestion such as this can have a very bad outcome. Most of the safety training at our facility is done via the computer now. The advantage is that it can be done within each department at the employee’s convenience. The disadvantage is that we do not hear the stories individuals can impart from actual incidents and personal experience. In the past, personnel from the OSHA office conducted the lectures and shared anecdotes. Most of us do not want to embarrass ourselves or our co-workers by sharing these problems, but that is one of the most valuable ways we can gain an understanding of how some accidents can occur. Keep yourself safe, take the time to follow safety procedures, and minimize distractions. And above all, don’t be afraid to share your mistakes so that others may learn from your experience. Reference 1. Skinner RA. More than just a mandatory exercise HistoLogic. 2003;36(1):1-4. Fig. 4. A bottle of glycerin was contaminated with auraminerhodamine stain when the wrong cap was placed on the bottle. Fig. 5. Contamination of an antibody used to demonstrate cytomegalovirus infection caused erroneous staining on epithelial cells. Do take the time to read MSDS forms. I was asked recently if isopentane (2-methyl butane), which is used for HISTOLOGIC, Vol. XL, No. 1 21 Access HistoLogic Archives U Mark Your Calendar! Educational Opportunities in 2007 ® U Mark Your Calendar! Educational Opportunities in 2007 JUNE June Tennessee Society for Histotechnology Meeting Contact: Jennifer Hofecker Email: [email protected] June Georgia Society for Histotechnology Contact: Mike Ayers Email: [email protected] 15 University of Texas Health Sciences Ctr/San Antonio Teleconference 12:00 pm Central Time (800) 982-8868 Title: “Apoptosis: A Detection of Cell Death” Speaker:Frances Swain, HT(ASCP), AAS Department of Orthopaedic Research University of Arkansas Little Rock, AR AUGUST 17 22 OCTOBER University of Texas Health Sciences Ctr/San Antonio Teleconference 12:00 pm Central Time (800) 982-8868 Title: “Phosphorylation Pathways and Immunohistochemistry” Speaker: Anne Lewin, BS, HT(ASCP), QIHC(ASCP) Histotechnologist/Research Scientist in Oncology Bristol Myers Squibb Princeton, NJ 19 University of Texas Health Sciences Ctr/San Antonio Teleconference 12:00 pm Central Time (800) 982-8868 Title: “The Biology of Cancer” Speaker:Jerry Santiago, BS, HTL(ASCP), QIHC Pathology Technologist Shands Hospital Jacksonville, FL 26–31 NSH Teleconference 1:00 pm Eastern Time Contact:(301) 262-6221 [email protected] Title: “Ergonomics for Laboratory Professionals” Speaker:Jan Minshew, HT(ASCP)HTL Leica Microsystems, Inc. Bannockburn, IL National Societyfor Histotechnology Symposium/Convention Site: Denver, Colorado Contact:Aubrey Wanner (301) 262-6221 Email: [email protected] 22 ASCP Teleconference 12:00 noon Central Time (800) 267-2727 Title: “Where Do We Begin? Working Up a New Antibody in Tissue Sections” Speaker:Mary Vaughn, HT(ASCP) Roswell Park Cancer Institute Buffalo, NY 27 NSH Teleconference 1:00 pm Eastern Time Contact:(301) 262-6221 [email protected] Title: “New Shipping Regulations for Chemicals and Biohazards” Speaker:Linda Durbin, Exakt Technologies, Inc. Oklahoma City, OK Sometimes once is not enough. That’s why Sakura features the HistoLogic® Archives on its web site at www.sakuraus.com. Whether you want to review recent advances or decades-old innovations in histology, you can find ample material in our archives. The HistoLogic® Archives enable users to access articles from past HistoLogic ® issues dating back to 1971. Just type in a keyword in our archive search engine or look up an article by subject category. It’s that simple. The HistoLogic® Archives. Another resource that demonstrates Sakura dedication to histology. 22 NOVEMBER SEPTEMBER 6–8 JULY 20 University of Texas Health Sciences Ctr/San Antonio Teleconference 12:00 pm Central Time (800) 982-8868 Title: “Lab Space—The Final Frontier” Speaker:Elizabeth A. Sheppard, MBA, HT(ASCP) Product Manager Ventana Medical Systems, Inc. Tucson, AZ 25 NSH Teleconference 1:00 pm Eastern Time Contact:(301) 262-6221 [email protected] Title: “IHC for Viruses and Other Microorganisms” Speakers:Sheron Lear, HT(ASCP)HTL, QIHC and Alvin Martin, MD Univ. of Louisville and Brown Cancer Center Louisville, KY 21 26 Region 2 Symposium Delaware, Pennsylvania, New Jersey, and Maryland State Histology Societies Site: Newark, Delaware Contact:Michelle Hart (302) 733-3657 Email: [email protected] University of Texas Health Sciences Ctr/San Antonio Teleconference 12:00 pm Central Time (800) 982-8868 Title: “Instrumentation—A Capital Idea!!!” Speaker:Terry Braud, HT(ASCP) Anatomic Pathology Supervisor Holy Redeemer Hospital Laboratory Meadowbrook, PA 28 NSH Teleconference 1:00 pm Eastern Time Contact:(301) 262-6221 [email protected] Title: “Fixation—From Acetone to Zinc” Speaker:Peggy Wenk, HTL(ASCP)SLS William Beaumont Hospital Royal Oak, MI University of Texas Health Sciences Ctr/San Antonio Teleconference 12:00 pm Central Time (800) 982-8868 Title: “Normal and Abnormal GI Tissues: A Comparison of Mucosal Morphology and Staining Characteristics” Speaker:Pamela Colony, PhD, HT(ASCP) Program Director of Histotechnology State University of New York Cobleskill, NY NSH Teleconference 1:00 pm Eastern Time Contact:(301) 262-6221 [email protected] Title: “Muscle Anatomy, Special Stains and Enzyme Histochemistry” Speaker:D. Wilson, MD William Beaumont Hospital Royal Oak, MI 16 DECEMBER 19 HISTOLOGIC, Vol. XL, No. 1 HISTOLOGIC, Vol. XL, No. 1 NSH Teleconference 1:00 pm Eastern Time Contact: (301) 262-6221 [email protected] Title: “Water Quality for the Histology Laboratory” Speaker:Ethel Macrea, HT(ASCP), QIHC Southwest Skin Pathology Service Tucson, AZ 23 The foundation of specimen standardization Precision grossing tools bring standardization to the otherwise variable process of grossing. The new Tissue-Tek® Accu-Edge® set of grossing tools provides accurate cutting for exact specimen size and thickness. • Unique grossing board features 2 adjustable wells • Grossing forks in 3 sizes make it easier to gross soft specimens To receive your own copy of HistoLogic,® or to have someone added to the mailing list, submit home address to: Sakura Finetek U.S.A., Inc., 1750 West 214th Street, Torrance, CA 90501. • Trimming and scalpel blades deliver uniform results for consistent tissue processing with the Tissue-Tek® Xpress™ Rapid Tissue Processor The editor wishes to solicit information, questions, and articles relating to histotechnology. Submit these to: Vinnie Della Speranza, HistoLogic® Editor, 165 Ashley Avenue, Suite 309, Charleston, SC 29425. Articles, photographs, etc, will not be returned unless requested in writing when they are submitted. Presorted Standard US Postage Paid EPI Fulfillment 49018 Sakura Finetek U.S.A., Inc. 1750 West 214th Street Torrance, CA 90501 No varnish in this area.