1
Kanban
Visualisation
Visualisation is the means by which we can understand the work and the workflow by using a
kanban board to create a powerful visual management tool that shares a mental model which is
visual, interactive and persistent.
In a recent TED Talk [4], Tom Wujec explains how this works when he talks about three ways
that the brain creates meaning. Firstly, visualisation creates a mental model because of the way
that different areas of the brain process different visual inputs such as shape, size, and location.
Secondly, interaction enriches the mental model further through engagement. Finally,
persistence allows the mental model to be part of an augmented memory which can evolve over
time.
This leads to the idea of boundary objects. Brian Marick wrote an introductory paper [5] in
which he talks about communities and practice and interest. A community of practice is formed
around a work discipline, while a community of interest is formed around a common problem or
concern. Communities of interest are made up of members of different communities of practice.
A boundary object provides a means for communities of interest to communicate across their
different practices.
Marick lists several properties of a boundary object which can be useful to bear in mind when
building a kanban board; it should be a common point of reference for the community of
interest, represent different meaning to different members of the community and help translation
between the meanings, support coordination and alignment of the work within the community,
be a plastic working agreement which evolves as the community learns, and address different
concerns of the community members simultaneously.
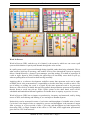
A kanban board can be considered to be a boundary object when it is a social artefact which is a
focal point for a team. By visualising a team’s work, it becomes a common point of reference.
The representation of the work, and its status, enables communication and coordination between
all team members, as well as visualising the workflow and policies that are the team’s working
agreements. The kanban board should be able to evolve with workflow and policies over time.
Thus a kanban board represents the shared mental model which is created collectively and
collaboratively, and helps clarify the meaning of what the board is representing.
Another relevant set of ideas to visual management are those raised by Dan Pink when he talks
about the surprising science of motivation. In his book "Drive" [6], he says that rather than the
carrot and stick approach of extrinsic motivation, a better approach is intrinsic motivation,
which consists of three elements; autonomy, mastery and purpose. Autonomy, or the “desire to
direct our own lives”, is achieved when team members can see what needs doing, understand the
working agreements, and choose themselves what they should do. Mastery or “the urge to get
better and better at something that matters” is achieved through being able to interact with the
kanban board to evolve and improve it. Purpose, or “the yearning to do what we do in the
service of something larger than ourselves”, is achieved when the persistence of the kanban
board makes it clear what the value of the work is and why it is being done.
A kanban board is a visualisation multiple pieces of data. In his classic book “The Visual
Display of Quantitative Information” [7], Edward Tufte introduces a set of principles for the
effective display of data and it is insightful to review some of these ideas.
Methods & Tools * Summer 2010 * Page 6