1
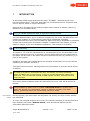
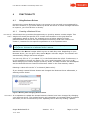
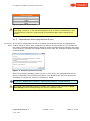
USER MANUAL TPI NEXT TEST MATURITY MATRIX TOOL User Manual: TPI NEXT Test Maturity Matrix tool Document History Document Location The source of this document can be retrieved from Sogeti Nederland B.V. Revision History Date of this Revision: Version 1.0 Date 17-11-2009 1.2.0 07-09-2012 1.2.1 10-01-2013 Sogeti Nederland B.V. 10-01-2013 Date of next Revision: Authors Reinder Otter, Loek Wilhelmus Tom Langebroek, Bob Legrand, Jan Sleutjes Tom Langebroek Distribution www.tpinext.com www.tpinext.com, TPI Next CoE www.tpinext.com, TPI Next CoE Version: 1.2.1 Page 2 of 30 User Manual: TPI NEXT Test Maturity Matrix tool CONTENTS 1 INTRODUCTION ........................................................................ 3 2 INITIALISE NEW ASSESSMENT DOCUMENT .......................................... 4 2.1 3 New document: Enable Macro’s .................................................................4 2.1.1 Security Warning Excel 2003 ...........................................................4 2.1.2 Security Warning Excel 2007 ...........................................................4 2.1.3 Security Warnings Excel 2010 ..........................................................5 2.2 Changing language .................................................................................6 2.3 Adding Meta data ..................................................................................6 USER SCENARIO’S ..................................................................... 7 3.1 3.2 First Business Driven TPI assessment ...........................................................7 3.1.1 Using Key Areas ...........................................................................7 3.1.2 Using Business Driven TPI and CMMI ..................................................8 Successive TPI NEXT assessment(s) .............................................................9 3.2.1 4 Using Clusters .............................................................................9 FUNCTIONALITY ...................................................................... 10 4.1 Using Business Drivers ........................................................................... 10 4.1.1 Creating a Business Driver ............................................................ 10 4.1.2 Dependencies when using Business Drivers ........................................ 11 4.2 Reporting .......................................................................................... 12 4.3 Field on the Information sheet ................................................................ 12 4.4 List all Checkpoints .............................................................................. 14 4.5 Changing lanes .................................................................................... 14 4.6 Refreshing ......................................................................................... 15 4.7 Graphics ........................................................................................... 15 4.8 Test Maturity Matrix ............................................................................. 17 4.9 Benchmark ........................................................................................ 18 4.9.1 Connecting the Benchmark dataset ................................................. 19 4.9.2 Configuring comparisons .............................................................. 20 5 FREQUENTLY ASKED QUESTIONS ................................................... 24 6 KNOW ISSUES AND WORK AROUNDS ............................................... 25 6.1 General ............................................................................................ 25 6.2 Information sheet ................................................................................ 25 6.3 Test Maturity Matrix ............................................................................. 25 6.4 All checkpoints ................................................................................... 25 Sogeti Nederland B.V. 10-01-2013 version: 1.2.1 Page 1 of 30 User Manual: TPI NEXT Test Maturity Matrix tool 7 6.5 Key Area sheet.................................................................................... 25 6.6 Cluster sheet ...................................................................................... 27 6.7 CMMI sheet ........................................................................................ 27 6.8 Checkpoints to improve ......................................................................... 27 APPENDICES .......................................................................... 28 7.1 Bibliography ....................................................................................... 28 Sogeti Nederland B.V. 10-01-2013 Version: 1.2.1 Page 2 of 30 User Manual: TPI NEXT Test Maturity Matrix tool 1 INTRODUCTION In November 2009 Sogeti presented the book “TPI NEXT - Business Driven Test Process Improvement”. This book describes the new Business Driven TPI model and how to use this model in various situations. References to this book will be made throughout this manual as follows (where [1] stands for the TPI NEXT book): [1] 5: BDTPI follows the steps of a generic change process. The Test Maturity Matrix tool is created to support the use of the TPI NEXT book and support the creation of a Test maturity matrix and subsequent reporting In this document the use of the Test Maturity Matrix tool will be explained by following certain user scenario‟s as described in chapter 3. References from chapter 3 will be made to chapter 4 (for more detailed explanation). This process is as follows: 4.2: Reporting In chapter 3.1.2 it will be explained how to use Business Driven TPI and CMMI in the tool with references not only to the book, but the white paper as well. References to this paper will be made in the same way as to the book but with [2] instead of [1] in front of the chapter. Chapter 4 provides more details about the complete functionality of the tool without explaining the different scenario‟s. Throughout this document, warnings about the functionality or process will be shown as follows: In order to be able to understand the tool, we assume you have knowledge about TPI NEXT and its terminology. If not, we would recommend reading this book first. The tool and this manual do not explain TPI NEXT assessments and improvements. If for some reason problems within the document can occur, this will be shown as follows: The Test Maturity Matrix tool is created in Microsoft Excel for version 2010, 2007 and 2003.If you use another version or different software (like Open Office), guarantees about the functionality cannot be made. Test maturity matrix On the left side, the sheet name will be placed (as shown) for which certain actions are described. If a user has changed anything in the tool, for instance indicating if Checkpoints have been fulfilled, the button “Redraw matrix” must be selected before the new information becomes visible. Sogeti Nederland B.V. 10-01-2013 version: 1.2.1 Page 3 of 30 User Manual: TPI NEXT Test Maturity Matrix tool 2 INITIALISE NEW ASSESSMENT DOCUMENT The tool is explained through standard user scenarios that are described in chapter 3. First a new document needs to be set up. This chapter describes the actions for changing the language and meta data. For this version of the tool, a new file should be used when executing a new TPI NEXT assessment. It is not yet possible to log successive assessments in the same document. 2.1 New document: Enable Macro’s When opening the Test Maturity Matrix Tool, Microsoft Excel will warn about macro‟s, depending on the local security settings. In case the macros are disabled, the tool can be used, but will not calculate the workbook. When the Workbook is not calculated, automatic coloring and graphs are not updated. Besides the buttons to use the functions within the Tool will be disabled. 2.1.1 Security Warning Excel 2003 For Excel 2003 the message will look like presented in Figure 1. Figure 1 Security Warning MS Excel 2003 2.1.2 Security Warning Excel 2007 For Excel 2007 the message will look like presented in Figure 2. Sogeti Nederland B.V. 10-01-2013 Version: 1.2.1 Page 4 of 30 User Manual: TPI NEXT Test Maturity Matrix tool Figure 2 Security Warning MS Excel 2007 (enable via options) 2.1.3 Security Warnings Excel 2010 For Excel 2010 the message will look like presented in Figure 3. Figure 3 Security Warning MS Excel 2010 Besides the macro warning, Excel 2010 will pose a „protected view‟ message (Figure 4) when the file was downloaded from a possible hostile environment (internet, email, etc.). To use the Tool, disable the protected view. Sogeti Nederland B.V. 10-01-2013 version: 1.2.1 Page 5 of 30 User Manual: TPI NEXT Test Maturity Matrix tool Figure 4 Protected View warning MS Excel 2010 2.2 Changing language When assessing a test organization for the first time, it is recommended to create one template first containing the appropriate language. Language selection Figure 5 Language selection button Select the “Language selection” button and the appropriate language from the popup. Selecting “Cancel” will close the popup window and no actions will be executed. When selected “OK” the Tool will be initiated for the selected language. In case already a view created as described in chapter 3, the view will be „translated‟ to the new selected language. There is no need to delete any sheets manually. After selecting “OK”, the Test Maturity Matrix needs to be updated (by pressing “Redraw Matrix” button) in order to show the correct language. Reason for this is that automatic calculations in the sheets are turned off because of performance. Redrawing the Matrix may take some time depending on the processor speed of your computer. 2.3 Adding Meta data When assessing a test organization for the first time, it is recommended to add the meta data for future references. The meta data is added in the Meta Data section as shown in Figure 6. Meta Data sectiion Figure 6 Meta data section Sogeti Nederland B.V. 10-01-2013 Version: 1.2.1 Page 6 of 30 User Manual: TPI NEXT Test Maturity Matrix tool 3 USER SCENARIO’S In this chapter the tool is explained through standard user scenarios. This is done in order to show the user how best to use the tool and in what way he or she should perform certain actions in order to get the best results. These scenario‟s have been based on the actions that are described in the TPI NEXT book and are commonly taken when executing a TPI scan. For this version of the tool, a new file should be used when executing a new TPI NEXT assessment. It is not yet possible to log successive assessments in the same document. 3.1 First Business Driven TPI assessment 3.1.1 Using Key Areas When assessing a test organization for the first time, it is recommended to use the Key Area sheets to do this. In this way, the checkpoints are bundled per Key Area which makes it easier to address certain aspects of the organization. Information Figure 1 Create Key Area sheets Select “Create” in “A sheet per Key area”; after selecting “yes” in the popup, the tool will generate all 16 key area sheets. Selecting “no” will close the popup window and no actions will be executed. Key area sheet Figure 2 Filling in the Key area sheets For all Checkpoints of the Key areas it can be indicated if a Checkpoint has been fulfilled by selecting “Y” instead of the default “N”. “NA” (not applicable) is possible as well. Additional comment can be added if necessary. Selecting NA will make this checkpoint obsolete and therefore it will not be included in the graphics and other calculations within the tool. Sogeti Nederland B.V. 10-01-2013 version: 1.2.1 Page 7 of 30 User Manual: TPI NEXT Test Maturity Matrix tool Test Maturity Matrix After filling in checkpoints, the Test Maturity Matrix needs to be updated in order to show the results by pressing the “Redraw Matrix” button on the “Maturity Matrix” sheet. Reason for this is that automatic calculations in the sheets are turned off because of performance. Redrawing the Matrix may take some time depending on the processor speed of your computer. 4.6 Refreshing When checkpoints have been filled in, the Business Driver can still be changed or filled in. When all is ready, a report can be generated with the checkpoints that need improvement. 4.2 Reporting 3.1.2 Using Business Driven TPI and CMMI This function can be used to map the results to the CMMI levels 2, 3, 4 and 5. The Checkpoints of the Business Driven TPI model are divided over the CMMI level they belong to; per CMMI level the Checkpoints are shown, related to their original Key area. Note that two key areas, Test tools and Test environment, are not applicable in this situation and are marked grey in the maturity matrix. Test Maturity Matrix Figure 3 CMMI Test Maturity Matrix All available Checkpoints can now be logged with their related results, fulfilled or not fulfilled. When the checkpoints are filled in and you want to change (back) to the TPI NEXT matrix, this can be done by changing lanes: 4.5 Changing lanes For more detailed information about the mapping of CMMI and TPI NEXT, the corresponding Whitepaper can be used. [2] White Paper, TPI NEXT Business-Driven Clusters for CMMI Sogeti Nederland B.V. 10-01-2013 Version: 1.2.1 Page 8 of 30 User Manual: TPI NEXT Test Maturity Matrix tool 3.2 Successive TPI NEXT assessment(s) 3.2.1 Using Clusters If you already have done a TPI NEXT assessment with the tool using the Key Area sheets, it is recommended that in the successive assessments, the checkpoints are filled in with the cluster sheets. In this way, you can now easily see what checkpoints need to be improved in order to get to the next cluster (step) in the improvement process. For example; using the cluster sheets, you can now see that in cluster A only two (2) checkpoints remain and in cluster B ten (10). This means that the first step (cluster A) is now only a matter of improving those two checkpoints and the focus should be on the checkpoints from cluster B. On the other hand, if Cluster A still needs to improve ten (10) checkpoints and cluster B only two (2), this means that cluster A needs all the attention before moving on to the checkpoints in cluster B. If there are still a lot of checkpoints left to improve, using these cluster sheets can now give you the opportunity to only focus on the first few clusters (up until 15 checkpoints for example) and not the whole matrix. Information First copy your initial scan before making any changes. Next thing you do is deleting the Key Area sheets. And choose “yes” when asked to preserve answers and notes. 4.5 Changing lanes Now you can create the cluster sheets by choosing “create” as shown below: Figure 4 Creating Cluster sheets Of course you should change the data on the “information” sheet as well. 4.3 Field on the Information sheet These steps should be taken with every successive assessment for a particular test organization and/or project. Be aware that when changing the business driver, an update needs to be done in order to put the checkpoints in the correct cluster sheet. Sogeti Nederland B.V. 10-01-2013 version: 1.2.1 Page 9 of 30 User Manual: TPI NEXT Test Maturity Matrix tool 4 FUNCTIONALITY 4.1 Using Business Drivers Choosing the correct Business Driver is a process on its own and is not supported by the tool. However, if you know which Key areas are above or below average relevance to improve, you could fill this in directly. 4.1.1 Test Maturity Matrix Creating a Business Driver A business driver provides the opportunity to give Key areas a certain weight. This weight will usually be specific for a certain client situation or the goal that the organization wants to reach. For example giving a higher weight to Tester professionalism will move the first Checkpoint of this Key area from cluster D to cluster C, because for this specific organization it is an important issue. [1] 2.2.1 The model has specific properties to ensure its quality and relevance [1] 6.6.1 TPI used in a „business driven‟ manner Standard is the Neutral weight which is given to each Key area. Depending on your Business driver, you can give a Key area a Higher or Lower weight. The Clusters will automatically change with these weights. You can only fill in a “x” (or capital “X”) in the fields below the H/N/L. Furthermore, it is only possible to choose one option (e.g. not H and N together, but only H or N). While changing the relative weight of the Key areas, the base Clusters will be adapted and the business-driven Clusters will become visible in the Test maturity matrix. Deleting a value will set the “x” to Neutral (basic value). If you already created Cluster sheets and changed the Business Driver afterwards, a warning will be shown. Figure 5 Warning when changing Business driver Information It is important to update the sheets because clusters have been changed by changing your business driver. The update function will remember your already filled in answers and notes, so can be used at any time. Updating can be done by clicking “update”. Sogeti Nederland B.V. 10-01-2013 Version: 1.2.1 Page 10 of 30 User Manual: TPI NEXT Test Maturity Matrix tool Figure 6 Update the cluster sheets It is recommended that you think about your business driver before you start assessing. However, it can still be changed during or after the assessment. The “checkpoints to improve” sheet should be generated again after changing the driver. 4.1.2 Test Maturity Matrix Dependencies when using Business Drivers In the above mentioned process of creating new business drivers by changing the relative value on a Key area, sometimes a warning will be produces. This is because the model comprises dependencies between some Checkpoints and changing the order of Key areas in a Cluster will violate against those rules. An example of these warnings is shown below. Figuur 7: Examples dependency message. Next to this popup message (which will occur only once), the dependencies will be shown underneath the Test maturity matrix. The assessor can decide to ignore the messages or change the priority of certain Key Areas. [1] 3.6: Dependencies assist in defining the sequence of improvement actions. Note that when dependencies are violated, the cluster of that checkpoint does not change unless the depending Key Area is changed as well. Sogeti Nederland B.V. 10-01-2013 version: 1.2.1 Page 11 of 30 User Manual: TPI NEXT Test Maturity Matrix tool 4.2 Reporting At the end of an assessment (be it the first or a successive one), a sheet can be generated which contains all Checkpoints that are not fulfilled yet. This can be done by clicking on the “Create” button as shown below. Information Figure 8 Report not fulfilledCheckpoints - Create A new sheet will be created called “Checkpoints to improve”. On this sheet only those Checkpoints which have a “N” or “n” in the field “Fulfilled” will be shown. Of course this sheet can be generated at any time during a scan. To generate a new report, you have to delete the sheet “Checkpoints to improve” first by clicking the “Delete” button as shown below. Figure 9 Report unchecked Checkpoints - Delete The button “Create” will now be enabled again and a new “Checkpoints to improve” sheet can be created. When “changing lanes”, note that the generated report will be deleted as well. 4.3 Information Field on the Information sheet On this sheet you can fill in some information of the project and/or the TPI NEXT assessment. The field will be explained below. Figure 10 General information With project (client), the name of the project and/or client can be filled in for reference. A TPI NEXT scan can be executed by 1 assessor, but can obviously (in larger projects), be done by more assessors. Normally no more than 3 assessors are needed in order to keep the assessment itself controlled. Sogeti Nederland B.V. 10-01-2013 Version: 1.2.1 Page 12 of 30 User Manual: TPI NEXT Test Maturity Matrix tool Figure 11 Entry date This is the date of the execution and/or filling in the answers of the TPI NEXT assessment. Figure 12 Reviewers With every assessment, it can be very useful if a colleague reviews this in order to get a correct image of the assessment. The Test Maturity Matrix results should also be reviewed by the stakeholder(s) that have undergone this assessment before making it final. Figure 13 Notes Notes can be made about anything that has to do with the assessment or the test process which cannot be placed anywhere else in the tool and are still valuable for the assessment. Figure 14 History Every time a button is used (for creation, deleting or updating), a new line is created and filled in. This way you can always trace the actions that someone has taken during the assessment. The actions that are not generated automatically can be entered Sogeti Nederland B.V. 10-01-2013 version: 1.2.1 Page 13 of 30 User Manual: TPI NEXT Test Maturity Matrix tool manually by clicking the “add line” button which created a new line on the top of the table. 4.4 List all Checkpoints If you do not want to work with sorted sheets, but already know the answer to most checkpoints, you could choose to generate a sheet with all the checkpoints listed. This might give some more overview in the work. You can always choose to “change lanes” and create Key area sheets after filling in the checkpoints. Information Figure 15 Creating one list with all checkpoints By selecting “Create”, a list of all Checkpoints is created, either in sequence or per Cluster. This will facilitate the process of indicating per Checkpoint whether it has been fulfilled or not. 4.5 Changing lanes Changing lanes does what the name implies; you can change from one option to another without losing already filled in information. For example, you can choose to fill in you checkpoints by creating a list of all checkpoints (4.4) and after the assessment, change to sheets by Key area. Information Figure 16 Choosing “yes” This can be done by deleting the sheets that where created and choosing “yes” when asked to preserve the answers and notes. When a new option is chosen, these answers and notes will be placed back into the sheets. This is a good option to use when you want to see how well the test organization matches to CMMI. By simply deleting your sheets, preserving the answers and creating the CMMI sheets, the new CMMI view of the assessment can be shown. It is very important to choose “yes” when deleting sheets or your answers and notes will be deleted forever. Sogeti Nederland B.V. 10-01-2013 Version: 1.2.1 Page 14 of 30 User Manual: TPI NEXT Test Maturity Matrix tool 4.6 Information Refreshing If anything has been changed in the Test maturity matrix, for instance by setting a value to the Checkpoints, the button “Redraw Matrix” must be used before the new information becomes visible. Reason why this is not done automatically is because there are a lot of calculations and formulas in the sheets, which make the tool very slow when this would be done continually. For this reason only, automated calculation has been deactivated and can only be activated by pressing the button. 4.7 Graphics Test Maturity Matrix Explanation of the Maturity Matrix. Figure 17 Number of checkpoints In order to have clusters that are manageable, the number of checkpoints it must consist of should not exceed 15. And on the other hand, the clusters should be big enough to have any considerable impact. Sogeti Nederland B.V. 10-01-2013 version: 1.2.1 Page 15 of 30 User Manual: TPI NEXT Test Maturity Matrix tool Test Maturity Matrix Figure 18 Progress Test Maturity Matrix The chart as shown in the figure above, shows the progress of each of the clusters. For example Cluster A has 67% of its checkpoints fulfilled. All checkpoints filled with “NA” are not included. In other words; if a Clusters is at 100%, the next step (cluster) of Test Process Improvement can be taken. Normally you will see that this chart will show some sort of “staircase” (the higher the cluster, the lower the fulfillment). Figure 19 Key area Group fullfillment This chart shows what the status of the different levels is divided among the different Key area groups. All checkpoints filled with “NA” are not included. Sogeti Nederland B.V. 10-01-2013 Version: 1.2.1 Page 16 of 30 User Manual: TPI NEXT Test Maturity Matrix tool [1] 3.2: Table 1: Description per Key area 4.6 Refreshing Test Maturity Matrix Figure 20 Key area priority fullfillment This chart shows what the status of the different levels is divided among the different Key area priorities as filled in with the Business driver. If no Business driver has been chosen, this means that only the “Neutral” field will be filled in. All checkpoints filled with “NA” are not included. 4.6 Refreshing 4.8 Test Maturity Matrix The Test Maturity Matrix is the main reason this tool was created. It will show you the maturity is of your test organization or test project. By filling in the checkpoints in the different sheet(s), this Matrix will be colored either “orange” (Fullfilled: Y) or “grey” (Fullfilled: NA). Default is not fulfilled, which is white for controlled level, yellow for efficient level and green for optimized level. Test Maturity Matrix Figure 21 Test Maturity Matrix Sogeti Nederland B.V. 10-01-2013 version: 1.2.1 Page 17 of 30 User Manual: TPI NEXT Test Maturity Matrix tool All checkpoints can be viewed in the Matrix by moving your mouse over them. A comment screen will appear for the checkpoint you choose. In this way you can easily see which points need to be improved (next to the reporting sheet). [1] 3.5: Table 1: The Test Maturity Matrix provides a visual overview 4.9 Benchmark The Benchmark functionality offers a view to compare the scored Maturity level of the current assessment to average scores from other assessments, the Benchmark. The Benchmark functionality is enabled by selecting the button „show‟ in the „Benchmark‟ section on the „Information‟ sheet. A new sheet will made visible, representing a spider diagram on the key areas and a graph diagram representing the main business drivers. Both diagrams show the actual score from the current assessment. When a benchmark dataset is connected, the score can be compared with other assessments. The following paragraphs will continue in detail about configuring the Benchmark comparisons. Figure 7 Benchmark overview page Sogeti Nederland B.V. 10-01-2013 Version: 1.2.1 Page 18 of 30 User Manual: TPI NEXT Test Maturity Matrix tool 4.9.1 Connecting the Benchmark dataset The TPI Next Maturity Tool does not come with Benchmark data loaded. This dataset is retrieved by contacting the TPI Next Center of Excellence (CoE) ([email protected]). The CoE will provide an (anonymous) dataset updated to latest gathered assessments. The received dataset is connected by clicking the „Connect‟ button in the configuration section. A popup will ask for location. Navigate and select the received dataset and click „Update‟ after. Now the Tool will use the dataset for comparisons. Default the averages over all assessments is shown as „Benchmark‟ in the diagrams, see Figure 8. Sogeti Nederland B.V. 10-01-2013 version: 1.2.1 Page 19 of 30 User Manual: TPI NEXT Test Maturity Matrix tool Figure 8 Benchmark connected overview 4.9.2 Configuring comparisons As described above, default the averages from the benchmark are shown as „Benchmark‟. The Benchmark comparison offers the option to narrow down the default benchmark to create a more specific comparison. For instance the scored maturity is compared to the Branche of the assessed project. Sogeti Nederland B.V. 10-01-2013 Version: 1.2.1 Page 20 of 30 User Manual: TPI NEXT Test Maturity Matrix tool To configure the Branche comparison, select „Configure‟ from the menu. A popup is shown for configuration. In this specific example, select „Filter 1‟ and press „Change name‟, in this example we set a new name for „Branche‟ comparison and select „OK‟ Now select the filter „Branche‟ to configure the filter and select „Configure‟ Sogeti Nederland B.V. 10-01-2013 version: 1.2.1 Page 21 of 30 User Manual: TPI NEXT Test Maturity Matrix tool A popup is shown to set the specific criteria. In this example we use the Domain (Branche) “Public” to narrow the dataset for this filter Continue this workflow by selecting „Next‟ until the configuration is finished by selecting „OK‟. Select „OK‟ again for closing the configuration popup. To enable the new configured filter „Branche‟, select the checkbox. Now the diagrams are updated and show both the „Benchmark‟ filter (as default with all data from dataset) and the „Branche‟ filter (new configured). Sogeti Nederland B.V. 10-01-2013 Version: 1.2.1 Page 22 of 30 User Manual: TPI NEXT Test Maturity Matrix tool Use this configuration utility to “play with” different views on the assessed project or organisation. Normally the „Benchmark‟ view is updated automatically. In doubt, select button „Update‟ to recalculate the sheet manually Sogeti Nederland B.V. 10-01-2013 version: 1.2.1 Page 23 of 30 User Manual: TPI NEXT Test Maturity Matrix tool 5 FREQUENTLY ASKED QUESTIONS Why is the workbook password protected? Answer: This is done because the (accidental) removal or renaming of sheets, can lead to unwanted effects. For example; if a created sheet (Cluster A) was deleted manually, the button “Delete” would generate an error. Why is the sheet Test Maturity password protected? Answer: This is done because the (accidental) removal or changing of cell content, can lead to unwanted effects. For example; if a cell in the matrix was deleted (1.c.1 for example), the filtering of the different checkpoint would give an error on sheet creation. Furthermore, the charts would be interpreted incorrectly as well. Why is the VBA Code password protected? Answer: This is done because the (accidental) removal or changing of the code, can lead to unwanted effects. For example; changing a name of a function that is referred to from other functions in the code, will lead to errors. Can I retrieve the password to change the Tool? Answer: No, any request for changes and/or tailoring can be sent to TPI Next Center of Excellence [email protected]. Will there be upgrades of the tool? Answer: The TPI Next Center of Excellence is responsible for maintenance of the tool. In case of feedback / bugs, please contact the CoE Can I make suggestions for a change? Answer: Yes. If the suggestion is made by more people and found to be an improvement of the tool, it will be integrated in the next release. Can I retrieve the latest benchmark dataset? Answer: Yes. Please contact the TPI Next CoE for latest (anonymized) benchmark dataset. Contact TPI Next Center of Excellence: [email protected] Sogeti Nederland B.V. 10-01-2013 Version: 1.2.1 Page 24 of 30 User Manual: TPI NEXT Test Maturity Matrix tool 6 KNOW ISSUES AND WORK AROUNDS Because this is the first version of the Test Maturity Matrix tool, there are still some known issues which are not yet solved. These are listed below. If you find any other issues that are not stated below, please let us know and we will try to solve them with the next version of the tool. 6.1 General ID G.01 Type Wish Discription Make it possible to work with successive assessments (as discussed in chapter 2) 6.2 Information sheet ID IS.01 IS.02 Type Change Issue 6.3 Test Maturity Matrix ID TMM.01 Type Issue Discription Layout of buttons should be made more effective When “all checkpoints” sheet is deleted and the option “preserve answers?” is “no”, the answers are nevertheless preserved. Workaround: 1. Delete “all checkpoints sheet” (choose “no”). 2. Create “Cluster” sheets. 3. Delete “Cluster” sheets. 4. Choose “no”. Answers are now deleted. Solved in version 1.2 of the tool Discription Dependency 7.C.3 and 8.C.1 is not checked when both LA 7 and 8 are set to low and KA 7 I set to high. When KA 8 is set to low when level 7 is not, the dependency does work. 6.4 All checkpoints ID AC.01 Type Issue AC.02 Change 6.5 Key Area sheet ID KA.01 Type Issue Discription If project(client) is not filled in in the “information” sheet, a “0” will appear on the first row. Dropdown “fulfilled” shows not only N/Y/NA, but n/y/na as well. Would be one choice, but when filled in with the keyboard, both should be possible. Discription If project(client) is not filled in in the “information” sheet, a “0” will appear on the first row. Sogeti Nederland B.V. 10-01-2013 version: 1.2.1 Page 25 of 30 User Manual: TPI NEXT Test Maturity Matrix tool KA.02 Change Dropdown “fulfilled” shows not only N/Y/NA, but n/y/na as well. Would be one choice, but when filled in with the keyboard, both should be possible. Sogeti Nederland B.V. 10-01-2013 Version: 1.2.1 Page 26 of 30 User Manual: TPI NEXT Test Maturity Matrix tool 6.6 Cluster sheet ID CL.01 Type Issue CL.02 6.7 Discription If project(client) is not filled in in the “information” sheet, a “0” will appear on the first row. Change Dropdown “fulfilled” shows not only N/Y/NA, but n/y/na as well. Would be one choice, but when filled in with the keyboard, both should be possible. CMMI sheet ID CM.01 Type Issue CM.02 Change 6.8 Checkpoints to improve ID CI.01 Type Issue CI.02 Discription If project(client) is not filled in in the “information” sheet, a “0” will appear on the first row. Dropdown “fulfilled” shows not only N/Y/NA, but n/y/na as well. Would be one choice, but when filled in with the keyboard, both should be possible. Discription If project(client) is not filled in in the “information” sheet, a “0” will appear on the first row. Change Dropdown “fulfilled” shows not only N/Y/NA, but n/y/na as well. Would be one choice, but when filled in with the keyboard, both should be possible. Sogeti Nederland B.V. 10-01-2013 version: 1.2.1 Page 27 of 30 User Manual: TPI NEXT Test Maturity Matrix tool 7 APPENDICES 7.1 Bibliography [1] TPI NEXT, Business Driven Test Process Improvement, Sogeti, Tutein Nolthenius publishers, 2009, ISBN 90-72194-97-7 [2] White Paper, TPI NEXT Clusters for CMMI, Sogeti/Capgemini, http://www.tpinext.nl, 2009 Sogeti Nederland B.V. 10-01-2013 Version: 1.2.1 Page 28 of 30