1
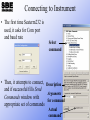
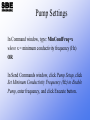
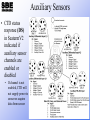
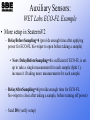
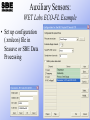
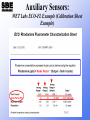
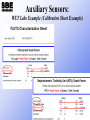
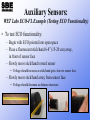
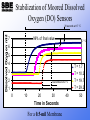
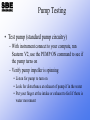
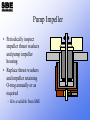
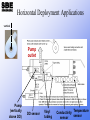
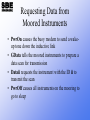
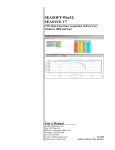
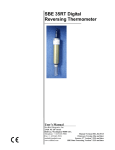
Setup of Moored Instruments
• In this module we will discuss:
–
–
–
–
SeatermV2 and Seaterm, the user interface
Status reports, header listings, and data formats
Preparing for deployment
Conversion of data to a format used by
SBE Data Processing
Setting up Moored Instruments:
SeatermV2 and Seaterm
• SeatermV2 and Seaterm
– Set up an instrument for
deployment
– Transfer data from an
instrument to
user’s computer
– Do data conversion for
SBE 37 and SBE 39 to
allow further processing
with Seasoft’s data
processing software
(SBE Data Processing)
Seaterm232:
for RS-232 Instruments
Menus
Send
Commands
window
Status
bar
Command/Data
Echo window
Connecting to Instrument
• The first time Seaterm232 is
used, it asks for Com port
and baud rate
Select
command
• Then, it attempts to connect, Description
and if successful fills Send
Arguments
Commands window with
for command
appropriate set of commands
Actual
command
Check Onboard Instrument
Calibration Coefficients
Confirm calibration coefficients
are programmed and are from
most recent calibration
• Type command in Command
Window: DC
(DisplayCoefficients)
or
• In Send Commands window,
under Status, select Display
Calibration Coefficients and
click Execute button
In this example, coefficients have not been
programmed into instrument, and must be entered.
DC
SBE37SM-RS232 v4.1 9077
temperature: not set
TA0 = 0.000000e+00
TA1 = 0.000000e+00
TA2 = 0.000000e+00
TA3 = 0.000000e+00
conductivity: not set
G = 0.000000e+00
H = 0.000000e+00
I = 0.000000e+00
J = 0.000000e+00
CPCOR = -9.570000e-08
CTCOR = 3.250000e-06
WBOTC = 0.000000e+00
pressure S/N 3537457, range = 508 psia not set
Etc………………………………………………
Checking Instrument Status
Confirm status of your instrument -- show date/time,
battery voltage, minimum pump delay, etc.
• Type DS to display status in Command window.
Or
• In Send Command window, click Status, click
Display Status and Configuration (or Setup)
Parameters and click Execute button at bottom of
window
Checking Instrument Status:
SBE 16plus V2 Example
DS
SBE 16plus V 2.5 SERIAL NO. 6001 24 Feb 2012 14:11:48
[DateTime=]
vbatt = 10.3, vlith = 8.5, ioper = 62.5 ma, ipump = 21.6 ma, iext01 = 76.2 ma,
status = not logging
samples = 0, free = 3463060
[SampleInterval=,NCycles=]
sample interval=15 seconds, number of measurements per sample=1
pump=run pump during sample, delay before sampling=2.0 sec,
delay after sampling = 0.0 seconds
[PumpMode=,DelayBeforeSampling=, DelayAfterSampling=]
transmit real-time = yes
[TxRealTime=]
battery cutoff = 7.5 volts
pressure sensor = strain gauge, range = 1000.0
[PType=, PRange=]
SBE 38=no, SBE 50=yes, WETLABs = no, OPTODE = no, SBE63 = no,
Gas Tension Device=no
[SBE38=,SBE50=, WetLabs=,Optode=,SBE63=,GTD=,DualGTD=]
Ext Volt 0 = yes, Ext Volt 1 = no
[Volt0=,Volt1=]
Ext Volt 2 = no, Ext Volt 3 = no
[Volt2=,Volt3=]
Ext Volt 4 = no, Ext Volt 5 = no
[Volt4=,Volt5=]
echo characters = yes
[Echo=]
output format = raw HEX
[OutputFormat=]
serial sync mode disabled
[SyncMode=]
Checking Instrument Status:
SBE 37-SM RS-232 Example
ds
SBE37SM-RS232 v4.1 SERIAL NO. 9077 15 May 2012 17:10:48
vMain = 13.37, vLith = 2.86
samplenumber = 9, free = 559231
not logging, stop command
sample interval = 15 seconds
data format = raw Decimal
This will output in frequency (Output Format=0)
output salinity
transmit real-time = yes
This will transmit data real-time to screen while running
sync mode = no
pump installed = yes, minimum conductivity frequency = 3045.5
This value is for
higher salinity
waters
Setting Date and Time in
SeatermV2
To set the clock to Local time or UTC, click Command menu, and
select your time preference
OR
In Command window: type DateTime=mmddyyyyhhmmss
(real-time clock month, day, year, hour, minute, second)
OR
In Send Commands Window: Click General Setup, click Set Date
and Time, enter the date and time (mmddyyyyhhmmss), and click
Execute button
Pump Settings
In Command window, type: MinCondFreq=x
where x = minimum conductivity frequency (Hz)
OR
In Send Commands window, click Pump Setup, click
Set Minimum Conductivity Frequency (Hz) to Enable
Pump, enter frequency, and click Execute button.
Files Created with Autonomous
Moored CTDS
• Moored Instruments
– Older versions of firmware upload data in format
that can be directly converted in Seaterm
• These do NOT require a .con or .xmlcon file
(configuration file)
• Use any configuration file…software uses internally
stored coefficient data to compute engineering values
– New Versions upload HEX Files that are then
converted with SBE Data Processing
• These DO require a .xmlcon (configuration file) to
convert from Hexadecimal to Engineering
Upload Types
• Moored instruments
– All data as a single file:
All scans
– By scan number range:
Enter beginning scan
number and number of
scans to upload
– ALWAYS SAVE THE
COMPLETE RAW
XML FILE as a
backup
Activity: Setting up, Logging,
and Uploading Data
• Use SeatermV2 to view status, then set up your
SBE 37-SM MicroCAT, start and stop logging, and
upload data; see notes for instructions
Converting Sensor Output
to Scientific Units
• SBE 16plus and 16plus V2 report data in scientific units or as
frequencies and voltages
– Data uploaded as .hex, use Data Conversion
• Older SBE 16 stores and reports data as frequencies and voltages
– Data uploaded as .hex, use Data Conversion
• Newer SBE 37s – SeatermV2 uploads SBE 37 data to .xml file,
converts to .hex file, and creates .xmlcon configuration file
– Use Data Conversion to convert to engineering units using calibration data in
.xmlcon file.
– If you only have .xml data file, use Convert .xml Data File in SeatermV2
Tools menu to convert to .hex file
• SBE 39plus – SeatermV2 uploads SBE 39plus data to .xml file,
converts to .asc file (for plotting in Plot39)
– You can also convert to .cnv file
Converting SBE 39 and Older
SBE 37 Data
• For SBE 39 and older SBE 37 MicroCATs,
use older terminal program Seaterm
– Click Upload button
– Upload in engineering units in ASCII (.asc)
format
– Click Convert button to convert .asc file to
.cnv file
SBE 16plus V2 Headers
DH1,2
hdr 1 30 Oct 2007 09:12:07 samples 1 to 34, int = 60, stop = stop cmd
hdr 2 30 Oct 2007 12:30:33 samples 35 to 87, int = 60, stop = stop cmd
Displays:
• Header number
• Date and time for when header was written
• First and last sample for header
• Interval between samples
• Reason logging was halted
Note: GetHeaders:1,2 is the equivalent of DH1,2
SBE 16 Data Format
• Data is in hexadecimal
format, T and C only
• Adding auxiliary sensors
adds bytes to the scan
S>dd31,10
8A7503DB
8A7D03DB
8A9203DB
8A8D03DB
8ABB03DB
8AD803DB
8AE103DB
8AF603DC
8B0503DC
8B0603DB
S>
SBE 16plus Data Formats
•
Raw data in hexadecimal
0442F20A8A7309B04A4D2C28730D24
04429D0A8A6F09B0494D4828730D42
0442210A8A6C09B04A4D3A28730D60
•
Converted data in hexadecimal
32505C0F51F601867A28730D24
3253760F51EA01867A28730D42
3257F70F51E101867A28730D60
•
Raw data in decimal
279282, 2698.449, 634954, 1.5073, 03 Jul 2001, 11:57:24
279197, 2698.434, 634953, 1.5094, 03 Jul 2001, 11:57:54
279073, 2698.422, 634954, 1.5084, 03 Jul 2001, 11:58:24
•
Converted data in decimal
22.9737, 0.00402, -0.037, 03 Jul 2001, 11:57:24
22.9817, 0.00401, -0.038, 03 Jul 2001, 11:57:54
22.9932, 0.00400, -0.038, 03 Jul 2001, 11:58:24
SBE 16plus V2 Data Formats
• Raw data in hexadecimal
0442F20A8A7309B04A4D2C28730D24
04429D0A8A6F09B0494D4828730D42
• Converted data in hexadecimal
32505C0F51F601867A28730D24
3253760F51EA01867A28730D42
• Raw data in decimal
279282, 2698.449, 634954, 1.5073, 03 Jul 2001, 11:57:24
279197, 2698.434, 634953, 1.5094, 03 Jul 2001, 11:57:54
• Converted data in decimal
22.9737, 0.00402, -0.037, 03 Jul 2001, 11:57:24
22.9817, 0.00401, -0.038, 03 Jul 2001, 11:57:54
• Converted data in XML
<?xml?><datapacket><hdr><mfg>Sea-Bird</mfg><model>16plus</model>
<sn>1606001</sn></hdr><data><t1> 22.9737 </t1><c1> 0.00402 </c1>
<p1> -0.037 </p1<dt>2007-11-07T07:34:35</dt></data></datapacket>
SBE 37 Data Formats
• Firmware version < 3.0 (SM, SMP, SI, SIP)
Format=1: 23.0161, 0.00002, 0.076, 08 Mar 2008, 17:10:23
Format=2: 23.0161, 0.00002, 0.076, 03-08-2008, 17:10:23
• Firmware version > 3.0 (SM, SMP, SI, SIP, IM, IMP)
OutputFormat=1:
23.0161, 0.00002, 0.076, 08 Mar 2008, 17:10:23
OutputFormat=2 (SM, SMP, SI, SIP) or 4 (IM, IMP):
<?xml version="1.0"?><datapacket><hdr><mfg>Sea-Bird</mfg>
<model>37SM</model><sn>03709999</sn></hdr>
<data><t1> 23.0161</t1><c1> 0.00002</c1><p1> 0.076</p1>
<dt>2008-03-08T 17:10:23</dt></data></datapacket>
SBE 39 Data Format
Activity: Converting and
Plotting Time Series Data
• Use Seaterm (not SeatermV2) to convert data from an
older SBE 37, and then use Derive and Sea Plot to
calculate and plot salinity and density; see notes for
instructions
Auxiliary Sensors
• CTD status
response (DS)
in SeatermV2
indicated if
auxiliary sensor
channels are
enabled or
disabled
• If channel is not
enabled, CTD will
not supply power to
sensor or acquire
data from sensor
Auxiliary Sensors:
WET Labs ECO-FL Example
• ECO-FL can be used for profiling or moorings
– Profiling – Open bio-wiper when power applied, keep it open,
and sample and transmit data continuously
– Moored – Open bio-wiper when power applied, sample and
transmit data, close bio-wiper; repeat
• Set up ECO for moored mode in WET Labs
ECOView software or a terminal program
–
–
–
–
!!!!! (access sensor command set)
$set 1 (note space between command and number)
$pkt 1 (note space between command and number)
$sto (store settings in memory)
Auxiliary Sensors:
WET Labs Example (ASV Setting Examples)
ECO Chlorophyll Fluorometer
ASV Value
Scale Factor
Range
Resolution
4
26
0-125 ug Chl/l
0.03 ug Chl/l
2
13
0-60 ug Chl/l
0.015 ug Chl/l
1
6
0-30 ug Chl/l
0.007 ug Chl/l
Send following commands to set ASV setting:
!!!!!!
$asv 1, 2, or 4
Auxiliary Sensors:
WET Labs ECO-FL Example
• Plug ECO into voltage channel 0 (can be any
channel) on 16plus V2; connect CTD to computer
• Run SeatermV2; send commands to 16plus V2
– Biowiper=y (provide enough time for bio-wiper to close after
sending a status command)
– MM (moored mode)
– Volt0=y (enable voltage channel 0)
– SetVoltType0=ECOFL (sensor type on voltage channel 0)
– SetVoltSN0=12345 (serial number of sensor on voltage channel 0)
– (continued on next slide)
Auxiliary Sensors:
WET Labs ECO-FL Example
• More setup in SeatermV2
– DelayBeforeSampling=4 (provide enough time after applying
power for ECO-FL bio-wiper to open before taking a sample)
• Note: DelayBeforeSampling=4 is sufficient if ECO-FL is set
up to take a single measurement for each sample ($pkt 1);
increase it if taking more measurements for each sample.
– DelayAfterSampling=4 (provide enough time for ECO-FL
bio-wiper to close after taking a sample, before turning off power)
– Send DS (verify setup)
Auxiliary Sensors:
WET Labs ECO-FL Example
When done with the setup, the status (DS) response should
look like this (items not shown in bold may vary):
SBE 16plus V 2.5 SERIAL NO. 4000 24 Jan 2011 14:02:13
vbatt = 10.1, vlith = 8.9, ioper = 61.9 ma, ipump = 20.8 ma, iext01 = 76.2 ma,
status = not logging
samples = 0, free = 3463060
sample interval = 60 seconds, number of measurements per sample = 1
pump = run pump during sample, delay before sampling = 4.0 seconds, delay after sampling =
4.0 seconds
transmit real-time = yes
battery cutoff = 7.5 volts
pressure sensor = strain gauge, range = 1000.0
SBE 38=no, SBE50=no, WETLABS=no, OPTODE=no, SBE63=no, Gas Tension Device=no
Ext Volt 0 = yes, Ext Volt 1 = no
Ext Volt 2 = no, Ext Volt 3 = no
Ext Volt 4 = no, Ext Volt5 = no
echo characters = yes
output format = raw HEX
serial sync mode disabled
Auxiliary Sensors:
WET Labs ECO-FL Example
• Set up configuration
(.xmlcon) file in
Seasave or SBE Data
Processing
Auxiliary Sensors:
WET Labs ECO-FL Example (Calibration Sheet
Example)
Auxiliary Sensors:
WET Labs Example (Calibration Sheet Example)
Auxiliary Sensors:
WET Labs ECO-FL Example
• Mount ECO sensors with:
– Clear path in front of
optics face
• Allow as much free space in
front of sensor face as possible
• Ensure cables are tied to
CTD/frame so no cables/ties
are able to float in front of
sensor face
– Detector pointed away from
CTD body
Downward
Facing
Nothing
In the
Path
Auxiliary Sensors:
WET Labs ECO-FL Example (Testing ECO Functionality)
• To test ECO functionality:
– Begin with ECO pointed into open space
– Place a fluorescent stick/hand 6-8” (15-20 cm) away,
in front of sensor face
– Slowly move stick/hand toward sensor
• Voltage should increase as stick/hand gets closer to sensor face
– Slowly move stick/hand away from sensor face
• Voltage should decrease as distance increases
Preparing for Deployment
• What about Anti-foulant paints?
• Install fresh batteries
• Check outputs from temperature and conductivity
and other sensors
• Set internal clock
• Set ID for instruments using inductive modems
or RS-485
• Check all cabling, and lubricate and reset
underwater connections
Anti-Foul Paint
• Do NOT paint instruments with
marine anti-fouling bottom paint, as
paint will contaminate calibration
bath
– If instrument is painted, all paint must
be removed from instrument prior to its
return to SBE for re-calibration
– 3M Tape or the more expensive 3MCopper tape is an effective anti-foulant
that can be used and removed for easy
cleaning
PAINT
Changing Batteries in
SBE 16plus V2
Remove Phillipshead screws and
washers
Unthread cap by
rotating
counter-clockwise
Install new batteries,
with + terminals
against flat battery
contacts and terminals against
spring contacts.
Changing Batteries in SBE 37
2 screws securing
connector
end cap (screws
shown partially
removed)
Handle
Cable mounting
guide
Loosen
captured
screw
Twist end cap
counter clockwise,
twisting cap screw
out of machined slot;
end cap releases
from housing
Molex connector
O-rings
Check Connectors and Cables
• Check all the cabling
• Remove the cables from their
bulkhead connectors
– Inspect the bulkhead connectors and
mating pieces
– Clean and lubricate the bulkhead connectors
– Burp all air out of the connectors when they
are reseated
Example: When connectors between a CTD and a
sensor become a problem: Moored Oxygen SBE 43
CLUES
Erratic Data
Intermittent
(good, bad, then
good)
Connector trouble starts,
corrects self, becomes
intermittent, then eventually
remains bad.
Trending correct
Clog?
Fouling?
Cables?
Electrical?
POORLY SEATED CONNECTION CAUSED CORROSION
ON CONNECTOR
Replaced
When Underwater
Connectors Go Bad
These were the
connectors on recovery
from the previous page
DO plot showing
Intermittent data.
Look for signs of corrosion
before plugging in in sensor.
Be sure connectors are burped
and seated.
Align the pins and do not use
too much lubricant.
Re-Install Cables and Dummy Plugs
• Clean and re-lubricate
connector boots, dummy
plugs, and connectors
– Clean with Kimwipes or
other lint free cloth or wipe
– SBE recommends Dow
Corning® DC4 for
lubrication
• Never use petroleum-based
products
Preparing for Deployment
• Check memory, clear if necessary
– (not all SBE 37s have internal memory)
– Provides back up to real-time system
– old data will NOT be overwritten
• Set Start Logging Date and Time
• Set sampling interval
– be sure to check your battery endurance!
Sample QUICKSTART
Checklist for SBE 37
SBE37 RS232 SN ______________________
Operator _______________________Date ______________ Checked by_______
Communications tab, Configure, Com Port __________, Baud 9600
DC (display coefficients) _____check to make sure they are in there and correct
DS (display status) ______ look at what you want to change
Set Date/Time ________________________________________(Local or UTC)
vMain ____________________________________________________
Sample Interval ____________________________________________
Data format _______________________________________________
Output Salinity (is it enabled?) _________ Mooring Depth Entered_______
Transmit realtime __________________________________________
Minimum Conductivity Frequency _____________________________
Preparing for Deployment
• SBE 16plus series:
– Check that you are getting outputs from all enabled sensors
• SBE 37 series:
– Check that you are getting outputs from all sensors
• ALWAYS keep an archive copy of RAW,
non-corrected data before initializing logging
– This allows a return to original data for correction
or reprocessing later on
Verify Functionality
• Log data on instrument, then
upload and review
or
• View data real-time using
SeatermV2
– Establish communications with
instrument
• Verify you have most recent
calibration coefficients
– Check for both electronic and
hard copies
Pre-Deployment Sensor Check
• Use the TS command to check nominal
functionality of all sensors
• Also use to check conductivity zero
frequency against calibration sheet
– Should be within a few Hz of the Zero
Conductivity value
– Be sure to do this on a dry conductivity cell (no
water or droplets)
Record Some Data
Log and check some data
A clean tub full of water
is a good way to do this,
but it can also be done in
air
Verify recorded values
seem reasonable
Compare to another
instrument you know is
good
Pump Mode Settings on
Moored Instruments
• If moored in an area with large thermal
gradients, pump for a longer period of time to
eliminate cell thermal mass effects on
conductivity measurement
• Time required for DO measurement
equilibration is dependent on sensor’s membrane
thickness and on water temperature
– See User’s Manual for your instrument about pump
option settings for DO
Example:
SBE 16plus and 16plus V2
Pump Modes
• No pump
– No mystery here
• Pump for 0.5 seconds before sample
– T & C only, ventilates the cell, saves power
• Pump on for entire sample period plus for
some period prior to the sample
– For auxiliary sensors with long time constants
• Dissolved oxygen
• Fluorometer
Stabilization of Moored Dissolved
Oxygen (DO) Sensors
Dissolved Oxygen ml/l
28 seconds at 1.7 °C
7
99% of final value
1.7 °C
6
5
4
3
2
7 seconds at 29.2 °C
1
0
10
20
30
Time in Seconds
For a 0.5-mil Membrane
40
T = 1.7
T = 10.2
T = 19.7
T = 29.2
50
Stabilization Time Versus
Temperature of Moored DO Sensors
Time to within 1% of final value
Time to within 5% of final value
Time to within
1% of final
Time to within
5% of final
For a 1.0-mil Membrane
Pump Functionality and Problems
• Could be pump itself
– Hook pump up directly to a 12 VDC power
supply, and verify pump impeller is spinning
– Swap pump out if a spare is available
– Inspect pump
• Could be cable
– Install a spare cable if possible
– Wiggle cable to check for intermittent
connection
Pump Testing
• Test pump (standard pump circuitry)
– With instrument connect to your compute, run
Seaterm V2, use the PUMP ON command to see if
the pump turns on
– Verify pump impeller is spinning
• Listen for pump to turn on
• Look for disturbance at exhaust of pump if in the water
• Put your finger at the intake or exhaust to feel if there is
water movement
What if Pump Is Not Running?
• If pump is not
running, remove pump
head and inspect
impeller and thrust
washers to determine
if a clogged impeller is
problem
• Pump impeller can
become stopped by
sand, sediment, and
salt crystals
Pump Impeller
• Periodically inspect
impeller thrust washers
and pump impeller
housing
• Replace thrust washers
and impeller retaining
O-ring annually or as
required
– Kits available from SBE
Configure Sensors and CTD Hardware
for Clean Data Collection
• Ensure that sensors sample same water
– Plumbing
– Place T, C sensors together and duct
• CTD deployment orientations
– (vertical vs. horizontal)
• Ensure that sensors sample undisturbed water
– No flow blockage/distortion on frame
– No foreign thermal mass or wakes
Plumbing for Vertical Deployment
Y-Fitting with bleed hole
Detail for SBE 16plus
Bleed Hole
Intake/exhaust
SBE 37
Hole allows
air out of plumbing at
Highest point in
plumbing.
Keep tube above
full of water!!!
Horizontal Deployment Applications
vertical
Pump
outlet
Pump
(vertically
above DO)
DO sensor
Vinyl
tubing
Temperature
Conductivity
sensor
sensor
Make a Neat Underwater
Package
• Tie or tape all loose cabling
to frame of package
– Loose cables can move as
package rises or drops
• Results in wire fatigue
• Make sure no cables are in
path of inlet to temperature
sensors
• Instrument with aluminum
housing: check zinc anodes
occasionally
– Grounding problems can cause
zinc anodes to disappear
Removing Air from Plumbing
• On deployment or in test bath, try to expel air
from plumbing
– Moorings deeper than 10 m will expel air
– For shallow moorings < 10 m, fill plumbing with DI
water prior to deployment
• Observe bubbles coming out of bleed-hole or
pump exhaust
– Move instrument under water to “shake” air out
– Pre-fill with water at deployment if no chance of
freezing
Deploying in Very Cold Places
• Glass conductivity cell is subject to breakage due to water
freezing in cell
• Remove all water from conductivity cell
– Repeated ice formation (film or droplets) on electrodes
can degrade calibration at 0.001 - 0.020 PSU level
• Make a solution of 1% triton in sterile seawater
– Use 0.5 micron filtered seawater or boiled seawater
• Never use anti-freezes like glycol or alcohol
• SBE 43 Oxygen Sensor – prevent freezing by keeping
indoors or in area above freezing
Frozen SBE 43 Oxygen Sensor
Electrolyte will freeze ~-4 deg C
Split Open Membrane
Caused by Freezing
Bloated membrane – Impact, freezing
Log Data Now or Later?
•
•
Use the StartNow command to begin logging
data immediately
To begin logging later:
1. Use the Startmmddyy= command to enter a date to
start logging, and then use the Starthhmmss=
command to enter a start time on that date
- Or Use the StartDateTime= command to enter a date and
time to start logging
2. Use the StartLater command to begin logging on the
date and time entered above
Inductive Modem IDs
• Valid range for ID numbers is 00 – 99
• There must be only one instrument on the
loop when setting IDs
• IM receiver is very sensitive; instruments
not on the loop, but near the loop, will
receive the ID change
Getting Data to the
Surface and the Shore
• You are responsible for the communications
link between the surface buoy and the shore
– Satellite
– Cell phone
– Radio modem
• You are responsible for a buoy computer
that requests data from the moored
instruments
Requesting Data from
Moored Instruments
• PwrOn causes the buoy modem to send a wakeup tone down the inductive link
• GData tells the moored instruments to prepare a
data scan for transmission
• Dataii requests the instrument with the ID ii to
transmit the scan
• PwrOff causes all instruments on the mooring to
go to sleep
Inductive Telemetry
Troubleshooting
• Inductive communication is one way at a
time (half duplex)
• Instruments with the same ID will compete
for the link
• If request for data occurs during data
acquisition, the request will be ignored