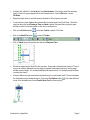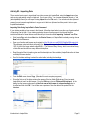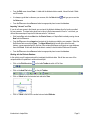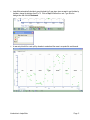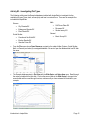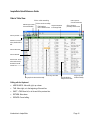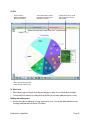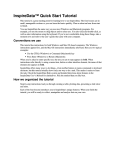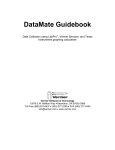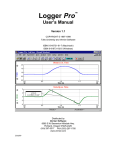
1
InspireData applies the proven
strategies of visual learning to data
literacy, inspiring students to discover
meaning as they collect and explore
data in a dynamic inquiry process.
InspireData helps students successfully:
• Strengthen the inquiry process
• Build data analysis skills
• Improve data literacy
Introduction to InspireData™
Half-Day Workshop
Participant Handout
InspireData the foremost tool to visualize, investigate and understand data
Table of Contents
Workshop Schedule .................................................................................................................................... 3
Sleep & Breakfast Survey Questions......................................................................................................... 3
Subject Specific Questions ........................................................................................................................ 3
Activity #1 – The Circle Game .................................................................................................................... 4
Activity #2 – Importing Data ....................................................................................................................... 8
Activity #3 – Investigating Plot Types...................................................................................................... 12
InspireData Quick Reference Guide......................................................................................................... 14
Database Descriptions .............................................................................................................................. 22
Additional Resources................................................................................................................................ 25
Introduction to InspireData
Page 2
Workshop Schedule
•
Participant Data Entry and Quick Tour video
•
Demonstration – Introduction to InspireData
•
Demonstration – Investigating the Sleep & Breakfast Survey Data
•
Break
•
Activity #1 – The Circle Game
•
Activity #2 – Importing Data
•
Break
•
Activity #3 – Investigating Plot Types
•
Next Steps and Conclusion
Sleep & Breakfast Survey Questions
1. Create a code name for yourself.
2. What time did you wake up this morning? Enter as hour:min am/pm.
3. How much sleep did you get last night? Enter as hours only.
4. How alert are you today? Rate on a scale of 1 to 10, 1 being least alert and 10 being most alert.
5. Have you had any caffeinated drinks today? Enter yes or no.
6. List what you ate for breakfast. Choose from: cereal, eggs, fruit, other, none. Separate by commas.
Subject Specific Questions
Social Studies:
Do some regions of the world have a lower life expectancy?
What regions of the world have the highest percentage of the world population?
Science:
Were most dinosaurs herbivores, carnivores or omnivores?
Has the number of endangered species increased between the years 1980 and 2005?
Mathematics:
What is the maximum height above the ground that a human cannonball flies?
What is the probability that someone in our class is a girl with brown hair and blue eyes?
Introduction to InspireData
Page 3
Activity #1 – The Circle Game
The Circle Game that is included with InspireData is a fun way to create a database. The Circle Game tests
how quickly you can click on a blue dot that is moving around the screen. In this activity, everyone gets a
chance to play the Circle Game two times, once with their dominant hand and once with their non-dominant
hand. We will then use the database that is automatically created by InspireData to investigate various
plotting features. Work with at least one other person to complete the activity below.
•
Start InspireData and choose New from the Starter Screen.
•
From the Table menu choose New Special Table>Circle Game. A blank table is created and we will
use it to record our results. The table does not have any records until the game is played.
•
When the circle game is played a variety of information is automatically recorded in the table. The first
time you play the game use your dominant hand. Click on the Play button on the plot Toolbar and get
ready to click on the blue circles as quickly as you can.
•
Click on the Play button and play the game a second time with your non-dominant hand. For future
reference, jot down the game numbers and which hand you played them with.
•
Switch and take turns so that everyone plays the game once with their dominant hand and once with
their non-dominant hand. Again everyone should record their game numbers and hands for future
reference.
•
If we want to know who played the game and with which hand, we can quickly and easily add this
information using the Fill>Down command in the Edit menu.
Introduction to InspireData
Page 4
•
Click on the Add Field button
on the table Toolbar. To describe your newly added field, type
Name and then click the Check Mark .
•
Click on the Add Field button
and then click the Check Mark
on the Plot toolbar. To describe your newly added field, type Hand
.
•
In the first cell of the Name field, type the name of the player who played that game. Then drag to
select the remaining cells that hold their additional trials. From the Edit menu, choose Fill>Down
•
In the first cell of the Hand field type Dominant. Then drag to select the remaining cells for Game 1,
the game played with the dominant hand. From the Edit menu, choose Fill>Down.
Introduction to InspireData
Page 5
•
In the first cell of Game 2 in the Hand field, type Non-Dominant. Then drag to select the remaining
cells for Game 2, the game played with the non-dominant hand. From the Edit menu, choose
Fill>Down.
•
Repeat the steps above to enter the names and hands for all the players in the team.
•
You should now have a database that contains data for several trials of the Circle Game. We will be
using the data in the fields Response Time and Hand to decide if the hand that you play the game
with has an effect on the time needed to click on the next blue circle.
•
Click on the Plot View button
•
Click on the Stack Plot button
•
Click on X Axis below the horizontal axis and select Response Time.
•
Discuss the response time Stack Plot with your team. How would you describe the stack plot? Does it
seem to be uniformly distributed over the range of response times (equal numbers of slow, average
and fast reaction times)? Is it normally distributed (bell shaped curve)? Is it skewed (mostly fast times
or mostly slow times)?
•
Is there a difference in response times for dominant hand vs. non-dominant hand? We can investigate
on the table Toolbar to switch to Plot View.
on the plot Toolbar.
the relationship using a parallel stack plot. Click on the Plot Options button
corner of the workspace and choose Parallel Stack Plot (the second option).
Introduction to InspireData
in the lower left hand
Page 6
•
Click on Y Axis to the left of the vertical axis and select Hand.
•
This parallel stack plot can be used to investigate the relationship between hand and response time.
To further investigate, InspireData can add the summary statistics of mean and median to the stack
plot. Click on the Options button below the X Axis and select Show Mean.
•
Click on the Options button below the X Axis and select Show Median.
•
Use the parallel stack plot with mean and median displayed to answer the question: Is there a
difference in response times for dominant hand vs. non-dominant hand?
•
We can now add a note with our answer to the plot and capture its slide. Click on the Note button
on the plot Toolbar. Type your answer to the question of interest into the notes area.
•
To open the Slide Sorter and create a slide show, click on the Slide Show button
Capture Slide button
to save your parallel stack plot and its notes.
•
If you want to create more slides, you can click on the Capture Slide button
. Use the back and
forward buttons
to move through the plot history. If you get to a plot that you would like to save,
add a note and then capture a slide.
Introduction to InspireData
. Click the
Page 7
Activity #2 – Importing Data
There are two basic ways to import data from other sources into InspireData; using the Import menu item
and copying and pasting using the clipboard. If you have a file in *.csv (comma separated) format or *.tab
(tab separated) format you can import it using Import from the File menu. You can also use the clipboard
present in most computer applications to copy a set of data to a clipboard and then paste it into an open
InspireData database.
Importing Data Using InspireData’s Paste Command
If your training workshop has access to the Internet, follow the steps below to use the copy & paste method
of importing a set of data. If your training workshop does not have access to the Internet read the
instructions below for future reference and then skip to the section titled Importing *.tab and *.csv Files.
•
Start InspireData and choose New from the Starter Screen; or if InspireData is already running choose
New from the File menu.
•
Open your favorite web browser and navigate to http://lib.stat.cmu.edu/DASL/Datafiles/Birthrates.html.
This webpage contains birthrate information for 23-year-old women in the United States from 19171975. It is part of a larger website called DASL – The Data and Story Library, which is an online library
of data files and stories from many different disciplines.
•
Read through all the information given and the descriptions of the variables (InspireData refers to these
as fields) that were studied.
•
Scroll to the data and drag to select the entire table, including the headings.
•
From the Edit menu choose Copy. (Standard for most computer programs.)
•
Since the first row of the data contains the names of the two fields (Birthrate and Year) we want
InspireData to treat it as field names. From the Edit menu choose Clipboard>Re-interpret. In the
dialog box that opens make sure that Use first row as field names or column headings box is
checked and then click OK. You will also see a preview of how the data will be pasted into the
database.
Introduction to InspireData
Page 8
•
From the Edit menu choose Paste. A table with the birthrate data is created; it should include 2 fields
and 59 records.
•
It is always a good idea to reference your sources; click the Note button
the Notes area.
•
From the File menu choose Save and select an appropriate place to save the database.
and type your source into
Importing *.tab and *.csv Files
If you do not have access to the Internet you can import the birthrate database from the location provided
by your presenter. The steps below show how to import a file that was saved in Excel in *.csv format, you
can use the same steps to import a file that was saved in *.tab format.
•
Start InspireData and choose New from the Starter Screen, or if InspireData is already running choose
New from the File menu.
•
From the File menu choose Import and navigate to the location provided by your presenter. Select the
file Birthrate Data.csv and click Open. The Import Wizard dialog box will open, select the radio
buttons: comma separated text file, first line of file contains field names, and import as a new database,
then click Finish. A table with the birthrate data is created; it should include 2 fields and 59 records.
•
From the File menu choose Save and select an appropriate place to save the database.
Working with the Birthrate Database
In this activity you will create an axis plot to investigate the birthrate data. We will also use some of the
unique features of InspireData to enhance the axis plot.
•
Click on the Plot View button
on the table Toolbar to switch to Plot View.
•
Click on the Axis Plot button
on the plot Toolbar.
•
Click on X Axis below the horizontal axis and select Year.
•
Click on Y Axis to the left of the vertical axis and select Birthrate.
Introduction to InspireData
Page 9
•
Examine the axis plot of Birthrate by Year. Think about how you might use this axis plot in a Social
Studies classroom.
•
InspireData has the ability to add a variety of summary computations, such as counts, totals, and
means to plots. Click on the Compute button
on the plot toolbar. A set of ?? appears on the
screen. This tells you that InspireData is waiting for you to decide on a computation to add to the plot.
•
Click on the Operation button
•
The Field button
and select Mean.
will appear on the plot Toolbar and you must choose the numerical field from
which you want to compute the mean. Click on the Field button
and select Birthrate. The mean
birthrate for all the years from 1917 to 1975 is added to the axis plot.
•
Since the x axis data is numerical (year) the axis type is automatically set to continuous and we get a
plot by each year in the database. If we were interested in examining the birthrate data by decades we
can change our x axis to a range axis and group our data into ten year periods. Click on Continuous
below the x axis and select Range.
Introduction to InspireData
Page 10
•
InspireData automatically decides to group the data into 5 year steps; since we want to see the data by
decades, change the step size from 5 to 10. Click on Step: 5.0 below the x axis. Type 10 in the
dialogue box and click the Checkmark.
•
A new axis plot with the x axis split by decades is created and the mean is computed for each decade.
Introduction to InspireData
Page 11
Activity #3 – Investigating Plot Types
The following activity uses the Example databases included with InspireData to investigate the four
available plot types (Venn, stack, axis and pie) and how to construct them. There are ten example files
included with InspireData.
Science
• City Climates EX
• Endangered Species EX
• Plant Growth EX
Social Studies
• Countries of the World EX
• Election Results EX
• Gasoline Prices EX
Math
•
•
•
Cell Phone Plans EX
Dinosaurs EX
Student survey EX
General
• Music Survey EX
•
From the File menu choose Open Resource, navigate to the subject folder (Science, Social Studies,
Math, or General) and select your assigned database. Be sure to open the database that has EX after
the name.
•
The Example databases start in Plot View with the Slide Sorter and Notes Area open. Read through
the notes included with the first slide. Click on the second slide in the Slide Sorter to change to the
second slide and then read through its notes; continue until you have reviewed all the slides in your
example.
Introduction to InspireData
Page 12
•
With your team, review the slides in your example and pick your favorite plot. Discuss why you like the
plot and get ready to share this with the whole group.
•
Open the sample database that corresponds to your example; it is located in the same place as your
example, but without an EX after the file name. Using your instructor and the Quick Reference Guide
on page 14 as resources; recreate all the plots in your example.
•
If you finish before we come back together as a whole group to share plots, pick another Example
database to investigate.
Another great resource that you can use to learn about the different types of plots that can be created with
InspireData is the About Plots section of Resources. Each of the 4 plot types is explained and examined
in depth; with many great slides that illustrate the power and flexibility of InspireData.
Introduction to InspireData
Page 13
InspireData Quick Reference Guide
Data in Table View
Click to open or
close the notes area.
Click to confirm text editing.
Indicates type of data
in the selected field.
Click to cancel text editing.
Field headings:
Click to select the field.
Drag the field name
to rearrange fields.
Click to choose a
previously entered value.
Click to plot data.
Default icon: Click to
select; double-click to
edit.
Click to add record.
Click to add field.
Record icons: Click to
select entire record;
double-click to edit
custom icon.
Click in any cell to edit.
Drag to split the window horizontally.
Drag the divider to
change column width.
Drag to split the
window vertically.
Editing with the Keyboard
•
ARROW KEYS: Move left, right, up or down.
•
TAB: Move right, or to the beginning of the next line.
•
SHIFT + TAB: Move left, or to the end of the previous line.
•
RETURN: Move down.
•
ESCAPE: Cancel editing.
Introduction to InspireData
Page 14
Field type menu: Click to
change field type and other
field properties.
Notes area
Date field
Series field
True/False field
(Yes/No format)
Subtable field
List field
Kinds of Fields
InspireData guesses what kind of data each field should contain based on what you type. To specify the
field type explicitly, or to convert data from one type to another, select the field and choose from the Field
Type menu.
Basic field types
•
Number
•
Text
•
True/False
•
Date
•
Datetime
Data options
•
Lists: When enabled, you may enter multiple values separated by commas.
•
Link: Use values to identify records in another table.
•
Formula: Compute values automatically based on a formula that you specify.
Structured fields
•
Series: Store multiple values in columns.
Introduction to InspireData
Page 15
•
Multi-series: Store parallel information in columns, e.g. height and weight over time.
•
Subtable: Give each record a mini-table of its own, e.g. each cat can have information about its
veterinarian visits.
Field formatting
•
To change the format of how data appears in the table, select the field and choose field format from the
Field Type menu on the Plot toolbar.
Creating a New Database
1. Choose New from the File menu and then click New on the starter screen. A new database will open
with 3 fields and 2 records.
2. Click on a field heading to select a field and type the name of your field.
3. You can either start entering data into your records to let InspireData determine the field type (number,
date, etc.) or you can select it by using the Field Type menu on the Table toolbar.
4. Continue naming fields and determining field types for all the types of data you have collected. If you
need to add more field use the Add Field button on the Table toolbar. If you need to add more records
use the Add Record button on the Table Toolbar.
Managing Tables
You can keep several related tables of data in a single database. To bring a table forward, click its colored
tab at the top of the window. If you see no tabs, the database has only one table.
•
Choose Table Properties from the Table menu to change table properties such as name, color scheme,
and record identifier.
•
Choose New Table from the Table menu to add a new table to the current database.
•
Choose Delete Table from the Table menu to delete the table that is currently selected. Multiple tables
must be included in the database for this option to be present.
•
Choose Duplicate Table from the Table menu to make a new table with a copy of the current table’s
data.
Introduction to InspireData
Page 16
PLOTTING DATA
Specify loop constraint:
Venn Loop Plot
Click to view
table.
• Select a field
• Select a comparison (=, >, etc.)
• Specify a cutoff or comparison value
Click to close
this loop.
Click x to turn off
labels. Click “Name”
to change what icons
are labeled by.
Color all icons according to
a data field.
Select the field
for icon labels.
Turn icon
labeling on
or off.
Click for Pie plot.
Click for Axis plot.
Click for Stack plot.
Click for Venn plot.
Click to reset plotting.
Click to select all
icons in a region.
Select field for summary
computation.
Open/close
slide sorter.
Open/close
notes area.
Select summary computation
(count, total, etc.).
Turn summary computation on or off.
Adjust icon size.
Mark selected icons with a box.
Click arrows to move through plot history.
Click to add another loop to the Venn plot.
Introduction to InspireData
Page 17
Stack Plot with Slide Sorter Open
Numbers show about
how many icons are in
columns of different
heights.
Slide Show:
• Click to select the slide and recall its
saved plot.
• Click and drag to change slide position.
Click on the tabs to
switch to the plot of a
different table.
Slide Show: Click to update,
delete or rename slide.
Click to select a field or
formula for the axis.
Click to add mean or median to plot.
Click to change the step size between
intervals.
Click to specify axis type (category or
range).
Click to change the maximum
value for the axis.
Click to reset
axis
maximum,
minimum and
step size.
Click to capture a side of the current graph.
Click to change the minimum value
for the axis.
Click to choose other kinds of stack
plots (horizontal, parallel, or mirror).
Introduction to InspireData
Page 18
Axis Plot with Time Series Data
Click to select a field or
formula for the axis.
Click to change the maximum
value for this axis.
Choose Box Plot from the
Plot menu to add or remove
box and whisker overlays.
“Play” series forward. Press and
hold to select playing speed.
Step forward or back.
Series control appears because
“Height” contains time series data.
Drag to select which time
series column is plotted.
Notes area in plot view.
Choose between seeing data from one series
column at a time, or all together.
To change category order, drag the category name. To
combine categories, drag one category name onto another.
Click to change the minimum
value for this axis.
Click to choose options for
time series plot or create an
instant plot.
Introduction to InspireData
Page 19
Pie Plot
Click to choose a
different computation to
label pie plot sections.
Click to edit plot title. Choose
plot title from the plot menu to
add a title to your plot.
Double-click an icon to see its
data; click again to close the
data window.
Click to choose other kinds of pie
plots (horizontal, vertical or grid).
To Select Icons
•
Either select a region of the plot by clicking and dragging or select an icon individually by clicking it.
•
You can add to the selection by holding down the shift key as you select additional regions or icons.
Marking and Labeling Icons
•
Use the plot toolbar to add labels, coloring, and boxes to icons. You can also label selected icons by
choosing Label Selected Icons from the Plot Menu.
Introduction to InspireData
Page 20
•
Click and hold the Clear button on the plot toolbar or select Unmark All from the Plot menu to remove
coloring, labels, and marking from a plot.
Viewing a Subset of Icons
•
Choose Zoom In from the Plot menu to show only the icons you have selected.
•
Click and hold the Clear button on the plot toolbar or select View All from the Plot menu to make all
icons visible again.
•
Choose View Constraint from the Plot menu to enter a formula to determine which icons should be
shown.
Introduction to InspireData
Page 21
Database Descriptions
100m Track Finals
This data set shows the splits every 10 meters for the top
four finishers in the men’s 100-m track final in the 1988
Olympics in Seoul, South Korea.
Agriculture Trends
This data set captures the changing trends in agriculture,
including the percentages of specific crops and livestock
that were present on farms in the years 1900 and 1997.
Alligators
This data set includes alligator data, including gender,
length, weight and habitat.
Change Over Time
This data set includes multiple examples of data indexed to
time or sequential events.
Circle Game
This fictional data simulates the results of a simple
computer game that compares the reaction times of a
student’s dominant hand vs. non-dominant hand.
City Climates
This data set shows the average annual monthly
temperature as it was recorded over a 30 year period
(1971-2000) by the National Climatic Data Center.
American Community Survey
The American Community Survey (ACS) is a nation-wide
survey that collects population, social, economic and
housing data. This data set contains selected social
characteristics of the United States for the years 2000 to
2004.
Clay Boat Experiment
This fictional experimental data represents the weight in
pennies that student-designed clay boats can hold before
sinking. The experiment is performed four times with a
modified boat design for each trial.
Are You a Square
This data set represents height and wingspan
measurements taken on a class of elementary school-aged
students.
Consumer Price Index
From US Department of Labor, this data set collects the
US city averages for the consumer price index for all urban
consumers.
Baseball Salaries
This data set represents National League Baseball salaries
in 2005.
Cooling
This data represents the temperature change over time as
a beaker of water cools off.
Bean Box Experiment
This is experimental data collected by dropping 10 beans
into a box that has a shaded picture inside. The data
shows how many beans landed in the shaded picture and
how many did not land in the shaded picture, in order to
determine the experimental probability that a single bean
will land in the shaded area.
Countries of the World
This data set profiles 155 countries of the world, and
includes information on population density and change
over time, average life expectancy, literacy rates, GDP,
imports, exports and government expenditures.
Cats
This data set simulates a survey of cat characteristics,
such as age, weight, body length, eye color and fur color.
Cell Division
This data set represents the results of mitosis, a process of
cell division that produces two daughter cells from a single
parent cell. The data shows how many daughter cells will
result from a single parent cell after 24 hours.
Cell Phone Plans
This data set includes the minutes, charges and costs for
three different cell phone plans.
Introduction to InspireData
Defrost Time
This data set shows defrost times in hours for turkeys that
range in weight from 4 lbs to 24 lbs.
Dinosaurs
This data set contains information, such as geographic
locations, era, length, height, mass and diet, for many
different kinds of dinosaurs.
Early Native Americans
This data set contains statistics and background
information on the characteristics of selected Native
American groups or tribes.
Page 22
Election Results
This data set contains selected U.S. presidential election
data, including popular and electoral college results, from
1876-2004.
Motor Vehicle Safety
This data set contains motor vehicle safety data for
selected years from 1960-1985, and annual data from
1990-2003.
Endangered Species
This data set represents the number of endangered
animals and plants per calendar year as of 12/31/2005.
Music Survey
This fictional data shows the kinds of answers you might
get in a classroom music survey.
Fish Counts
This data set compiles yearly totals of fish counted passing
over the Bonneville Lock and Dam from 1938 to 2002.
NBA Statistics
This data contains statistics for teams and players in the
NBA 2005-2006 season.
Friction Experiment
This data was collected by rolling a cue ball through a set
of photogates and measuring the distance from the gates
to where the ball stopped.
Oil Slick Spread
This data set represents the spread of an oil slick over
time.
Gasoline Prices
This data set demonstrates average price trends of
gasoline in the U.S. from 1977-2003.
Harmony
This data set collects information on musical notes,
including set note, solfege, high and low frequencies, and
the frequency ratio.
Heating
This data represents the temperature change over time as
a pan of water is heated on a stove.
Heptathlon
This data contains the results of the 2004 Olympics
Women’s Heptathlon event.
Historical US Population
This data set contains population and population density
figures beginning with the first U.S. census in 1790 through
1900.
Human Cannonball
This fictional data set represents the vertical height (in feet)
and the horizontal distance (in feet) of a human being
launched from a cannon.
Hurricanes
This data set documents the tracking information for
hurricanes in the North Atlantic Basin in 2003 and 2004.
Minimum Wage
This data set, compiled from data on the U.S. Department
of Labor web site, details the number of workers paid at or
below the prevailing Federal minimum wage in 2002.
Introduction to InspireData
Pendulum Experiment
This data set shows the time it takes a pendulum to swing
10 times, and the corresponding weight and length of the
pendulum used in each trial.
Periodic Table
This data set collects information for each element
represented in the periodic table, including its atomic
number and weight, electron configuration,
electronegativity and ionization potential.
Planets Advanced
Geared for middle to high school students, this data set
contains NASA planetary data, including orbital
circumference, mass, volume, density, rotation period,
rotational velocity, pressure and calculated escape velocity.
Planets Basic
Aimed at elementary students, this data set contains
planetary data from NASA, including the diameter,
circumference, surface area, minimum and maximum
surface temperature measurements for each planet.
Plant Growth
This data set charts plant growth over time, as it is affected
by various changes in growing conditions, such as low salt,
high salt, and aromatherapy.
Produce Predictions
This data set contains length and girth measurements for
fruits and vegetables from the local produce market.
Roller Coasters
This data set contains a variety of facts about roller
coasters of the world including track material, largest drop,
height, length and top speed.
Page 23
Savings Account
This data set represents the future value of a savings
account with an initial deposit of $2600.00, no additional
contributions, collecting 4% interest compounded four
times annually for 30 years.
Seat Belt and Helmet Use
This data set contains seat belt and motorcycle helmet use
statistics for the years 1994 to 2004.
Shopping Cart Train
This data set includes the number of carts in a shopping
cart train and its resulting overall length.
Sleep in Mammals
This data set includes statistics for body weight, brain
weight, sleep cycle, life span and gestation period for
several mammals.
Sleep Survey
This fictional survey represents data—including hours of
sleep, ease of waking up, sleepy time, alert time, size of
breakfast and average GPA—you might collect from
students in a classroom.
Slinky Experiment
This data set was collected by hanging a slinky vertically
and measuring its length. The number of coils allowed to
hang is varied.
Introduction to InspireData
Soap Brands
This data set presents information such as price and
bubble diameter for several different soap brands.
Student Survey
This fictional data set shows data, including hair and eye
color, that you might collect from students in your
classroom.
Time and Position
This data set contains information such as average speed,
time and acceleration for several experiments.
US Immigration
Adapted from the U.S. Department of Homeland Security
yearbook, this data set collects immigration to the United
States statistics for the years 1820 to 2004.
US Unemployment Rates
This data represents the fluctuations in the U.S. national
unemployment rate from 1948 to 2004.
Video Game Survey
This fictional data set shows the kinds of data you might
collect in a classroom video game survey.
World Population Growth
This data set presents the total mid-year population of the
world with projections for population growth through 2050.
Page 24
Additional Resources
Getting Started Guide
Each copy of InspireData comes with a printed copy of the Getting Started Guide. The guide contains
system requirements, installation instructions, an introduction to InspireData and a tutorial. The guide is
also available as a PDF file, which you can view and print using Adobe Acrobat Reader. If your computer
does not have Acrobat Reader, you can download a free copy from Adobe at www.adobe.com. To open the
Getting Started Guide PDF file, choose Documentation from the Help menu and double-click on Getting
Started Guide.pdf.
Online Help
The searchable Help system contains detailed information about how to use InspireData including special
features, tools and commands. To open the Help system, choose Help from the Help menu.
User’s Manual
The User’s Manual contains all the information in the Help system. The manual is available as a PDF file.
To open the User’s Manual PDF file, choose Documentation from the Help menu and double-click on
User’s Manual.pdf.
InspireData Classroom Projects
Each copy of InspireData comes with a printed copy of the Classroom Projects book. These ten standardsfocused projects provide a fantastic jumpstart to integrating use of InspireData into the classroom. You’ll
find step-by-step guidance on how to use this powerful tool to achieve desired learning outcomes across
the curriculum. The book is also available as a PDF file. To open the InspireData Classroom Projects PDF
file, choose Classroom Projects from the Help menu and select Classroom Projects.pdf.
Example Databases
Included with InspireData are ten example databases: City Climate EX, Endangered Species EX, Plant
Growth EX, Countries of the World EX, Election Results EX, Gasoline Prices EX, Cell Phone Plans EX,
Dinosaurs EX, Student Survey EX and Music Survey EX. The example databases all contain a slide show
that illustrates how InspireData can be used in the classroom. To open the example databases, click the
Resources button on the Starter screen and browse through the Science, Mathematics, Social Studies,
and More folders.
About Plots
The About Plots folder that can be accessed from Resources on the Starter screen includes four sample
databases that focus on each of the four basic plot types included with InspireData. They also show
examples of the more advanced plots that can be created using InspireData and various features to
enhance plots.
InspireData Website
Please visit www.inspiration.com/inspiredata for more information and examples that use InspireData. On
the Inspiration InspireData website you will find:
• an overview of the product
• a quick tour video that shows many of the exciting features of InspireData
• a variety of subject specific examples of how to use the program in the classroom
Introduction to InspireData
Page 25
•
standards matches that highlight meaningful ways in which InspireData™ supports state standards
Lesson Plan Book
Available for purchase soon, InspireData: Developing Data Literacy, provides lesson plans and activities to
support teachers as they incorporate data analysis into their classrooms in a meaningful way.
Evaluation CD
The Evaluation CD contains an interactive introduction to visual learning, real classroom examples, and
fully functional 30-day trials of Inspiration®, InspireData™, Kidspiration®, Inspiration® for Palm OS® and
Inspiration® for Pocket PC. Visit www.inspiration.com/materials to request a copy of the Evaluation CD.
Customer Service
Inspiration Software®, Inc. is committed to assisting our customers. If you have comments, questions or
need assistance while working with InspireData, you can contact us by email, telephone or fax.
Inspiration Software, Inc. provides customer service and technical support for registered users. Be sure to
register so you can take advantage of our support services.
When you contact us, please be ready to provide your serial number. Our support services are open
Monday-Friday from 8 a.m. to 5 p.m. Pacific time.
Telephone 503-297-3004
Fax
503-297-4676
Email
[email protected]
Introduction to InspireData
Page 26