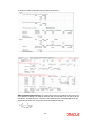
1
Investment Performance Management
Oracle FLEXCUBE Private Banking
Release 12.0.2.0.0
Part No. E49767-01
September 2013
Table of Contents
1.
Preface ...................................................................................................... 1-1
1.1
1.2
1.3
1.4
1.5
1.6
2.
1-1
1-1
1-1
1-1
1-1
1-2
Performance ............................................................................................ 2-1
2.1
2.2
2.3
2.4
2.5
2.6
3.
Introduction..............................................................................................................
Scope ......................................................................................................................
Audience..................................................................................................................
Documentation Accessibility....................................................................................
Organization of the Document.................................................................................
Conventions Used ...................................................................................................
Performance by Portfolio ......................................................................................... 2-5
Performance by Instrument ..................................................................................... 2-5
Performance by Asset Class ................................................................................... 2-8
Risk Measures......................................................................................................... 2-9
Performance Analytics Graph................................................................................ 2-11
Performance by Instrument Group ........................................................................ 2-12
Performance Benchmark Indices ........................................................... 3-1
1. Preface
1.1
Introduction
The objective of the current user manual is to clearly describe the functions available for
performance of investment products.
This module includes the following capabilities:
Multi-level ROR performance across investment products
Benchmark Performance for Regular/Composite Benchmarks .
Risk adjusted returns
Though this manual covers performance for all products available in FCPB, only those
specific products or modules licensed to the bank, would have performance features available
to the bank.
1.2
Scope
The intention of this User Manual is to provide a comprehensive guide to the RM and
Customers of the system. It can also be used as a trouble-shooting guide.
1.3
Audience
The potential readers of this document include but not limited to
1. The Relationship Manager, customers and other users of the system.
2. Top and middle management executives.
3. Developers, database designers of the system for their reference.
4. Product and Functional teams
1.4
Documentation Accessibility
For information about Oracle's commitment to accessibility, visit the Oracle Accessibility
Program website at http://www.oracle.com/pls/topic/lookup?ctx=acc&id=docacc.
1.5
Organization of the Document
The Manual is organized into the following 2 chapters:
Chapter 1
Introduction – Helps the user to understand the purpose and scope of the
document.
Chapter 2
Performance – Helps the user to understand the investment performance,
which is primary benefit of FCPB.
1-1
1.6
Conventions Used
This sub-section explains the conventions followed in the preparation of the manual.
Text
Description
Example
Illustration of the concept
Bold Letters
Command buttons or important text
The command button titles appear as they appear on the screen.
1-2
2. Performance
Description:
One of the primary benefits of FLEXCUBE Private Banking is that, it enables the user to
monitor investment performance. This is important because, over a long period of time, only
a small difference in performance can mean a large difference in wealth. As an example, an
investment earning 14% over 25 years will have almost double the ending value then the one
earning 11%. It is important for the user to understand that FCPBs/investors who adequately
monitor investment performance will consistently out-perform those who do not.
Monitoring of investment performance is not as simple as watching returns reported to you for
your mutual fund company. The reason for this is that such period –to-period returns do not
take into account your investment timing decisions. Stocks, bonds and other investment
holdings complicate the issue since dividend often may not be easily reinvested. Also, once
one has multiple holdings, the combined performance of all investments is not readily
apparent even if you know the performance of the individual holdings.
FLEXCUBE Private Banking resolves all of these performance monitoring issues by
computing and reporting True Time Weighted Rate of Return (TTWR) for annual and monthly
returns inclusive of Year To Date, Month to Date returns and TTWR/XIRR only for since
inception based on configuration at bank parameter level using PERF_IND flag as the
measure for investment performance. The performance returns reported for includes that for
security, portfolio, asset class, instrument analysis group and customer (by grouping of all the
portfolios and their corresponding securities).
FCPB also supports the computation of performance at Household level. Performance ROR
computation at Household level will consider holdings and transactionsfrom the date of
household creation for all tenor buckets, irrespective of the date of creation and transactions
of the individual customers forming part of the household in using True Time Weighted Rate
of Return for annual and monthly returns inclusive of Year To Date, Month to Date and TTWR/
XIRR only for since inception based on configuration at bank parameter level using
PERF_IND flag computation method.
The performance results are customized to include performance figures along with the
performance benchmark results.
True Time Weighted Average Methodology:
The TTWR performance computation is the most accurate method to calculate the time
weighted rates of return as it removes the effects of timing and magnitude of cash flows into
or out of the portfolio which are generally client-driven and not in control by the portfolio
manager.
By removing the timing effects of cash flows, a true time-weighted rate of return best reflects
the firm’s ability to manage the assets according to a specified strategy or objective and is the
basis for the comparability of composite returns across different asset managers. Using the
TTWR as a measure of the manager’s performance presumes that the addition or withdrawal
of moneys under his/her control does not change the manager's stock selection, timing, and
asset allocation strategy. Thus it can be said that the TTWR measures the manager’s
performance and not the performance of the group of assets.
Formula to calculate true time-weighted portfolio return for a sub-period (between 2
consecutive Cashflow dates, whenever cash flows occur is:
2-1
R = (EMV-BMV)/BMV
Where,
EMV is the market value of the portfolio at the end of the sub-period, excluding the cash-flows
on the period end date, but including accrued income for the period.
BMV is the market value at the end of the previous sub-period (i.e., the beginning of the
current sub-period)
Note
The BMV is the EMV as defined above of the previous sub-period plus cash-flows on the
end date of the previous sub-period and including accrued income up to the end of the previous period.
Since in FCPB, we are storing EMV values as end-of-day valuation which includes the
Cashflows for that date, hence for computing the sub-period returns we use the formula:
R = (EMV – C – BMV)/BMV
Where,
BMV is the EMV for the previous cashflow date
C is the Net Cashflow on the end-date of that sub-period
The sub-period returns are then geometrically linked according to the following formula:
R = ((1+R1)X(1+R2)..(1+Rn))-1
Where, RTR is the total return and R1, R2… Rn are the sub-period returns for sub-period 1
through n respectively.
Sub-period 1 extends from the first day of the period up to and including the date of the first
cash flow. Sub-period 2 begins the next day and extends to the date of the second cash flow,
and so forth. The final sub-period extends from the day after the final cash flow through the
last day of the period.
TTWR method assumes that the cash flow is not available for investment until the beginning
of the next day. Therefore when the portfolio is revalued on the date of a cash flow, the cash
flow is not reflected in the Ending Market Value, but is added to the Ending Market Value to
determine the Beginning Market Value for the next day.
Note
The FCPB displays the TTWR ROR computation for ALL Levels and Periods of ROR, except for Since Inception ROR. Since inception ROR displays XIRR/TTWR depending on
the Bank Parameter PERF_IND. If XIRR is chosen as the Bank Parameter, then Since inception value is shown annualised as XIRR always is annualised.
2-2
An example of ROR computation using TTWR is given below:.
XIRR Computation Methodology: An internal rate of return is the effective rate of return on
an investment consisting of a series of payments and incomes that occur over the life of the
investment. The XIRR function in Excel is used to determine the annualized IRR when the
payments and income are varying and are made at different periods.
The Formula for XIRR
2-3
Where,
di = the ith, or last, payment date.
d1 = the 0th payment date.
Pi = the ith, or last, payment
This implies that the net present value of all cash-flows (which should have at least one
positive and one negative value) in the series will be zero when discounted at the XIRR rate.
As XIRR produces the annualized returns, the specific MTD period returns are calculated
using the formula given below:
ROR for MTD = R1= [{(1 + XIRR) ^( n/365 ) }– 1]
ROR for YTD done through Linking of all MTD RORs:
{(1+R1) X(1+ R2) X (1+R3)... (1+R12)] – 1}
An example of ROR computation using XIRR is given below:
.
2-4
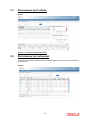
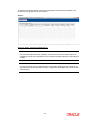
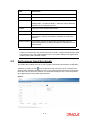
2.1
Performance by Portfolio
Screen:
Figure 2.1: Performance By Portfolio Screen
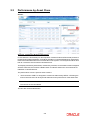
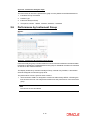
2.2
Performance by Instrument
Click on the appropriate hyperlink under the Portfolio Name column to view the Performance
by Instrument.
Screen:.
2-5
Figure 2.2: Performance By Instrument Screen
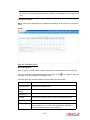
How to Read the Screen:
Performance by Portfolio
The performance screen is split into three sections.
1. The first section ‘ROR%’ is designed to contain two tabs namely MTD & YTD along the
lines of which the user can analyze and examine into the performance of the portfolios for
the selected customer.
Note
The returns are not annualized.
The two tabs are described below:
Monthly
Using the performance formula mentioned in the above section, the
system will compute the monthly performance. This tab will display
the current month to date (MTD) performance along with each
month’s performance for the past six months and the performance
since inception. As explained earlier, the performance reports are
displayed for each of the portfolios of the customer in case portfolio
is selected as a category along with a consolidated customer level
report. The corresponding currency for each portfolio will be considered for computing the performance at the portfolio level whereas
the customer associated currency will be considered for displaying
the results at customer level. Beneath the results for each portfolio
or the customer level, the associated benchmark results are displayed.
The MVB will be as of the first date of the month and the MVE will
be as of the last date of the month or the evaluation date in case of
MTD.
For example, while computing the performance for the month of
April, considering 30th April had been declared a holiday, then the
performance for April would be computed from April 1st to April
29th.
Yearly
This tab displays the current year to date performance, the past five
years performance as well as the performance since inception of
the portfolio. The financial year considered to compute the yearly
performance will be as defined in the bank’s master table. The calculated monthly performances as explained earlier are linked geometrically to compute yearly returns.
As explained earlier, the performance reports are displayed for each
of the portfolios of the customer along with a consolidated performance customer level report. Below the performance result for each
portfolio or the customer level, the associated benchmark results
are displayed.
Note
The system always defaults to the monthly performance tab for all the categories: Portfolio, Asset Class, and Instrument Group.
2-6
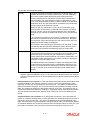
To view the transaction details, click on the appropriate instrument name hyperlink. The
transaction pop up appears as shown below:
Screen:
Figure 2.3: Equity: Transaction Details Pop up
Note
For CASA and TD Instruments, Quantity, Price and Fees columns remains blank. As
CASA does not have any transactions, the Transaction Details popup for CASA will show
no data.
Note
For TDs with Dual Currency deposit feature, the system displays few more fields in the
Transaction pop up like Alternate Currency, Fixing Date, Strike Rate and Amount in Alternate Currency.
2-7
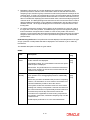
2.3
Performance by Asset Class
Screen:
Figure 2.4: Performance By Asset Class Screen
In case where the functionality for decomposition of Mutual funds and Structured products is
turned off using parameterization, it would be possible to compute ROR based on Asset class,
Each instrument will be linked to one Asset class in the system. This analysis should be done
both at a customer level as well as Household level.
The Display would be by Asset Class, instead of by Portfolio; A benchmark would be assigned
at Asset class level; there will be a Radio button to indicate whether the view should be at
Individual or Household level.
The performance screen is split into three sections.
1. The first section ‘ROR%’ is designed to contain two tabs namely MTD & YTD along the
lines of which the user can analyze and examine into the performance of the asset class.
Note
The returns are not annualized.
The two tabs are described below:
2-8
Monthly
Using the performance formula mentioned in the above section,
the system computes the monthly performance. This tab displays
the current month to date (MTD) performance along with each
month’s performance for the past six months and the performance since inception. For computing the Inception to date ROR
% using True Time Weighted Rate of Return or XIRR method as
configured at bank/entity level, the cash-flows will be considered
by the asset class to which each instrument is linked.
Based on this, the cash-flows occurring in each asset class from
inception to date is considered in the formula. This is done at 2
levels, one for the individual members of the household defined
for the customer as leader and another for the overall household.
The customer associated currency is considered for displaying
the results at asset as well as customer level. Beneath the
results for each asset class or the customer level, the associated
benchmark results are displayed.
Yearly
This tab displays the current year to date performance, the past
five years performance as well as the performance since inception of the asset class. The financial year considered to compute
the yearly performance will be as defined in the bank’s master
table. The calculated monthly performances as explained earlier
are linked geometrically to compute yearly returns.
As explained earlier, the performance reports are displayed for
each of the asset class along with a consolidated performance
customer level report. Below the performance result for each
asset class or customer level, the associated benchmark results
are displayed.
Note
Holding details for CASA accounts whose status is closed are not displayed in the Portfolio
Performance screen. Similarly for TD without transactions, TD accounts with ‘Closed’ status are not displayed in Portfolio Performance screen. However for TD with transactions,
even after TD has matured/closed it continues to be displayed till zero holding days mentioned in the bank parameters.
2.4
Risk Measures
Description:
The Risk Measures feature of FCPB system enables the user to view the risk measures in
terms of computation of weekly ROR, Standard Deviation, and Sharpe Ratio. The system also
displays the Portfolio Level YTM and Duration in the Risk Measures screen.
Note
Risk Measures are available for only those portfolios that have completed 52 weeks in existence
2-9
Note
At any point of time the Risk Measures are computed and available for last 1 year period
only.
User Access Levels:
RM: only the person designated as an Relationship Manager of the system can access this
screen.
Screen:
Figure 2.5: Risk Metric Screen
Screen Navigation:
After you login as an RM, select Customer Portfolio Performance from the top menu.
The user can view the Risk Measures details by clicking on the
hand side corner the Portfolio Performance screen.
icon located at top right
The fields which are all Display fields have been briefly described below:
Field
Description
Portfolio Name
Displays the portfolio name
Benchmark
Name
Displays the benchmark name for the corresponding portfolio
Returns (%)
Portfolio
Displays the portfolio returns for the corresponding portfolio
Benchmark
Displays the benchmark returns for the corresponding portfolio
Std. Dev.(%)
Std. Dev represents risk associated with a given security (stocks,
bonds, property, etc.), or the risk of a portfolio of securities
(actively managed mutual funds, PMSs etc).
2-10
Field
Description
Portfolio
Displays the standard deviation of weekly return of portfolio
Benchmark
Displays the standard deviation of weekly return of benchmark
Sharpe Ratio
It is calculated as
Sharpe Ratio = (Investment Return – Risk free return)/ Standard
Deviation of the investment returns
Portfolio
Displays portfolio Sharpe Ratio details
Benchmark
Displays benchmark Shape Ratio details
YTM Portfolio
The system receives the instrument level YTM from the external
world which is used by the system to calculate the YTM of the
portfolio.
Duration Portfolio
The system receives the instrument level Duration from the
external world which is used by the system to calculate the Portfolio Duration.
Note
If there is no instrument in the portfolio where the ‘Include in YTM & Portfolio Duration’ field
is marked as ‘Yes’ in the Product Master screen, the system displays ‘N/A’ against that
portfolio under YTM & Duration column.
2.5
Performance Analytics Graph
The system also enables the user to view a graph of instrument performance Vs Standard
deviation by clicking on the
icon located at the top right hand corner or Performance
Analysis tab of Portfolio Performance screen. This graph is displayed for all the instruments
which are part of a particular customer or household’s holdings in any or all of his portfolio
types (depending on the portfolio type selection)
Screen:.
2-11
Figure 2.6: Performance Analytics Graph
The instruments for which the performance graph is to be plotted can be filtered based on:
1. Individual/ Group/ Household
2. Portfolio Type
3. Instrument analysis Group
4. Time period, Values: 1 Month, 3 Months, 6 Months, 12 Months
2.6
Performance by Instrument Group
Screen:
Figure 2.7: Performance By Instrument Group Screen
Instrument Analysis group is another attribute of each instrument defined in the master table.
Performance will also be computed based on this group for individual members of household
as well as for the overall household
The Display would be by Instrument Analysis Group, instead of by Portfolio; A benchmark
would be assigned at instrument group level.
The performance screen is split into three sections.
1. The first section ‘ROR%’ is designed to contain two tabs namely MTD & YTD along the
lines of which the user can analyze and examine into the performance of the instrument
group.
Note
The returns are not annualized.
2-12
The two tabs are described as below:
Monthly
Using the performance formula mentioned in the above section, the
system will compute the monthly performance. This tab will display
the current month to date (MTD) performance along with each
month’s performance for the past six months and the performance
since inception. For computing the Inception to date ROR % using
True Time Weighted Rate of Return or XIRR method as configured at
bank/entity level, the cash-flows will be considered by the instrument
group to which each instrument is linked.
Based on this, the cash-flows occurring in each instrument group
from inception to date will be considered in the formula. This will be
done at 2 levels, one for the individual members of the household
defined for the customer as leader and another for the overall household.
The customer associated currency will be considered for displaying
the results at instrument group as well as customer level. Beneath
the results for each instrument group or the customer level, the associated benchmark results are displayed.
For example, while computing the performance for the month of April,
considering 30th April had been declared a holiday, then the performance for April would be computed from April 1st to April 29th.
Yearly
This tab displays the current year to date performance, the past five
years performance as well as the performance since inception of the
instrument group. The financial year considered to compute the
yearly performance will be as defined in the bank’s master table. The
calculated monthly performances as explained earlier are linked geometrically to compute yearly returns.
As explained earlier, the performance reports are displayed for each
of the instrument group along with a consolidated performance customer level report. Below the performance result for each instrument
group or customer level, the associated benchmark results are displayed.
2. The second section displays since inception portfolio value and portfolio returns as two
separate graphical illustration. Both the value and returns displayed are at the customer
level and consequently are for the entire holdings of the customer spanning across all the
portfolios.
Portfolio Value since Inception: is a bar chart wherein the y axis represents the value of the
customer holdings in the customer preferred currency. The x axis represents the years
beginning from the year of first funding to the current year. The values considered for the
years demarcated in the graph, are as per the financial years defined in the bank’s master
table. This graph also displays the benchmark value for each year. This helps the user to
compare the value of the customer’s holdings in comparison with the value of the benchmark.
The benchmark associated at the customer level is taken into account for displaying the
results.
Portfolio Returns since Inception: is an area graph wherein the y axis represents the
returns on customer holdings and the x axis represents the years beginning from the year of
first funding to the current year. The returns considered for the years demarcated in the
graph, are for the financial year as defined in the bank’s master table. The area graph displays
an evaluation between the customer’s returns and the benchmark returns for each year. The
benchmark considered is the one which has been associated at the customer level.
2-13
3. Beneath the first section is a section displaying the performance analysis for each
portfolio if portfolio is selected, each asset class if asset is selected and instrument
analysis group if instrument group is selected as well as the performance analysis at the
customer level. To recap, the corresponding currency of each portfolio will be considered
for computing the results at the portfolio level whereas the customer associated currency
will be considered for displaying the results at asset class, instrument analysis group and
customer level. The distinguishing factor about this section from the first section is that it
displays additional information on the realized /unrealized gain /loss and the interest or
dividend received. All the figures displayed in this section are computed from the first
funding date.
4. For further performance analysis of the holdings in each portfolio, the user can click on
the hyper link under each portfolio. An additional pop-up screen will appears imparting
further information and performance results on each security held in the selected
portfolio. In case of asset class and instrument analysis group there will not be any further
analysis at instrument level only in case of portfolio that a hyperlink is provided under
portfolio name.
Understanding the Screen: The performance results displayed are independent of the type
of login (customer or RM). Blank tabs will be displayed if the customer is yet to make any
investments.
The detailed descriptions of fields are given below:
ROR%
Manda
tory
Field
Description
Portfolio
Name
Portfolio: The performances for all the portfolios associated
to the customer are displayed.
Aggregate Portfolio: The consolidated customer level performance report is displayed
Display
only
Benchmark: The performances for each benchmark associated to each portfolio as well as the one associated for the
customer are displayed.
MTD/
Monthly
The methodology used for computing the performance for
each portfolio or for the aggregate portfolio is substantially
the same.
Before we proceed to understand the process of computing
returns, it is essential for us to be aware of some basic conventions followed by FCPB to derive the returns:
The system would have stored the returns for each month
starting from January to September. However the returns for
the current month will be computed daily and will continue to
overwrite the previous days return till the month end.
The same rule is applicable to returns being computed for
the portfolio, asset class, instrument analysis group or at the
customer level.
FCPB reports performance on a non-annualized basis.
2-14
Display
only
Manda
tory
Field
Description
YTD /
Yearly
The financial year considered to compute the yearly performance will be as defined in the bank’s master table. The formula enumerated below calculates the “Year to date”
performance by taking the monthly performances:
Year To Date Performance = ((1 + R Apr) * (1 + R May) * (1
+ R Jun)… * (1+Rn) – 1
“n” – is the nth month’s performance.
“R Mon” is the Period performance for the month
In other words, to compute the annual rate of return for portfolio returns calculated yearly, all the monthly returns for the
corresponding year are linked geometrically.
To recap, for the YTD computation the market value on the
current business day will be considered for computing the
MVE.
Note: It is interesting to note that an investment gaining
10% over a 365 day non-leap year will show an ROI of
slightly more than 10%, whereas an investment gaining
exactly 10% over a 366 day year (leap year) will show an
ROI of slightly less than 10% for the year.
Since
inception
The since inception returns illustrates the returns from the
first funding date of the portfolio till the current business day.
The computation methodology is identical to the one elucidated earlier.
Aggregate
Portfolio
The objective in calculating the aggregate returns is to produce the same returns value as if the holdings of all the individual portfolios in the composite were aggregated and a
return is calculated for one master portfolio.
However it is essential to note that the MVE, MVB, F and
FW will all be denominated in the customer preferred currency. To recap, in case of nonconformity with the above
condition, the closing exchange rate on the date of transaction across all those securities will be made use of.
The customer holds IBM shares in Portfolio 1 (currency of
portfolio is also $)
Date
Market value
($)
12/31/06
100000
1/10/07
103000
1/22/07
130000
1/31/07
133000
2-15
Cash Flow
($)
Market value
Post Cash
Flow ($)
20000
123000
Display
only
Field
Manda
tory
Description
The customer holds I-Flex shares in Portfolio 2 (currency of
the portfolio is INR)
Date
Market Value
(INR)
12/31/06
500000
1/10/07
512000
1/22/07
530000
1/31/07
470000
Cash Flow
(INR)
Market value
post Cash
Flow (INR)
-70000
The holdings statement in the customer preferred currency
for computing aggregate portfolio would be as given below:
Date
Market Value
($)
Cash Flow
($)
Market value
post Cash
Flow ($)
12/31/06
100000+
(500000 x
44.76)
1/10/07
103000 +
(512000 /
47.23)
20000
133840.57
1/22/07
130000 +
(530000 /
43.78)
-70000 /
43.78
140507.08
1/31/07
133000 +
(470000 /
43.65)
Please note the divisors used for the I-Flex transactions
denote the closing exchange rate for the corresponding
business days.
2-16
Performance Analysis: By Portfolio
Field
Description
Mandatory
Portfolio Name
The performances for all the portfolios associated
to the customer are displayed along with the consolidated customer level performance report
Display only
While the above tab reported the return measures
in investments in a portfolio as a percentage of initial investment across various periods, this tab
intends to report the user with an extensive evaluation of your portfolio performance and an in-depth
break-down of your portfolio from different perspectives, such as realized Gain/Loss, interest/dividend,
unrealized Gain/Loss analysis.
Currency
All the figures associated to the portfolio are displayed in the portfolio currency. To recap, the system converts and stores all the transaction
amounts from the security currency to the portfolio
currency for all the securities in the portfolio.
Display only
Buy Cost
This is the sum of the buy costs of all the securities,
across all the instrument types, in the portfolio,
denominated in the portfolio currency.
Display only
This buy cost at the security level is arrived at by
using the weighted average cost methodology.
However, the important point to be noted is that the
weighted average cost methodology is pertinent
only for the remaining purchase transactions in the
portfolio subsequent to application of the first-in,
first-out (FIFO) rule for all the sale transactions in
the portfolio.
The average cost requires you to determine the
average cost per share – total amount invested
divided by the total number of shares held.
A FIFO rule is an accounting methodology wherein
if if the user holds a security of the same class
which has been acquired on different dates, the
security acquired at the earlier time is deemed to
be disposed off first. In other words, it is assumed
that for the securities of the same class, the securities purchased first are sold first.
For further details on the computation of buy cost
please refer to the section Portfolio Analysis – By
Portfolio.
Market Value
Similar to the buy cost, the market value at the portfolio level represent the sum of the market values
for all the securities across all the instrument types
in the portfolio, denominated in the portfolio currency. Market value at the security level is computed as a product of quantity and market price.
2-17
Display only
Field
Description
Mandatory
Realized Gain /
Loss
It is the sum of the gain/loss of all the securities,
across all the instrument types, in the portfolio,
denominated in the portfolio currency. The important point to note that the realized gain/loss figure
displayed here, is inclusive of all the gain/loss figures across all the securities accounting from the
earliest sale transaction in the portfolio after the
first funding date.
Display only
Any gain/loss that has already occurred when a
security position was closed is a realized gain/loss.
Let’s take an example to illustrate capital gain and
capital loss.
Assume the customer has purchased 10 shares of
XYZ AT $20.00/share. The buy cost = $200
There are two possible scenarios:
He/she decides to sell the 10 shares of XYZ at
$25.00 per share. In this case his realized gain
from this transaction = $250 (sell cost) - $200 (buy
cost) = $50
He/she decides to sell the 10 shares of XYZ at
$10.00 per share. In this case he had a loss from
this transaction = $100 (sell cost) - $200 (buy cost)
= -$100.00
When selling securities, System uses FIFO (First
in, First out), which automatically pairs a sale of
security with the first transaction that was bought.
Here’s an example: Your customer purchased 100
shares of FZ Steel co. at $5 / share in January.
Three months later you purchased another 100
shares of FZ Steel at $7/share.
Purchase 1 = $5 x 100 = 500
Purchase 2 = $7 x 100 = 700
If he/she decides to sell 150 shares of FZ Steel Co.
when the price reached $10/share, the 150 shares
he/she is selling includes the combination of shares
from his first purchase and subsequent purchase.
Let us calculate what the realized gain for the 150
shares is.
Take 100 shares from the $5 lot and 50 shares from
the $7 lot (FIFO):
(150 X 10) - ((100 X 5) + (50 X 7)) = 1500 – 850 =
$650
Using the FIFO method, a realized gain of $ 650.00
Note: Realized gain/loss excludes the dividend/
interest received.
2-18
Field
Description
Mandatory
Unrealized
Gain /Loss
This is the sum of the unrealized gain/loss of all the
securities, across all the instrument types, in the
portfolio, denominated in the portfolio currency.
Display only
Unrealized gain/loss is the hypothetical value of the
gain or loss that would be realized if the security
were sold at the market price. A realized loss
occurs when a security’s market price decreases
after an investor buys it, but he or she has yet to
sell it. If the market price of the security rose back
above the buy price, then the investor would have
an unrealized gain for the time he or she still holds
on to the security.
An example, the customer buys shares in TSJ
Sports at $10 per share and then shortly afterwards
the stock price plummets to $3 per share but you
do not sell. At this point, you have an unrealized
loss on this stock of $7 per share, because the
value of your position is $7 dollars less than when
you first entered into the position. Let’s say the
company’s fortunes then shift and the share price
soars to $18. Since you have not sold the stock,
you will now have an unrealized gain of $8 per
share.
Note: Important point to be remembered while
computing unrealized gain/loss is the consideration
of accrued interest for the securities under the
instrument type ‘bonds’.
Interest / Dividend
The summation of all the dividend/interest received
across all the securities in the portfolio, right from
the first funding day of the portfolio are represented
here in the portfolio currency.
Display only
ROR%
The performance figures computed as explained in
the previous table using the True Time Weighted
Rate of Return methodology are displayed here.
The returns computed from the first funding date of
the portfolio (since inception) are displayed here.
Display only
Last Txn Dt
Displays the last transaction date for the corresponding portfolio. If the portfolio has zero value
i.e. if the current market value AND current buy
cost is zero, then the user can exclude the corresponding portfolio from the portfolio maintenance
and portfolio performance screens.
Display only
This is done by setting the Number Of Days for
Last Transaction for zero Holding Portfolio field in
Portfolio & Order Related tab of Bank Parameters.;
and whenever the Portfolio has zero values beyond
this period, it will stop being shown in the Portfolio
Maintenance and Performance screens
2-19
Performance Analysis: By Asset Class
Field
Description
Mandatory
Asset Class
Name
Performances of all the asset class associated to
the customer are displayed along with the consolidated customer level performance report.
Display only
While the above tab reported the return measures
in investments in an asset class as a percentage
of initial investment across various periods, this
tab intends to report an extensive evaluation of
asset class performance and an in-depth breakdown of asset class from different perspectives,
such as realized Gain/Loss, interest/dividend,
unrealized Gain/Loss analysis.
Currency
All the figures associated to the asset class are
displayed in the customer currency. To recap, the
system converts and stores all the transaction
amounts from the security currency to the customer currency for all the securities categorized in
the asset class.
Display only
Buy Cost
Is the sum of the buy costs of all the securities categorized in the particular asset class, denominated in the customer currency.
Display only
This buy cost at the security level is arrived at by
using the weighted average cost methodology.
However, the important point to be noted is that
the weighted average cost methodology is pertinent only for the remaining purchase transactions
in the security subsequent to application of the
first-in, first-out (FIFO) rule for all the sale transactions in the asset class.
The average cost requires you to determine the
average cost per share – total amount invested
divided by the total number of shares held.
A FIFO rule is an accounting methodology wherein
if you hold a security of the same class which has
been acquired on different dates, the security
acquired at the earlier time is deemed to be disposed off first. In other words, it is assumed that
for the securities of the same class, the securities
purchased first are sold first.
For further details on the computation of buy cost
please refer to the section Portfolio Analysis – By
Portfolio.
2-20
Field
Description
Mandatory
Market Value
Similar to the buy cost, the market value at the
asset class level represent the sum of the market
values of all the securities categorized in the
selected asset class, denominated in the customer
currency. Market value at the security level is computed as a product of quantity and market price.
Display only
The market price for securities defined under the
instrument type equity, mutual fund, traded bonds,
PMS, CASA, TD, Specialized Product and structured product will come from downloads and or
imports. For the securities under the instrument
type insurance, others and non traded bonds the
price is as per the last manual update.
The surrender value would be considered as market price for the securities under the instrument
type insurance.
Note: In the absence of market price, for the securities requiring market price to be manually
updated, the system considers the acquisition
price as the market price.
‘Realized Gain
/Loss
Is the sum of the gain/loss of all the securities, categorized in the selected asset class, denominated
in the customer currency. The important point to
bear in mind is that the realized gain/loss figure
displayed here, is inclusive of all the gain/loss figures across all the securities accounting from the
earliest sale transaction in the asset class after the
first funding date.
Display only
Any gain/loss that has already occurred when a
security position was closed is a realized gain/
loss.
Unrealized
Gain /Loss
This is the sum of the unrealized gain/loss of all
the securities, categorized in the asset class,
denominated in the customer currency.
Display only
Unrealized gain/loss is the hypothetical value of
the gain or loss that would be realized if the security were sold at the market price. A realized loss
occurs when a security’s market price decreases
after an investor buys it, but he or she has yet to
sell it. If the market price of the security rose back
above the buy price, then the investor would have
an unrealized gain for the time he/she still holds on
to the security.
Interest / Dividend
The summation of all the dividend/interest
received across all the securities categorized in
the selected asset class, right from the first funding
day of the asset class are represented here in the
customer currency.
2-21
Display only
Field
Description
Mandatory
ROR%
The performance figures computed as explained
in the previous table using the True Time
Weighted Rate of Return methodology are displayed here. The returns computed from the first
funding date of the asset class (since inception)
are displayed here.
Display only
2-22
Performance Analysis: By Instrument Analysis Group
Field
Description
Mandatory
Asset Class
Name
Performances of all the instrument analysis group
associated to the customer are displayed along
with the consolidated customer level performance
report.
Display only
While the above tab reported the return measures
in investments in an instrument analysis group as a
percentage of initial investment across various periods, this tab intends to report an extensive evaluation of Instrument analysis group performance and
an in-depth break-down of instrument analysis
group from different perspectives, such as realized
Gain/Loss, interest/dividend, unrealized Gain/Loss
analysis.
Currency
All the figures associated to the instrument group
are displayed in the customer currency. To recap,
the system converts and stores all the transaction
amounts from the security currency to the customer
currency for all the securities categorized in the
instrument analysis group.
Display only
Buy Cost
This is the sum of the buy costs of all the securities,
categorized in the particular instrument analysis
class, denominated in the customer currency.
Display only
This buy cost at the security level is arrived at by
using the weighted average cost methodology.
However, the important point to be noted is that the
weighted average cost methodology is pertinent
only for the remaining purchase transactions in the
security subsequent to application of the first-in,
first-out (FIFO) rule for all the sale transactions in
the instrument analysis group.
The average cost requires you to determine the
average cost per share – total amount invested
divided by the total number of shares held.
A FIFO rule is an accounting methodology wherein
if the user holds a security of the same class which
has been acquired on different dates, the security
acquired at the earlier time is deemed to be disposed off first. In other words, it is assumed that for
the securities of the same class, the securities purchased first are sold first.
For further details on the computation of buy cost
please refer to the section Portfolio Analysis – By
Portfolio.
2-23
Field
Description
Mandatory
Market Value
Similar to the buy cost, the market value at the
instrument analysis group level represent the sum
of the market values of all the securities categorized in the selected instrument analysis group,
denominated in the customer currency. Market
value at the security level is computed as a product
of quantity and market price.
Display only
‘Realized Gain /
Loss
This is the sum of the gain/loss of all the securities,
categorized in the selected instrument analysis
group, denominated in the customer currency. The
important point to bear in mind is that the realized
gain/loss figure displayed here, is inclusive of all
the gain/loss figures across all the securities
accounting from the earliest sale transaction in the
instrument analysis group after the first funding
date.
Display only
Any gain/loss that has already occurred when a
security position was closed is a realized gain/loss.
Unrealized
Gain /Loss
This is the sum of the unrealized gain/loss of all the
securities, categorized in the instrument analysis
group, denominated in the customer currency.
Display only
Unrealized gain/loss is the hypothetical value of the
gain or loss that would be realized if the security
were sold at the market price. A realized loss
occurs when a security’s market price decreases
after an investor buys it, but he or she has yet to
sell it. If the market price of the security rose back
above the buy price, then the investor would have
an unrealized gain for the time he or she still holds
on to the security.
Interest / Dividend
The summation of all the dividend/interest received
across all the securities categorized in the selected
instrument analysis group , right from the first funding day of the instrument analysis group are represented here in the customer currency.
Display only
ROR%
The performance figures computed as explained in
the previous table using the True Time Weighted
Rate of Return methodology are displayed here.
The returns computed from the first funding date of
the instrument analysis group(since inception) are
displayed here.
Display only
Portfolio Performance: Holding Details
Holding details at instrument level is only available when View by Portfolio is selected. For
view by Asset Class and Instrument Analysis Group, there will not be any further
decomposition of data at instrument level
2-24
Field
Description
Mandatory
Name
Displays the names of all the securities across all the
instrument types in the portfolio.
Display only
Instrument
Displays the instrument type for each of the securities in the portfolio. The instrument type is displayed
as per the data captured in the instrument master
table in the database.
Display only
Currency
Security currency is displayed. Again, the currency
displayed is, as captured in the instrument master
table.
Display only
Buy Cost
To recap what we comprehended in the earlier table,
the buy cost at the security level is arrived at by using
the weighted average cost methodology for the balance transactions in the portfolio subsequent to
application of the first-in, first-out (FIFO) rule for all
the sale transactions in the portfolio.
Display only
For further details on the computation of buy cost
please refer to the section Portfolio Analysis – By
Portfolio.
Market Value
The market value at the security level is computed as
a product of quantity and market price.
Display only
Value date
This is the date on which the market value was either
received or manually updated by the user.
Display only
Realized Gain /
Loss
This is the sum of the gain/loss of the security from
the earliest sale transaction in the portfolio after the
first funding date.
Display only
Please refer to the previous table for further details
on realized gain/loss.
Note: Realized gain/loss excludes the dividend/interest received.
Unrealized
Gain /Loss
Unrealized gain/loss is the hypothetical value of the
gain or loss that would be realized if the security
were sold at the market price.
Display only
Interest / Dividend
Is the summation of all the dividend/interest received
from the first funding day of the security.
Display only
ROR%
The performance figures computed as explained in
the earlier table using the True Time Weighted Rate
of Return methodology are displayed here. The
returns computed from the first funding date of the
security (since inception) are displayed here.
Display only
At the end of the tab, the last row displays the sum of all the above fields in the portfolio
preferred currency (computed as explained earlier).
2-25
On clicking on any of the securities in the earlier tab, displays the entire transaction details of
the security in a pop up screen. This table has been explained in the section on Portfolio
Valuation.
2-26
3. Performance Benchmark Indices
FCPB allows the user to compare performance versus user selectable benchmark indices.
The indices specified are standard market indices of the type widely reported e.g. S&P
500.The composition and values of these indices are regularly reported in the financial media.
The user may specify a benchmark for each portfolio of the customer, for asset class and
instrument analysis group as well as a unique benchmark for the customer. FCPB provides a
consolidated performance report for the customer which is generated by combining the
holdings across all the portfolios of the selected customer. This consolidated performance
report will here after be referred to as the customer level report.
The Benchmark ROI is computed as the difference between index values at the beginning
and end of the measurement period. The beginning period considered is generally the
beginning of the measurement period with the exception when the evaluation is being
computed for the first time, where the beginning period considered will be the first funding
date of the portfolio. The first funding date of the portfolio is when the security which was first
or earliest funded into the portfolio. Any positive or negative deviation of the portfolio/group of
all portfolios of the customer’s performance from this benchmark can generally be attributed
to the securities in the portfolio/s which under or over performed.
The benchmark returns will be displayed as blank fields if the customer fails to associate a
benchmark to a portfolio/s or to the customer.
Screen Navigation:
1. After you login, select a customer by through the Customer -> Customer List from the top
menu.
2. Once the customer has been selected, the portfolio analysis screen can be accessed
through the Portfolio and Performance sub menu.
3-1
Investment Performance Management
September 2013
Oracle Financial Services Software Limited
Oracle Park
Off Western Express Highway
Goregaon (East)
Mumbai, Maharashtra 400 063
India
Worldwide Inquiries:
Phone: +91 22 6718 3000
Fax:+91 22 6718 3001
www.oracle.com/financialservices/
Copyright © 2007, 2013, Oracle and/or its affiliates. All rights reserved.
Oracle and Java are registered trademarks of Oracle and/or its affiliates. Other names may be trademarks of their respective
owners.
U.S. GOVERNMENT END USERS: Oracle programs, including any operating system, integrated software, any programs installed
on the hardware, and/or documentation, delivered to U.S. Government end users are "commercial computer software" pursuant to
the applicable Federal Acquisition Regulation and agency-specific supplemental regulations. As such, use, duplication, disclosure,
modification, and adaptation of the programs, including any operating system, integrated software, any programs installed on the
hardware, and/or documentation, shall be subject to license terms and license restrictions applicable to the programs. No other
rights are granted to the U.S. Government.
This software or hardware is developed for general use in a variety of information management applications. It is not developed or
intended for use in any inherently dangerous applications, including applications that may create a risk of personal injury. If you use
this software or hardware in dangerous applications, then you shall be responsible to take all appropriate failsafe, backup,
redundancy, and other measures to ensure its safe use. Oracle Corporation and its affiliates disclaim any liability for any damages
caused by use of this software or hardware in dangerous applications.
This software and related documentation are provided under a license agreement containing restrictions on use and disclosure and
are protected by intellectual property laws. Except as expressly permitted in your license agreement or allowed by law, you may
not use, copy, reproduce, translate, broadcast, modify, license, transmit, distribute, exhibit, perform, publish or display any part, in
any form, or by any means. Reverse engineering, disassembly, or decompilation of this software, unless required by law for
interoperability, is prohibited.
The information contained herein is subject to change without notice and is not warranted to be error-free. If you find any errors,
please report them to us in writing.
This software or hardware and documentation may provide access to or information on content, products and services from third
parties. Oracle Corporation and its affiliates are not responsible for and expressly disclaim all warranties of any kind with respect
to third-party content, products, and services. Oracle Corporation and its affiliates will not be responsible for any loss, costs, or
damages incurred due to your access to or use of third-party content, products, or services.