1
Instruction
MI 611-225
August 2009
Model 875PH
Intelligent Electrochemical Analyzer
for
pH, ORP, or Ion Selective Electrode (ISE) Measurements
MI 611-225 – August 2009
Contents
Figures................................................................................................................................... vii
Tables..................................................................................................................................... ix
1. Introduction ...................................................................................................................... 1
Reference Documents ............................................................................................................... 1
Factory Default Passcode ........................................................................................................... 1
2. Quick Start........................................................................................................................ 3
Wiring ......................................................................................................................................
Checking Factory Configuration ...............................................................................................
Calibration ................................................................................................................................
Basic Operation in Measure Mode ............................................................................................
Looking for More Information? ................................................................................................
3
5
5
5
5
3. Specifications..................................................................................................................... 7
Operating, Storage, and Transportation Conditions .................................................................. 7
Functional and Physical Specifications ...................................................................................... 7
4. Installation ......................................................................................................................
Unpacking ..............................................................................................................................
Identification ..........................................................................................................................
Mounting ................................................................................................................................
Panel Mounting .................................................................................................................
Surface Mounting ...............................................................................................................
Pipe Mounting ...................................................................................................................
Wiring ....................................................................................................................................
Panel-Mounted Analyzer ....................................................................................................
Pipe- or Surface-Mounted Analyzer ....................................................................................
Wiring Connections ...........................................................................................................
Digital Input Wiring ..........................................................................................................
HART I/O Communication Wiring .......................................................................................
11
11
11
12
12
13
13
14
14
14
15
17
18
Analog Output Wiring ............................................................................................................
Alarm Wiring .....................................................................................................................
Energized Trip State ......................................................................................................
De-energized Trip State .................................................................................................
18
19
19
19
5. Operation Via Local Display ........................................................................................... 21
iii
MI 611-225 – August 2009
Contents
Controls and Indicators ...........................................................................................................
Display ....................................................................................................................................
Dual Measurement Screen ..................................................................................................
Single Measurement Screen ................................................................................................
Fault Messages ........................................................................................................................
Sensor Fault .......................................................................................................................
Configuration Fault ............................................................................................................
Analyzer Fault ....................................................................................................................
Digital Fault .......................................................................................................................
Slope Error .........................................................................................................................
Table Entry Error ...............................................................................................................
Passcode Access .......................................................................................................................
Viewing and Changing Data ...................................................................................................
Accessing Operating Modes ....................................................................................................
Measure Mode ........................................................................................................................
Status Mode ............................................................................................................................
Hold Mode .............................................................................................................................
Calibration Mode ....................................................................................................................
Solution Calibration ...........................................................................................................
Manual Calibrations ......................................................................................................
Smart Calibration ..........................................................................................................
Bench Calibration ..............................................................................................................
Analog 1 and Analog 2 .......................................................................................................
Auto Service 1 and Auto Service 2 ......................................................................................
Configuration Mode ...............................................................................................................
Configuration Display ........................................................................................................
Measurement ......................................................................................................................
Sensor ................................................................................................................................
Electrode .......................................................................................................................
Temp Type ...................................................................................................................
Temp Unit ....................................................................................................................
Temp Mode ..................................................................................................................
Temp Comp ......................................................................................................................
Display ...............................................................................................................................
Analog 1 and Analog 2 .......................................................................................................
Measurement .................................................................................................................
Output Range ...............................................................................................................
Fail-Safe Output ............................................................................................................
HART Analog ...............................................................................................................
HART Digital Outputs .................................................................................................
Diagnostics .........................................................................................................................
Leakage ..........................................................................................................................
ATC Short, ATC Open .................................................................................................
4 to 20 Range ................................................................................................................
Comp Range .................................................................................................................
Meas Range ...................................................................................................................
Glass ..............................................................................................................................
iv
21
22
22
23
23
23
23
23
24
24
24
24
25
27
27
29
32
34
35
36
38
38
40
41
41
43
43
43
43
44
44
44
44
45
46
46
46
47
47
48
48
49
49
49
49
49
49
Contents
MI 611-225 – August 2009
Low Slope ......................................................................................................................
Preamp ..........................................................................................................................
Aging .............................................................................................................................
Coating .........................................................................................................................
Auto Service 1 and Auto Service 2 ......................................................................................
Methods of Initiation ....................................................................................................
Calibration Solution ......................................................................................................
Auto-Clean and Calibration Times ................................................................................
Trip State and Hold ......................................................................................................
Signaled Hold ....................................................................................................................
Alarm 1, Alarm 2 ................................................................................................................
Measurement Condition ................................................................................................
Alarm Activation ...........................................................................................................
Remote ...............................................................................................................................
HART Digital ....................................................................................................................
Cal Parameters ...................................................................................................................
Buffers ...........................................................................................................................
Measurement and Temperature Stability .......................................................................
Automatic Hold .................................................................................................................
Timeouts ............................................................................................................................
Date and Time ...................................................................................................................
Analyzer Names ..................................................................................................................
Passcode .............................................................................................................................
Adjust LCD .......................................................................................................................
Default ...............................................................................................................................
Diagnostic Mode .....................................................................................................................
Remote Data Logging .............................................................................................................
50
50
50
50
50
51
51
52
52
52
52
52
52
54
54
54
55
57
58
58
58
58
59
59
59
60
61
6. Operation Via HART Communicator .............................................................................
Description .............................................................................................................................
Overview of Top Level Menus ................................................................................................
Connecting the HART Communicator ...................................................................................
Communicator Keyboard and Display ....................................................................................
Offline Configuration .............................................................................................................
Online Configuration .............................................................................................................
Online Flowchart ...............................................................................................................
Online Modes ....................................................................................................................
Measurement .................................................................................................................
Status .............................................................................................................................
Hold ..............................................................................................................................
Calibrate ........................................................................................................................
Configure ......................................................................................................................
Diagnostics ....................................................................................................................
Logon Passcode .............................................................................................................
Glossary of Online Parameters ...........................................................................................
63
63
63
64
64
64
65
65
66
66
66
66
66
66
67
67
68
7. Maintenance.................................................................................................................... 71
v
MI 611-225 – August 2009
Contents
Appendix A. Structure Diagrams ......................................................................................... 73
Appendix B. Configuration Table ........................................................................................ 85
Index .................................................................................................................................... 91
vi
Figures
1
2
3
4
5
6
7
8
9
10
11
12
13
14
15
16
17
18
19
20
21
22
23
24
25
26
27
28
29
30
31
32
33
34
35
36
37
38
39
A-1
A-2
A-3
A-4
Wiring Connections (Style B) ......................................................................................
Sample Information Data Label ...................................................................................
Sample Configuration Data Label ................................................................................
Panel Mounting ...........................................................................................................
Surface Mounting ........................................................................................................
Pipe Mounting (Vertical Pipe Mounting Shown) .........................................................
Wiring Connections for 875PH Analyzer ....................................................................
Optically Isolated Interface 24 V dc, FET Output PLC ...............................................
Optical Isolated Analog Switch ....................................................................................
Electromechanical Relay Interface ................................................................................
Alarm Wiring in Energized Trip State ..........................................................................
Alarm Wiring in De-energized Trip State .....................................................................
Indicators and Controls ................................................................................................
Sample Dual Measurement Screen ...............................................................................
Sample Single Measurement Screen .............................................................................
Example of Structure Diagram .....................................................................................
Mode Key Operation ...................................................................................................
Measure Mode Structure Diagram ...............................................................................
Sample Status Screen ....................................................................................................
Status Mode Structure Diagram ...................................................................................
Sample Hold Screen .....................................................................................................
Hold Mode Structure Diagram ....................................................................................
Sample Calibration Screen ...........................................................................................
Calibration Category Structure ....................................................................................
Solution Calibration Structure Diagram .......................................................................
Smart Calibration Structure Diagram ...........................................................................
Bench Calibration Structure Diagram ..........................................................................
Analog Calibration Structure Diagram .........................................................................
Auto Service Structure Diagram ...................................................................................
Configuration Mode Exit Flow ....................................................................................
Sample Configuration Screen .......................................................................................
High Alarm with Hysteresis .........................................................................................
Timed Low Alarm ........................................................................................................
Sample Diagnostic Screen ............................................................................................
Top Level Diagnostic Mode Structure .........................................................................
HART Communicator Main Menu .............................................................................
875 Series Analyzers Top Level Online Menu ..............................................................
HART Communicator Connection .............................................................................
Online Configuration Flowchart ..................................................................................
Configuration Top Level Structure ................................................................................
Configure Measurement Structure ................................................................................
Configure Sensor Structure ...........................................................................................
Configure Tempcomp Structure....................................................................................
3
11
12
12
13
13
16
17
18
18
19
19
21
22
23
26
27
28
29
31
32
33
34
35
37
38
40
40
41
42
43
53
53
60
61
63
64
64
65
73
74
75
75
vii
MI 611-225 – August 2009
A-5
A-6
A-7
A-8
A-9
A-10
A-11
A-12
A-13
A-14
A-15
A-16
A-17
A-18
A-19
A-20
A-21
A-22
viii
Figures
Configure Display Structure..........................................................................................
Configure Analog Structure...........................................................................................
Configure HART Structure...........................................................................................
Configure Diagnostics Structure....................................................................................
Configure Auto Service Structure ..................................................................................
Configure Auto Service Structure (Continued)..............................................................
Configure Signaled Hold Structure ...............................................................................
Configure Alarm Structure ............................................................................................
Configure Remote Structure .........................................................................................
Configure HART Digital Structure Diagram ................................................................
Configure Cal Parameters Structure ..............................................................................
Configure Automatic Hold Structure ............................................................................
Configure Timeout Structure ........................................................................................
Configure Date and Time Structure ..............................................................................
Configure Analyzer Names Structure.............................................................................
Configure Passcode Structure ........................................................................................
Configure Adjust LCD Structure ..................................................................................
Configure Default Structure..........................................................................................
76
76
77
77
78
79
79
80
81
81
82
82
83
83
83
83
83
83
Tables
1
2
3
4
5
6
7
8
9
10
11
12
13
Operating, Storage, and Transportation Conditions .....................................................
Product Safety Specifications ........................................................................................
Recommended Conduit and Fittings ...........................................................................
Terminal Identification ................................................................................................
Indicators and Controls ................................................................................................
Passcode Access ............................................................................................................
Status Parameters .........................................................................................................
Millivolt Supply Formulas ............................................................................................
Display Configuration ..................................................................................................
Bar graph Configuration ..............................................................................................
American Buffer Tables ................................................................................................
NIST Buffer Tables ......................................................................................................
European Buffer Tables ................................................................................................
7
9
15
16
21
24
29
39
45
46
55
56
57
ix
MI 611-225 – August 2009
x
Tables
1. Introduction
The 875PH Analyzer is one of a family of line-powered analyzers. It receives pH, ORP, or Ion
Selective measurements from a measuring sensor and provides that information via a front panel
display, integral dual analog (4 to 20 mA) outputs, an optional digital communication port, and
dual alarm outputs.
The analyzer is available in panel, pipe, and surface mounted versions. The panel mounted
version is rated NEMA Type 1. However, the front panel meets NEMA Type 4X requirements
when mounted in a panel and gasketed in place with an Invensys Process Systems (IPS) supplied
gasket. The pipe and surface mounted versions are dusttight and weatherproof, as defined by
IEC IP65, and provide the environmental and corrosion resistant protection of NEMA Type 4X.
The 875PH Analyzers are also designed to meet the electrical safety requirements of major testing
laboratories.
The integral display consists of 240 x 128 pixel backlighted Liquid Crystal Display (LCD).
Various combinations of pixels create the text and symbols for the entire front panel operating
modes.
! WARNING
If your analyzer is used in a manner not specified by IPS, the fire and electrical shock
protection provided by the analyzer may be impaired.
Reference Documents
The following documents provide additional and related information.
Document(a)
DP 611-164
MI 611-206
MI 611-208(b)
MI 611-226
PL 611-163
Description
Dimensional Print - 875 Electrochemical Analyzers
FM, CSA, and IEC Intrinsically Safe Connector Diagrams and
Nonincendive Circuits
Electrochemical Products Safety Information (for European
installations)
Instruction - 875 Remote Communication Program
Parts List - 875PH Electrochemical Analyzers
(a)Documents are available on line at www.ips.invensys.com (pull down Products menu and select
Measurement & Instruments, then Analytical, then pH and ORP, then
Documentation, then Specs, Instructions, Drawings, Parts).
(b)Available in many languages on line at www.ips.invensys.com (pull down Products menu and
select Measurement & Instruments, then Downloads, then Safety Instructions for
Analytical).
Factory Default Passcode
The factory default passcode for all three levels of passcode is 0800.
1
MI 611-225 – August 2009
2
1. Introduction
2. Quick Start
The purpose of this section is to:
♦
Help you to wire your analyzer
♦
Familiarize you with the instrument configuration as received from the factory
♦
Explain normal operation in Measure mode.
Wiring
Connections to your 875PH panel mounted instrument are located on the rear of the housing;
those of your pipe or surface mounted instrument are located in the lower compartment. Access
to the connection terminals are via openings in the bottom of the enclosure. Make your sensor
connections to the top terminal strip and ac power, analog output, alarm output, and digital I/O
connections to the lower terminal strip per Figure 1.
! WARNING
Wiring installation must comply with any existing local regulations.
! CAUTION
Your analyzer was made to accept a certain supply voltage. Check the data plate on the
transmitter cover for correct supply voltage before wiring.
NOTE
DIGITAL INPUTS & PWR DIGITAL COMM
G
8
N
L
1NO
NOT USED
DIAGNOSTIC
1C
2NO
ANALOG OUTPUTS ALARM 2
1NC
7
2NC
2C
MA2–
SENSOR POWER +
SENSOR POWER –
6
5A
MA2+
REF. ELECTRODE
SCREEN (SHIELD)
5
REFERENCE
ELECTRODE
MA1–
MA1+
4
SOLUTION EARTH
(GROUND)
RS-232
3A
MEAS SCREEN
(SHIELD)
COM1
COM3
COM2
MEAS ELECTRODE
3
2A
COM4
RTD 3-WIRE
2
DV–
DV+
DI 4
DI 3
DI 2
DI1
RTD RETURN
RTD DRIVE
1
Refer to MI 611-206 for FM, CSA, and IEC wiring requirements.
Refer to MI 611-208 for European (ATEX) safety information
ALARM 1 POWER GRD
Figure 1. Wiring Connections (Style B)
3
MI 611-225 – August 2009
2. Quick Start
NOTE
1. The ground connection on Style B panel mounted analyzers is located as shown
above. The ground connection on Style B field mounted analyzers is on a case
boss just below the power connections.
2. The ground connection for Style A analyzers is shown in Figure 7.
4
2. Quick Start
MI 611-225 – August 2009
Checking Factory Configuration
Following the structure diagrams in Appendix A and using the arrow keys, you can step through
the product structure as configured in the factory. The factory default values are listed in
Appendix B. In the table that comprises Appendix B, there is a column provided to make any
notations you wish about your specific configuration.
NOTE
The factory default passcode for all three levels of passcode is 0800.
Calibration
After wiring your analyzer and checking/changing the configuration, you should perform a
Manual 2 Point or Smart Cal calibration. To enter the Calibration mode, press the Mode key
until the Cal indicator is illuminated. Press Enter. At the prompt, enter the passcode and press
Enter. Next, enter the calibrator’s name and press Enter. The analyzer displays Solution, the first
category in the top level calibration structure. Press Enter. Use the Down arrow key to select
Manual 2 Point or Smart Cal and press Enter. Follow the prompts to calibrate your analyzer.
Basic Operation in Measure Mode
Measure is the normal operating mode of your analyzer. It is indicated by an illuminated
Measure indicator. When the display is configured for single line measurements or scanning
measurements, the measurement title, value, and unit are displayed. For single line measurements,
a bar graph showing the percentage of a configured measurement range is also displayed. When
configured for dual line measurements, the measurement title, value, and unit for each line is
displayed. A bar graph showing the percentage of the Line 1 configured measurement range is also
displayed. Any measurement can be temporarily scrolled onto the display by using the Up and
Down arrow keys. These user-selected measurements show the measurement title, units, and
value. During the display of these user-selected measurements, the bar graph is inactive. You can
return to the configured selection by using the Up and Down arrow keys. The display
automatically returns to the configured selection when the configured Timeout time is reached.
Fault messages are also shown on your display while in the Measure mode. Alarm status is shown
by two alarm indicators.
Looking for More Information?
For more detailed information, refer to the following sections of this manual:
♦
For installation information, refer to “Installation” on page 11.
♦
For detailed explanation of the controls and indicators, refer to “Controls and
Indicators” on page 21.
♦
For detailed configuration instructions, refer to “Configuration Mode” on page 41.
♦
For detailed calibration instructions, refer to “Calibration Mode” on page 34.
For dimensional information, refer to DP 611-164.
5
MI 611-225 – August 2009
2. Quick Start
If you need additional help, contact the IPS Global Client Support Center at 1-866-746-6477 or
contact your local IPS representative.
6
3. Specifications
Operating, Storage, and Transportation Conditions
Table 1. Operating, Storage, and Transportation Conditions
Influence
Reference
Operating
Conditions
Normal Operating
Condition Limits
Operative Limits
Storage and
Transportation
Limits
Ambient
Temperature
23±2°C
(73±4°F)
-10 and +65°C
(-14 and +149°F)
-20 and +75°C
-4 and +85°C
(-4 and +167°F) (a) (-4 and +185°F)
Relative
Humidity
50±10%
5 and 95%
Noncondensing
5 and 95%
Noncondensing
5 and 95%
Noncondensing
Supply
Voltage
Rated Voltage (b)
±1%
Rated Voltage (b)
-15 and +10%
Rated Voltage (b)
-20 and +15%
Not Applicable
Supply
Frequency
50 or 60 Hz, ±1% 50 or 60 Hz, ±3%
50 or 60 Hz, ±3%
Not Applicable
Vibration
Field Mount
Panel Mount
Mounting
Position
Note (c)
1 “g” (10 m/s2) between a frequency or 5 and 200 Hz
0.25 “g” (2.5 m/s2) between a frequency or 5 and 200 Hz
Generally Upright
Any Position
Any Position
Not Applicable
(a)-20 and +60°C (-4 and +140°F) for analyzers with ATEX and IEC certification
(b)Rated voltage is 24, 100, 120, 220, or 240, V ac or 24 V dc.
(c)During transportation, the packaged analyzer can withstand normal shipping and handling conditions
without damage.
Functional and Physical Specifications
Supported Sensors:
Full Compatibility: PH10; ORP10; 871A-1, -3, -4; 871PH-3, -4, -5, -6; All EP460 Series
Compatibility Less Full Diagnostic Suite: 871A-2; 871PH-1, -2
Compatibility With Non-Foxboro Sensors:
The 875PH Analyzer is also compatible with non-Foxboro sensors without integral
preamplifiers and with compatible temperature sensing elements. Contact IPS for more
specific information.
Minimum Output Span: 5% of full scale
Maximum Output Span: 500% of full scale
7
MI 611-225 – August 2009
3. Specifications
Isolated Output Load: 800 ohms maximum
Temperature Compensation Inputs:
100 ohm platinum RTD (2- or 3-wire)
1000 ohm platinum RTD (2- or 3-wire)
3000 ohm Balco RTD (2-wire)
Power Consumption: 17 Watts maximum
Alarm Contacts: Form C rated 5 A at 250 V ac, 2 A at 30 V dc, noninductive. The ATEX and
IEC limits are 5 A at 160 V ac and 2 A at 30 V dc.
Digital Inputs/Outputs
Terminal DV+ Power: 4.5 V ±3% at 10 mA maximum (provided by the analyzer)
Terminal DV- Power: -20 V +1% at 10 mA maximum (provided by the analyzer)
Inputs DI1 - DI4 (only used with the +4.5 V/-20 V outputs provided by the analyzer):
High Logic: User must ensure voltage to be between 2.7 and 10 V
Low Logic: User must ensure circuit to be open or less than 0.8 V
Data Storage:
Configuration, calibration, and operating parameters are stored in nonvolatile memory
for >5 years.
Remote Configuration:
Via RS-232 communication. The interface contains three signal lines (RXD, TXD,
GND). The cable, connecting the computer to the analyzer, that is part of the optional
configurator utility kit is 3 m (10 ft). This distance can be extended to 15 m (50 ft) with
an extension cable. It can be further extended with the use of a user-supplied modem.
Optional Digital Communication Interfaces: HART
Maximum Distance Between Sensor and Analyzer:
150 m (500 ft) with preamplifier
15 m (50 ft) without preamplifier
Mounting: Panel, pipe, or surface mounting per model code
Enclosure:
Panel Mounting: The basic housing meets NEMA 1 requirements for general purpose,
indoor applications. However, when installed in a panel and gasketed in place, the front
surface provides the environmental and corrosion resistant protection of NEMA Type 4X,
CSA Enclosure 4X, and IEC IP65.
Field (pipe or surface) Mounting: The enclosure provides the environmental and
corrosion resistant protection of NEMA Type 4X, CSA Enclosure 4X, and IEC IP65.
Weight (approximate):
Panel Mounted: 1.8 kg (4 lb)
Pipe or Surface Mounted: 3.3 kg (7.3 lb)
European Union and International Directives:
8
3. Specifications
MI 611-225 – August 2009
Complies with the Electromagnetic Compatibility Requirements of European EMC
Directive 89/336/EEC by conforming to the CENELEC and IEC Standards as follows:
♦
Field Mount: EN50081-2 and EN50082-2. Also complies with NAMUR Part 1
Interference Immunity Requirement (Germany version of EN50081-2 and
EN50082-2)
♦
Panel Mount: EN61326, ANNEX A.
Both Field Mounted and Panel Mounted analyzers comply and conform to Applicable
European Union Directives (“CE” marking on product).
Pollution Degree: Degree 2 per ANSI/ISA S82.01
Installation Category: Category III per ANSI/ISA S82.01
Product Safety:
The 875 Analyzer has been designed to meet electrical safety descriptions listed in
Table 2. For detailed information, or status of testing laboratory approvals/certifications,
contact IPS.
Table 2. Product Safety Specifications
Testing Laboratory,
Types of Protection, and Area Classification
CSA Ordinary locations.
CSA for Class I, Division 2, Groups A, B, C,
and D; Class II, Division 2, Groups F and G;
and Class III, Division 2 hazardous locations
Application Conditions
For panel mounted units, see note (a).
Temperature Class T4.
For CSA loop certified non-incendive
circuits, see MI 611-206.
For panel mounted units, see note (a).
FM Ordinary locations.
For panel mounted units, see note (a).
FM nonincendive for Class I, Division 2,
Temperature Class T4.
Groups A, B, C, and D; Class II, Division 2, For panel mounted units, see note (a).
Groups F and G; and Class III, Division 2
hazardous locations
Temperature Class T4 at maximum
ATEX Ex protection ‘n’ for Zone 2;
(b)
ambient temperature of 60°C (140°F).
II 3 G EEx nC[L] IIC.
See certificate KEMA 02ATEX1329 X
IECEx protection ‘n’ for Zone 2;
Temperature Class T4 at maximum
Ex nA nL nC [nL] IIC
ambient temperature of 60°C (140°F).
UL Ordinary locations
---
Electrical
Safety
Design Code
C
F
N
D
U
(a)Panel-mounted unit must be installed as follows:
For Ordinary and Class I, Division 2 locations: install in a protective enclosure to prevent access to live parts.
For Class II and Class III Division 2 locations: install in a dusttight enclosure.
(b) The L means that the unit contains energy limited circuits to the sensor.
9
MI 611-225 – August 2009
10
3. Specifications
4. Installation
Unpacking
1. Remove the analyzer from the shipping container and check for visible damage.
2. Save the container until you determine that no shipping damage has occurred.
3. If the analyzer has been damaged, notify the carrier immediately and request an
inspection report. Obtain a signed copy of the report from the carrier and call the IPS
Global Client Support Center at 1-866-746-6477 or contact your local IPS
representative.
Identification
A data label, fastened to the top surface of the enclosure on panel-mounted devices and to the
right side on surface- or pipe-mounted devices, provides the model number and other
information. A second data label, fastened to the right side surface, provides configuration
information pertinent to your particular analyzer. In addition, an agency label, showing electrical
certification information, is located on the top surface of the enclosure on panel-mounted devices
and to the left side on surface- or pipe-mounted devices.
MODEL
STYLE
875PH-A1F-A
CB
070022EP481033
SERIAL No.
S.O. No.
137862F40
ORIGIN
2B0641
SUPPLY VOLTAGE
120 VAC
MAXIMUM POWER 17 Watts
MAXIMUM VA
18 @ 60 HZ
25 @ 50 HZ
MODEL
STYLE (HARDWARE, FIRMWARE)
SERIAL NUMBER
SALES NO. (IF APPLICABLE)
DATE AND PLANT OF MANUFACTURE
SUPPLY VOLTAGE
MAXIMUM POWER
POWER CONSUMPTION
ALARM CONTACTS 5 A @ 250 V ac
2 A @ 30 V dc
ALARM CONTACTS
ANALOG OUTPUTS
S 4 to 20 mA
LOCAL COM PORT RS-232C
ANALOG OUTPUTS
COMMUNICATIONS
Figure 2. Sample Information Data Label
11
MI 611-225 – August 2009
4. Installation
Meas.
Range
0-14 PH
Temp.
Comp.
1000 OHM 3WIRE RTD
Optional
Com Port
Customer
Data
NONE
Figure 3. Sample Configuration Data Label
Mounting
Panel Mounting
Panel mounting of the analyzer is shown in Figure 4. For panel cutout size, space requirements,
and other dimensional data, see DP 611-164. Place the analyzer into the panel cutout from the
front side and fasten it to the panel with appropriate hardware via the four holes in the corners of
the analyzer bezel. The basic enclosure of the panel-mounted analyzer meets NEMA 1
requirements for general purpose, indoor applications. However, when mounted in a panel and
gasketed in place with the IPS supplied gasket, the front surface provides the environmental and
corrosion resistant protection of NEMA Type 4X, CSA encl. 4X, and IEC IP65.
! WARNING
1. All wiring connections are located on the rear of the analyzer enclosure. Therefore,
to meet electrical safety specifications, the analyzer must be installed in a protective
enclosure to prevent accessibility to live parts. For Class II and Class III, Division 2
locations, the analyzer must be installed in a dusttight protective enclosure.
2. Further, to meet CE requirements, a grounded metal enclosure is required. To
assure a good ground, the edges of the panel opening that receives the analyzer must
not be painted.
WASHER
SCREW
LOCKWASHER
ANALYZER
PANEL
NYLON WASHER
NUT
Figure 4. Panel Mounting
12
4. Installation
MI 611-225 – August 2009
Surface Mounting
Surface mounting of the field-mounted analyzer is shown in Figure 5. Fasten the mounting
bracket to the analyzer using the screws, washers, and lockwashers provided. Then, fasten the
mounting bracket to your surface using appropriate hardware. For space requirements and other
dimensional data, see DP 611-164. The field-mounted enclosure provides the environmental and
corrosion-resistant protection of NEMA Type 4X, CSA encl. 4X, and IEC IP65.
LOCKWASHER
MOUNTING BRACKET
ANALYZER
SURFACE
CAP SCREW
WASHER
Figure 5. Surface Mounting
Pipe Mounting
Pipe mounting of the field-mounted analyzer is shown in Figure 6. Fasten the mounting bracket
to the analyzer using the screws, washers, and lockwashers provided. Then, fasten the mounting
bracket to a DN50 or 2-inch pipe using the hardware provided. For space requirements and other
dimensional data, see DP 611-164. The field-mounted enclosure provides the environmental and
corrosion-resistant protection of NEMA Type 4X, CSA encl. 4X, and IEC IP65.
BRACKET
ANALYZER
LOCKWASHER
PIPE
CAP SCREW
WASHER
U-BOLT
NUT
LOCKWASHER
Figure 6. Pipe Mounting (Vertical Pipe Mounting Shown)
13
MI 611-225 – August 2009
4. Installation
Wiring
! WARNING
Wiring must comply with any existing local regulations. To meet CE requirements,
this must include a switch or circuit breaker, marked as a disconnecting device, and
located in close proximity to the analyzer and within easy reach of the operator.
! CAUTION
Your analyzer was made to accept a certain supply voltage. Check the data plate on
the transmitter cover for correct supply voltage before wiring.
NOTE
1. To meet CE requirements:
a. The ac cable must be routed away from all other I/O wiring, especially the
sensor cable.
b. All wiring must be enclosed in grounded metal conduit.
2. Refer to MI 611-206 for FM, CSA, and IEC wiring requirements.
Refer to MI 611-208 for European (ATEX) safety information
The distance between your analyzer and sensor should be no more than 15 m (50 ft) without a
preamplifier or 150 m (500 ft) with a preamplifier. If a preamplifier is not used, the signal quality
deteriorates with this distance. A preamplifier is recommended for lengths over 6 m (20 ft).
Panel-Mounted Analyzer
If you have a panel-mounted analyzer, make your wiring connections directly to the terminals on
the rear of the housing. Terminal identifications are shown in Figure 7 and described in Table 4.
Pipe- or Surface-Mounted Analyzer
If you have a pipe- or surface-mounted analyzer, the wiring connections are located in the lower
compartment of the housing. They are accessible via three openings on the bottom of this
compartment. There are also two knockouts for additional field wiring entrance. To remove the
knockouts:
1. Perform this procedure with the lower compartment cover in place to give the
enclosure extra support.
2. Place a screwdriver blade in the ridge of the knockout.
3. Rap the screwdriver sharply with a hammer until the knockout begins to give way.
4. Repeat Steps 2 and 3 around the circumference of the knockout until the knockout
falls out.
To wire your pipe- or surface-mounted analyzer:
1. Remove the lower housing compartment cover by removing the four screws securing it
in place.
2. Remove the plastic shipping caps from the three openings on the bottom of the
housing and replace with proper fittings.
14
4. Installation
MI 611-225 – August 2009
! CAUTION
1. To maintain a rating of NEMA 4X, CSA encl. 4X, or IEC IP65, open ports must
be sealed and instrument covers secured. Also, wiring methods, conduit, and fittings
appropriate to the ratings must be used. Table 3 identifies recommended parts.
2. To minimize RFI/EMI effect, use grounded metal conduit on sensor cable and
input power leads.
Table 3. Recommended Conduit and Fittings
Material
Conduit
Rigid Metal
Semi-Rigid Plastic
1/2 inch Electrical Trade Size
T&B #LTC 050
Semi-Rigid Plastic
Metal Core
Flexible Plastic
Anaconda Type HV, 1/2 inch
T&B #EFC 050
Fitting
T&B* #370
T&B #LT 50P or
T&B #5362
T&B #LT 50P or
T&B #5362
T&B #LT 50P or
T&B #5362
*T&B = Thomas & Betts Corp., 1001 Frontier Road, Bridgewater, NJ 08807
3. Bring the wires from your input (ac) power in the right opening and connect to
terminals at the right end of the bottom terminal strip as shown in Figure 7 and
described in Table 4.
NOTE
To meet CE requirements, the ac cable must be routed away from all other I/O
wiring, especially the sensor cable.
4. Bring all other wiring (except sensor cable) in the middle opening and connect to
appropriate terminals on the bottom terminal strip as shown in Figure 7 and
described in Table 4.
5. Bring the sensor cable in the left opening and connect to the appropriate terminals on
the top terminal strip as shown in Figure 7 and described in Table 4. If you are using
manual temperature compensation and are not wiring a temperature measuring
device, short terminals 1, 2, and 2A to minimize noise.
6. Connect the remote communications using the RS-232 modular phone plug.
Wiring Connections
NOTE
Connect all cables with user supplied strain relief to prevent excess strain on the
terminals.
15
DIGITAL INPUTS & PWR DIGITAL COMM
G
8
N
L
1NO
1C
NOT USED
DIAGNOSTIC
ANALOG OUTPUTS ALARM 2
1NC
7
2NO
2NC
2C
SENSOR POWER +
SENSOR POWER –
6
5A
MA2–
MA2+
REF. ELECTRODE
SCREEN (SHIELD)
5
MA1–
REFERENCE
ELECTRODE
MA1+
4
SOLUTION EARTH
(GROUND)
RS-232
3A
MEAS SCREEN
(SHIELD)
COM1+
COM3
COM2–
MEAS ELECTRODE
3
2A
COM4
RTD 3-WIRE
2
DV–
DV+
RTD RETURN
DI 4
DI 3
DI 2
DI1
4. Installation
RTD DRIVE
1
MI 611-225 – August 2009
ALARM 1 POWER GRD
Figure 7. Wiring Connections for 875PH Analyzer
NOTE
The ground connection on panel mounted analyzers is located as shown in
Figure 7. The connection on field mounted analyzers is on a case boss just below
the power connections.
Table 4. Terminal Identification
Terminal Designation
Description
Sensor Connections
1
RTD Return
2
RTD Drive
2A
RTD 3-Wire
3
Measurement Electrode
3A
Measurement Screen (Shield)
4
Solution Earth (Ground)
5
Reference Electrode
5A
Ref. Electrode Screen (Shield)
6
Sensor Power (+)
7
Sensor Power (-)
8
Diagnostic
G
Not Used
Digital, Analog, Alarm, and Power Connections
DI1
Digital Input for Auto Service 1
DI2
Digital Input for Auto Service 2
DI3
Digital Input for Signaled Hold
DI4
Not used
16
4. Installation
MI 611-225 – August 2009
Table 4. Terminal Identification (Continued)
Terminal Designation
COM1, 2
COM3, 4
RS-232
MA1+, MA1–
MA2+, MA2–
1C, 1NC, 1NO
2C, 2NC, 2NO
L
N
G
Description
HART I/O Communication
Not Used
Remote Communication (see MI 611-226)
Analog Output 1
Analog Output 2(a)
Alarm 1
Alarm 2
Power, Line (Black)
Power, Neutral (White)
Power, Ground (Green)
(a) Not used when HART I/O communication is employed
Digital Input Wiring
The 875PH Analyzer has three digital inputs. Digital input DI1 and DI2 are used to activate the
Auto Service 1 and Auto Service 2 functions respectively. Digital input DI3 is used to activate the
Signaled Hold function. Digital input DI4 is not used. For configuration information on these
functions, see “Auto Service 1 and Auto Service 2” on page 50 and “Signaled Hold” on page 52.
The voltage to set a digital input high is supplied by the analyzer from terminal DV+. The digital
input is activated by closure of a switch that is supplied by the user. If the switch is closed, the
digital input voltage is high and if the switch is open, the digital input voltage is low.
! CAUTION
Digital inputs are only to be used with the voltage outputs provided by the analyzer.
The following figures show the most likely wiring connections to the 875 digital input interface.
FIELD LOGIC INPUT
DV+ FROM 875
TO 875 DIG INPUTS DI1 - DI3
FIELD LOGIC INPUT
DV- FROM 875
Figure 8. Optically Isolated Interface 24 V dc, FET Output PLC
17
MI 611-225 – August 2009
4. Installation
DV+ FROM 875
FIELD LOGIC INPUT
TO 875 FROM DIG INPUTS DI1 - DI3
FIELD LOGIC INPUT
Figure 9. Optical Isolated Analog Switch
FIELD LOGIC INPUT
FIELD LOGIC INPUT
DV+ FROM 875
TO 875 DIG INPUTS DI1 - DI3
Figure 10. Electromechanical Relay Interface
HART I/O Communication Wiring
If HART Communication (Option -C) is installed, connect your HART loop to the COM1(+)
and COM2(-) terminals of the analyzer. See Figure 7. There must be a minimum 250 ohm load
in the loop. Therefore, if you are configuring the analyzer on the bench (no loop load) with a
HART communicator, you must add a 250 Ω resistor.
Analog Output Wiring
There are two analog (4 to 20 mA) outputs in the analyzer. Connect the Analog 1 output at the
MA1+ and MA1- terminals of the analyzer. Connect the Analog 2 output at the MA2+ and MA2terminals of the analyzer. See Figure 7. Analog 2 is not used when HART I/O communication is
employed.
18
4. Installation
MI 611-225 – August 2009
Alarm Wiring
You can wire an external device (for example a light bulb or horn) to the analyzer. Each alarm
relay provides a contact closure which can be used as a switch to turn the external device on or off.
The way you wire the external device to the analyzer must be done in conjunction with the way
you configure the alarm Trip State (see page 54).
NOTE
Alarm contacts are Form C rated 5 A at 250 V ac, 2 A at 30 V dc, noninductive.
The ATEX and IEC limits are 5 A at 160 V ac and 2 A at 30 V dc.
Energized Trip State
NONALARM CONDITION
ALARM CONDITION
NO
NO
C
C
NC
NC
Figure 11. Alarm Wiring in Energized Trip State
De-energized Trip State
ALARM CONDITION
OR LOSS OF POWER
NONALARM CONDITION
NO
NO
C
C
NC
NC
Figure 12. Alarm Wiring in De-energized Trip State
19
MI 611-225 – August 2009
20
4. Installation
5. Operation Via Local Display
Controls and Indicators
Operator controls and indicators are located on the front panel. Figure 13 shows the panel
arrangement. Table 5 identifies the function of each element.
MEASURE STATUS
HOLD
CONFIG
CAL
MODE
INDICATORS
DIAG
BAR GRAPH
LINE 1
MEASUREMENT
DISPLAY AREA
Alarm 1
9.00 pH
25.00 °C
LINE 2
TEMPERATURE
Alarm 2
ALARM
INDICATOR
YES
MODE KEY
ARROW KEYS
MODE
SP1
SP2
ENTER
ENTER KEY
NO
Figure 13. Indicators and Controls
Table 5. Indicators and Controls
Control/Indicator
Mode Indicators
Display Area
Bar graph
Line 1
Line 2
Alarm Indicators
Mode Key
Function
The current operating mode indicator is illuminated. While Hold is active,
the Hold indicator blinks.
The display is a graphic panel that shows information in combinations of
artwork and text.
Displays percent of configured range of the Line 1 value on the display.
Displays configured measurements.
Displays configured measurements.
Alarm 1 (Alarm 2) indicator is illuminated when Alarm 1 (Alarm 2) is
active.
Each press of the Mode key selects the next operating mode (Measure,
Status, Hold, Configure, Calibrate, and Diagnostic).
21
MI 611-225 – August 2009
5. Operation Via Local Display
Table 5. Indicators and Controls (Continued)
Control/Indicator
Function
Right Arrow Key
Moves you forward through the menu structure.
Shifts the cursor to the right in a data entry field.
In Measure mode, this key enables you to directly access the menu to change
the set point for Alarm 2 (if configured as a setpoint alarm).
Moves you backward through the menu structure.
Shifts the cursor to the left in a data entry field.
In Measure mode, this key enables you to directly access the menu to change
the set point for Alarm 1 (if configured as a setpoint alarm).
Increments a numeric value or character when you are in a data entry field.
Shifts the items down when you are in a picklist menu.
Answers Yes to a question.
Decrements a numeric value or character when you are in a data entry field.
Shifts the items up when you are in a picklist menu.
Answers No to a question.
Enters and saves the changed menu picklist choices or numeric value or
character data entry.
Left Arrow Key
Up Arrow Key
Down Arrow Key
Enter Key
Display
The display is a 240 x 128 pixel dot-matrix LCD. It is backlighted for viewing under low light
conditions.
Dual Measurement Screen
This screen is displayed in Measure mode when the analyzer is configured for dual line
measurements.
MEASURE
STATUS
HOLD
CONFIG
CAL
DIAG
MODE INDICATOR
BAR GRAPH
Measurement
8.00
25.00 °C
pH
Temperature
}
}
LINE 1 MEASUREMENT
TITLE, VALUE, AND UNITS
LINE 2 MEASUREMENT
TITLE, VALUE, AND UNITS
Figure 14. Sample Dual Measurement Screen
22
5. Operation Via Local Display
MI 611-225 – August 2009
Single Measurement Screen
This screen is displayed in Measure mode when the analyzer is configured for single line
measurements, scanning measurements, or user selectable measurements.
MEASURE STATUS
HOLD
CONFIG
Measurement
CAL DIAG
MODE INDICATOR
MEASUREMENT TITLE
BAR GRAPH
8.00
pH
MEASUREMENT VALUE
MEASUREMENT UNITS
Figure 15. Sample Single Measurement Screen
Fault Messages
While you are in Measure mode, the display alternates between the Measurement screen and the
Fault screen when a fault is occurring. In the case of multiple faults, the fault with the highest
severity is shown. In general, you can enter the Diagnostic mode to obtain more detail about the
fault and receive guidance on how to correct the problem. Fault types are summarized below.
NOTE
Some diagnostic conditions must be configured “enabled” for a fault message to be
displayed.
Sensor Fault
Sensor Fault is displayed in Measure mode (if the diagnostic is enabled) when a Leakage, ATC
Short, ATC Open, Glass, Low Slope, Preamp, Aging, or Coat fault is present. The analyzer
is still configurable. For ATC Short or ATC Open faults, measurements are held at the
configured value.
Configuration Fault
Configuration Fault is displayed in Measure mode (if the diagnostic is enabled) when the
current loop output (4-20 Range), the temperature compensation (Comp Range), or the
display line measurement (Meas Range) exceeds the upper or lower bound for the configured
range.
Analyzer Fault
Analyzer Fault, which is displayed in Measure mode, indicates an analyzer fault. Depending on
the severity of the problem, the analyzer may still be configurable and analog measurements held
at the fail-safe value if so configured.
23
MI 611-225 – August 2009
5. Operation Via Local Display
Digital Fault
Digital Fault is displayed in Measure mode when a digital communication problem occurs.
Slope Error
Slope Error is displayed in Configuration mode when errors made during the entry of custom
tables cause an invalid slope.
Table Entry Error
Table Entry Error is displayed in Configuration mode when errors are made during entry of
custom tables, such as not having at least one custom point high enough in the range.
Passcode Access
Analyzer security is provided by the use of passcodes through the front panel, remote control, or
digital communication interfaces. The passcodes for three levels of security can be established in
Configuration mode by users having access to Level 1. Table 6 defines passcode access to the
different features of the analyzer.
The legend for the table is V = View and X = View and/or change.
NOTE
1. Passcode Levels 2 and 3, while less complete that Level 1, are simpler to use
because there are fewer selections to step through in the menu trees.
2. The factory default pass code for all three levels is 0800.
Table 6. Passcode Access
Feature
Measurement Mode
Measurement
Status Mode
Status
Hold Mode
Off
On Present
On Manual
Configuration Mode
Measurement
Meas Units - Custom
Sensor
Tempcomp
Custom
24
No Passcode
Level 3
Level 2
Level 1
V
V
V
V
V
V
V
V
X
X
X
X
X
X
X
X
X
V
V
V
V
V
V
X
V
X
X
V
X
X
X
X
X
5. Operation Via Local Display
MI 611-225 – August 2009
Table 6. Passcode Access (Continued)
Feature
Display
Analog
HART
Diagnostics
Autoservice
Signaled Hold
Alarm
Remote
Cal Parameters
Automatic Hold
Timeouts
Date and Time
Analyzer Names
Passcodes
LCD Adjustment
Factory Defaults
Calibration
Solution
Bench
Analog
Auto Service
Diagnostics
View Faults
View History
Erase History
Demand Report
No Passcode
Level 3
Level 2
Level 1
V
V
V
V
V
V
X
X
X
V
V
V
X
V
V
V
V
V
V
V
V
X
X
X
X
X
X
X
X
X
X
X
X
X
X
X
X
X
X
X
V
X
X
X
X
V
V
V
V
X
X
V
V
X
X
V
V
Any time a passcode is required, the display shows Passcode 0000. Use the arrow keys to enter
your passcode. When the proper digits are shown, press the Enter key.
The passcode access expires when you change to another mode.
Viewing and Changing Data
In the Status, Hold, Calibration, Configuration, and Diagnostic modes, you need to move
through a structure of parameters (using the arrow keys and Enter key) to view (and in some
modes, to change) the value or status of a particular parameter. To aid you in configuration,
structure diagrams are provided in the following sections and in Appendix A.
25
MI 611-225 – August 2009
5. Operation Via Local Display
Note that the Up and Down arrow keys scroll through a picklist menu in either direction. Also,
note that the arrow keys can be used to increment one position at a time, or advance continuously
through a menu or string of values by holding the key in the depressed position.
The following example shows how to use the keys to move through the structure, make a picklist
selection and a numeric entry. The example used is that of configuring temperature features in
Configuration mode. For the example, assume a glass electrode, a 3-wire, 1000 ohm RTD,
Fahrenheit temperature units, an automatic temperature mode, and a fail-safe signal value of 77 °F.
In following the procedure, refer to Figure 16.
Electrode
Glass
Antimony
Other
E
Temp Type
RTD
BALCO
Temp Unit
Celsius
Fahrenheit
E
RTD Type
E
2 Wire 100Ω
2 Wire 1000Ω
3 Wire 100Ω
3 Wire 1000Ω
E
Temp Mode
Automatic
Manual
E
Fail Signal
E
Manual
Figure 16. Example of Structure Diagram
1. In the Electrode menu, use the Down arrow key to select Glass if it is not already
showing. Press Enter. The display moves to Temp Type.
2. Use the Down arrow key to select RTD if it is not already showing. Press Enter. The
display moves to RTD Type.
3. Use the Down arrow key to move to 3 Wire 1000Ω. Press Enter. This enters your
RTD selection and moves the display to Temp Unit.
4. Use the Down arrow key to move to Fahrenheit and press Enter. This enters your
Fahrenheit selection and moves the display to Temp Mode. Every temperature entry
in the analyzer is now in Fahrenheit units.
5. Use the Down arrow key to select Automatic if it is not already showing. Press Enter.
This enters your automatic temperature mode selection and moves the display to Fail
Signal. 000.0. The tenths digit blinks.
6. Because you do not need to change the tenths digit, use the Left arrow key to move to
the units digit. Use the Up arrow key to change this digit to 7.
7. Use the Left arrow key to move to the tens digit and the Up arrow key to change this
digit to 7. You have now achieved your goal of setting the value to 77.0, so press
Enter. This enters your value of 77. This completes the example.
NOTE
In most situations, repeatedly pressing the Left arrow key returns you to previous
menus. However, the Left arrow key becomes inoperative for this purpose when you
are entering numerical values.
26
5. Operation Via Local Display
MI 611-225 – August 2009
Accessing Operating Modes
The operating mode is selected by pressing the Mode key on the front panel. Each press of the
key selects the next operating mode in sequence. See Figure 17. When you reach the desired
mode, press Enter.
MEASURE
STATUS
HOLD
CONFIGURE
CALIBRATE
DIAG
Figure 17. Mode Key Operation
Measure Mode
Measure is the normal operating mode of your analyzer. The analyzer powers up in Measure
mode. If another mode is active and you want to go to Measure mode, press the Mode key until
the Measure indicator is illuminated.
Measurements are user configured to display the pH, ORP or ISE measurement, the process
temperature, the absolute millivolt signal, or the analog output value.
Measure mode uses one of four display screen presentations: Single, Dual, Scan, or User Selected.
The first three are set in Configure mode. User Selected is enabled by the Up and Down arrow
keys. See Figure 18.
♦
Single: The measurement title, value, and unit are displayed. The bar graph shows
the value’s percentage of full scale.
♦
Dual: Two measurement titles, values, and units are displayed. The bar graph shows
the first line’s percentage of full scale.
♦
Scan: Several measurements can be selected to alternate on the display in a
designated scan time. When in Scan mode, the bar graph is inactive.
♦
User Selected: Any measurement can be temporarily scrolled onto the display by
using the Up and Down arrow keys. The display shows the measurement title, value,
and unit. The bar graph is inactive. The display returns to the configured values when
you press the Mode key or when the Timeout period expires.
Diagnostics are run continuously in Measure mode. If a fault occurs, the display alternates
between the Measurement display and a fault display. In the case of multiple faults, the fault with
the highest severity is shown. You can then enter the Diagnostic mode to obtain more detail about
the fault and receive guidance on how to correct the problem. The alarm and analog outputs also
indicate a fault if so configured. If an alarm is based on an fault, suspending the fault in
Diagnostic mode does not affect the alarm operation.
27
MI 611-225 – August 2009
5. Operation Via Local Display
MEASURE
(Default Screen)
Measurement
Absolute
Temperature
Analog 1
Analog 2
(or HART
if installed)
Figure 18. Measure Mode Structure Diagram
You can also view analyzer measurement data on a personal computer by using the Hyperterminal
accessory. To do this, connect the RS-232 port on your analyzer to a serial port on your computer.
Make sure the port settings on your computer match those on your analyzer. See “Remote” on
page 54.
28
5. Operation Via Local Display
MI 611-225 – August 2009
Status Mode
Refer to Figure 20 on page 31.
The Status mode enables you to view the measurement and system parameters and thus assess the
performance of the loop. You can not edit them in this mode. All measurements and outputs
continue while you are in the Status mode.
MEASURE STATUS
HOLD
CONFIG
CAL
MODE INDICATOR
DIAG
Status Mode. Use the Up/Down arrows to scroll
through list. Mode returns to Measure
HELP MESSAGE
Temperature
25.0 °C
PARAMETER
CURRENT STATUS
Figure 19. Sample Status Screen
To enter the Status mode, press the Mode key until the Status indicator is illuminated. Press
Enter. Move through the menu by using the Up and Down arrow keys. See Figure 20 on
page 31. The display returns to Measure mode when you press the Mode key or when the
Timeout period expires. The Status menu contains the following parameters:
Table 7. Status Parameters
Parameter
Temperature
Absolute
ATC Resistance
Slope %
Slope mV
Asymmetry
Preamplifier
Cal Person
Cal Date
Description
Process temperature of sensor
Uncompensated measurement
signal from sensor
Resistance of temperature
compensator
Deviation in percent of the slope of
the most recent calibration
compared to the standard
Change in mV/pH or mV/decade
of the most recent calibration
Asymmetry potential (mV
difference between the theoretical
isopotential point and the actual
point due to the most recent
calibration)
Preamplifier power
Name of last calibrator
Date of last calibration
(mm/dd/yyyy)
Units
Notes
Temp Unit
Meas Unit
Ω, kΩ
%
mV/pH,
mV/decade
mV
If pH or ISE
If not ORP
mW
-----
29
MI 611-225 – August 2009
5. Operation Via Local Display
Table 7. Status Parameters (Continued)
Parameter
Cal Type
Description
Type of last calibration (solution,
factory default, or bench)
Cal Temperature
Temperature calibration type of last
calibration (default, custom,
solution, failsafe, manual)
Cal Point One
Values at Calibration Point One
Cal Point Two
Values at Calibration Point Two
Analog 1
Analog Output 1
Analog 2
Analog Output 2
(or HART analog output if
installed)
Tag Name
Tag name
Location
Location of measurement
Sales Order Number Sales order number
MS Code
Model code
Serial Number
Serial number
Software Version
Software version
Device Name
Device name
Device Type
Device type
Comm Type
Digital communications type
Tag Number
Tag number
Line Frequency
ac Line frequency
Time
Current time
Date
Current date
History Log
View up to 10 of the most current
history log entries (if present)
30
Units
Notes
-----
pH and mV
pH and mV
mA
mA
--------------------Hz
-------
If installed
0 to 10 entries shown
5. Operation Via Local Display
MI 611-225 – August 2009
STATUS
Temperature
Cal Type
MS Code
Date
Absolute
Cal Temperature
Serial Number
HISTORY
ENTRY #1
Cal Point One
Software Version
HISTORY
ENTRY #2
Cal Point Two
Device Name
Analog 1
Device Type
ATC Resistance
Slope %
Slope mV
•
•
•
HISTORY
ENTRY #10
Asymmetry
Analog 2
(or HART
if installed)
Preamplifier
Comm Type
Tag Number
Tag Name
Line Frequency
Cal Person
Location
Cal Date
Time
Sales Order Number
Figure 20. Status Mode Structure Diagram
31
MI 611-225 – August 2009
5. Operation Via Local Display
Hold Mode
Refer to Figure 22.
The Hold mode enables you to manually hold the output at a determined value, thus allowing
you to configure or calibrate the analyzer or perform sensor maintenance without disturbing the
control loop. Outputs are driven to a preconfigured state or held at their current values. During
calibration, the analyzer continues performing live measurements.
To enter the Hold mode, press the Mode key until the Hold indicator is illuminated. Press Enter.
At the prompt, Passcode 0000, enter the passcode for Level 1, 2, or 3 and then press the Enter
key. If you enter the incorrect passcode, the display returns to Passcode 0000. If you enter the
correct passcode, the display briefly reads Unlocked and then changes to Hold Mode/Off. Refer
to Figure 22. In the Hold Mode menu, select On Present to hold all values and states at their
current level or On Manual to set all values and states at desired levels.
NOTE
If you entered the passcode for Level 3 and selected Manual, you can engage Hold
but cannot change the settings under Manual.
Additionally, in Configuration mode, you can use the Automatic Hold parameter to
automatically activate the Hold feature each time you enter Calibration or Configuration mode.
In this Configuration mode parameter, you can select Off, Present, or Manual. However, if you
select Manual, you must go to Hold mode to set the values.
MEASURE STATUS HOLD
CONFIG
CAL
DIAG
Assign and activate outputs. Use Up/Down arrows
to select state, Press ENTER.
Hold Mode
Off
On Present, On Manual, Off
MODE INDICATOR
HELP MESSAGE
PARAMETER
CURRENT CHOICE
CHOICES
Figure 21. Sample Hold Screen
If you select On Present and press the Enter key, the display briefly reads Hold Engaged and
proceeds to Measure mode and the outputs are held.
If you select On Manual and press the Enter key, the display proceeds to Alarm 1, the first of a
series of parameters to set values and states to desired levels during hold.
To set the output for Alarm 1 and Alarm 2, select Maintain to maintain the alarm in its present
condition while in Hold mode, On to activate the alarm while in Hold mode, or Off to deactivate
the alarm while in Hold mode.
To set the output for Analog 1 and Analog 2, select Live to not hold the output or Fixed to
hold the output at a desired value. If you selected Fixed, enter a value from 3.8 to 20.5 mA by
0.1 mA increments.
If you have HART or other digital communications installed, you can hold the measurement and
temperature values for each digital output at desired values. To do this, enter values for Digital
32
5. Operation Via Local Display
MI 611-225 – August 2009
Measure and Digital Temp. The measurement units are as configured under “Measurement” on
page 43. The value must be within the scale configured. The temperature units are as configured
under “Temp Unit” on page 44. The value can be from -20 to +200°C (-4 to +392°F) by 0.1°
increments.
When you have finished making the manual selections, the display briefly reads Hold Engaged
and proceeds to Measure mode.
While Hold is engaged, the Hold indicator blinks while you are in other modes to indicate that
your output is being held. Measurement hold can be maintained indefinitely.
To release Hold, press the Mode key until the Hold indicator is illuminated. At the prompt,
Passcode 0000, enter the passcode for Level 1, 2, or 3 and then press the Enter key. If you enter
the incorrect passcode, the display returns to Passcode 0000. If you enter the correct passcode,
the display briefly reads Unlocked and then changes to Hold Mode/On Present or Hold
Mode/On Manual. Use the Up or Down arrow key to select Off and press Enter. The display
briefly reads Hold Released and proceeds to Measure mode.
NOTE
If using the Automatic Hold feature, simply return to Measure mode to release the
hold.
E
PASSCODE
(IF ≠ 0000)
HOLD
UNLOCKED
Hold Mode
Off
On Present
On Manual
E
Hold
Released
E
Hold
Engaged
E
Analog 1
Maintained
On
On
Off
Off
Analog 2
E
E
Fixed
Analog 1
Digital Measure*
(if Passcode
Level 3)
E
Alarm 2
Maintained
E
Live
E
Alarm 1
(if Passcode
Level 1 or 2)
Live
Fixed
E
E
E
Analog 2
Digital Temp*
Hold Engaged
E
E
MEASURE
*If digital communications is installed
Figure 22. Hold Mode Structure Diagram
33
MI 611-225 – August 2009
5. Operation Via Local Display
Calibration Mode
Calibration routines in your analyzer were designed for simplicity and the elimination of faults.
Four calibration routines are available. See Figure 24. The first routine, Solution, enables you to
enter or edit the value(s) of your solution. A manual 1-point (offset) calibration, to bias the
measurement by a constant value, or a manual 2-point solution calibration can be performed. A
solution 2-point calibration is the primary calibration. It should be used whenever your analyzer is
used with a new (different) sensor and at regular intervals dictated by your application. The
second routine, Bench, is accomplished by connecting a voltage to the analyzer or by returning
to the stored “factory default” calibration. This calibration is usually used if you have a problem
with your analyzer. However, if you are changing from an ISE measurement to a pH
measurement, you should use a bench factory default calibration followed by a 2-point solution
calibration. The third routine, Analog n, allows you to tune the 4 mA and 20 mA values of the
analog outputs. The fourth routine, Autoservice, automates the process of cleaning and
calibrating sensors. When activated, the analyzer sends a signal to a (user-supplied) control
instrument which sequences the removal of the sensor from the process, its cleaning, calibration,
and reinstallation, all automatically.
NOTE
IPS recommends keeping a record of your calibrations. Recording the mV values
and slope can help you establish maintenance and replacement information on your
sensors.
To enter the Calibration mode, press the Mode key until the Cal indicator is illuminated. Press
Enter. The Hold indicator blinks if measurements are held. Use the Mode key to exit Calibration
mode and return to Measure mode.
MEASURE STATUS
HOLD
CONFIG
CAL
DIAG
Use arrow to adjust reading to display proper
value, Press ENTER
Manual 1 Point
7.0
Current Setting is: 7.0 pH
MIN -2.0
MAX 16.0
MODE INDICATOR
HELP MESSAGE
PARAMETER
EDITABLE READING
CURRENT SETTING
RANGE OF CHOICE
Figure 23. Sample Calibration Screen
At the prompt, enter the passcode for Levels 1, 2, or 3 and press the Enter key. If you enter a
correct passcode, the display responds in one of three ways depending on how Automatic Hold is
configured. If Automatic Hold is configured Off, the display cautions you that the instrument is
not in hold and to press Enter to continue or Mode to escape. If Automatic Hold is configured
Present, the display cautions that hold is engaged but that outputs are held at the present level. It
then unlocks the mode. If Automatic Hold is configured Manual, the display briefly displays
Hold Engaged and Unlocked.
34
5. Operation Via Local Display
MI 611-225 – August 2009
You are then asked to enter the Calibrator’s Name. After you do this and press the Enter key,
the analyzer displays the first category in the top level calibration structure, Calibrate. Refer to
Figure 24.
CAL
Passcode
(IF ≠ 0000)
E
Calibrator’s Name
Unlocked
E
L
Calibrate
E
Solution
E
Bench
E
Analog 1
E
Analog 2
E
Auto Service 1*
Auto Service 2*
E
L1
L2
L3
L3
L4
L4
* If Auto Service Type ≠ Off and
Service Initiate = Manual
Figure 24. Calibration Category Structure
Solution Calibration
Refer to Figure 25 on page 37 and Figure 26 on page 38.
There are several types of solution calibration. A Manual 1 Point or Manual 2 Point solution
calibration enables you to enter or edit the values of your solution. However, a Manual 1 Point
calibration can only be used if you have previously done a Manual 2 Point calibration with your
sensor.
NOTE
Only a Manual 1 Pt calibration can be used if you are measuring ORP.
A Smart Cal solution calibration can be used if you are measuring pH. It provides a buffer
recognition mechanism which locks in on the buffer value most closely representing the
combination of millivolts and temperature values being reported from the sensor.
If you are doing any of the solution calibrations, specify Solution from the top level calibration
structure.
If you are using a new (different) sensor, before doing a solution calibration, check that the
temperature in Status mode agrees with the actual temperature of your solution. If there is a
difference, the actual temperature should be entered before beginning your calibration. To do
this, specify Temp Adjust from the Solution Cal menu. Upon the prompt in the Help Message,
put your sensor into its solution and press Enter. The solution temperature is displayed. If Temp
Stability is configured On, the display reads Stabilizing until stability is achieved. When the
35
MI 611-225 – August 2009
5. Operation Via Local Display
message disappears, press Enter. If Temp Stability is configured Off, the display reads Stability
Off. Watch for the measurement to stabilize before proceeding to press Enter.
The temperature is now displayed in the edit box. If the reading is not correct, edit it to the
correct value and press Enter. Values of -20 to 200 °C or -4 to +392 °F in increments of 0.1 can
be entered. The units (°C or °F) are determined by your configuration of “Temp Unit” on
page 44. When finished, press Enter. The Help Message advises Calibration Completed. Press
Enter again to return to the Calibrate menu.
Manual Calibrations
If you are doing a manual calibration, after specifying the temperature, select the Manual 1 Point
or Manual 2 Point from the Solution Cal menu. The Manual 1 Point is used if you are
correcting for a shift in system zero.
Upon the prompt in the Help Message, put your sensor into its solution and press Enter. If Meas
Stability is configured On, the display reads Stabilizing until stability is achieved. When the
message disappears, press Enter. If Meas Stability is configured Off, the display reads Stability
Off. Watch for the measurement to stabilize before proceeding to press Enter.
If the reading is not correct, edit it to the correct value and press Enter. The Help Message
displays Calibration Completed (for a 1-point calibration) or an instruction to put your sensor
into the second solution (for a 2-point calibration). If you are doing a two-point calibration,
repeat the procedure. When complete, press Enter to return to the Calibrate menu or Mode to
return to Measure mode.
36
5. Operation Via Local Display
L1
MI 611-225 – August 2009
SOLUTION CAL
E
Manual 1 Point
E
Manual 2 Point
Smart Cal
E
L1A
Temp Adjust
Put Sensor
In Solution
E
Stabilizing
E
E
Edit Reading
Calibration
Completed
E
E
Incorrect Entry
Abort
Retry
Put Sensor
In Solution 1
E
Stabilizing
E
Edit Reading
E
E
E
E
Incorrect Entry
Abort
Retry
Put Sensor
In Solution 2
E
Stabilizing
E
L1
E
E
E
Edit Reading
Calibration
Completed
E
E
Incorrect Entry
Abort
Retry
Put Sensor
In Solution
E
Stabilizing
E
Temp Adjust
E
E
E
Calibration
Completed
E
E
Incorrect Entry
Abort
Retry
E
L1
E
Figure 25. Solution Calibration Structure Diagram
37
MI 611-225 – August 2009
5. Operation Via Local Display
Smart Calibration
If you are doing a Smart Cal calibration, after specifying the temperature, select Smart Cal from
the Solution Cal menu.
Upon the prompt in the Help Message, put your sensor into Solution 1 and press Enter. If Meas
Stability is configured On, the display reads Stabilizing until stability is achieved. When the
message disappears, press Enter. If Meas Stability is configured Off, watch for the measurement
to stabilize before proceeding to press Enter.
The display advises you which buffer is applicable. The Help Message advises to immerse your
sensor into the second solution. Repeat the procedure. When complete, press Enter to return to
the Calibrate menu or Mode to return to Measure mode.
Put Sensor
in Solution 1
L1A
E
Stabilizing
E
Auto-Buffer
Failure
E
L
Solution 1 is
Buffer X.XX pH
Put Sensor
in Solution 2
E
Stabilizing
E
Auto-Buffer
Failure
E
Solution 2 is
Buffer X.xx pH
L
L
Figure 26. Smart Calibration Structure Diagram
Bench Calibration
Refer to Figure 27 on page 40.
If you are doing a bench calibration, specify Bench from the top level calibration structure. Then
you have two choices. You can return to the stored factory default calibration by selecting Default
and pressing Enter. However, you can alternatively verify the calibration of your analyzer
(without the sensor) with theoretical millivolt inputs. If you want to do so, specify User Bench
and press Enter.
NOTE
A Bench Calibration does not remove a Calibration Fault. Only a successful
Solution Calibration does this.
Then proceed as follows:
1. Disconnect all sensor leads from your analyzer.
2. Connect a millivolt source between sensor input terminals as follows: positive to
terminal 3 and negative to terminal 4. Jumper terminals 4 and 5.
3. Upon the prompt in the Help Message, adjust the millivolt supply to your first value
as determined by the formula in Table 8 and press Enter. If Meas Stability is
38
5. Operation Via Local Display
MI 611-225 – August 2009
configured On, the display reads Stabilizing until stability is achieved. When the
message disappears, press Enter. If Meas Stability is configured Off, watch for the
measurement to stabilize before proceeding to press Enter.
Table 8. Millivolt Supply Formulas
Measurement
Mode
mV Power Supply
Formula
Glass pH
(pH-7) x (-59.16)
Antimony pH
(pH-1) x (-55)
ORP
ISE
(mV)
(59/n) x log
[ppm of sample/
ppm of standard]
+mV of standard
where n = charge and
valence (2, 1, -1, -2)
Examples
pH0: (0-7) x (59.16) = +414.1 mV
pH14: (14-7) x (59.16) = -414.1 mV
pH0: (0-1) x (55.00) = +55.0 mV
pH7: (7-1) x (55.00) = -330.0 mV
Input absolute millivolt
Fluoride Sensor Assembly, EP459A
Standard 1 ppm ≅ 118 mV
Charge is negative and monovalent (n=-1)
(59/-1) log [ppmX/1 ppm] + 118 mV
ppm1 = 118 mV
ppm2 = 100 mV
ppm10 = 59 mV
4. If the reading is not correct, edit it to the correct value (to within 0.01%) and press
Enter.
5. If this part of the calibration is successfully completed, the display prompts you to
adjust the millivolt supply to the second value and repeat the procedure.
6. If the calibration is successfully completed, the display reads Calibration
Completed.
7. If either part of the calibration was not successfully completed, the display reads
Incorrect Entry. Press Enter twice to return to the Calibrate menu.
8. Lastly, reconnect your sensor wires and reconfigure Temp Mode to Automatic or
desired Manual setting as necessary.
39
MI 611-225 – August 2009
L2
E
5. Operation Via Local Display
Bench
Default
User Bench
Connect
mV Source
E
E
Restore defaults
for Bench Cal
E
E
Stabilizing
Edit Reading
Yes/No
E
E
Incorrect Entry
Abort
Retry
Connect
mV Source
E
E
Stabilizing
Edit Reading
E
L2
E
E
Calibration
Completed
E
E
Incorrect Entry
Abort
Retry
E
L2
E
Figure 27. Bench Calibration Structure Diagram
Analog 1 and Analog 2
This subsection allows you to tune the 4 mA and 20 mA values. The procedure is as follows:
1. Connect a digital current meter between terminals MA1+ and MA1- for Analog 1 and
MA2+ and MA2- for Analog 2.
2. With Analog n displayed, press Enter. The display changes to Analog n 4 mA.
3. Calibration is performed by having your current meter read 4 mA. Do this by
selecting the degree of change required, Course, Medium, or Fine, by using the Left
and Right arrow keys and the direction of the change by using the Up and Down
arrow keys. Repeat this step until your meter reads 4 mA. Then press Enter. The
display advances to Analog n 20 mA.
4. Repeat the procedure shown in Step 3 for 20 mA. The current reading should be
20 mA.
L3
Analog n 4mA
COURSE MEDIUM FINE
E
Analog n 20mA
COURSE MEDIUM FINE
Figure 28. Analog Calibration Structure Diagram
40
E
L
5. Operation Via Local Display
MI 611-225 – August 2009
Auto Service 1 and Auto Service 2
In order to perform an Auto Service procedure from the analyzer keypad, Service
Initiate/Manual must be enabled in Configuration mode. Access the procedure by selecting
Auto Service n from the Calibrate menu. To begin the Auto Service routine, select Start and
press Enter. To exit from this procedure, select Exit to Cal and press Enter.
L4
Manual Service/#n
Start
Exit to Cal
Figure 29. Auto Service Structure Diagram
Configuration Mode
Refer to Structure Diagrams in Appendix A.
Configuration is the process of establishing functional capability in the analyzer firmware for your
application. This section helps you to systematically determine and configure the value or status
of each parameter required for your application. IPS recommends that you make configuration
changes from the beginning of the menu structure forward. This is because menus are forward
referencing meaning that if you start at the beginning and work to the end, you achieve a valid
configuration. Also, the analyzer validates the configuration when attempting to exit
configuration and directs you to any invalid menus.
To enter the Configuration mode, press the Mode key until the Config indicator is illuminated.
Press Enter. At the prompt, enter the passcode for Levels 1 or 2 and press the Enter key. If you
enter an incorrect passcode, the display returns to Passcode 0000. If you enter the correct
passcode, the display presents a picklist to choose View or Change. If you entered the Level 3
passcode, you can only view the basic configuration parameters. If you entered the Level 2
passcode, you are allowed to view or change the basic configuration parameters. If you entered the
Level 1 passcode, you can view or change any configuration parameter. See Table 6 on page 24
for a listing of passcode access to various configuration parameters.
If you selected Change, the display responds in one of three ways depending on how Automatic
Hold is configured. If Automatic Hold is configured Off, the display cautions you that the
instrument is not in hold and to press Enter to continue or Mode to escape. If Automatic Hold
is configured Present, the display cautions that hold is engaged but that outputs are held at the
present level. It then unlocks the mode. If Automatic Hold is configured Manual, the display
briefly displays Hold Engaged and Unlocked.
After selecting View or Change, the first category in the top level configuration structure,
Measurement, is displayed. To view or change another configuration category, press the Up or
Down arrow key. When you have located the desired category, press the Enter key. Each category
of parameters is shown in subsequent structure diagrams.
! CAUTION
If there are no key presses within the configured Timeout period, the analyzer reverts
to Measure mode and all changes are lost.
41
MI 611-225 – August 2009
5. Operation Via Local Display
Making a change to one configuration parameter can cause an invalid selection or out-of-range
value in one or more other parameters. To assist you in properly configuring the analyzer, prompts
are provided guiding you to these out-of-range parameters.
You can exit the Configuration mode and proceed to another mode at any time by pressing the
Mode key. If you were in View, the analyzer goes directly to Measure mode. If you were in
Change, the analyzer validates the configuration. If your new configuration does not contain
invalid entries, the display reads Configuration OK - Save Changes? Press the Yes key to save
the changes or the No key to abort the changes. The analyzer then goes to Measure mode. If your
new configuration does contain invalid entries, the display reads Configuration Error - Fix It?
Press the Yes key to fix the error or the No key to abort the changes. If Yes, the analyzer takes
you to the first menu in error. Once the error is fixed, the analyzer validates the configuration. If
No, the analyzer goes to Measure mode. Figure 30 shows the logic involved.
NOTE
Changes are not implemented until they are saved and measure mode is restored.
Exit
Configuration
Configuration Error
Fix It?
Yes
No
Configuration OK
Save Changes?
Yes
No
Go To and Show
Menu in Error
Changes
Saved
Changes
Aborted
Figure 30. Configuration Mode Exit Flow
42
Done
5. Operation Via Local Display
MI 611-225 – August 2009
Configuration Display
MEASURE STATUS
HOLD
CONFIG
CAL
Alarm 1
Measurement
Current Setting Is Measurement
Off, Measurement, ... On Fault
DIAG
MODE INDICATOR
PARAMETER
CURRENT CHOICE
CURRENT SETTING
BEGINNING AND END OF CHOICE LIST
Figure 31. Sample Configuration Screen
Measurement
Refer to Figure A-2 on page 74.
This section of the structure enables you to specify your measurement Units as pH (for pH
measurement), mV (for ORP measurement), ppm (for ISE measurement), or Custom.
If you choose pH, you must also specify your Resolution as 0.1 pH or 0.01 pH.
If you choose ppm, you must specify your Scale as 0.9999, 9.999, 99.99, 999.9, or 9999 and
chemical compensation (Chemical Comp) as Standard or Custom. Selecting Custom requires
that you specify a number of points (Num of Pts) to plot a compensation curve. The number of
points can be specified from 2 through 21. Each point specifies a base value (Base/Point n) and
a value you want it to be (Custom/Point n). The values can be specified from 0 through
2000 ppm.
If you choose Custom, you must specify your custom units in 5 characters or less. Then specify
your Custom Scale as 0.9999, 9.999, 99.99, 999.9, or 9999. You also must specify a number of
points (Num of Pts) to plot the relationship between the base unit and the custom unit. The
number of points can be specified from 2 through 21. Each point specifies a base value
(Base/Point n) and a value you want it to be (Custom/Point n).
Lastly, this section of the structure asks you to specify the Damping response time (for 90%
recovery from an input step). Choices are None, 5, 10, 20, 40, and 120 seconds. To increase
damping, use a higher response time. Damping applies only to measurement data, not to
temperature data.
Sensor
Refer to Figure A-3 on page 75.
Electrode
If you specified your Units as pH or ppm, you must specify your Electrode here.
♦
If measuring pH: Your choices are Glass, Antimony, or Other. Glass sets the
isopotential point at 7 pH. Antimony sets it at 1 pH. Other allows the isopotential
point to be set manually from -2.0 through 16.0 pH.
43
MI 611-225 – August 2009
♦
5. Operation Via Local Display
If measuring ISE: You must specify the ion polarity as Positive or Negative. A
positive ion selective measurement gets more positive (mV-wise) as the concentration
increases (for example, Na+, K+). A negative ion selective measurement gets more
negative (mV-wise) as the concentration increases (for example, F–, S–2). For fluoride
measurements, this parameter should be set to negative.
Next, select the Valence as Monovalent or Divalent. Then set the isopotential point
from -2000 through +2000 mV.
NOTE
If you specified your Units as mV or Custom, this section does not appear.
Temp Type
First, specify the Temp Type as RTD or BALCO.
If you specify the Temp Type as RTD, specify 2-wire or 3-wire RTD and its resistance value as
2 Wire 100Ω, 2 Wire 1000Ω, 3 Wire 100Ω, or 3 Wire 1000Ω.
Temp Unit
Specify Temp Unit as Celsius or Fahrenheit. All references to temperature appear in the
specified units within the analyzer software.
Temp Mode
Specify the Temp Mode as Automatic or Manual.
In Automatic mode, the temperature follows the temperature input RTD and you can set a
temperature fail signal value (Fail Signal), in case the RTD fails, at the temperature at which you
expect the process to be operating.
In Manual mode, the temperature can be set at a fixed temperature value and resistance inputs on
the temperature terminal are ignored.
Temp Comp
Refer to Figure A-4 on page 75.
This section of the structure asks you to specify the temperature compensation if you are
measuring pH or ISE.
NOTE
This section does not appear if you selected mV as your Unit.
If pH was chosen as your Units, specify Standard, Ammonia, or Custom. Standard assumes a
glass or antimony electrode and applies the Nernst equation. The nominal temperature
compensation range is -5 to +105 ° C (23 to 221 ° F). Ammonia compensates for traces of
ammonia in addition to the standard compensation. Custom allows you to specify particular
solution characteristics into the analyzer’s memory. When using this compensation, all
measurements are corrected back to a reference temperature measurement value. Therefore, you
are asked to specify a reference temperature and a number of points to plot a compensation curve.
The reference temperature (Reference Temp) can be set from -20 through + 200°C or -4
44
5. Operation Via Local Display
MI 611-225 – August 2009
through +392°F in increments of 0.1 degree but should be within the nominal temperature
compensation range. The number of points (Num of Pts) can be specified from 2 to 21 points.
Each point specifies a value at a certain temperature. The temperatures (Temp/Point n) can be set
from -20 through + 200°C or -4 through +392°F in increments of 0.1 degree but should be
within the nominal temperature compensation range. The temperature units were specified in the
previous section. The values (Value/Point n) can be specified within the current scale.
NOTE
1. The temperature values must be entered in increasing or decreasing order or the
display will read Slope Error.
2. Actual database saving of the compensation table is not performed until the last
point pair is entered.
If ppm was chosen as your Units, you must specify Standard or Custom. Custom causes you
to specify a reference temperature and a number of points to plot a compensation curve. The
procedure is described immediately above. The values (Value/Point n) can be specified from 0 to
2000 ppm.
Display
Refer to Figure A-5 on page 76.
In Measure mode, the display normally shows the information configured in this section. First
you must specify the Line Mode. The choices are:
♦
Single: The measurement title, value, and unit are displayed. If more than one
application is configured, the application number replaces the measurement title. The
bar graph shows the percent of the configured range of the value on the display.
♦
Dual: Two measurement titles, values, and units are displayed. If more than one
application is configured, the application number replaces the Line 1 measurement
title. The bar graph shows the percent of the configured range of the Line 1 value on
the display.
♦
Scan: Several measurements can be selected to show in sequence on the display in a
designated scan time. When you are in Scan mode, the bar graph is inactive.
If you are in Single Line Mode, you must select, in the Line parameter, the measurement you
want shown on the display. If you are in Dual Line Mode, you must select, in the Line 1 and
Line 2 parameters, the measurements you want shown on the display. Choose from the selections
in Table 9.
Table 9. Display Configuration
Selection
Measurement
Temperature
Absolute
Analog 1
Analog 2 (or HART if installed)
Description
The pH, ORP, or ISE measurement
The temperature measurement
The absolute value of the measurement in base units
Analog Output 1
Analog Output 2
45
MI 611-225 – August 2009
5. Operation Via Local Display
Next, enter the minimum (Bargraph Min) and maximum (Bargraph Max) bar graph values if
you selected Measurement, Temperature, or Absolute in Line or Line 1. See Table 10 for the
scale and units that apply to each selection.
Table 10. Bar graph Configuration
Selection
Unit
Measurement Per “Measurement” on page 43
pH
mV
ppm
Custom
Temperature Per “Temp Unit” on page 44
°C
°F
Absolute
mV
Scale
Per “Measurement” on page 43
-20 through +200 by 0.1 if °C
-4 through +392 by 0.1 if °F
-2010 through +2010 mV by 0.01
If in Scan Mode, you must specify which measurements you want to display in sequence (Scan
Data) and the Scan Time. The Scan Data selections are from the list shown in Table 9. The
Scan Time choices are 2, 5, 10, and 20 seconds.
Scan Data choices are selected or deselected by presenting a choice on the display and pressing
the Enter key. The selected choices appear on the menu preceded by a check sign (√). When you
have finished making your selections, choose Exit.
Analog 1 and Analog 2
Refer to Figure A-6 on page 76.
There are two analog outputs in the analyzer, Analog 1 and Analog 2. Each analog output is
configured independently. On power-up and after configuration changes, the output reflects the
fail-safe value as configured until the analyzer has stabilized and has passed the first damping
factor.
This section of the structure enables you to specify what measurement each analog output reflects,
the minimum and maximum range values for the outputs just specified, and a fail-safe signal for
each output.
Measurement
For each analog output (Analog n), specify the 4 to 20 mA output to represent one of the
following measurements: Measurement, Temperature, or Absolute. You can also specify Off if
you are not using the output.
Output Range
The nominal output measurement currents are 4 mA and 20 mA. Both can be configured to any
measurement value. When the 4 mA level represents the measurement highest value and 20 mA
represents the measurement lowest value, the outputs are reverse acting.
46
5. Operation Via Local Display
MI 611-225 – August 2009
Enter the minimum (Min@4mA/Analog n) and maximum (Max@20mA/Analog n) range
values for the output just specified. See Table 10 for the scale and units that apply to each
selection. There must be a minimum difference of 5% between the minimum and maximum
values.
Fail-Safe Output
A fail-safe output is delivered for all analyzer faults and for certain sensor diagnostic faults (ATC
Short, ATC Open, Glass, and Preamp) when so configured. Select Off under Failsafe to omit
this feature. Select On to specify a fixed output when in a failed condition. Select Pulse if you
want to have this signal outputted with a pulsed saw-tooth waveform of 0.5 mA (as shown below)
for greater visibility on a chart recorder or data display. The waveform has a frequency of 10 Hz
with 10 steps of 0.1 mA increments.
If On is selected, further specify the DC mA/Analog n output between 3.8 and 20.5 mA. If
Pulse is selected, further specify the Average mA/Analog n output between 3.8 and 20.5 mA.
An example of how to use this feature follows.
Suppose you are using your 4 to 20 mA signal to control a valve that diverts high pH water. You
also wish to divert the flow if the measurement system is suspect due to a configuration error. To
configure your analyzer to do this:
1. Configure your output so that 20 mA is the upper limit of acceptable water before
diverting flow.
2. Configure Failsafe as On and set the DC mA/Analog 1 value as 20.5.
3. In Diagnostic, enable the 4-20 Range, Comp Range, and Meas Range selections
and disable the ATC Short, ATC Open, Glass, and Preamp selections.
HART Analog
Refer to Figure A-7 on page 77.
The analyzer can have an optional communication module that allows measurement, status, and
configuration information to be exchanged between the analyzer and the connected host. HART
is one of these modules.
The HART Analog parameter enables you to specify what measurement the analog output
reflects, the minimum and maximum range values for the output just specified, and a fail-safe
signal for the output. See “Analog 1 and Analog 2” on page 46 for an explanation of how to
configure these parameters.
NOTE
1. The Failsafe (HART) parameter does not have a Pulse selection.
2. To configure your HART digital communication parameters, see “HART
Digital” on page 54.
47
MI 611-225 – August 2009
5. Operation Via Local Display
HART Digital Outputs
The analyzer can have an optional communication module that allows measurement, status,
configuration, calibration, and diagnostic information to be exchanged between the analyzer and
the connected host.
There are four HART measurements:
HART Measurement
Primary Variable (PV)
Secondary Variable (SV)
Tertiary Variable (TV)
Fourth Variable (FV)
875 Configuration Parameter
Analog 1
HART Analog
HART TV
HART FV
HART PV (Analog 1)
The primary variable (PV) is the measurement configured for Analog 1. Analog 1 can be
configured to represent Measurement, Temperature, or Absolute measurements. It is
frequently configured to be the Measurement such as pH, ORP, or ppm. You can also specify
Off if you are not using this output.
HART SV (HART Analog)
The secondary variable (SV) is the measurement configured for HART Analog. Hart Analog can
be configured to represent Measurement, Temperature, or Absolute measurements. It is
frequently configured to Temperature. You can also specify Off if you are not using this output.
HART TV
The tertiary variable (TV) can be configured to represent Measurement, Temperature, or
Absolute measurements. It is frequently configured to Absolute. You can also specify Off if you
are not using this output.
HART FV
The fourth variable (FV) can be configured to represent Measurement, Temperature, or
Absolute measurements. You can also specify Off if you are not using this output. It is usually
configured to Off.
Diagnostics
Refer to Figure A-8 on page 77.
This section of the structure allows you to configure fault messages that can appear on your
display. In Select Diag, you can elect to enable or disable All Diags messages, or enable or
disable each of the following individually: Leakage, ATC Short, ATC Open, 4 - 20 Range,
Comp Range, Meas Range, Glass, Low Slope, Preamp, Aging, and Coating. Each of these
is discussed below. A typical approach is to initially disable All Diags messages and to enable
selected messages later when you find out that you require them.
48
5. Operation Via Local Display
MI 611-225 – August 2009
Choices are selected or deselected by presenting a choice on the display and pressing the Enter
key. The selected choices appear on the menu preceded by a check sign (√). When you have
finished making your selections, choose Exit. The menu returns to Select Diag.
NOTE
Diagnostics that are enabled and triggered can also force a fail-safe analog output
signal, if desired. See “Analog 1 and Analog 2” on page 46.
If you have enabled Glass, Low Slope, Preamp, or Coating, use the Down arrow in the
Diagnostic menu to select Set Diag Limits. When you have finished setting the limits, the menu
returns to Select Diag Limits. Go to Select Diag with the Up arrow key and to Diagnostics
with the Left arrow key.
Leakage
This message reports a problem of severe liquid leakage into the sensor which causes an ATC
short to a measurement electrode. The message can be enabled or disabled. A Sensor Fault
message is displayed if this diagnostic is enabled and this fault occurs.
ATC Short, ATC Open
This message reports a problem if the resistance of the temperature compensator is greater or less
than the expected resistance of the device configured. The message for each can be enabled or
disabled. A Sensor Fault message is displayed if this diagnostic is enabled and this fault occurs.
4 to 20 Range
This message reports that the measurement tied to the analog output (measurement, absolute
measurement, or temperature) is outside the range configured for the currently running
application. The message can be enabled or disabled. A Configuration Fault message is
displayed if this diagnostic is enabled and this fault occurs.
Comp Range
This message reports that the measured temperature or absolute conductivity or resistivity
measurement is outside the temperature or chemical compensation curve configured for the
currently running application. The message can be enabled or disabled. A Configuration Fault
message is displayed if this diagnostic is enabled and this fault occurs.
Meas Range
This message reports that the measurement is over or under the measurable range that is
configured for the currently running application. The message can be enabled or disabled. A
Configuration Fault message is displayed if this diagnostic is enabled and this fault occurs.
Glass
This message reports a problem in the resistance of a glass electrode in the sensor. Resistance of a
glass electrode is checked versus solution ground. A Sensor Fault message appears if the
resistance is less than the user-set limit. Besides enabling and disabling the message, you can limit
49
MI 611-225 – August 2009
5. Operation Via Local Display
the message to resistances below a set value. The Glass Lo Limit value can be set from 0.1
through 1.1 MΩ in increments of 0.1 MΩ. You can also specify a cutoff temperature above which
this feature is disabled. Glass Cutoff Temp can be set from -20 through +200 °C or -4 through
392 °F in increments of 1 degree. The resistance of a glass bulb decreases (roughly is halved) for
every 10°C increase in temperature.
NOTE
This message does not appear for ORP measurement.
Low Slope
This message reports a problem usually associated with an aging glass electrode. A Sensor Fault
message appears after a 2-point calibration in buffer solutions when the Nernst slope of the sensor
becomes less than the user set limit. The limit can be set from 0 through 100 percent in
increments of 1 percent. The message can be enabled or disabled.
NOTE
This message does not appear for ORP measurement.
Preamp
This message reports a failed preamplifier. If the voltage out of the preamp exceeds +2.5 V a
Sensor Fault is reported. Also, a Sensor Fault message appears when the power consumed by
the sensor is greater than the user set limit. The limit can be from 0 through 70 mW in
increments of 1 mW. The message can be enabled or disabled.
Aging
This message reports an aging glass electrode. A Sensor Fault message appears after a 2-point
calibration in pH buffer solutions when the Nernst slope of the sensor has decreased sequentially
five times. The message can be enabled or disabled.
Coating
This message reports an increase in reference junction resistance possibly resulting from a fouled
reference junction. The diagnostics check the resistance against solution ground. A Sensor Fault
message appears if the resistance is greater than the user set limit. The limit can be set from 0
through 100 kΩ. The message can be enabled or disabled.
Auto Service 1 and Auto Service 2
Refer to Figure A-9 on page 78.
The analyzer Auto Service feature automates the process of cleaning and calibrating sensors.
When activated, the analyzer sends a signal to a (user-supplied) control instrument which
sequences the removal of the sensor from the process, its cleaning, calibration, and reinstallation,
all automatically.
50
5. Operation Via Local Display
MI 611-225 – August 2009
To configure this feature, first specify the type of auto service desired. The choices are AutoClean, One point Cal, Two Point Cal, Clean + 1Pt Cal, and Clean + 2Pt Cal. The type can
also be set to Off.
Methods of Initiation
Next specify the method or methods to Initiate the auto service. The choices are Manual (from
the analyzer keypad), Signaled (by an input trigger), Scheduled (by a set date or period),
Diagnostic (by a fault), and All Selects (all of the above). Choices are selected or deselected by
presenting a choice on the display and pressing the Enter key. The selected choices appear on the
menu preceded by a check sign (√). When you have finished making your selections, choose Exit.
If you selected Signaled, you must specify the Input Trigger as High or Low. If High, Auto
Service is initiated when the input switch is closed. If Low, it is initiated when the input switch is
open.
NOTE
The input trigger for this signal is from digital input DI1 for Auto Service 1 and
DI2 for Auto Service 2.
If you selected Diagnostic, you must select the specific fault you want to initiate the auto service
feature. The choices are Low Slope, Coat, or All Selects (all of the above). Choices are selected
or deselected by presenting a choice on the display and pressing the Enter key. The selected
choices appear on the menu preceded by a check sign (√). When you have finished making your
selections, choose Exit.
If you selected Scheduled, you must select the schedule. The choices are Daily, Weekly,
Monthly, Period by Days, and Period by Hours. If you selected Weekly or Monthly, you must
specify the days of the week (All Days or Monday, Tuesday, ... Sunday) or the days of the
month (Al Days or 1, 2, 3, ...28) respectively. Choices are selected or deselected by presenting a
choice on the display and pressing the Enter key. The selected choices appear on the menu
preceded by a check sign (√). When you have finished making your selections, choose Exit. If you
selected Daily, Weekly, or Monthly, you must specify the Time of Day.
If you selected Period by Days, you must specify the Period of Day/#n from 1 to 365. For
example, to do the procedure once every 10 days, select 10. If you selected Period by Hours, you
must specify the Period of Hour/#n from 1 to 8760. For example, to do the procedure once
every 8 hours, select 8. In both cases, you must also specify the Start Date from 1/01/9999 to
12/31/2098 and the Start Time from 00:00 to 23:59.
Calibration Solution
In selecting your calibration solutions, you can choose between User Solutions and Smart Cal
Buff. If you selected User Solutions, you must specify the Solution Value/#n for a one-point
calibration or Solution Value 1/#n and Solution Value 2/#n for a two-point calibration. The
value can be 0 to full scale.
NOTE
Smart Cal Buff is not available with a one point calibration. Therefore, the
structure goes directly to Solution Value 1/n if Auto Service Type is One Point
Cal or Clean + 1Pt Cal.
51
MI 611-225 – August 2009
5. Operation Via Local Display
Auto-Clean and Calibration Times
Next you must establish times for the various steps in the auto service procedure. The T1 Setup
Time is the time for cleaning, purging, and setup. Next is the T2 Hold Time (time in Solution 1)
and T3 Setup Time (for cleaning, purging, and set up) if you are doing a calibration. Lastly is
T4 Hold Time (time in Solution 2) and T5 Setup Time (for cleaning, purging, and set up) if you
are doing a two-point calibration. The Setup and Hold times can be set from 15 to 999 seconds.
Trip State and Hold
Lastly, specify the Trip State as Energized or Deenergized. Also specify the Hold parameter as
Off, On Present (to hold all values and states at their present level) or On Manual (to set all
values and states at the levels specified in Hold mode).
Signaled Hold
Refer to Figure A-11 on page 79.
This parameter enables to configure your analyzer to go into Hold mode upon receiving a digital
signal. To configure this parameter, specify the Signaled Hold Mode as On Present (to hold all
values and states at their current level), On Manual (to set all values and states at the levels
specified in Hold mode), or Off (if you choose not to use this feature). Then specify Signaled
Input Trig as High or Low. If High, Hold is initiated when input switch DI3 is closed. If Low, it
is initiated when the input switch is open.
Alarm 1, Alarm 2
Refer to Figure A-12 on page 80.
The analyzer has two sets of alarm contacts. Each is configured independently. On power-up and
after configuration changes, alarm action is inhibited until the analyzer has stabilized and has
passed the first damping factor. The alarm output may not be in the desired state until that time.
NOTE
Auto Service must be configured Off for Alarm 1 to be available for configuration.
Measurement Condition
For each alarm (Alarm n), specify the alarm to one of the following measurements or conditions:
Measurement, Temperature, Absolute, or On Fault. You can also specify Off if you are not
using the alarm.
Alarm Activation
Next, specify in Trip n if you want the alarm to be:
♦
Trip Low: Active (energize relay) on a low going condition
♦
Trip High: Active (energize relay) on a high going condition
Specify the trip point (Set Point n) value. This is in the units previously configured and within
the scale previously specified. Then specify Control n as Hysteresis or Timed. Both are used to
minimize chatter around the setpoint. Hysteresis does this by using the measurement; Timed,
52
5. Operation Via Local Display
MI 611-225 – August 2009
by using time. If Control n is specified as Hysteresis, enter the hysteresis value. If you choose
not to use either hysteresis or timed control, select Hysteresis and set the hysteresis value to zero.
TRIP POINT
HYSTERESIS
MEASUREMENT
ALARM ON
ALARM OFF
TIME
Figure 32. High Alarm with Hysteresis
If Control is specified as Timed, three timers are involved in the alarm:
♦
A Trig Time n (trigger time) wherein the condition must exist continuously for at
least this time period before the alarm condition is met
♦
An alarm On Time n (feed time)
♦
An alarm Off Time n (delay time) before the alarm can trigger again.
The values can be set from 00.00 to 99.99 minutes.
MEASUREMENT
TRIP POINT
ALARN ON
ALARM OFF
TRIG
TIME
TRIG ON OFF TRIG ON
TIME TIME TIME TIME TIME
TRIG ON OFF ON OFF
TIME TIME TIME TIME TIME
Figure 33. Timed Low Alarm
If you are logged on at Passcode Level 1, you are asked to specify the alarm fault action. If you are
not logged on at Passcode Level 1, the structure advances you to the next parameter, Trip State.
Set Alm Fault Act as Meas Value, Meas + Fault, or Valid Meas.
Meas Value enables an alarm only when the measurement exceeds the alarm set point.
53
MI 611-225 – August 2009
5. Operation Via Local Display
Meas + Fault enables an alarm when the measurement exceeds the set point and if one of the
selected faults is present. You can select the Faults that you want to activate the alarm. The
choices are All Faults, Analyzer Faults, Comm Faults, Leakage, Temp, ATC Short, ATC
Open, 4-20 Range, Comp Range, Meas Range, Glass, Low Slope, Preamp, Aging, and
Coat. Choices are selected or deselected by presenting a choice on the display and pressing the
Enter key. The selected choices appear on the menu preceded by a check mark (√). When you
have finished making your selections, choose Exit.
Valid Meas validates the cause when the measurement exceeds the setpoint. If the cause is a fault
and not process related, the alarm is disabled.
Lastly, specify the Trip State as Energized or Deenergized. In an alarm condition, Energized
provides a contact closure between 1C and 1NO (2C and 2NO) and an open contact between 1C
and 1NC (2C and 2NC); Deenergized provides a contact closure between 1C and 1NC (2C
and 2NC) and an open contact between 1C and 1NO (2C and 2NO). To provide alarm
capability on loss of power, select Deenergized.
NOTE
The way you configure the alarm trip state must be done in conjunction with the
way you wire the external device to the analyzer. See “Alarm Wiring” on page 19.
Remote
Refer to Figure A-13 on page 81.
The analyzer can be operated via a remote personal computer program on a PC operating on
Windows 95, Windows 98, Windows NT, or Windows 2000. To enable this capability, several
parameters must be configured in this section of the structure.
Begin by setting Configure Remote, to Port Settings. Then, set the Baud Rate to 300, 600,
1200, 2400, 4800, 9600, or 19200, the Data Parity to 7 Odd, 7 Even, 8 Odd, 8 Even, or
8 None and the Stop Bits to 1 or 2.
Next, go back and set Configure Remote to Update Rate. Set the Update frequency as every 5,
10, 30, 60, 120, 300, 600, 1200, or 3600 seconds. You can also set this parameter to Off. The
analyzer updates the remote port with measurement information at the configured update rate.
HART Digital
Refer to Figure A-14.
This section of the structure enables you to specify your HART digital communication
parameters. First, specify the Poll Address of 0 to 15. Then, specify the Preambles value of
5 to 255.
NOTE
To configure your HART analog output, see“HART Analog” on page 47.
To configure your HART digital output, see “HART Digital Outputs” on page 48.
Cal Parameters
Refer to Figure A-15.
54
5. Operation Via Local Display
MI 611-225 – August 2009
This section of the structure asks you to specify the buffers to be used if you are measuring pH
and using the Smart solution calibration feature described on page 38. It also asks you to define
the parameters used by the analyzer in checking for measurement and temperature stability when
performing a calibration.
Buffers
In Smart calibration, the pH value calculated with values from the last calibration is used to
decide which buffer is in use. The algorithm checks each buffer starting with Buffer 1 and selects
the first one for which this pH is within the configured Tolerance of the average pH for the
buffer. You can select between American, NIST, European, and Special buffers as standard
buffer table choices. The Tolerance of auto-buffer recognition can be set from 0.0 through
2.0 pH.
If you select Special, you must specify the number of points (Buf#n Num Points) between
2 and 21 for Buffer 1, 2, and 3. Each point specifies a value at a certain temperature. The
temperatures (Buf#n Temp n) can be specified from -20 to +200 °C by 0.1°C or -4 to 392 °F by
0.1 °F. The values (Buf#n Value n) can be specified from -2.00 to +16.00 pH.
If the average pH values of two Special buffers are less than 1 pH unit apart, using this procedure
might result in the wrong buffer being selected. In this case, the buffer selection is based on the
midpoint between the two buffers. It is not necessary to configure all three Special buffers. If
only two are used, they should be Buffers 1 and 2. If one is used, it should be Buffer 1. Enter
Special buffer tables in the increasing order of the average pH for the buffer. The average pH is
estimated as (first entry + last entry) / 2.
Tables of buffer values for nominal 4, 7, and 10 pH for American, NIST, and European buffers
are listed below.
Table 11. American Buffer Tables
Temperature
°C
0
5
10
15
20
25
30
35
40
45
50
4.00 pH
7.00 pH
10.01 pH
pH Value
4.00
4.00
4.00
4.00
4.00
4.00
4.01
4.02
4.03
4.04
4.06
pH Value
7.12
7.09
7.06
7.04
7.02
7.00
6.99
6.99
6.98
6.98
6.97
pH Value
10.32
10.25
10.18
10.12
10.06
10.01
9.97
9.93
9.89
9.86
9.83
55
MI 611-225 – August 2009
5. Operation Via Local Display
NOTE
Values in Table 11 are based on common (nominal value) technical buffer systems.
pH values are at 25°C. Chemical formulas are as follows:
4.00 pH: 0.05 molar Potassium Hydrogen Phthalate
7.00 pH: 0.041 molar Disodium Hydrogen Phosphate;
0.026 molar Potassium Dihydrogen Phosphate
10.01 pH: 0.025 molar Sodium Carbonate;
0.025 molar Sodium Bicarbonate
Table 12. NIST Buffer Tables
Temperature
°C
0
5
10
15
20
25
30
35
40
45
50
4.01 pH
6.86 pH
9.18 pH
pH Value
4.00
4.00
4.00
4.00
4.00
4.01
4.02
4.03
4.04
4.05
4.06
pH Value
6.98
6.95
6.92
6.90
6.88
6.86
6.85
6.84
6.84
6.83
6.83
pH Value
9.46
9.40
9.33
9.28
9.23
9.18
9.14
9.10
9.07
9.04
9.01
NOTE
Values in Table 12 are based on NIST Primary Buffer Systems. pH values are at
25°C. Chemical formulas are as follows:
4.01 pH: 0.05 molar Potassium Hydrogen Phthalate
6.86 pH: 0.025 molar Potassium Dihydrogen Phosphate;
0.025 molar Disodium Hydrogen Phosphate
9.18 pH: 0.01 molar Sodium Tetraborate Decahydrate (Borax)
56
5. Operation Via Local Display
MI 611-225 – August 2009
Table 13. European Buffer Tables
Temperature
°C
0
5
10
15
20
25
30
35
40
45
50
55
60
70
80
90
95
4.61 pH
7.00 pH
9.21 pH
pH Value
pH Value
7.12
7.09
7.06
7.04
7.02
7.00
6.99
6.98
6.97
6.97
6.97
6.97
6.98
7.00
7.04
7.09
7.12
pH Value
9.52
9.45
9.38
9.32
9.26
9.21
9.16
9.11
9.07
9.03
8.99
8.96
8.93
8.88
8.83
8.79
8.77
4.64
4.62
4.61
4.61
4.61
4.62
4.63
4.64
4.66
4.67
4.69
4.71
NOTE
Values in Table 13 are based on commercially available technical buffers used in
some parts of Europe. pH values are at 25°C. Chemical formulas are as follows:
4.61 pH: 0.1 molar Sodium Acetate; 0.1 molar Acetic Acid
7.00 pH: 0.026 molar Potassium Dihydrogen Phosphate;
0.041 molar Disodium Hydrogen Phosphate
9.21 pH: 0.05 molar Sodium Tetraborate Decahydrate (Borax)
Measurement and Temperature Stability
When performing a calibration (see “Calibration Mode” on page 34), the analyzer checks for
stability in absolute measurement (Meas Stability) and temperature (Temp Stability) before
accepting a change. This section enables you to configure the time (Stability Time) in seconds
allowed to attain stability and the amount of fluctuation (Stability Var) in 0.1° increments
allowed during the calibration. Both Stability Time and Stability Var are configured
individually in Meas Stability and Temp Stability.
First, configure Meas Stability as On or Off. If you configure this as On, you need to specify the
Stability Time between 5 and 60 seconds (in 5-second increments) and the Stability Var
between 1 and 9. A longer time period and a smaller measurement value assures more stability
during calibration.
57
MI 611-225 – August 2009
5. Operation Via Local Display
Then repeat the procedure for Temp Stability. If you configure this as On, you need to specify
the Stability Time between 5 and 60 seconds (in 5-second increments) and the Stability Var
between 1 and 9 (°C or °F).
Automatic Hold
Refer to Figure A-16 on page 82.
This parameter enables to configure your analyzer to go into a Hold state whenever you are in
Calibration or Configuration mode without setting the Hold each time. It also automatically
removes the Hold when you leave Calibration or Configuration mode. To configure this
parameter, specify Automatic Hold as Present (to hold all values and states at their current
levels), Manual (to set all values and states at the levels specified in Hold mode), or Off (if you
choose not to use this feature).
Timeouts
Refer to Figure A-17 on page 83.
This section of the structure asks you to specify the time in which the instrument brings you back
to the Measure mode from another on-line mode (Status, Diagnostics, or Configuration) when
no keyboard input has occurred. In Measure mode, Timeouts also limits the time to view a
secondary display other than that configured in “Display” on page 45. The timeout can be
configured separately for front panel (Front Panel Timeout), remote (Remote Timeout), and
digital communication (Dig Comm Timeout) operation. The time can be specified between 5
and 999 seconds.
Date and Time
Refer to Figure A-18 on page 83.
The analyzer contains a real-time clock device that maintains the correct time and date even with
loss of power.
To configure this parameter, enter the Date in the form mm/dd/yyyy and the Time as hh:mm.
The time is on the basis of 24 hours.
Analyzer Names
Refer to Figure A-19 on page 83.
This section of the structure asks you to identify your analyzer. You can specify its Tag Number,
Tag Name, Location, and Device Name. Each can have a maximum number of characters listed
below.
Tag Number
Tag Name
Location
Device Name
12 characters
16 characters
14 characters
8 characters.
These identifications then appear in Status mode.
58
5. Operation Via Local Display
MI 611-225 – August 2009
Passcode
Refer to Figure A-20 on page 83.
Analyzer security is provided by the use of passcodes. This is described in detail in “Passcode
Access” on page 24. The passcodes for the three levels of security can be established in this
parameter. Enter the passcode for Level 1, Level 2, and Level 3. Each can be from 0000 to
9999.
Adjust LCD
Refer to Figure A-21 on page 83.
You can adjust the brightness on your display. Do this, in this section of the structure, by
changing the LCD Adjustment number using the Up and Down arrow keys. The numbers
(-9 to 0 to +9) shown on the display should only be used as an indication of where you are in the
range of adjustment. Use the Up arrow key to darken the display and the Down arrow key to
lighten it. When the display brightness is satisfactory, press Enter.
Default
Refer to Figure A-22 on page 83.
At the display Config to Defaults, you can leave the parameters as presently set by selecting Exit
to Config. Alternatively, you can reset your configuration back to the factory default settings by
selecting Load Defaults. The factory default settings are shown in bold print in Appendix B. If
you do the latter, you are asked Are You Sure? Respond with the Yes or No key.
! CAUTION
Loading factory defaults permanently removes your present configuration.
59
MI 611-225 – August 2009
5. Operation Via Local Display
Diagnostic Mode
The Diagnostic mode enables you to:
♦
View pending faults and temporarily suspend those faults
♦
Resume any suspended faults
♦
View the diagnostic history log
♦
Send the history log to a remote port
♦
Erase the history log.
To enter the Diagnostic mode, press the Mode key until the Diag indicator is illuminated. Press
Enter. Use the Mode key to exit Diagnostic mode and go to Measure mode. If there are no key
presses within the configured Timeout period, the analyzer reverts to Measure mode and the
outputs remain on hold.
MEASURE
STATUS
HOLD
CAL
CONFIG
DIAG
MODE INDICATOR
Manage diagnostic and fault messages
Diagnostic
View Faults
View Faults, ... Erase History
PARAMETER
CURRENT CHOICE
BEGINNING AND END OF CHOICE LIST
Figure 34. Sample Diagnostic Screen
Figure 35 shows the top-level Diagnostic mode structure diagram.
Select View Faults to view and possibly suspend each fault. Use the Up and Down (or Right)
arrow keys to view other faults. If there are no faults, the display reads No Faults. Press the Enter
key to suspend a displayed fault. The display asks for your passcode. An incorrect passcode returns
you to the start of the Diagnostic menu. A correct passcode causes the prompt Suspend Fault?
to be displayed. If you answer Yes, the message XXXXX Suspended is displayed where XXXXX
is the name of the fault that was displayed. After either a Yes or No reply, the next fault is shown.
When all faults have been suspended or if there are no faults, the message No Faults appears.
Each suspended fault is inhibited from reoccurring for one hour from the time the Diagnostic
mode is entered.
Select View History and use the arrow keys to view the diagnostic history.
Select Demand Report to send the history log out to a remote port. To do this, connect the
RS-232 port on your analyzer to your printer or a serial port on your computer. If you are
downloading the report to a computer, use the Hyperterminal accessory. Make sure the port
settings on your computer match those on your analyzer. See “Remote” on page 54.
If you are downloading the report to a printer, the printer must be a “serial port” printer and have
continuous paper feed. If you do not have this type of printer, you can download the report to a
computer and then print it.
Select Erase History to erase the history log. This function is passcode protected. If you are not
already in Level 1, the display asks for the Level 1 passcode. An incorrect passcode returns you to
60
5. Operation Via Local Display
MI 611-225 – August 2009
the start of the Diagnostic menu. A correct passcode causes the message History Erased to
appear.
Previous
DIAG
E
(View
Fault)
Yes
View
Faults
Resume
Faults
XXXXX
Suspended
No
Next
Diagnostic
View
History
Demand
Report
Erase
History
Suspend
Fault?
Any Suspended Faults
Are Resumed
Previous
(View
History)
Press YES for
Printed Report
Report Printed
Next
E
Enter Level 1
Passcode
E
Are You Sure?
Yes
History
Erased
No
Figure 35. Top Level Diagnostic Mode Structure
Remote Data Logging
The 875 Analyzer is designed to allow its RS232 serial port to be connected to a remote printer
having RS232 input. All fundamental measurements are reported to the RS232 port in a
printable format at periodic intervals. The exact interval is selected in the Configuration Mode
(see “Remote” on page 54). The first report is made immediately after power up, any calibration,
or any configuration change. Thereafter the update rate is used.
Connection between the 875 Analyzer and the printer is made with a 3 m (10 ft) Serial Cable
BS809WH, which has a connector at one end for plugging into the 875 Analyzer RS232 port and
a standard DB9 connector at the other end that is suitable for plugging directly into a PC port.
Different printers have different connectors and any adapters or null modems required between
the DB9 and the printer must be supplied by the user. The 875 Analyzer remote settings must be
configured to match the printer’s RS232 settings (for example, baud rate).
NOTE
Because the UNCERTAINTY and MV STATUS fields in the printout are not
implemented at this time, they show an output of ?.
You can similarly use a PC and dumb terminal program (for example, Hyperterminal) to produce
an electronic log of 875 Analyzer measurements. As with the printer, the above mentioned serial
cable is required and the RS232 settings in the terminal program must match those in the 875
Analyzer Remote configuration. Once the 875 Analyzer measurements start appearing in the
dumb terminal window, simply use the program’s log-to-file function to record them in the PC.
The standard format recorded in this way is difficult to use in a spreadsheet. Therefore, the
firmware in the 875PH Analyzer has an additional configuration parameter to select the report
format for a Printer or Spreadsheet (See Figure A-13). The spreadsheet option produces a
single line per update with all values separated by commas to generate a Comma Separated
61
MI 611-225 – August 2009
5. Operation Via Local Display
Variable (.CSV) format recognized by most spreadsheets. It is recommended that such a log file be
created with a .CSV extension. This format is difficult to read unless it is imported into a
spreadsheet program. The columns are:
Tag
Date,
Time,
Hold State,
Fault Severity (0=OK, 1=warning, 2=soft, 3=hard),
Active Measurement,
Measurement Units,
Active Temperature,
Temperature Units,
Active Absolute Measurement,
Absolute Units,
Once a set of .CSV updates is imported into a spreadsheet, it is easy to make trend plots or other
calculations.
62
6. Operation Via HART
Communicator
Description
The 875 Series Analyzers with HART communications may be configured, operated, and
calibrated using the HART Communicator.
The HART Communicator is used in two environments: Offline (not connected to an analyzer)
and Online (connected to an analyzer). The Main menu (shown in Figure 36) is displayed when
not connected to an analyzer. The Online Menu (shown in Figure 37) is displayed when
connected to an analyzer.
Overview of Top Level Menus
Figure 36 shows the Main menu structure of the HART Communicator. Figure 37 shows the top
level Online menu for the 875 Series Analyzers.
1. Offline
Compile a set of configuration data for downloading to an analyzer or
simulate an online connection to an analyzer without connecting to it.
2. Online
Configure, calibrate, or operate an online analyzer.
4. Frequency Device
Display the frequency output and pressure output of current to pressure
devices.
5. Utility
Configure communicator parameters such as auto polling and adjusting
contrast of communicator LCD. Also access to HART communicator
simulation
Figure 36. HART Communicator Main Menu
63
MI 611-225 – August 2009
6. Operation Via HART Communicator
1 Measure
Display the measurement (process variable) and related data.
2 Status
Display the measurement and system parameters
3 Hold
Hold the output at a determined value
4 Calibrate
Perform calibration functions.
5 Config
Perform configuration functions
6 Diag
Perform diagnostic functions
7 Logon Passcode
Enter the passcode
Figure 37. 875 Series Analyzers Top Level Online Menu
Connecting the HART Communicator
Connect the HART Communicator to the COM1(+) and COM2(-) terminals of the analyzer
that are shown in Figure 7 or any other convenient place in the loop. There must be a minimum
250 Ω load in the loop. Therefore, if you are configuring the analyzer on the bench (no loop load)
with a HART communicator, you must add a 250 Ω resistor.
RECORDER
COM1 (+)
CONTROLLER
875PH
COM2 (-)
Figure 38. HART Communicator Connection
Communicator Keyboard and Display
Refer to the HART user manual supplied with the communicator.
Offline Configuration
The offline configuration feature is not available at this time.
64
6. Operation Via HART Communicator
MI 611-225 – August 2009
Online Configuration
Online Flowchart
2 Online
1 MEASURE
2 STATUS
3 HOLD
4 CALIBRATE
1 Meas
2 Abs
3 Temp
4 AO1
5 HART AO
1 Status
2 History Status
Off
On Present
On Manual
Save/Abort
Bench
Solution
Auto Service 1*
Auto Service 2*
Cal Analog
Logon Passcode
* if enabled
5 CONFIG
6 DIAG
1 View Faults
2 Resume Faults
3 View History
4 Erase History
5 Demand Report
6 DD Rev
7 Logon Passcode
Temp
Abs
ATC Resistance
Slope %
Slope mV
Asymmetry
Glass Bulb
Reference
Pre amp
Cal Person
Cal Date
Cal Type
Cal Temp
Cal Point One
Cal Point One
Cal Point Two
Cal Point Two
AO1
HART AO
Tag Name
Location
Sales Order
MS Code
Serial Number
Software Version
Dev Name
Model
Line Frequency
Time
Date
Save/Abort
Measurement
Sensor
Temp Comp
Display
Save/Abort
Analog 1
HART
Diags
Autoservice
Save/Abort
Alarms
Hold Config
Remote
Cal
Timeouts
Save/Abort
Date Time
Analyzer Names
Passcodes
LED Adjust
Save/Abort
Default
Logon Passcode
Figure 39. Online Configuration Flowchart
65
MI 611-225 – August 2009
6. Operation Via HART Communicator
Online Modes
Measurement
To display the measurement on the communicator, select 1 Measure from the Online menu.
The display will show:
1 Meas
The measurement value in engineering units.
2 Abs
The uncompensated measurement in millivolts.
3 Temp
The temperature measurement in engineering units.
4 A01
Analog Output 1 (PV) in mA.
5 HART AO HART Analog Output (SV) in mA.
You can then select what you wish to display.
Status
To display the status on the communicator, select 2 Status from the Online menu. You can then
select to view the Current Status or the History Status and view the status of a number of
parameters.
Hold
To access the Hold functions from the communicator, select 3 Hold from the Online menu.
Access requires you to have previously entered the proper passcode. You can then select Off to not
use the Hold function, Present to hold all values and states at their current value, and Manual to
set values and states at desired levels. In Manual, the Hold function does not take effect until all
the values are entered.
Calibrate
To access the Calibration functions from the communicator, select 4 Calibrate from the Online
menu. Access requires you to enter the proper passcode. You can then select Bench, Solution, or
Cal Analog calibration. You can also start Auto Service 1 or Auto Service 2 (if enabled). If
you select Cal Analog, you must further define the output as AO1 or HART.
NOTE
If Save/Abort appears in the Calibration menu, there are configuration changes
pending. Save/Abort must be selected before any calibration is allowed.
Configure
To access the Configuration functions from the communicator, select 5 Config from the Online
menu. Access requires you to enter the proper passcode. You can then configure a number of
parameters from the menu that is presented.
NOTE
Before leaving the Configure mode, you must activate Save/Abort if it is visible.
66
6. Operation Via HART Communicator
MI 611-225 – August 2009
Diagnostics
To access the Diagnostic functions from the communicator, select 6 Diag from the Online menu.
You can then select View Faults, Resume Faults, View History, Erase History, Demand
Report, or DD Rev. The proper passcode is required to suspend a fault or to erase the history log.
NOTE
The DD Rev may not change with upgrade to subsequent firmware versions.
Logon Passcode
To access certain functions from the HART Communicator, you must enter the Level 1, Level 2,
or Level 3 passcode (that was configured into the analyzer) into the HART Communicator. To do
this, select 7 Logon Passcode from the Online menu.
NOTE
7 Logon Passcode can also be used to ‘lock’ the analyzer by entering an invalid
passcode.
67
MI 611-225 – August 2009
6. Operation Via HART Communicator
Glossary of Online Parameters
Parameter
Measure Mode
Abs
AO1 (a)
HART AO (a)
Meas
Temp
Status Mode (b)
Abs
AO1
Asymmetry
ATC Resistance
Cal Date
Cal Person
Cal Point One
Cal Point Two
Cal Temp
Cal Type
Date
Dev Name
Glass Bulb
HART AO
History Status
Line Frequency
Location
Model
MS Code
Pre amp
Reference
Sales Order
Serial Number
Slope %
68
Explanation
Displays the absolute (uncompensated) measurement
Displays the Analog Output 1 (PV) measurement in mA or volts
Displays the HART Analog Output (SV) measurement in mA
Displays the measurement in specified engineering units
Displays the process temperature measurement in specified
engineering units
Displays the absolute measurement
Displays the value of Analog Output 1 (PV) in mA or volts
Displays the asymmetry potential (mV difference between the
theoretical isopotential point and the actual point due to the most
recent calibration
Displays the resistance of the temperature compensator
Displays the date of the last calibration in the form mm/dd/yy
Displays the name of the last calibrator
Displays the values at calibration point one in pH and then in mV
Displays the values at calibration point two in pH and then in mV
Displays the temperature calibration type of last calibration
(default, custom, solution, failsafe, manual)
Displays the type of the last calibration (bench, solution, factory
default)
Displays the current date
Displays the device name of the analyzer
Displays the glass bulb resistance
Displays the HART analog output (SV) in mA
Displays up to 10 of the most current history log entries
(if present)
Displays the ac line frequency of the analyzer
Displays the location of the measurement
Displays the model number of the analyzer
Displays the analyzer model code
Displays the preamplifier power
Displays the reference junction resistance
Displays the analyzer sales order number
Displays the analyzer serial number
Displays the deviation in percent of the slope of the most recent
calibration compared to the standard
6. Operation Via HART Communicator
Parameter
Slope mV
MI 611-225 – August 2009
Explanation
Displays the change in the mV/pH or mV/decade of the most
recent calibration
Displays the software version of the analyzer
Displays the current status of the analyzer
Displays the tag name of the analyzer
Displays the process temperature of the sensor
Displays the current time
Software Version
Status
Tag Name
Temp
Time
Hold Mode
Off
Used to release the analyzer from Hold state
On Manual
Used to hold all values and states at desired levels
On Present
Used to hold all values and states at their current level
(c)
Calibrate Mode
Auto Service n
Used to perform an automatic cleaning of the sensor and/or a 1point or 2-point calibration as configured
Bench
Used to perform a calibration using theoretical inputs or to return
to the stored factory default calibration
Cal Analog
Used to tune the 4 mA and 20 mA values of the AO1 or HART
analog outputs
Logon Passcode Used to enter the passcode to access Calibration mode
Pure H2O
Used to perform a pure water calibration.
Solution
Used to perform a calibration using real solutions
Config Mode
Alarms
Used to specify each alarm to represent measurement, temperature,
absolute, or a fault and then subparameters associated with each
Analog 1
Used to specify the Analog 1 output (PV) to represent
measurement, temperature, or absolute; minimum (LRV) and
maximum (URV) range values; and failsafe output
(d)
Analyzer Names Used to specify the tag number, tag name, location, and device
name
(e)
Used to configure auto service related parameters
Auto Service
Cal
Used to specify the options to be used with a solution calibration
Datetime
Used to set the date and time for the real time clock
Default
Used to reset the configuration back to the factory default values
Diags
Used to specify what fault messages can appear on your display
Display
Used to configure the display as single, dual, or scan and then
subparameters associated with each
HART
Used to specify the HART outputs (SV, TV, FV) to represent
measurement, temperature, or absolute; minimum (LRV) and
maximum (URV) range values; and failsafe output.
Also used to specify the Polling Address and the Preambles value.
69
MI 611-225 – August 2009
Parameter
Hold Config
LED Adjust
Logon Passcode
Measurement
Passcodes
Remote
Sensor
Temp Comp
Timeouts
6. Operation Via HART Communicator
Explanation
Used to configure all values and states to be held at their current
level (On Present) or at a desired level (On Manual) when triggered
by a digital signal or when going into Calibration or Configuration
mode
Used to adjust the brightness of the front panel display
Used to enter the passcode to access Configuration mode
Used to configure units, damping, and other measurement
parameters
Used to establish or change the Level 1, 2, and 3 passcodes
Used to configure parameters associated with a remote personal
computer or RS232 printer
Used to configure sensor related parameters
Used to configure the temperature compensation for the chemical
being measured
Used to specify the time for front panel, remote, and digital
communication timeouts
Diag Mode
DD Rev
Demand Report
Erase History
Logon Passcode
Used to display the DD version
Used to send the history log out to the remote RS232 port
Used to erase the history log (requires Level 1 passcode)
Used to enter the passcode to perform functions requiring a
passcode
Logon Passcode Mode
Resume Faults
Used to resume any suspended faults
View Faults
Used to view any faults and possibly suspend each fault
View History
Used to view the diagnostic history
(a) If configured Off, display reads NaN.
(b) At message “Ignore next 50 occurrences of status?”, reply “YES”.
(c) If a disconnect occurs during calibration, recycle power or attempt another calibration.
(d) Use upper case letters for Tag Number.
(e) Auto Service monthly must schedule days 16 at a time in two entries.
70
7. Maintenance
! WARNING
This product contains components that have critical safety characteristics. Do not
substitute components. Replace components only with identical, factory-supplied
components. Component substitution may impair the electrical safety of this
equipment and its suitability for use in hazardous locations.
! CAUTION
Your analyzer uses printed wiring assemblies with MOS devices that are highly
susceptible to damage from electrostatic discharge. Relatively low static potential can
rupture MOS devices resulting in shorted gate or degraded device characteristics.
It is recommended that assemblies with MOS devices be handled with the user
earthed (grounded) by wearing a conductive wrist strap or by standing on an ESD
mat.
Maintenance of the 875PH Analyzer is limited to the replacement of the display assembly and
printed wiring assemblies. See PL 611-158 (Style A) or PL 611-163 (Style B) for part numbers.
Attempts by the user to repair printed wiring assemblies could result in damage and voiding of the
warranty. The recommended repair procedure is replacement of the PWAs or return of the PWAs
to the factory for repair.
71
MI 611-225 – August 2009
72
7. Maintenance
Appendix A. Structure Diagrams
C
CONFIGURE
E
Measurement
Sensor
Temp Comp
(If not ORP)
E
E
E
Display
Analog 1
Analog 2
(if not HART)
HART Analog
(If installed)
HART TV
(If installed)
HART FV
(If installed)
Diagnostics
E
E
E
E
E
E
Signaled Hold
Alarm 1
E
E
E
E
Alarm 2
E
Remote
HART Digital
(if installed)
Cal Parameters
E
E
Automatic Hold
E
Timeouts
E
Date
and Time
Names
Analyzer Names
Passcodes
C3
C4
C5
C5
C6
C6
C6
C8
C9
C10
C11
C11
C12
C13
C14
C15
C16
C17
E
E
E
LCD Adjustment
E
Factory Defaults
C2
C9
Auto Service 1
Auto Service 2
C1
C18
C19
C20
C21
NOTE: Before entering Configuration mode, you must first enter a proper passcode. The factory
default passcode is 0800. Then you must pick View (to view configuration parameters) or Change
(to change configuration parameters) from the picklist presented.
Figure A-1. Configuration Top Level Structure
73
MI 611-225 – August 2009
C1
Appendix A. Structure Diagrams
Units
pH
0.1 pH
E
mV (ORP)
0.01 pH
E
ppm (ISE)
E
Resolution
E
E
Custom
E
Scale
Chemical Comp
0.9999
Standard
9.999
Custom
99.99
999.9
9999
Cust Units
XXXXX
E
Custom Scale
E
Num of Points
E
0.9999
9.999
99.99
Base/Point n
E
Custom/Point n
E
999.9
9999
Repeat for each point
Damping
None
5 Seconds
10 Seconds
20 Seconds
40 Seconds
120 Seconds
Figure A-2. Configure Measurement Structure
74
E
C
Appendix A. Structure Diagrams
C2
MI 611-225 – August 2009
Electrode
E
Glass
E
E
Antimony
Other
Slope
Isopotential
Positive
Negative
Valence
Monovalent
Divalent
Temp Type
If Units = mV or Custom
E
RTD
BALCO
E
RTD Type
E
2 Wire 100 Ω
2 Wire 1000 Ω
3 Wire 100 Ω
3 Wire 1000 Ω
E
Temp Units
Temp Mode
E
Celsius
Automatic
Fahrenheit
Manual
E
C
Fail Signal
E
E
Manual
C
Figure A-3. Configure Sensor Structure
C3
Temp Comp
Standard
Ammonia
Custom
Reference Temp
E
E
E
E
Num of Points
E
Temp/Point n
E
E
Value/Point n
C
Repeat for each point
Figure A-4. Configure Tempcomp Structure
75
MI 611-225 – August 2009
C4
Appendix A. Structure Diagrams
Display
Line n
(n = 1 or Blank)
E
Single
E
Dual
E
Measurement
Scan
E
Line 2
Temperature
Absolute
Analog 1
2 Seconds
Measurement
E
Temperature
Absolute
E
E
E
E
E
Analog 1
E
Analog 2 or
HART
Scan Time
E
Analog 2 or
HART
E
5 Seconds
10 Seconds
20 Seconds
If Line Mode = Dual
E
Bargraph Min
Scan Data
E
Exit
E
√ Measurement
√ Temperature E
E
√ Absolute
E
√ Analog 1
Analog 2 or
HART
E
Bargraph Max
E
If Line Mode = Single
CC
Choices selected have preceding “√”.
Pressing Enter toggles choice as selected or not selected.
Figure A-5. Configure Display Structure
C5
Analog n
(n = 1 or 2)
Off
Measurement
Temperature
E
Min@4mA/Analog n
E
Max@20mA/Analog n
Absolute
E
Failsafe/Analog n
E
Off
On
Pulse
E
DC mA/Analog n
E
Average mA/Analog n
E
E
CC
Figure A-6. Configure Analog Structure
76
Appendix A. Structure Diagrams
C6
MI 611-225 – August 2009
E
HART (See Note)
E
Min mA (HART)
Max mA (HART)
Off
E
Measurement
Failsafe (HART)
Temperature
Absolute
Off
E
DC mA (HART)
On
E
CC
NOTE: HART Analog, HART TV, or HART FV
Figure A-7. Configure HART Structure
C8
Diagnostics
E
Select Diag
Set Diag Limits
E
Select Diagnostic
E
Exit
C8
E
√All Diags
√Leakage
√ATC Short
√ATC Open
E
E
E
E
√4-20 Range
√Comp Range
√Meas Range
√ Glass
√Low Slope
√Preamp
√Aging
√Coating
Choices selected have preceding “√”.
Pressing Enter toggles choice as selected or not selected.
E
E
E
E
E
E
E
(if Glass)
Glass Lo Limit
E
Glass Cutoff Temp
E
(if Low Slope)
Slope Limit
E
(if Preamp)
Preamp Limit
E
(if Coating)
Coat Limit
E
Figure A-8. Configure Diagnostics Structure
77
MI 611-225 – August 2009
C9
Appendix A. Structure Diagrams
Auto Service Type/#n
Off
C
E
Auto-Clean
Service Initiate/#n
E
One Point Cal
√
√
√
√
√
E
E
(if √ Diagnostic)
E
E
Input Trigger/#n
E
Exit
E
Two Point Cal
Clean + 1Pt Cal
Clean + 2Pt Cal
(if √ Signaled)
E
All Selects
Manual
Signaled
Scheduled
Diagnostic
E
(if √ Scheduled)
Select Diagnostic/#n
High
Exit
Low
√
√
√
√
E
C9A C9B
E
All Selects
Low Slope
Coat
Aging
(if any cal)
(if no cal)
Solutions/#n
(if 1 Pt Cal)
E
User Solutions
Smart Cal Buff*
*Only appears for
Two Point Cal or
Clean + 2Pt Cal
E
Solution Value/#n
E
(if 2 Pt Cal)
Solution Value 1/#n
E
Solution Value 2/#n
T1 Setup Time/#n
E
(if Service Type = Auto-Clean)
(if Service Type =
any calibration)
T2 Hold Time/#n
Choices selected have preceding “√”.
Pressing Enter toggles choice as selected or not selected.
E
T3 Setup Time/#n
E
T4 Hold Time/#n
(if Service Type = any
1-point calibration)
E
E
T5 Setup Time/#n
Trip State
E
Service Hold/#n
Energized
Off
Deenergized
On Present
E
On Manual
C
Figure A-9. Configure Auto Service Structure
78
Appendix A. Structure Diagrams
MI 611-225 – August 2009
C9A
Service Schedule/#n
E
Daily
Weekly
Time of Day/#n
hh:mm
E
E
E
Monthly
Period by Days
Period by Hours
E
E
Period
of
Hour/#n
Period
of
Day/#n
Day of
Month
E
Exit
Exit
E
E
Day of Week
√ All Days
√ Monday
√ Tuesday
√ Wednesday
√ Thursday
√ Friday
√ Saturday
√ Sunday
√ All
√1
√2
√3
Start Date
mm/dd/yyyy
E
Start Time
hh:mm
•
•
E
E
•
√ 28
Choices selected have preceding “√”.
Pressing Enter toggles choice as selected or not selected.
C9B
Figure A-10. Configure Auto Service Structure (Continued)
C10
Signaled Hold Mode
E
Signaled Input Trig
Off
High
On Present
Low
E
C
On Manual
Figure A-11. Configure Signaled Hold Structure
79
MI 611-225 – August 2009
C11
Appendix A. Structure Diagrams
Alarm/Alm n
(n = 1 or 2)
Off
Measurement
Temperature
E
E
Absolute
E
Trip High
On Fault
E
Trip Low
E
Trip/Alm n
Control/Alm n
E
Hysteresis
E
Timed
Trig Time n
Set Point n
Hysteresis n
E
On Time n
Fault Act/Alm n
Meas Value
Off Time n
Faults/Alm n
E
E
E
Meas and Fault
Valid Meas
E
E
Exit
√ All Faults
√ Analyzer Faults
√ Comm Faults
√ Leakage
√ ATC Short
√ ATC Open
√ 4-20 Range
√ Comp Range
√ Meas Range
√ Glass
√ Low Slope
√ Preamp
√ Aging
√ Coat
Trip State/Alm n
Energized
Deenergized
Figure A-12. Configure Alarm Structure
80
CC
Appendix A. Structure Diagrams
MI 611-225 – August 2009
Configure Remote
Port Settings
E
E
Update Rate
Data & Parity
Baud Rate
E
E
E
C12
Stop Bits
300
8, None
1
600
1200
8, Odd
2
8, Even
7, Odd
2400
7, Even
4800
9600
19200
Update
E
Format
Off
Printer
5 Seconds
10 Seconds
Spreadsheet
E
30 Seconds
60 Seconds
120 Seconds
300 Seconds
600 Seconds
1200 Seconds
3600 Seconds
Figure A-13. Configure Remote Structure
C13
HART Digital
Poll Address
Preambles
C
Figure A-14. Configure HART Digital Structure Diagram
81
MI 611-225 – August 2009
C14
Appendix A. Structure Diagrams
Smart Cal Buffs
E
American
E
Nist
E
European
E
Special
Special
Buffer 1
Buffer 2
Buffer 3
E
E
Buf # 1 Num Points
E
Buf #1 Temp n
E
Buf #1 Value n
E
E
Repeat for each point
E
Buf #2 Num Points
Buf #2 Temp n
E
Buf #2 Value n
E
Repeat for each point
E
Buf #3 Num Points
Buf #3 Temp n
E
Buf #3 Value n
E
Repeat for each point
Tolerance
XXXX
E
Meas Stability
E
Off
E
On
Stability Time
E
Stability Var
E
Temp Stability
E
Off
C
E
On
Stability Time
E
Stability Var
Figure A-15. Configure Cal Parameters Structure
C15
Automatic Hold
E
C
Off
Manual
Present
Figure A-16. Configure Automatic Hold Structure
82
E
Appendix A. Structure Diagrams
C16
MI 611-225 – August 2009
Front Panel Timeout
E
Remote Timeout
E
Dig Comm Timeout
(if installed)
CC
Figure A-17. Configure Timeout Structure
C17
E
Date
mm/dd/yyyy
E
Time
hh:mm
C
Figure A-18. Configure Date and Time Structure
C18
Tag Number
E
E
Tag Name
E
Location
Device Name
E
C
Figure A-19. Configure Analyzer Names Structure
C19
Level 1
E
E
Level 2
C
Level 3
Figure A-20. Configure Passcode Structure
C20
E
LCD Adjustment
0
E
C
Figure A-21. Configure Adjust LCD Structure
C21
Config To Defaults
Exit to Config
Load Defaults
E
E
Are You Sure?
Yes or No
C
Figure A-22. Configure Default Structure
83
MI 611-225 – August 2009
84
Appendix A. Structure Diagrams
Appendix B. Configuration Table
This appendix contains information that helps you configure your analyzer. The information is
presented in the form of a table containing each prompt/parameter, its limits, and its factory
default value. It also provides space for you to record your specific configuration and notations.
NOTE
Bold print in the Factory Configuration column indicates the configuration
resulting from the Configure Factory Defaults menu.
Identifies the structure diagram
that contains a specific
prompt/parameter
Limits of each
parameter
Prompts to parameters in the order in
which they are displayed when you step
through the menu structure
Figure
Prompt/Parameter
Parameter Limits
A-1
Config
Measurement
Sensor
Temp Comp
Display
Analog 1
Analog 2
(if not HART or Analog)
HART Analog (if installed)
Diagnostics
Auto Service 1
Auto Service 2
Signaled Hold
Alarm 1
Alarm 2
HART Digital
Remote
Cal Parameters
Automatic Hold
Timeouts
Date and Time
Analyzer Names
Passcodes
LCD Adjustment
Factory Defaults
A-2
Space for you to
record your specific
configuration
Standard factory configuration as shipped
from IPS
Factory
Configuration
User
Configuration
Additional information and space for
your notations
Remarks and Notes
Measurement
Measurement
---
---
Units
pH, mV(ORP), ppm (ISE),
Custom
pH
Resolution
0.1 pH, 0.01 pH
0.01
Scale
0.9999, 9.999, 99.99, 999,9, 0.9999
9999
Chemical Comp
Standard, Custom
If Units = pH
If Units = PPM
Standard
85
MI 611-225 – August 2009
Appendix B. Configuration Table
Factory
Configuration
Figure
Prompt/Parameter
Parameter Limits
A-2
(Cont.)
Cust Units
(5 characters maximum)
Custom Scale
0.9999, 9.999, 99.99, 999.9, 0.9999
9999
A-3
A-5
86
Remarks and Notes
If Units = Custom
Num of Points
2 through 21
2
Base/Point n
0 through 2000
0
Custom/Point n
0 through 2000
0.0000
Damping
None, 5, 10, 20, 40, 120
Seconds
None
Sensor
---
---
Electrode
Glass, Antimony, Other
Negative, Positive
Glass
If Units = pH
If Units = ppm
Slope
mv/pH
mV/dec
-59.16
If Electrode = Other
If Electrode = Other
If Units = ppm
Valence
Monovalent, Divalent
Isopotential
-2.0 to +16.0 pH
-2000 to +2000 mV
7.0
1.0
Temp Type
RTD, BALCO
RTD
2 Wire 100Ω,
2 Wire 1000Ω,
3 Wire 100 Ω,
3 Wire 1000Ω
3 Wire 1000Ω
RTD Type
A-4
User
Configuration
If Units = ppm
Temp Type = RTD
Temp Unit
Celsius, Fahrenheit
Celsius
Temp Mode
Automatic, Manual
Automatic
Fail Signal
-20 through +200 by 0.1°C
-4 through +392 by 0.1°F
25.0
Temp Mode = Auto
Manual
-20 through +200 by 0.1°C
-4 through +392 by 0.1°F
0.00
Temp Mode = Manual
Temp Comp
Standard, Ammonia,
Custom
Standard
Ref Temp
-20 through +200 by 0.1°C
-4 through +392 by 0.1°F
0.00
Num of Points
2 through 21
2
Temp/Point n
-20 through +200 by 0.1°C
-4 through +392 by 0.1°F
0.00
If Temp Comp =
Custom
Value/Point n
Current Scale
0.0
Display
Single, Dual, Scan
Dual
Scan Time
2, 5, 10, 20
2
Scan Data
Exit, Measurement,
Temperature, Absolute,
Analog 1, Analog 2 (or
HART)
None selected
Line, Line 1, or Line 2
Measurement, Temperature, Line or Line 1 =
Absolute, Analog 1, Analog Measurement
Line 2 =
2 (or HART)
Measurement
Line if Line Mode =
Single,
Line 1 or Line 2 if Line
Mode = Dual
Bargraph Min
See Scale
0
Bargraph Max
See Scale
14
If Line or Line 1 =
Measurement,
Temperature, or
Absolute
If Display = Scan
Appendix B. Configuration Table
MI 611-225 – August 2009
Figure
Prompt/Parameter
Parameter Limits
A-6
Analog n
Off, Measurement,
Temperature, Absolute
A-7
A-8
Factory
Configuration
User
Configuration
Remarks and Notes
Analog 1 =
Measurement
Analog 2 =
Measurement
Min mA/Analog n
0.0
If Analog n ≠ Off
Max mA/Analog n
14.0
If Analog n ≠ Off
Failsafe/Analog n
Off, On, Pulse
Off
dc mA/Analog n
3.8 to 20.5
20.50
If Failsafe = On
Average mA/
Analog n
3.8 to 20.5
10.00
If Failsafe = Pulse
HART Analog
Off, Measurement,
Temperature, Absolute
Measurement
Min mA (HART)
See Scale
0.0
Max mA (HART)
See Scale
Full Scale
Failsafe (HART)
Off, On
Off
DC mA (HART)
3.8 to 20.5
20.50
If Failsafe = On
HART TV
Same as for
HART Analog
Off
If HART installed
HART FV
Same as for
HART Analog
Off
If HART installed
Diagnostics
Select Diag, Set Diag Limits Select Diags
Select Diag
All Diags disabled
Exit, All Diags, Leakage,
ATC Short, ATC Open, 4-20
Range, Comp Range, Meas
Range, Glass, Low Slope,
Preamp, Aging, Coating
All Diags
Enabled, Disabled
Disabled
Leakage
Enabled, Disabled
Disabled
ATC Short
Enabled, Disabled
Disabled
ATC Open
Enabled, Disabled
Disabled
4-20 Range
Enabled, Disabled
Disabled
Comp Rng
Enabled, Disabled
Disabled
Meas Rng
Enabled, Disabled
Disabled
Glass
Enabled, Disabled
Disabled
Set Diag Limits
---
---
Glass Lo Limit
0.1 through 1.1 by 0.1 mΩ
0.5 mΩ
Glass Cutoff Temp
-20 through +200°C
-4 through 392°F
50°C
122°F
Low Slope
Enabled, Disabled
Disabled
Slope Limit
0 through 100 by 1%
80%
Preamp
Enabled, Disabled
Disabled
Preamp Limit
0 through 70 mW by 1 mW
40 mW
Aging
Enabled, Disabled
Disabled
Coat
Enabled, Disabled
Disabled
Coat Limit
0 through 100 kΩ by 10 kΩ 10 kΩ
If Glass, Low Slope,
Preamp, and/or Coat
enabled
If Glass enabled
If Low Slope enabled
If Preamp enabled
If Coat enabled
87
MI 611-225 – August 2009
Appendix B. Configuration Table
Factory
Configuration
User
Configuration
Figure
Prompt/Parameter
Parameter Limits
A-9
Auto Service Type
Off, Auto-Clean,
One Point Cal,
Two Point Cal,
Clean + 1Pt Cal, Clean +
2Pt Cal
Off
Service Initiate
Exit, All Selects, Manual,
Signaled, Scheduled,
Diagnostic
All disabled
Input Trigger
High, Low
High
Select Diagnostic
Exit, All Selects, Low Slope, All disabled
Coat
Scheduled
Daily, Weekly, Monthly,
Period by Days, Period by
Hours
Daily
If Service Initiate =
Scheduled
Period of Hours
1 to 8760
1
If Scheduled = Period
by Hours
Period of Days
1 to 365
1
If Scheduled = Period
by Days
Start Date
1/01/1999 to 12/31/2098
1/01/2000
Start Time
00:00 to 23:59
00:00
If Scheduled = Period
by Days or Period by
Hours
Day of Month
All Days and
1 through 28
1
If Scheduled =
Monthly
Day of Week
All Days and Monday
through Sunday
All Disabled
If Scheduled =
Weekly
Time of Day
00:00 to 23:59
00:00
Solutions
User Solutions, Smart Cal
Buff
User Solutions
Solution Value, Solution
Value n
-2 through +16 pH
-2010 through +2010 mV
1 to Full Scale
0.0
T1 Setup Time
15-999
15
T2 Hold Time
15-999
15
T3 Setup Time
15-999
15
T4 Hold Time
15-999
15
T5 Setup Time
15-999
15
Trip State
Energized, Deenergized
Energized
Service Hold
Off, On Present, On Manual Off
Signaled Hold
---
---
Signaled Hold Mode
Off, On Present,
On Manual
Off
Signaled Input Trig
High, Low
High
A-11
88
Remarks and Notes
If Auto Service Type ≠
Off
If Service Initiate =
Signaled
If Service Initiate =
Diagnostic
If Units = pH
If Units = mV (ORP)If
Units = ppm (ISE)
If any 1 Point Cal
If any 2 Point Cal
Appendix B. Configuration Table
MI 611-225 – August 2009
Factory
Configuration
User
Configuration
Figure
Prompt/Parameter
Parameter Limits
A-12
Alarm n
Off, Measurement,
Temperature, Absolute, On
Fault
Off
Trip
Trip High, Trip Low
Trip High
Set Point
See Scale
10.0
Control
Hysteresis, Timed
Hysteresis
Hysteresis
See Scale
0
If Control = Hysteresis
Trig Time
00.00 to 99.99
0.0
On Time
00.00 to 99.99
0.0
If Control = Timed
Time in minutes
Off Time
00.00 to 99.99
0.0
Alarm Fault Act
Meas Value, Meas and
Fault, Valid Meas
Valid Meas
Fault
All Faults
Exit, All Faults, Analyzer
Faults, Comm Faults,
Leakage, Temp, ATC Open,
4-20 Range, Comp Range,
Meas Range, Glass, Low
Slope, Preamp, Aging, Coat
Tripped State
Energized,
De-energized
De-energized
Remote Options
Port Settings,
Update Rate
---
Baud Rate
300, 600, 1200, 2400, 4800, 19200
9600, 19200
Data & Parity
7 Odd, 7 Even, 8 Odd,
8 Even, 8 None
8 None
Stop Bits
1, 2
1
Update
Off, 5, 10, 30, 60, 120, 300,
600, 1200, 3600
600
If Remote Options =
Update
Format
Printer, Spreadsheet
If HART is installed
A-13
A-14
A-15
A-16
HART Digital
---
---
Poll Address
0 to 16777215 by 1
0
Preambles
5 to 255 by 1
5
Cal Parameters
American, NIST, European,
Special
American
Tolerance
0.0 through 2.0
0.5
Meas Stability
Off, On
Off
Stability Time
5 through 60 by 5
5
Stability Var
1 through 9 by 1
9
Temp Stability
Off, On
Off
Stability Time
5 through 60 by 5
5
Stability Var
1 through 9 by 1
9
Special
Buffer1, Buffer2, Buffer3
Buf #n Num Points
2 through 21
2
Buf #n Temp n
-20 through +200 by 0.1°C
-4 through +392 by 0.1°F
0.0°C
32.00°F
Buf #n Value n
-2.00 through +16.00 pH
0.0
Automatic Hold
Off, Present, Manual
Manual
Timeouts
---
---
Front Panel Timeout
5 to 999
600
Remote Timeout
5 to 999
600
Dig Comm Timeout
5 to 999
600
Remarks and Notes
Accessible from Level
1 Passcode only
If Alarm Fault Act =
Meas and Fault
If Remote Options =
Port Settings
pH
If Meas Stability
= On
If Temp Stability
= On
If Cal = Special
If Dig Comm installed
89
MI 611-225 – August 2009
Appendix B. Configuration Table
Figure
Prompt/Parameter
Parameter Limits
Factory
Configuration
A-17
Date and Time
---
---
A-18
A-19
Date
1/01/1999 to 12/31/2098
Real date
Time
00:00 to 23:59
Real time
Analyzer Names
---
---
Tag Number
12 characters
(blank)
Tag Name
16 characters
(blank)
Location
14 characters
(blank)
Device Name
8 characters
(blank)
Passcodes
---
---
Level 1
0000 to 9999
0800
Level 2
0000 to 9999
0800
Level 3
0000 to 9999
0800
A-20
LCD Adjustment
-9 to 0 to +9
0
A-21
Config To Defaults
Exit to Config,
Load Defaults
Exit to Config
90
User
Configuration
Remarks and Notes
24-hour format
Index
B
Bench Calibration 38
C
Calibration Mode 34
Changing Data 25
Configuration 41
Configuration Mode 41
Configuration Structure Diagrams 73
Configuration Table 85
Controls and Indicators 21
D
Diagnostic Mode 60
Diagnostics 29
Display 22
F
Fault Messages 23
H
Hold Mode 32
I
Identification 11
Installation 11
Introduction 1
M
Maintenance 71
Measure Mode 27
Mode
Calibration 34
Configuration 41
Diagnostic 60
Measure 27
Status 29
Mounting 12
91
MI 611-225 – August 2009
Index
O
Operation
Via HART Communicator 63
Via Local Display 21
P
Panel Mounting 12
Passcode Access 24
Pipe Mounting 13
Product Safety Specifications 9
Q
Quick Start
3
R
Reference Documents
1
S
Solution Calibration 35
Specifications 7
Status Mode 29
Structure Diagrams 73
Surface Mounting 13
U
Unpacking 11
W
Wiring 14
ISSUE DATES
OCT 2000
MAR 2003
OCT 2005
AUG 2006
NOV 2006
AUG 2009
Vertical lines to the right of text or illustrations indicate areas changed at last issue date.
IPS Logo
IPS Corporate Headquarters
5601 Granite Parkway Suite 1000
Plano, TX 75024
www.ips.invensys.com
Invensys, Foxboro, I/A Series, and IPS Logo are trademarks of
Invensys plc, its subsidiaries, and affiliates.
All other brand names may be trademarks of their respective
owners.
Foxboro Global Client Support
Inside U.S.: 1-866-746-6477
Outside U.S.: 1-508-549-2424 or
contact your local Foxboro
representative.
Facsimile: 1-508-549-4999
Copyright 2000-2009 Invensys Systems, Inc.
All rights reserved
MB 100
Printed in U.S.A.
0809


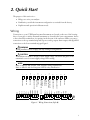


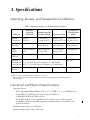

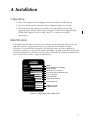
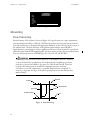
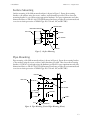

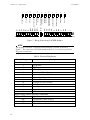
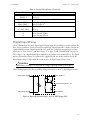
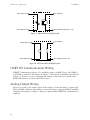
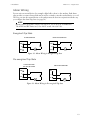

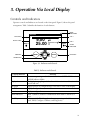
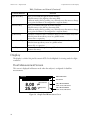


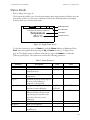
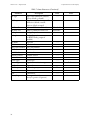
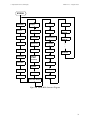
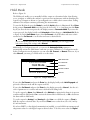
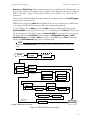
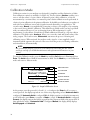
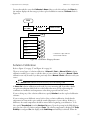
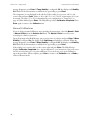
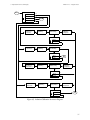
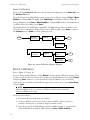
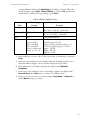

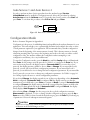
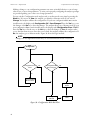

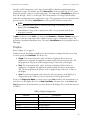

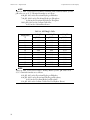
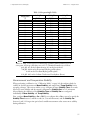

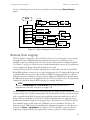
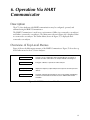
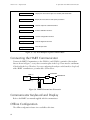
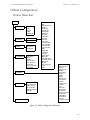

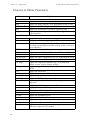
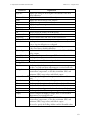
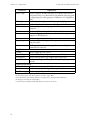


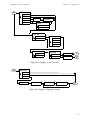
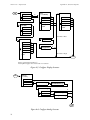
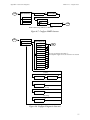


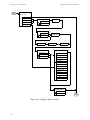

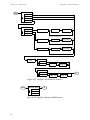


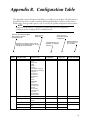
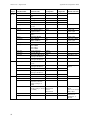
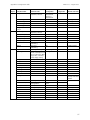
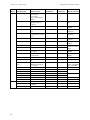
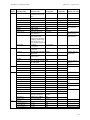
![[MI 611-227] 875 Series Intelligent Analyzers - Operation](http://vs1.manualzilla.com/store/data/005865143_1-5593040b74ad0b0d98c6c04fef25d9eb-150x150.png)

![[MI 611-226] Remote Communications Program for 875](http://vs1.manualzilla.com/store/data/005776709_1-db0171e7d4f27da6c3915e3a18df8198-150x150.png)
![[MI 611-224] Model 875EC Intelligent Electrochemical](http://vs1.manualzilla.com/store/data/005702659_1-332404cfb3aec96feb6d622b9bb58c04-150x150.png)


![MI 611-214] PH12 Series pH Sensors and Accessories](http://vs1.manualzilla.com/store/data/006880291_1-d8cfb499f5d4ccda8442b39d1f113a5e-150x150.png)