1
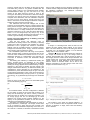
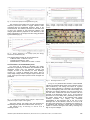
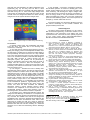
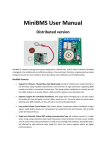
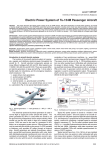
Paulo G. PEREIRINHA1,2,3, João P. TROVÃO1,2, Alekssander SANTIAGO2 Polytechnic Inst. of Coimbra (1) Inst. for Systems and Computers Engineering at Coimbra (2), Portuguese Electric Vehicle Association (3) Set up and test of a LiFePO4 battery bank for electric vehicle Abstract. This paper deals with the set up and characterization tests of a lithium iron phosphate, LiFePO4, battery bank for an electric vehicle. he first charge and discharge, a simple system to monitor and ensure tight voltage limits and a LabVIEW© system to measure the voltages, currents and calculate the battery pack effective capacity and charge/discharge efficiency are presented. The efficiency and harmonic contents of the used chargers are measured. The installation of a commercial battery management system and its impact in previous results are also discussed. Streszczenie. W artykule przedstawiono testy parametrów banku baterii lithium iron phosphate, LiFePO4 w zastosowaniu do pojazdów elektrycznych. Przedstawiono system do testowania pojemności baterii oraz skuteczności ładowania i rozładowania. (System do badania baterii LiFePO4 w zastosowaniu do pojazdów elektrycznych) Keywords: Battery bank, LiFePO4, chargers, setting up and experimental tests, electric vehicles. Słowa kluczowe: baterie samochodowe, LiFePO4, układy łaDOWANIA BATERII. Introduction Electric vehicles are expected to be a major contribution to sustainable mobility. The energy storage capacity issues and related costs are still being the main obstacles to overcome but significant progresses are being done in this area, namely with the advent of lithium based batteries. In order to supply a small but high-performance EV and to deepen the knowledge [1]-[4] on the subject of charging systems for electric vehicles, the authors, at the Polytechnic Institute of Coimbra/Engineering Institute of Coimbra, IPC/ISEC, have set up a Lithium Iron Phosphate, LiFePO4, battery bank and developed a study around it to make its characterization. In this paper, the technical specifications of the cells, battery pack and chargers are firstly presented. Then, the set up of the batteries for utilization, including the first charge and discharge cycle, with over voltage and deep discharge under voltage protection, is described. It follows the description of the system and tests for battery pack and chargers characterization, including the calculation of the instantaneous power, the energies involved and performing energy quality analysis. Finally, a real time battery management system installation is presented along with some conclusions. Specifications of cells, battery pack and chargers The study develops around the TS-LFP90AHA [5] cells from Thunder Sky (recently Winston Battery Limited), with LiFePO4 cathode, 3.0-3.3 V nominal voltage and capacity C = 90Ah (Fig.1). Standard charge/discharge currents are 27 A (0.3 C), maximum 3C (270 A), maximum charge voltage is 4.25 V and minimum discharge voltage is 2.5 V. To build the used battery pack 32 cells were grouped. It should be noted that the cell voltage varies both during charge and discharge (Fig. 1) but considering 3 V for the cell nominal voltages, the pack has 96 V nominal voltage and C=90 Ah, and an energy stored of 8640 Wh. The chargers play an important role in the integration of electric vehicles since they recharge the batteries and must be adequate to the battery chemistry, the levels of voltage and type of charge. In this study it was used the single phase POW48V30A model from GWL/Power company, prepared to work with lithium-ion batteries. This model has intelligent control that calculates the battery pack state of charge (SOC), depending on its voltage, and adjusts the current. However, this model can only charge 16 cells and should not be used with fewer cells. Consequently, two of these chargers were used (except for the first charges), and the battery pack had to be divided in 2 groups of 16 cells during the charging. The nominal voltage is 48 V and maximum voltage 64 V. Fig. 1 – Charge/discharge curves from manufacturer manual [5] of TS-LFP90AHA cells (bottom left) First charge and discharge Even though manufacturer's manual allowed higher currents, the first cycle of charge and discharge was performed with low current (3 A). The objective of this first cycle was to carefully check the individual cells behavior and balance the cells, reducing their voltage and charge disequilibrium and put them in same initial condition. For the pack first cells, the first charge was made individually, cell by cell, using laboratory power supply sources, with a 3 A charge current. However, this was very time consuming and to accelerate the process it was done by groups of 4 cells or even 8 cells. During these tasks, precautions were taken to prevent the damage of the cells. That was ensured through a monitoring and interruption system based on commercial electronic devices, the CellLog 8S [6] (cf. Fig. 15). Using only nine wires, each one of these devices can measure, show and store up to 8 cells voltages and transmit it to a computer using an USB connection. This device possesses a system of adjustable alarms for maximum and minimum voltages levels, a time alarm and an alarm for voltage difference between cells. When an alarm situation is detected, a solid state relay contact changes its state. Making use of the alarm feature of the CellLog 8S devices, an interruption circuit was built using relays, push buttons, and the CellLog alarm connector. This system opens the power contactor, when one alarm of any of the CellLogs triggers, interrupting the charge or discharge process. PRZEGLĄD ELEKTROTECHNICZNY (Electrical Review), ISSN 0033-2097, R. 88 NR 1a/2012 193 However, special care as to be taken, as the CellLog alarm solid state relay contact is not galvanic isolated from the CellLog inputs, having to be connected through auxiliary electromechanical relays [7]. One has also to be very careful as the USB connector ground of each of the CellLogs is also directly connected to its cells lower voltage: more than one CellLog cannot be connected to the same computer at the same time, and even if different computers are used, one for each CellLog, special care has to be taken to avoid short circuits through the different computers supplies or USB connectors ground loops. The individual cells and total voltages and its time evolution can be visualized using the LogView software [8]. During the first charges, one important verified feature was that above 3.4-3.5 V the voltage on the cells increases very fast. Even with a 3 A charge it takes just a few minutes to reach the maximum 4.0-4.25 V limit and when discharging, bellow ~3.1 V the voltage drops very fast (cf. Fig. 12, for higher currents). The first discharge was also done at 3 A, in order to gain knowledge on the battery behavior. System and Tests Methodology for Battery pack and Chargers Characterization After the first charge and discharge cycle, to characterize the battery bank it was necessary to develop systems that allow monitoring and calculate the chosen parameters. Thus a program was created in LabVIEW© platform using an acquisition board, to measure currents, voltages and calculate power, energy, harmonic distortion rates, showing and recording their values. The LabVIEW© system was built using the acquisition board PCI-MIO-16E-4 of National Instruments with the I/O connector block SCB-68 that enables the use of 16 nondifferential channels or 8 differentials. The channels are connected to insulated current and differential voltage probes [7]. The battery pack efficiency is determined dividing the energy provided during its discharge by the energy absorbed in the charge. The charger efficiency is calculated dividing the energy supplied to the batteries during a charge operation by the energy it absorbs from the network. The charger instantaneous efficiency is determined dividing the instantaneous power absorbed by the batteries by the instantaneous power absorbed through the grid. The total current harmonic distortion, THDi, of the current chargers is calculated instantaneously. The input power, P, (1) and the input energy, E, (3) absorbed by the charger are calculated by: (1) P Vrms I rms FP where FP is the power factor and in non-sinusoidal system can be calculated by (2) [9-11]. cos1 (2) FP was not really constant since the discharge resistance was constant and the voltage decreases with the discharge. Due the laboratory limitations, the maximum continuous discharge current was 60 A. Fig. 2 - LabVIEW Monitoring Program Visual Interface during a charge A charge or a discharge ends when at least one cell reaches the limit voltage values defined in the CellLog alarm. The same limits were set for all CellLog 8S devices in all tests: 4.2 V for maximum voltage, 2.7 V for minimum voltage and V<0.5 V between cells. Following are shown the experimental tests results for one charge. As showed in Fig. 3, the charge current is constant, approximately 30A, until the change of stage by the charger, when the current has an abrupt decrease. The charge powers (Fig. 4) have the same behaviour that the current, showing a small difference at the charge end, where it seems to increase faster. This is due to the behavior presented by the cells voltage at the end of the charges, as will be shown in Fig. 12. Fig. 3 - Charger Output Current (1 THDi2 ) (3) t E Pdt 0 As mentioned before, the bank configuration is different for the charge (a series of two groups with a series of 16 cells) and the discharge (32 cells in series). Therefore, there was need to develop two monitoring programs, one for charge (Fig.5) and one for discharge [7]. Its visual interface has several scopes (graphic displays) for the registry of the parameters evolution in time and numeric indicators for the instantaneous values. The battery and chargers tests were based on cycles of charge followed by a discharge. The charge current starts at 30 A, lowering by steps with the SOC increase. The discharge current was different depending on the test: 15 A, 30 A and 60 A. However, it should be noted that the current 194 Fig. 4 - Charger Input Power (blue) and Output Power (red) The evolution of the THDi and charger efficiency, in Fig. 5, is in accordance with the expected results. At the moment of transition of stage, both THDi and efficiency show a variation. PRZEGLĄD ELEKTROTECHNICZNY (Electrical Review), ISSN 0033-2097, R. 88 NR 1a/2012 Fig. 5 - Current THD (blue) and Charger Efficiency (red) The increase of the THDi is due to that mostly the high frequency harmonics assume a bigger influence when compared with the fundamental frequency wave in the lower load level. The efficiency decrease on the other hand is due to the increase of the harmonics influence. The charger global efficiency depends on the difference of the energy absorbed by the charger and the energy absorbed by the batteries (Fig. 6). Fig. 8 - Charger 1 Input Power (blue); Charger 1 Output Power (green); Charger 2 Input Power (red); Charger 2 Output Power (purple) Fig. 9 - Battery bank connected for discharge test (32 cells in series). Fig. 6 - Energy Absorbed by the Charger (blue) and Energy Absorbed by the Batteries (red) The chargers global results can be summarized as: THDi min: ≈95% THDi max: ≈110% Instantaneous Efficiency: ≈85% Global Efficiency: 1820.4/2161.2=0.842 => 84.2% Characterization of LiFePO4 Battery Pack For each test of charge or discharge, the energy absorbed or supplied by the batteries was calculated by the developed system from the measured currents and voltages, as well as the efficiency for each discharge current. Fig. 7 shows an example of the pack 1 (first 16 cells) charge voltage and the chargers output currents, and in Fig. 8 the input and output powers of both chargers are presented. Fig. 10 – Battery bank voltage at 15 A discharge Fig. 11. Discharge Power for 15 A Fig. 7 - 16 Cells Group Voltage (blue); Charger 1 Output Current (red) and Charger 2 Output Current (green) After each charge, the battery pack was prepared for the discharge test, with the 32 cells in series, as in Fig. 9. The results in Fig. 10 and Fig. 11 are for a 15 A discharge current. In Fig. 12 it is presented the evolution of the individual cells and accumulated (blue, higher curve) voltages of the 8 cells monitored by one CellLog and shown in LogView during a charge followed by a discharge. As expected from Fig. 1, at the beginning and at the end of both charge and discharge, the voltage variations are more pronounced. It has also been verified that this effect increases with the increase of the discharge current. In Fig. 12 the referred phenomenon is more clearly seen, particularly at the end of the charge, where some of the individual cells voltage suddenly increases very sharply, and decreases exponentially at the beginning and at the end of the discharge. Due to this variation, which do not occur in all the cells at the same time, is it mandatory the existence of an individual cells monitoring system with an interruption system to avoid the damage of the cells by reaching very high or very low voltages. PRZEGLĄD ELEKTROTECHNICZNY (Electrical Review), ISSN 0033-2097, R. 88 NR 1a/2012 195 Fig.12 – 8 cells voltage variation: total and individual voltages The results for the diferent currents were: Cycle of 15 A discharge current: Energy Absorbed at charge: 7393.02 W.h * Energy Provided at discharge: 7226.25 W.h Cycle Efficiency: 97.74% Cycle of 30 A discharge current: Energy Absorbed at charge: management system applicable to any kind of lithium battery. This acts during the charge and discharge of the batteries, controlling individually each cell through Cell Balancing Units (CBUs), as in Fig. 14, that communicate with a Master Unit (Fig. 15) through a flat cable FC-10. The Master Unit can work standalone or connected to the computer, which through software supplies all the information about currents and voltages of each cell and of the battery bank. Its bigger advantage resides in that, unlike the CellLog 8S, beyond monitoring, also controls the processes. It is capable of balancing the voltage of each individual cell according to the definitions of the user previously stored into the Master Unit through the computer. When during the charge process one cell reaches a user defined voltage, its CBU starts deviating up to 5 A of the charge current allowing this cell to charge slower than the others and consequently to prevent its overcharge while the other cells are increasing their charge. The RT-BMS also possesses alarms for anomalies that can occur, such as errors, or lowering of the voltages for risky levels. 7530.60 W.h* Energy Provided at discharge: 7284.16 W.h Cycle Efficiency: 96.73% Cycle of 60 A discharge current: Energy Absorbed at charge: 7768.08 W.h* Energy Provided at discharge: 6814.76 W.h Cycle Efficiency: 87.8% *Sum of both groups of 16 cells. From the above results, even though if the energy absorbed by the battery pack is not equal for all tests, it is clear that the energy provided at the discharge decreases with the increase of the discharge current. That is due to the fact that the increasing of the discharge current increases the losses at the wires, at the contacts and mainly the internal losses of the cells. Higher currents also increase the voltage variation taking to an earlier end of the discharge, preventing the maximization of the energy transferred at the process. The measured battery pack efficiency is shown in Fig. 13. As can be seen, the efficiency decreases with the growth of discharge current, and it is clearly shown why, according to the manufacturers data sheet, the standard discharge current is 0.3 C (27 A). Fig. 14 – Battery bank with the CBUs installed Fig. 15 – Master RT-BMS Control Unit (case open) and CellLog 8S Fig. 13 - Batteries Efficiency as a function of the discharge current Battery Management System Tests Results The LabVIEW© developed system allows to evaluate the charger and battery pack efficiency and power quality. Nevertheless, for a real EV utilization, an embedded system and with cell balancing capacity is need. To fulfil this purpose, it was used a Real Time Battery Management System (RT-BMS) from GWL/Power, which is a 196 Before starting the tests with the RT-BMS installed, a complete charge and discharge of the battery pack was done so that the cells are as balanced as possible. The balancing system works according the user settings. For these tests, the settings were: - Cut-off voltage: 2.60V - Low voltage: 2.75V - Nominal voltage: 3.60V - Charge voltage: 4.00V Three cycles of charge and discharge were performed. In all cycles, the results for the cells voltages evolution, stored energy and efficiency, were identical to those obtained in the tests without the RT-BMS system, contrary to what was initially expected. After analyzing the situation it was concluded that with a 30 A or 22 A charge current, at PRZEGLĄD ELEKTROTECHNICZNY (Electrical Review), ISSN 0033-2097, R. 88 NR 1a/2012 least with the used heatsinks, the CBUs temperature rose significantly (Fig. 16) and they were not able to divert enough current to allow a much better cell charge balancing than with CellLog 8S. I.e., when some cell(s) voltage starts to skyrocket, the overall pack charge will soon finish, as that cell will reach the voltage limit before the others are fully charged, and so the system shuts the charger down. 4) The RT-BMS – Concerning overcharge prevention, the RT-BMS operation is based on diverting part of the charge current entering the cell, as a kind of by-pass and, when necessary, will discharge the higher charged cells. That may lead to an increase of the energy consumption. In terms of energy results, it was quite identical to the tests without the balancing system, due to the lack of balancing power from the balancing system. This can be improved, for example, by a better CBUs heat removal. As a final conclusion, the study done allowed to improve the authors’ knowledge on the LiFePO4 batteries and prepare a battery bank for EV. Acknowledgment The authors want to thank the Miguel A.C. da Fonseca, BSc in Electrical Engineering, former ISEC student, for his collaboration in the preparation of the battery and some experimental tests. This work has been partially supported by FCT under project grants PEst-C/EEI/UI0308/2011, MIT/SET/0018/2009 and MIT/MCA/0066/2009. REFERENCES Fig. 16 – Thermographic image of 3 CBUs during cell balancing [1] Conclusions A LiFePO4 battery pack was assembled and tested. From this study, the results led to the following main conclusions, concerning: 1) The cells and the CellLogs based interrupt system – During the charging, without a well adjusted RT-BMS, when the cells reach a certain level of charge the voltage starts to rise exponentially. This area of the curve is a very unstable zone, since the voltage changes very fast, requiring special care to not exceed the maximum recommended voltage for the cells. With recourse to CellLog devices and the interruption system, this problem can be prevented by taking an interruption when some cells reach the level of voltage near the maximum. After the interruption, the voltage level falls rapidly to a value much lower than it was previously. This value is not a fixed value, varies from cell to cell, but is close to 3.4 V. 2) The chargers – Assesses the level of battery SOC and adapt the charge currents. This kind of charge has the ability to maintain a constant current for SOC steps, thereby optimizing the load. In terms of energy quality, for smaller currents, this causes a harmonic distortion that is within the limits allowed, about 3% for the voltage THD and 111% for current THD. However, with such chargers generalization, some problems might arise in the distribution network. Regarding the efficiency, it is reasonable and corresponds to the manufacturer prediction, approximately 85%. The values of THDi and performance vary when varying the current, and when the THDi increases the efficiency decreases. Indeed, a current reduction causes a higher increase in the amplitude of the harmonics than in the fundamental frequency, raising their influence. Thus, in percentage terms, the harmonics increase in amplitude. 3) The battery pack – Without the balancing system, the charge and the discharge of batteries is not complete, and either one or the other process was terminated as soon as any cell enter the unstable zone and hit the voltage limit established. Thus, the energy absorbed and supplied by the batteries did not reach its maximum value. This is also reinforced as usually the cells only reach its maximum capacity after some cycles. In these tests, these values vary between 7200 Wh and 7700 Wh, resulting in a maximum efficiency near of 98% and decreasing with the discharge current. P.G. Pereirinha, J.P. Trovão, A. Marques, J. Silvestre, F. Santos, A. Campos, M. Silva, P. Tavares, The Electric Vehicle VEIL Project: A Modular Platform for Research and Education”, Proc. of the 2.nd European Ele-Drive Conference (EET-2007), Brussels, Belgium, May 30 – June 01, 2007. [2] Paulo G. Pereirinha, João P. Trovão, L. Marques, M. Silva, J. Silvestre, F. Santos, Advances in the Electric Vehicle ProjectVEIL Used as a Modular Platform for Research and Education, Proc.of the EVS24 International Battery, Hybrid and Fuel Cell Electric Vehicle Symposium, Stavanger, Norway, 13-16 May 2009. [3] J. P. Trovão, P. Pereirinha, H. Jorge, Design Methodology of Energy Storage Systems for a Small Electric Vehicle, World Electric Vehicle Journal, Volume 3 (2009), ISSN 2032-6653. [4] Marco Silva, João P. Trovão, Paulo Pereirinha, Luís Marques, Multiple Energy Sources Monitoring System for Electric Vehicle, Proc. of the 19.th International Symposium on Power Electronics, Electrical Drives, Automation and Motion (SPEEDAM 2008), Ischia, Italy,11-13 June 2008. [5] Thundersky Company (presently Winston Battery Limited), www.thunder-sky.com/home_en.asp [6] CellLog 8S, Cell Voltage Monitor&Logger - User’s Manual, Shenzhen Junsi Electronic Co., Ltd., available on 31 April 2011, at www.jun-si.com/UploadFiles/CellLog_8S.pdf. [7] Alekssander Santiago, Paulo G. Pereirinha, João P. Trovão, Charge and Discharge Test Bench Monitoring System for Lithium Ion Batteries for Electric Vehicle, International Youth Conference on Energetics, Leiria 2011. [8] LogView software, www.logview.info/vBulletin [9] Muhammad H. Rashid, Power Electronics – Circuits, Devices and Applications – Second Edition, 1993. [10] J. Trovão, F. Ferreira, Distorção Harmónica no Sector Industrial - Causas, Efeitos e Soluções, Revista Manutenção, N.º 88, Janeiro-Março de 2006. [11] João P. Trovão, Frederico M. Santos, Marco J. Silva, Humberto M. Jorge, A Web-Based Monitoring Approach for Power Systems in Industrial Plants, Proc. of IEEE International Symposium on Industrial Electronics (ISIE'08), Cambridge, UK, 30th June - 2nd of July 2008. Authors: prof. dr. Paulo G. Pereirinha, IPC/ISEC, Rua Pedro Nunes, 3030-199 Coimbra, Portugal, E-mail: [email protected] MSc Eng. João P. Trovão, idem, E-mail: [email protected] BSc Aleks.Santiago, idem, E:mail: [email protected] PRZEGLĄD ELEKTROTECHNICZNY (Electrical Review), ISSN 0033-2097, R. 88 NR 1a/2012 197