1
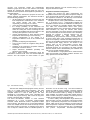
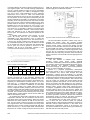
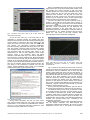
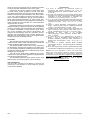
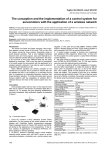
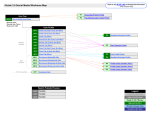
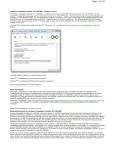
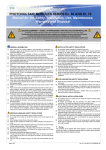
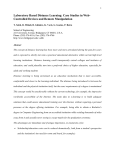
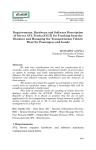
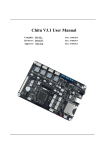
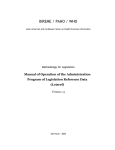
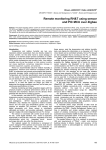
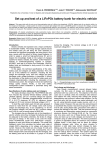
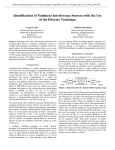
Aleksandar Č. ŽORIĆ1, Đurđe PERIŠIĆ1, Slobodan OBRADOVIĆ1, Petar SPALEVIĆ2 Slobomir P University-Bosnia and Herzegovina (1), University of Priština-Serbia (2) PC-Based Virtual DTA Recording System Design Abstract. This article describes a modern design of PC based virtual system for the qualitative differential thermal analysis (DTA), dedicated to laboratory investigations-determining the phase transformation temperatures for binary, ternary and other systems of the metal alloys. Complete design is devided in two parts: acquisition hardware based on the PIC MCU and graphical user interface developed under LabView IDE. Obtained experimental results show a very good agreement with the measured reference values and high precision of the proposed system. Streszczenie. W artykule przedstawiono komputerowy system wirtualny do analizy jakościowej różnicy termicznej (DTA), poświęcony badaniom laboratoryjnym - określaniu temperatury przemian fazowych dla binarnych, potrójnych i innych systemów stopów metali. Kompletny projekt jest podzielony na dwie części: sprzęt w oparciu o mikrokontroler PIC i graficzny interfejs użytkownika, opracowane pod LabView IDE. Uzyskane wyniki doświadczalne wykazują bardzo dobrą zgodność mierzonych wartości odniesienia i wysoką precyzję proponowanego systemu. (Wirtualny system komputerowy do analizy różnicy termicznej DTA). Keywords: DTA, Microcontroller, LabView, Thermopair. Słowa kluczowe: różnica termiczna DTA, system komputerowy, LabView.. Introduction The concept of virtual instrumentation was born in late 1970s, when microprocessor technology enabled a machine’s function to be more easily changed by changing its software. Virtual instrumentation combines mainstream commercial technologies, such as the PC, with flexible software and a wide variety of measurement and control hardware, so engineers and scientists can create userdefined systems that meet their exact application needs. Virtual instrumentation refers to the use of general purpose computers and workstations, in combination with data collection hardware devices and virtual instrumentation software, to construct an integrated instrumentation system [1, 2, 3]. In such a system, the data collection hardware devices are used to incorporate sensing elements [4, 5] for detecting changes in the conditions of test subjects. These hardware devices are intimately coupled to the computer, whereby the operations of the sensors are controlled by the computer software and the output of the data collection devices are displayed on the computer screen with the use of displays simulating in appearance of the physical dials, meters, and other data visualization devices of traditional instruments [4, 5]. For example, increasing number of biomedical applications use virtual instrumentation to improve insights into the underlying nature of complex phenomena and reduce costs of medical equipment and procedures [6]. Virtual instrumentation systems also comprise pure software “instruments,” such as oscilloscopes and spectrum analyzers, for processing the collected sensor data and “messaging” it such that the users can make full use of the data. The Internet has enormous potential for distributed virtual instrumentation [7]. Various remote devices, such as telerobots or remote experimental apparatus, can be directly controlled from the Internet. There are a great number of research activities that explore how the Internet can be applied to medicine. In addition, many of virtual instrumentation development tools, such as LabView [8], directly support integration of virtual instruments in the Internet environment. The Web technologies make possible creation of sophisticated client-server applications on various platforms, using interoperable technologies such as HTML, Java Applets, Virtual Reality Modeling Language, and multimedia support. Qualitative differential thermal analysis (DTA) is a thermoanalytic technique which can be used as a finger print for identification purposes but usually the applications of this method are the determination of phase diagrams, 156 heat change measurements and decomposition in various atmospheres. Qualitative DTA is based on monitoring of the temperature difference of two samples, when they are heated evenly. In DTA, the material under study and an inert reference material such as Al2O3 are exposed to identical thermal treatment during recording temperature difference between tested sample and reference. This temperature difference curve is then plotted against time or against temperature (DTA curve or thermogram). Changes in the sample, which lead to the absorption or evolution of heat, can be detected relative to the inert reference. Namely, with increasing temperature, a short peak at DTA curve occurs if the tested sample undergoing a phase transformation. This occurs because the input heat will raise the temperature of the inert substance, but will be incorporated as latent heat in the tested material which undergoing a phase transformation. Thus, a DTA curve provides data on the transformations that have occurred, such as glass transitions, crystallization, melting and sublimation. The area under a DTA peak is the enthalpy change and is not affected by the heat capacity of the sample. DTA is widely used in the pharmaceutical and food industries as well as in the environmental studies. The virtual DTA system proposed in this paper is based on the IBM compatible PC and the simple microcontroller's acquisition interface with integrated cold-junctioncompensated K-thermocouple-to-digital converters. The system is realised in accordance with the user requirements of the laboratory of metallurgy at the Faculty of Technical Sciences in Kosovska Mitrovica. It represents an economical, high quality replacement of conventional standalone electromechanical recording instrument for DTA. A special care is dedicated to the user software designing whose features have the direct influence on the solution quality. The user software is realized under LabView IDE. Adopted concept enables compact measurements, recording and analysis of the obtained graphs as well as easily sensors replacement without the need of calibration. Quality and accuracy of the described system is acknowledged by more tests of the binary and ternary systems of the metal alloys. User requirements The conventional instrument for DTA is a simple device which consists of two physically coupled thermocouples, analogue processing electronics, display and thermal PRZEGLĄD ELEKTROTECHNICZNY (Electrical Review), ISSN 0033-2097, R. 87 NR 12a/2011 recorder. The instrument creates the temperatures difference graph versus time of the reference and tested sample. By analysing the obtained graph the user can determines most important thermodynamics parameters of the tested sample. With regard to the instrument’s purpose the user was defines adequate requirements. The instrument should to has the following functions: two physical and one arithmetic channel for the real time temperatures measurement of the reference and tested sample and their difference, o o respectively, in the range of 0 C-1000 C, on-line and off-line monitoring possibilities, the storage possibility of the measured and administrative (time, date, and comments) data into ASCII file. During the on-line monitoring the user should to has available start and stop options of the recording data operation in the form of file, numeric representations of three channels instant temperatures values during on-line monitoring, numeric representation of the surface of a temperature difference curve in the recorded time period, possibility of sampling rate adjustments, zoom tool and cursors for navigation during off-line monitoring, portability of the instrument’s acquisition hardware and simple connection with PC, simple instrument handshake possibility and electronic user’s manual. In order to satisfy proposed temperature range the instrument’s hardware must uses the thermocouples as sensors. This will requires an extra function of open thermocouple detection for both sensors having in mind length of the thermocouples. Acquisition hardware arrangement Taking into account the user’s requirements, the acquisition hardware with K-type thermocouples is designed to be connected with personal computer. The central part of the acquisition hardware is the Microchip microcontroller PIC18F4550 with built in the USB periphery. Complete scheme of the system hardware is showed in Fig. 1. As shown in Fig. 1. communication between the acquisition hardware and PC is established via USB port of the PC or precisely by emulating RS232 serial interface over USB. The communication device class (CDC) specification defines many communication models including serial emulation. By using the relevant CDC built-in functions integrated in the MCU firmware and appropriate driver, virtual COM port has been formed. This is necessary because the LabView 7 Express software has not embedded functions for USB control transfer. Simultaneously, the power lines of the PC’s USB port serve as power supply lines of the acquisition hardware due to large current capacity of 500mA and stable voltage of 5V. In this way, the acquisition hardware becomes independent on the external power supply sources. Two buttons in the scheme serve for the microcontroller in-circuit serial programming (ICSP) on the base of stand-alone USB bootloader program. So, the engineer can easily upgrade firmware without need of disassembling the hardware and with CCS C compiler software support. The PIC18F455 is a high performance, enhanced flash USB microcontroller with flexible oscillator structure and many special microcontroller features. Fig.1. The hardware of the proposed system: acquisition hardware and PC The MCU has 32Kbytes flash program memory and can store up to 16384 single-word instructions. The data memory is implemented as static RAM divided into 8 complete banks for a total of 2048 bytes. The data EEPROM is a nonvolatile memory array, separated from the RAM and program memory, that is used for long-term storage of program data or constants. The MCU PIC18F4550 consists of some standard peripherals as a 10-bit 13-channels analog-to-digital converter, PWM, Enhanced USART, comparator module and four timers. The device has an 31 level deep hardware stack and multiple internal and external interrupt sources with priority levels for interrupts. A watchdog timer with its own on-chip RC oscillator serves for reliable operation of the device. As can be seen in Fig. 1 the microcontroller is clocked by 20MHz crystal resonator. Precisely sampling time of 250ms is generated including RTC functionality of the 16-bit timer/counter TMR1 by adding an external LP watch oscillator. An overflow of the TMR1 register causes a TMR1 overflow interrupt (if enabled). The interrupt service routine can then perform the appropriate task. In order to satisfy wide temperature range demand, the thermocouples of K-type are adopted. This thermocouples type is comparatively inexpensive and accessible at the market. ANSI type-K (Iron-Constantan) and DIN (NiCr-Ni) thermocouples are composed of identical alloys and exhibit similar behavior. As can be seen from Fig. 1 the MAX6675 cold junction compensated K-thermocouple-to-digital PRZEGLĄD ELEKTROTECHNICZNY (Electrical Review), ISSN 0033-2097, R. 87 NR 12a/2011 157 converters (Maxim) are used for signal processing from a Ktype thermocouples. This converter resolves temperatures o o to 0.25 C, allows readings as high as 1024 C and exhibits thermocouple accuracy of 8 LSBs in temperatures range o o o from 0 C to 700 C. Over temperature of 700 C maximum temperature error is about 17 LSBs. The thermocouple should be attached as close to the chip as possible, so that the cold junction and the chip (which is measuring the cold junction temperature internally), are isothermal. The whole assembly of the cold junction and the chip should be kept away from sources of heat or thermal gradients of any kind, perhaps inside an enclosure. The cold end (temperature of MAX6675 chip) can only ranges from -20oC to 85oC. The data is output in a 12-bit resolution, SPI compatible, readonly format, Fig. 2 and Table 1. Maximum conversion time is 0.22 s. The MAX6675 includes a thermocouple failure alarm that indicates if one or both thermocouple leads become open. This preference is adequate applied in this solution. A complete serial interface read requires 16 clock cycles. By forcing #CS low any conversion process immediately stops. Read operation of the 16 output bits occurs on the falling edge of the clock. The first bit, D15, is a dummy sign bit and is always zero. Bits D14-D3 contain the converted temperature in the order of MSB to LSB. Bit D2 is normally low and goes high when the thermocouple input is open. D1 is low to provide a device ID for the MAX6675 and bit D0 is three-state. Initiation a new conversion process starts by forcing #CS high. Fig.2. SPI interface protocol of MAX6675 Table 1. Format of serial data output Bit Dummy 12-Bit Temperature Sign Bit Reading Ord. 15 14 ... 3 No. 0 MSB LSB Ther. Input 2 Dev ID. 1 State 0 Three State 0 The Xbee-PRO RF modules (MaxStream) are used for wireless connection [9] of the acquisition hardware with other remote PC’s GUI. It allows the possibility of the real time process monitoring and recording in the isolated room, especially for demonstrative student’s lessons. As can be seen from Fig. 1, communication between the PIC MCU and Xbee-PRO RF module is established via serial data interface of the module (3.3V CMOS UART–5V tolerant) and the configured USART periphery of the PIC MCU. The modules operate within the ZigBee protocol [9] and support the unique needs of low-cost, low-power wireless sensor networks. The modules require minimal power and provide reliable delivery of data between remote devices within the ISM 2.4 GHz frequency band. RF modules have been easily configured by free X-CTU configuration software, first as Coordinator and second as End device at the point-to-point topology. Both short 16-bits addresses have been matched as well as the baud rate, also. The RF module conforms to the 802.15.4 specification and supports both short 16-bit addresses and long 64-bit addresses. Every one RF module is equiped with half-wave dipole antenna. Fig. 3. shows simple serial communication betwen the RF module configured as End device and PC’s 158 COM port. External 5V power supply must be provided for module supply and for MAX232 converter. Fig.3. RF module connected with PC COM port as END device The microcontroller’s firmware is written using CCS C compiler IDE version 4.057. The program includes procedures of the microcontroller’s peripherals initialization, interrupt service routine, one-wire and specific two-wire protocol for communication with sensors and USB CDC API for virtual COM port creating. The system firmware starts or stops program execution after received appropriate string from the PC. By comparison the received string with the adopted start and stop string constants within the interrupt service routine the microcontroller resolves appropriate PC request. Graphical user interface The user software is realised under Windows operating system which ensure quality graphical environment, multitasking and interaction between graphical user interface objects and appropriated subroutines (eventdriven principle). The LabView software (National Instruments-USA) [8], as leader in virtual instrumentations domain, is used to realization our project. LabView is a graphical programming development environment based on the G programming language for data acquisition and control, data analysis and data presentation. LabView gives the flexibility of a powerful programming language without the associated difficulty and complexity because its graphical programming methodology is inherently intuitive to programmers. With LabView the user can control own system and present results through interactive graphical front panels. On the front panel user places the controls and data displays for own system by choosing objects from the controls palette including numeric displays, meters, gauges, LEDs, charts, graphs and more. To program, programmer constructs the block diagram by choosing objects (icons) from the functions palette and connect them with wires to pass data from one block to the next. These blocks range from simple arithmetic functions, to advanced acquisition and analysis routines, to network and file I/O operations. Therefore, LabView uses a dataflow programming model, so called G, that frees programmer from the linear architecture of text-based languages. The realized GUI at on-line mode is shown in Fig. 4. Two of three real time waveform charts are physical channels while the last temperature difference waveform is arithmetic channel. Digital indicators on the charts show instantaneous temperatures values of all channels. The front panel is divided in two parts which may be selected by ON-LINE and OFF-LINE tab controls. PRZEGLĄD ELEKTROTECHNICZNY (Electrical Review), ISSN 0033-2097, R. 87 NR 12a/2011 Fig.4. Instrument front panel view at the on-line mode with temperatures waveforms As can be seen from Fig. 3, the front panel of the instrument is reviewed, intuitive and familiar with other Windows environments. ON-LINE acquisition (default page) in the process starts by pressing the Run arrow button upper left corner of the front panel. After the virtual serial port opening, the instrument’s hardware initialization executes by writing appropriate start string to the port. After that, the program continues within the while loop reading four raw data bytes per sample from the port, LP filtering and processing data and showing right values of the temperatures as well as their difference. Final results program sends to the waveform charts and digital indicators. Described while loop cycle will be repeated in accord with the choosen sampling time. Minimal sampling time is 0.25 second exactly and can be adjusted as integer multiple of the minimal sampling time. On-line acquisition process may be terminated by pressing the STOP button. In this way the program leaves while structure sending the stop string to the instrument’s hardware and the port closing. CLEAR GRAPHS button serves for occasionally graphs cleaning after longer acquisition time. Fig.5. On-line help subVI During on-line acquisition, the user can uses on-line help, which includes electronic user guide and technical specifications of the instrument (ON-LINE-HELP button), see Fig. 5. The mentioned while loop includes the case structure with ready-made file I/O functions. Write to spreadsheet file starts by turning on the vertical toggle switch LOG TO FILE (recording start). Header of the file, including text control comment on the front panel, sampling period and current system date/time string, first will be saved into the file and then data field, which represents three channels. The file path and name are specified in the text control on the front panel. File writing process may be stopped by turning off the vertical toggle switch (recording stop) during the on-line acquisition. The user can selects the off-line monitoring mode by clicking on OFF-LINE tab control. After that by clicking on , in the new window user should selects the Run button appropriate recorded file. In this mode the program reads data from chosen spreadsheet file and represents the recorded waveforms in the graph field, as in Fig. 6. Spreadsheet ASCII file containing the measured data may be interpreted by any tabular programs like MS Excel, Matlab etc. This mode of the user software stops automatically at the end of file after reading data. Fig.6. Instrument front panel view at the off-line mode with temperatures waveforms obtained by reading appropriate spreadsheet file Fig. 6. shows the front panel at off-line mode. As can be seen there are three cursors with the cursors legend for two temperatures and their difference and for time and date reading, graph pallete with zoom tool and scale legend. In the recorded time interval the front panel at off-line mode automatically calculates and shows min, max and average values for all of three quantities. From the file, program reads and shows the chosen sampling period in seconds and the comment from header of the file. Additionally, on the base of user demand, a numeric display of the surface of the curve of temperatures difference is incorporated. This parameter, program calculates automatically by numeric integration method (Simpson’s rule). As the previously described software part, this part of front panel of the instrument is designed to be user friendly. The obtained heating curves in Fig. 6 represent a result of the thermal testing of an alloy of ternary system Ag-SbZn, recorded by described DTA system under laboratory conditions, where Al2O3 is used like reference material. For making alloys were used metals of purity of 99.999%. The qualitative DTA was executed in the dedicated temperature chamber with constant heating rate, controlled by the temperature programmer. Both samples in the sample holder assemblies together with the sample containers and thermocouples are subjected to identical heat treatments. All of three recorded temperature curves in Fig. 6 are showed in one window. PRZEGLĄD ELEKTROTECHNICZNY (Electrical Review), ISSN 0033-2097, R. 87 NR 12a/2011 159 Using the cursors and legend user can measure the peaks of curves and other characteristic points in the graph. Using binary and ternary systems of metal alloys such as Pb-Sb, Sb-Bi, Ag-Sb, Ag-Sb-Zn, In-Zn-Sb, more tests have been performed by the proposed virtual DTA system. Additional reference K-type thermopairs with cold junctions in ice and a precize digital mV-meter have been used in order to evaluate measurement error at more temperature points. Polynomial approximation of 9th order is used, also. All measured values show a good agreement with reference o values. Absolute error was less than 3 C in the temperature o o range from 20 C to 750 C. Described graphical user interface may be modified and upgraded easily by adding new functions for both operating modes in accordance with appropriatelly user requirements, by software modifications. If some iregulars occur during the on-line acquisition like sensors disconnection the software will automaticaly abort the acquisition process. Changes of the parameters as port number, sample time, filter type and cutoff frequency will not be accepted if they made during on-line acquisition process. Conclusion The described PC-based virtual DTA recording system is based on the modern virtual instrumentation concept and recently developed digital temperature sensors. The realized system can be used in many applications for temperature monitoring and recording in the wide range but it is primarily intended for metallurgy researches where complex and relatively expensive stand-alone DTA system developments are required. The total cost of development, realization and system maintenance is reduced due to application of digital sensors and LabView programming tools. The described system has been verified accros more tests for binary and ternary systems of the metal alloys. REFERENCES [1] A. Žorić, S. Obradović, An Inexpensive System for Temperature and Humidity Monitoring, Proc. of Int. Sci. Conference UNITECH-06 – Gabrovo, Bulgaria - 2006. - Vol. I. P. 104–108. [2] M. Kostić, Data Acquisition and Control Using LabVIEW Virtual Instrument for an Innovative Thermal Conductivity Apparatus. Proceedings of Virtual Instrumentation in Education 1997 Conference. June 12, 1997, MIT, 1997, P. 131–136. [3] K.-C. Yao, Single Input Virtual Digital Multi-meter Design and Implementation, International Journal of Innovative Computing, Information and Control. – 2008. - Vol. 4, No. 12. - P. 31013110. [4] Patrick H. Garrett, Multisensor Instrumentation 6 [sigma] Design - defined accuracy-computer integrated-measurement systems. – John Wiley and Sons, Inc. 2002. – 209p. [5] S. Chakravarthy, R. Sharma, and R. Kasturi, Noncontact Level Sensing Technique Using Computer Vision, IEEE Trans. on Instrum. and Measurement Vol. 51, No. 2, P. 353–361, 2002. [6] Aleksandar Č. Žorić, Siniša S. Ilić, PC-Based Electrocardiography & Data Acquisition, TELSIKS, IEEE – 2005. - P. 619-622. [7] C. C. Ko, B. M. Chen, S. Y. V. Ramakrishnan, C. D. Cheng, Y. Zhuang, J. Chen, A Web-Based Virtual Laboratory on a Frequency Modulation Experiment, IEEE Transactions on Systems, Man, and Cybernetics. – 2001. - Vol. 31, No. 3. - P. 295–303. [8] S. Sumathi, P. Surekha, LabVIEW Based Advanced Instrumentation Systems. - Springer-Verlag Berlin Heidelberg, 2007. - 728p. [9] M. Dunbar, Plug-and-Play Sensors in Wireless Networks, IEEE Instrumentation and Measurement Magazine 4(1), 19–23, 2001 Authors: prof. dr inż. Aleksandar Č. Žorić, prof. dr inż. Đurđe Perišić, prof. dr inż. Slobodan Obradović, Faculty of Information Technologies, str. Pavlovića put bb. 76300 Slobomir, Bosnia and Herzegovina, E-mails: [email protected] [email protected] [email protected]; prof. dr inż. Petar Spalević, Faculty of Technical Sciences, str. Knjaza Miloša 7, 38220 K. Mitrovica, Serbia, E-mail: [email protected]; Acknowledgement This work was supported by the Ministry of Science and Technology of the Republic of Serbia within the projects TR47016 and TR35026. 160 PRZEGLĄD ELEKTROTECHNICZNY (Electrical Review), ISSN 0033-2097, R. 87 NR 12a/2011