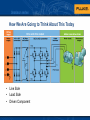
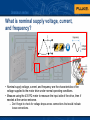
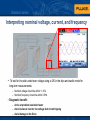
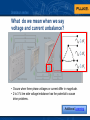
1
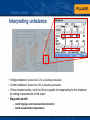
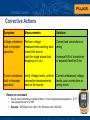
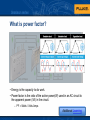
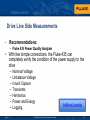
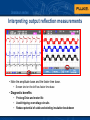
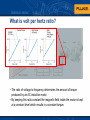
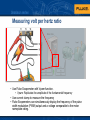
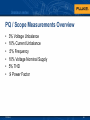
Measurement
best practices for
troubleshooting
motors and drives
Safety: Qualified Person and Motor Drive
Installations - Safety
• NFPA 70E Part II Safety-Related Work Practices, Chapter 1 General,
Section 1-5.4.1 Qualified Persons
• A qualified person:
“…understands the
operation of test
equipment and
follows all
manufacturer
procedures“
Conditions vary at every instance
Category Ratings for test equipment
CAT I- Protected electronic equipment, such as the high-voltage section of a copier.
CAT II- Receptacle connected loads, such as home appliances and portable tools.
CAT III- 3φ distribution, such as switchgear and poly-phase motors in fixed installations
CAT IV - 3φ directly connected to utility.
Test meter certification
Is the meter independently verified or just “designed to meet?”
All Fluke Test Equipment and Accessories with Category Ratings
meets and exceeds Safety Standards.
Poly phase systems in Cat III environments
Do
Avoid
• Confirm the test instrument
is rated for the use.
– Drives are typically CAT III
• Use test equipment you can
properly operate with your
PPE
– Test equipment
is also part of
PPE
• Combining CAT III instruments
with lower rated accessories.
• Short circuiting floating
differential test points with a
common ground non-isolated
multichannel input device.
How We Are Going to Think About This Today
• Line Side
• Load Side
• Driven Component
Basic Inverter Technology
• 3-Phase AC is rectified
to provide a constant
DC voltage
– Residual ripple and
noise is filtered out
• DC voltage is used by the
electronic switches/gates
– Controlling the on/off time of
the electronic switches creates
an output PWM (pulse width
modulated signal), that is
voltage and frequency
controlled
• Motor produces torque
and motion controlling
the mechanical load
Potential Problems We Will Learn How To Test & Measure
Nominal
supply
voltage
Voltage
unbalance
Transients
Harmonics
Power factor
DC Buss
Voltage Unbalance
Current Unbalance
Output Transients
Reflections
Shaft Voltage (bearing
current)
Volt to Hertz Ratio
Motor overload
Single phasing
Bearing failures
Misalignment
Mechanical imbalance
Looseness
Insulation breakdown
What is nominal supply voltage, current,
and frequency?
• Nominal supply voltage, current, and frequency are the characteristics of the
voltage supplied to the motor drive under normal operating conditions.
• Measure using the 435 PQ meter to measure the input side of the drive, then if
needed at the service entrance.
– Don’t forget to check for voltage drops across connections that would indicate
loose connections.
Interpreting nominal voltage, current, and frequency
•
To test for line side under/over voltage using a 435 in the dips and swells mode for
long-term measurements.
– Nominal voltage should be within +/-10%
– Nominal frequency should be within 0.5Hz
• Diagnostic benefit:
– Arrive at problem resolution faster
– Avoid nuisance inverter low voltage fault circuit tripping
– Avoid damage to the Drive
What do we mean when we say
voltage and current unbalance?
• Occurs when three phase voltages or current differ in magnitude.
• 2 to 3 % line side voltage imbalance has the potential to cause
drive problems.
Additional Learning
Interpreting unbalance
• Voltage unbalance: Greater than 2-3% is potentially problematic.
• Current unbalance: Greater than 10% is potentially problematic.
• If these situations exists, verify the Drive is capable of compensating for the unbalance
by making measurements on the output
• Diagnostic benefit:
– Avoid tripping current overload fault protection
– Avoid elevated motor temperatures
Corrective Actions
Symptom:
Measurements:
Solution:
Voltage unbalance
fault or improper
operation
Perform voltage
measurements working back
toward the source
Look for single phase load
dropping in or out
Correct bad connections or
wiring
Verify Voltage levels, perform
connection measurements
back to the source
Correct unbalanced voltage
levels, poor connections or
wiring errors
Current unbalance
fault or improper
operation
•
Increase KVA of transformer
or separate feed for Drive
Return on investment
•
•
Hourly cost of downtime x number of hours + Cost of replacement equipment = $ ???
Test equipment cost = $7,500
•
Example: $5,500 per hour x 4hrs + $1,200 motor cost = $23,200
Fluke-435
Input Power Summary
• As little as 2 to 3% voltage unbalance on the input to a motor
drive inverter can cause voltage notching and excessive current
to flow in one or more phases.
• 10% current unbalance and you can start to have problems
• Nominal voltage should be within 10%, plus or minus, of the
intended voltage.
• Typical power distribution standards allow for deviations no more then 10%,
but standards vary by country and location.
• Nominal frequency should be within 0.5Hz of specification.
• This potential problem is most likely to occur when on backup power since
generators can shift in frequency.
What are transients?
• Transient - temporary unwanted voltage on the AC line inputs.
–
–
–
–
Wide range of waveforms, amplitudes, and durations
Constant - are easier to locate
Intermittent - are difficult since they can occur randomly
Drives, cabling and motors can suffer damage
Additional Learning
Interpreting transients
• Transients above nominal voltage are potentially problematic.
– Check with your VFD user manual for exact specifications.
• Diagnostic benefit:
– Prolong Drive and motor life
– Avoid tripping overvoltage circuits
– Identifying transients helps isolate building faults
Corrective Actions
Symptom:
Measurements:
Solution:
Voltage high/low
fault, improper
operation or Drive
failure
Perform transient
measurements working
upstream toward the source
and downstream towards
other loads to find the source
Correct bad connections,
wiring or ground
Repair or replace improperly
operating loads
Installation of surge
suppressor or transient
arrestor
•
Return on investment
•
•
Hourly cost of downtime x number of hours + Cost of replacement equipment = $ ???
Test equipment cost = $7,500
Fluke-435
What are harmonics?
• Harmonics are multiple frequency components of the fundamental waveform.
– E.g., a third harmonic of 60Hz is 180Hz. The fifth harmonic of 60Hz is 300Hz.
– Harmonics create additional heat in the system and components.
– They serve no benefit
Additional Learning
Interpreting harmonics
• Voltage THD (Total Harmonic Distortion) greater than 5% is potentially
problematic.
• Diagnostic benefit:
– Avoid repair costs from excessive harmonic distortion
– Avoid motor and transformer overheating
– Avoid voltage distortion
Corrective Actions
Symptom:
Measurements:
Solution:
Drive faults of current,
voltage and overheating
Perform Harmonic and THD
measurements working upstream
toward the source and
downstream towards other loads
to find the sources
Installation of harmonic filters at
main contributing circuits or loads
Distortion of voltage
and/or current waveforms
Overheat of transformers,
connections, wiring,
system components
(breakers etc.) and loads
Correct improper operation of
loads
Redistribute single phase loads
among the three phase to reduce
the harmonic effects
High phase & neutral
currents
•
Return on investment
•
•
Hourly cost of downtime x number of hours + Cost of replacement equipment = $ ???
Test equipment cost = $7,500
Fluke-435
What are the thermal signatures of key
components in the motor drive input?
• A thermal signature indicates the apparent heat emitted from the surface of
an object.
• Thermal signatures can highlight temperature hotspots or deviations from
normal operating conditions.
Interpreting the thermal signatures of key
components in the motor drive input
• Use a thermal imager to scan the component and look for irregular and nonuniform thermal patterns or anomalies.
• Diagnostic benefit:
– Identify hot spots, cold spots, or unexpected conditions faster and safer than
contact measurements alone.
– Arrive at problem resolution faster.
– Avoid damage to the motor drive.
What is power factor?
• Energy is the capacity to do work.
• Power factor is the ratio of the active power(W) used in an AC circuit to
the apparent power (VA) in the circuit.
– PF = Watts / Volts-Amps
Additional Learning
Interpreting power factor
• A power factor of less than 1 indicates that the circuit is not operating
at full efficiency.
• A measurement of less than 0.9 indicates a potential problem.
– Power factor should be measured for at least 24 hours anytime changes
are made to the power system.
Power factor
• A purely resistive load (ex. a heater) has a power factor of 1.0
• Inductive loads such as motors, transformers, and high-intensity lighting introduce
reactive power into a power system and typically cause lower power factors.
• A measurement of less than 0.9 may incur financial penalties and require improvement
due to contractual obligations with the utility.
• A measurement from 0.9 to 1 indicates a well-behaved motor drive.
• The power factor of a motor will vary depending on it’s loading, typically the closer to full
load the better the power factor.
• Circuits may have to be derated where a consistently low power factor occurs.
• When thinking about low power factor think low efficiency – it’s costing more to run your
equipment as the overall losses will be higher.
• Diagnostic benefits:
• Identifying and correcting low power factor saves money on utility bills
• Prevent voltage drops and overheating by identifying capacity restrictions
Drive Line Side Measurements
•
Recommendations:
– Fluke 435 Power Quality Analyzer
• With few simple connections, the Fluke-435 can
completely verify the condition of the power supply to the
drive
–
–
–
–
–
–
–
Apr-11
Nominal Voltage
Unbalance Voltage
Inrush Capture
Transients
Harmonics
Power and Energy
Logging
Fluke Motors & Drive - Hands-on Excercises
Additional Learning
26
Fluke – 435 Power Quality Analyzer
• Capabilities
– Troubleshoot real-time:
• Analyze the trends using the cursors and zoom tools.
– Highest safety rating in the industry:
• 600 V CAT IV/1000 V CAT III rated for use at the service entrance.
– Measure all three phases and neutral:
• With included four iflex® flexible current probes with thin flex design to fit
into the tightest places.
– Automatic trending:
• Every measurement is always automatically recorded,
without any set-up.
– Automatic transient mode:
• Capture 200 kHz waveform data on all phases
simultaneously up to 6 kV.
Fluke – 435 Power Quality Analyzer
• Capabilities (continued)
– System-monitor:
• Ten power quality parameters on one screen according to
EN50160 power quality standard.
– Logger function:
• Configure for any test condition with memory for up to 600
parameters at user defined intervals.
– View graphs and generate reports:
• with included analysis software.
– Energy loss calculator:
• Active and reactive power measurements, unbalance and
harmonic power are quantified to pinpoint true system energy
losses in dollars
Fluke – 435 Power Quality Analyzer
• Capabilities (continued)
– PowerWave data capture:
• Capture fast half-cycle RMS data and waveforms to characterize
electrical system dynamics (generator start-ups, UPS switching etc.).
– Waveform capture:
• Capture 120 cycles (60 Hz) of each event that is detected in all
modes, without set-up.
– Easy to use, powerful and complete
• Charge the battery, load the software and you are ready to go
Input Power – Summary
•
By checking the input power first:
– You can rule out issues that might affect the motor
drive or breaker circuits
– This can save you time and lead to a faster problem
resolution.
– In addition, by identifying over or under voltage
conditions, you can avoid nuisance tripping of drive
fault circuits, and eventual damage to the motor drive
itself.
•
•
•
How much time did you spend trying to fix these
kind of problems in the past?
How much time/money do you think you can save
by using the a Thermal imager or a 435 PQ
analyzer?
•
Arrive at problem
resolution faster.
•
Avoid nuisance inverter
low voltage fault
circuit tripping.
•
Avoid damage to
motor drive.
Next steps
– Talk to your distributor or Fluke representative about
scheduling an on site demo or getting more product
information
Introduction to drive output
measurements
What is DC Bus?
• DC Bus functions as a voltage buffer
• Direct current (dc) voltage derived from AC rectifiers
• Provides constant energy supply to switching circuit
• DC bus voltage is ~1.414 x the RMS line voltage
• 480 Vac drive, the DC bus should be ~ 678 Vdc (Use a 1000v rated meter)
• Too low or noisy causes malfunction of drive output due to reduced energy available to the
output devices
Measuring the DC Bus
•
Recommendations:
• Fluke Scopemeter
• Fluke–87 V
• Exceeds safety standard 1000 V Cat III and 600 V Cat IV,
• Low pass filter, Peak capture, Min/Max recording to name a few features
Corrective Actions
Symptom:
Measurements:
Solution:
Voltage level high - Perform min/max recording of Correct Drive’s AC input
voltage
low Bus fault,
the bus DC voltage and AC
improper operation ripple/noise
Improper operation rectifiers
or Drive failure
or filtering circuits
Confirm Drive rating is
compatible with the motor
and load
•
Return on investment
•
•
Hourly cost of downtime x number of hours + Cost of replacement equipment = $ ???
Test equipment cost = $3,500
Fluke-190 -II
Measuring voltage unbalance
• Measure the voltage on each terminal at the drive output
• Next check the voltage at the motor terminals
• Any unbalance could be problematic for the motor
Use a Multimeter or ScopeMeter with a low-pass filter function
(Vpwm) to measure the effective voltage to the motor.
Calculating voltage unbalance
Example
% Voltage (V) unbalance = (Max deviation from average V/average V) x 100
(The same calculation is used for current unbalance)
Interpreting voltage unbalance measurements
• Unbalance greater than 3% is problematic and will result in excessive
motor winding heat.
• Possible causes of voltage unbalance on the drive output are:
– One of the phase drive circuits is only partially conducting
– There is a voltage drop between the ASD’s output and the motor terminal due
to a poor connection
Measuring current unbalance
• Use a Fluke 4 channel (190-204/S) ScopeMeter with a current clamp on all three
drive output terminals to measure the current draw on each terminal.
• 10% unbalance should be the maximum
• Diagnostic benefits:
– Extend motor life
– Avoid catastrophic failure
– Reduce downtime and economic losses
Corrective Actions
Symptom:
Measurements:
Voltage/Current level Perform phase voltage
high - low output fault measurements (will influence
current balance)
Elevated motor
temperatures
Perform phase current
measurements
Measure motor temperature
Improper operation
or Drive failure
•
Measure winding resistance and
insulation
Solution:
Disconnect the load on the motor
and confirm balance changes –
improvement over load probable
cause
Disconnect the motor and
confirm Voltage balance changes
– improves motor perform then
winding and insulation
measurements
Confirm Drive rating is
compatible with the motor and
load
Return on investment
•
•
Hourly cost of downtime x number of hours + Cost of replacement equipment = $ ???
Test equipment cost = $3,500
Fluke-190 -II
What are output reflections?
• Occur as a result of impedance mismatch or change in the current transmission path.
• Show up as spikes on the lead and/or falling edges of the wave shapes on an
oscilloscope display.
• To use an analogy, consider what happens to a garden sprinkler when the flow of water is
momentarily changed by someone or something stepping on the rubber pipe.
• The pressure at the sprinkler head changes peaking as the built up pressure is released.
Measuring output reflections
• Overvoltage reflections can only be measured with an oscilloscope
• A four channel version is recommended.
• Attach the scope to motor terminals
• Typically we can not detect transients with a digital multimeter because the
duration is extremely short, too fast for the capture time of a typical multimeter.
Interpreting output reflection measurements
• Reflections > 50% of nominal voltage are problematic and can be 2 to 3 times
the DC bus voltage.
• Fast switching DC voltage from the IGBT (dV/dt).
• Reflections of the PWM signal are a result of a too long cable.
• Make sure the level does not exceed the motor and cabling insulation ratings.
Interpreting output reflection measurements
• Note the amplitude base and the faster time base.
• Screen shot on the left has faster time base
• Diagnostic benefits:
•
•
•
Prolong Drive and motor life
Avoid tripping overvoltage circuits
Reduce potential of cable and winding insulation breakdown
Corrective Actions
Symptom:
Measurements:
Solution:
Noisy motor
Perform phase voltage
measurements Peak to peak
Shorten cabling between the
Drive and the motor or
Install low pass filter, series
line reactors or RCimpedance matching filter
between the Drive and motor
Drive output
voltage and
current faults
Shorten life of
Drive, cabling,
bearings and
motor
Measure motor temperature
Measure winding resistance
and insulation
Vibration test for bearing
health
Rewind motor windings and
cabling with higher insulation
rating if reflections not
reduced
Replace bearings
•
Return on investment
•
•
Hourly cost of downtime x number of hours + Cost of replacement equipment = $ ???
Test equipment cost = $3,500
Fluke-190 -II
What is shaft voltage?
•
•
High frequency PWM voltages are coupled
to the stator and shaft.
When shaft voltage exceeds the insulating
capability of the bearing, current flows
through the bearing.
– Bearing destruction within a few months of
motor operation.
•
Look for shaft voltage higher than 8 volts.
– Breakdown voltage creates higher bearing
flashover currents, which causes increased
damage to the bearings in a shorter amount of
time.
– Solutions include a shaft grounding device
(the most common), conductive grease or
insulated bearings.
•
Diagnostic benefits:
– Extend bearing life
– Avoid downtime and associated economic
losses
What is volt per hertz ratio?
• The ratio of voltage to frequency determines the amount of torque
produced by an AC induction motor.
• By keeping this ratio constant the magnetic field inside the motor is kept
at a constant level which results in a constant torque.
Measuring volt per hertz ratio
• Use Fluke Scopemeter with Vpwm function.
• Vpwm: Replicates the amplitude of the fundamental frequency
• Use current clamp to measure the frequency
• Fluke Scopemeters can simultaneously display the frequency of the pulse
width modulation (PWM) output and a voltage comparable to the motor
nameplate rating.
Interpreting volt per hertz ratio measurements
• If V/Hz ratio is correct but the speed is off, check the drive program.
• An incorrect volts-per-hertz ratio can create a variety of problem.
•
•
•
•
•
High: motor will overheat.
Low: Loss of torque.
Unstable: rough running motor and loss of torque.
Unstable frequency: Varying speed of the motor.
Fluctuating in tandem: potential loss of torque.
• Diagnostic benefit:
•
•
Reduce excessive heating
Prevent loss of torque
Fluke 190 Series II ScopeMeter
•Capabilities
– Combines the power of a high performance oscilloscope and
paperless recorder in an easy to use test tool
– Extend your troubleshooting capabilities by visually
inspecting signals amplitude, time, shape and disturbance or
distortion characteristics
– Connect-and-View™ triggering for intelligent, automatic
triggering on fast, slow and even complex signals
• Gives you an instant stable display
– Automatic capture of the last 100 screens to find one-time
anomalies
• No user setup required
Fluke 190 Series II ScopeMeter
• Capabilities (continued)
• Four isolated floating channels
» Safely perform differential or floating measurements on
multiple signals simultaneously up to 1000 V
• TrendPlot records up to 16 days to catch intermittent
faults
• ScopeRecord helps you capture glitches as short as
8 ns
•
CAT III 1000 V/CAT IV 600 V ratings
» Safely perform measurements on equipment that is
permanently installed in plant electrical distribution
systems
Fluke 190 Series II ScopeMeter
•Capabilities (continued)
– Direct storage on internal memory
• 15 waveform memory locations internal
– Stores Scope-trace waveform data (4 traces each),
screen-copy and corresponding setup
– Setup storage allows for instant configuration of tests
– Isolated USB host port for direct data storage to a USB
memory device and easy PC communication
– USB memory devices expands storage and allows for
personal library of measurement and setups
– Up to 7 hours of battery operation
– Rugged and shock proof
What are the thermal signatures of key
components in the motor drive output?
• Thermal imagers can be used to scan the motor drive output to identify hot
spots or abnormal heating conditions
• Use a thermal imager to scan the component and look for irregular and nonuniform thermal patterns or anomalies
Interpreting the thermal signatures of key
components in the motor drive output
Motor Overheating
Increase over
Maximum
Temperature Rating
Insulation Life
Reduced by
+10°C (18°F)
-50%
+20°C (36°F)
-75%
+30°C (54°F)
-88%
• High resistance connections, phase imbalance and current overload contribute to variations
in thermal signatures
• Motor overheating can be caused by winding insulation and cooling problems
• Diagnostic benefit:
– Identify hot spots or anomalous conditions faster
– Avoid catastrophic failure
– Extend motor life
Fluke Thermal Imagers
•Capabilities
– Enhanced problem detection and analysis with IR- Fusion
Technology – only from Fluke
• Combines the power of infrared images with visible light images on the
same display
– Optimized for field use in harsh work environments
• Withstand a 6.5 foot drop
• IP 54 rated for dust and water
– Delivers clear, crisp images to find problems fast
• Multiple measurement capabilities
• Easy to use with simple navigation through menu driven selections
• IR-OptiFlex focus system and manual focus
– Smartview Software
• Easy, high-performance analysis and reporting
Fluke Thermal Imagers
• Ti100 Series
– Lightest, rugged, easy to use thermal imagers
• P3 Series
– Proven, Practical, Performance
• Ti Series
– Rugged tools for everyday use
• FlexCam® Series
– Feature packed for demanding applications
PQ / Scope Measurements Overview
•
•
•
•
•
•
3% Voltage Unbalance
10% Current Unbalance
.5% Frequency
10% Voltage Nominal Supply
5% THD
.9 Power Factor
7/17/2014
56
Drive measurement – Summary
•
Now you know how to check the output side of the
drive and the tools needed
– These tools help rule out issues that might be
affecting the output side of the drive
– Saving time and money.
•
How much time did you spend trying to fix these
kind of problems in the past?
•
How much time/money do you think you can save
by using a ScopeMeter and a thermal imager?
•
Next steps
– Talk to your distributor or Fluke representative
about scheduling an on site demo
– Getting more product information or go to
Fluke.com to learn more about using a
ScopeMeter to troubleshoot drives and control
electronics.
•
Arrive at problem
resolution faster.
•
Prolong motor drive and
motor life.
•
Reduce potential of
winding insulation
breakdown
•
Avoid tripping overvoltage
circuits.
Driven Components
• Vibration testing
Why vibration testing?
•
Early Indicators of Machine Health
–
–
–
–
Alignment - In motor drivetrains, it is how well centerline of two coupled shafts coincide
Bearings - Operating at reduced efficiency
Imbalance - Occurs when center of mass is not on center “heavy spot”
Looseness - Excessive clearance between parts or mountings that need tightening
Fluke 810 Vibration Tester
• With the Fluke 810, vibration testing is within reach
– It’s easy to use
– Provides answers when you need them
– Includes everything you need to get started
immediately
• You will understand
– Root cause of faults and fix it right the first time
– Severity of failures and prioritize your repairs
– Location of faults and focus your repair work
• It requires minimal upfront investment…but the
Return on investment is significant
Fluke 810 Vibration Tester – ease of use
Fluke 810 Vibration Tester
• Capabilities
– On-board diagnosis and location of mechanical faults:
• Bearings, looseness, misalignment, unbalance and
other (nonstandard faults)
– Fault severity scale
• Slight, Moderate, Serious, and Extreme
– Prioritized repair recommendations
– Diagnostic details include
• cited peaks and vibration spectra
– Context Sensitive Help
– Data export for more detailed Analysis
– Laser tachometer for accurate machine running speed
– 100 mV/g TEDS tri-axial accelerometer
– Data storage and tracking with VIEWER Software
– 8 hours battery life, rechargeable
Driven Component Measurement Tests
• IRT (Insulation Resistance Tester)
• Unbalance
– DMM
– Clamp
• Mechanical Balance (Vibration tester)
• Alignment (Alignment tool or Vibration tester)
• Looseness (Vibration tester)
• Bearing Wear (Vibration tester)
• Temperature (Infrared gun or Thermal Imager)
Driven Component Summary
•
If not diagnosed and corrected, alignment, bearings,
imbalance and looseness can accelerate wear of
motors and other mechanical equipment.
•
They can also create catastrophic failure, safety
problems, and damage close proximity equipment.
•
How much time did you spend trying to fix these
kind of problems in the past?
•
How much time/money do you think you can save
by using a Vibration analyzer like the 810?
•
Next steps
•
•
Talk to your distributor or Fluke representative about
scheduling an on site demo
Getting more product information go to Fluke.com to
learn more about using a Vibration tester to
troubleshoot mechanical equipment
• Reduce mechanical wear
• Avoid overheating and
failure.
• Improve efficiency, reduce
power consumption
• Reduce downtime and
economic losses.
64
Lecture Conclusion
Covered drive tests and measurements line side to load side.
Input Power
Quality with
Fluke-435
Drive & Drive output
with Fluke-190
Series-II ScopeMeter
Core temperatures
with Fluke Thermal
Imagers
Mechanical
Vibration with
Fluke 810
Diagnostic benefits of Input Power
• Measuring nominal supply voltage, current, and frequency
•
•
•
Arrive at problem resolution faster
Avoid nuisance inverter low voltage fault circuit tripping
Avoid damage to the Drive
• Unbalance measurements
•
•
Avoid tripping current overload fault protection
Avoid elevated motor temperatures
• Transients
•
•
•
Prolong Drive and motor life
Avoid tripping overvoltage circuits
Identifying transients helps isolate building faults
• Harmonics
•
•
Input Power
Quality with
Fluke-435
Avoid repair costs from excessive harmonic distortion
Avoid motor and transformer overheating
• Power Factor
•
•
Identifying and correcting low power factor saves money on utility bills
Prevent voltage drops and overheating by identifying capacity
restrictions
Diagnostic benefits of Drive & Drive Output
• Measuring voltage unbalance
•
•
•
Avoid tripping current overload fault protection
Avoid elevated motor temperatures
Avoid causing current unbalance
• Current unbalance measurements
•
•
•
Avoid tripping current overload fault protection
Avoid elevated motor temperatures
Current unbalance can lead to burnt windings
• Measuring output reflections
•
•
•
Prolong Drive and motor life
Avoid tripping overvoltage circuits
Reduce potential of cable and winding insulation breakdown
• Volts per hertz ratio measurements
•
•
Reduce excessive heating
Prevent loss of torque
Drive & Drive
output with
Fluke-190 SeriesII ScopeMeter
Diagnostic benefits of Motor & Drive Train
• Vibration testing
• Diagnostic benefit:
• Early Indicators of Machine Health
•
•
•
•
Alignment
Bearings
Imbalance
Looseness
• Provides:
•
•
•
Root cause of faults
Severity of failures
Location of faults
Driven Component
Fluke-810 Vibration
Tester
Diagnostic benefits of Thermal Imaging
• Diagnostic benefit:
– Identify hot spots, cold spots, or unexpected conditions faster
– Arrive at problems resolution faster.
– Avoid damage to the motor drive, motor, driven components,
and connections
– Avoid catastrophic failure
– Extend motor life
Fluke-125
Thermal Imager
Hands-On Stations
Be Safe!
Refer to your seminar packet/student reference
materials