1
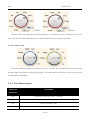
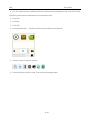
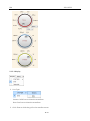
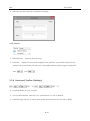
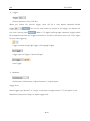
BM Series User Manual (Software) For Oscilloscope, Signal Generator and Logic Analyzer Content 1 2 3 4 5 Welcome....................................................................................................................................................... 3 Software Version .......................................................................................................................................... 3 System Requirement .................................................................................................................................... 4 Getting Started ............................................................................................................................................. 5 4.1 Driver Installation on Windows XP ................................................................................................... 6 4.2 Driver Installation on Windows 7 ..................................................................................................... 7 Driver Installation on Windows 7 32bit........................................................................................................ 7 Driver Installation on Windows 7 64bit........................................................................................................ 7 4.3 Driver Installation on Windows 8 ..................................................................................................... 7 Software introduction .................................................................................................................................. 8 5.1 Overview........................................................................................................................................... 8 5.2 Basic Operation ................................................................................................................................ 8 5.3 5.2.1 Start and Stop ....................................................................................................................... 8 5.2.2 Waveform Display Area ........................................................................................................ 9 5.2.3 Display Menu ...................................................................................................................... 10 5.2.4 Auto Measurement ............................................................................................................ 14 5.2.5 Menu .................................................................................................................................. 16 5.2.6 Horizontal Toolbar (Settings) .............................................................................................. 19 5.2.7 Toolbar ................................................................................................................................ 21 5.2.8 Record and Review ............................................................................................................. 22 Signal Generator Software Function .............................................................................................. 25 5.3.1 PWM .......................................................................................................................................... 25 5.3.2 Basic Waveform Signal............................................................................................................... 26 5.4 Logic Analyzer Software Function .................................................................................................. 26 BM 1 2014-05-22 Welcome BM Series oscilloscopes deliver unique features and high performance, ideal for research and education. 2 Software Version Current Software Version: BM V1.2 Functions Live Sampling Record and Review Trigger AC & DC Coupling Auto Measurement Details Dual channels for the live display of consecutive samples Waveform files can be saved to retrace and review No Trigger, Normal Trigger, Single Trigger, Auto Trigger Support AC & DC coupling Display diagrams of maximum, minimum, average, frequency, period, positive width, negative width, duty rate, peak-to-peak, rise time and Vrms Cursor Measurement Horizontal and vertical markers indicating X/Y-axis values of waveform data Zoom Function Zoom in/out FFT Frequency Real-time display of FFT amplitude-frequency curve Domain Analysis Move Left/Right Waveform shift Math Operation CH1+CH2, CH1-CH2, CH1*CH2 Lissajous Pattern Frequency measurement or phase difference Save Screenshot Save the waveforms as .txt Screenshot of the current software interface 3 / 27 BM 2014-05-22 Warning When collecting data exceeds the range, a light red translucent rectangular bar at the top of the waveform will be displayed to warn the waveform has exceeded the scope, but this function is only to warn the user, does not affect the software running Shortcuts key Add (Ctrl + <-) / (Ctrl + ->), (Ctrl + M), (Space), (Ctrl + A) shortcut function to Waveform moves, recording and playback, start / stop, calibration windows Feature Details OUT OF RANGE Green App .NET Framework Standalone application .Net Framework 2.0 provides a comprehensive and consistent programming OS Support Versatile Algorithm 3 Win XP, Win 7, Win 8 (both 32 bit and 64 bit) Improved algorithm System Requirement Item Description OS Support XP, Win 7, Win 8 (32 & 64 bit) CPU >2.0G RAM >1.0G SDK .Net Framework 2.0 Ports USB 2.0 compliant port Temperature 0 ~ 40 centigrade Note: .NET Framework 2.0 is necessary on XP OS. We provide 32-bit .Net framework 2.0 (dotnetfx20.exe) in the software package for your convenience. 4 / 27 BM 2014-05-22 .Net Framework 2.0 is pre-installed on Win 7 OS. You can also get the latest version on http://www.microsoft.com/en-us/download/details.aspx?id=1639 4 Getting Started 1. Plug in your device. Windows will recognize it and have your computer to work with it. Please unplug other USB devices in case of interference from its high current. 2. Install the driver. You will find the driver under the folder “driver” in the software package. Detailed instructions on how to install driver on different OS are described in Chapter 4.1 and 4.2. 3. Run the software application. Click the Start button on the lower right corner, and it shows the zero voltage waveform of Channel 1. Turn on CH2, the waveform of Channel 2 will display. 4. The small metal tip between the two BNC ports will output a square wave signal of 1KHz with an maximum of about 3.3V. You can use it to test, calibrate and set up the device: Switch the probe to x1; Connect one end of the probe to CH1 of the device, and the other end to the small metal tip; Turn the Time/DIV to 1ms, and the measured waveform will be displayed. 5 / 27 BM 2014-05-22 4.1 Driver Installation on Windows XP 1. Right-click My Computer to run the Device Manager, click Other Devices, and right-click USBxxx to select Update the Driver. 2. Choose Install from a list or specific location, and Next. 3. Click Browse, setup the location path, such as E:\ Driver_XP_Win7\driver, and then Next: 4. After the installation, you will find our device in the device manager. 6 / 27 BM 2014-05-22 4.2 Driver Installation on Windows 7 Driver Installation on Windows 7 32bit 1. 2. 3. Right-click My Computer to run the Device Manager, click Other Devices, and right-click USBxxx to select Update the Driver. Update the USBxxx driver on My Computer. With the driver path such as E:\ Driver_XP_Win7\driver, click Next. (If Windows can not verify the publisher of this driver software, pleas click Install This Driver Software Anyway.) Driver Installation on Windows 7 64bit 1. 2. 3. 4.3 Right-click My Computer to run the Device Manager, click Other Devices, and right-click USBxxx to select Update the Driver. Update the USBxxx driver on My Computer With the driver path such as E:\ Driver_Win7_64\driver , click Next Driver Installation on Windows 8 On Windows 8 (32 bit or 64bit), the device driver would be installed automatically since the device plugged in. On other OS, we may have to install the driver manually. 7 / 27 BM 2014-05-22 5 Software introduction 5.1 Overview 5.2 Basic Operation 5.2.1 Start and Stop There are two ways to start the scope: 1. Open this software, and then plug in the device. 2. Open this software after plugging in the device, and then click the Start button or the keyboard spacebar. Please click the Stop button and exit the software before unplugging the device or click the spacebar on the keyboard again. 8 / 27 BM 2014-05-22 5.2.2 Waveform Display Area 5.2.2.1 Waveforms The Display Area shows waveforms from CH1 (blue) and CH2 (yellow) . 5.2.2.2 Zero-input positions You can drag the triangle markers to adjust the zero-input position for each channel. 9 / 27 BM 2014-05-22 5.2.3 Display Menu 5.2.3.1 Fit all Reset display settings to default 5.2.3.2 Measurement Drag the cross shaped cursor to measure time interval and voltage range of the selected area. 5.2.3.3 Info Show the device name, state (Stopped /Start/ Paused), function type (Live / Recording / Reviewing) and current sample rate. 5.2.3.4 Zoom in Zoom in on the selected area (with thumbnail). To reset the default display settings, click on the “Fit all” button. 10 / 27 BM 2014-05-22 5.2.3.5 Zoom out Zoom out on the horizontal axis. 5.2.3.6 Navigation Tool Move horizontally through the trace. Click to a step move, and keep holding a mouse down state to move continuously. We can also move through the trace by mouse dragging conveniently. 5.2.3.7 Zoom in of X Zoom in on the horizontal axis. 5.2.3.8 Color Mode Switch the color mode. The black-and-white mode is suitable for creating screenshots for reports; the color mode is suitable for observation. 11 / 27 BM 2014-05-22 5.2.3.9 Lissajous pattern X-Y Plot acts to analyze correlation of data of two channels. Lissajous diagram is displayed in the screen when you use X-Y Plot, which enables to compare frequencies, amplitudes and phases of counterpart waveform against the reference waveform. This makes it possible to compare and analyze frequency, amplitude and phase between input and output. Do these steps as follows: 1. Connect the CH1 probe to the input of the circuit, and connect the CH2 probe to the output of the circuit. 2. Adjust the vertical scale and offset to display approximately the same amplitude signals on each channel. 3. Click . The oscilloscope will display a Lissajous pattern representing the input and the output characteristics of the circuit. 4. Adjust the scale and offset to a desirable waveform display. 12 / 27 BM 2014-05-22 5. Apply the Ellipse Method to observe the phase difference between the two channels. Instruction of the Ellipse Method Sinθ= A/B or C/D, where θ= phase shift (in degrees) between the two signals. From the formula above: θ= ±arcsine (A/B) or ±arcsine (C/D) θ must be in the range of (0~π/2) or (3π/2~2π) if the main axis of the ellipse is between I and III quadrant, . If the main axis is at II and IV quadrant, θ must be in the range of (π/2~π) or (π~3π/2). 5.2.3.10 Save Save the collected data in the text format (.TXT). 5.2.3.11 Screenshot Do screenshot of the current entire screen. 5.2.4.1 Time Knob 13 / 27 BM 2014-05-22 DDS120 DDS140 Use this knob to change the time base parameter (Time/DIV) for both channels at the same time. The selected value indicates the time interval the width of each grid represents. 5.2.4.2 Voltage Knobs Use these knobs to change the Volt/DIV for each channel. The selected value determines the voltage range the height of each grid represents. This value does not affect the scale, but only how the waveform is displayed. 5.2.4 Auto Measurement Measured Description Parameters Max The highest voltage value of the waveform Min The lowest voltage value of the waveform P-P Peak-to-Peak (Max – Min) Freq Average frequency of the waveform 14 / 27 BM 2014-05-22 Average Average voltage value of the waveform Period Period of the waveform +Width The pulse width positive / negative with respect to the mid value as reference -Width Duty Rate Positive pulse width divided by the cycle Rise time Time of waveform from peak-to-peak position increased from 5% to 95% Vrms RMS value of the voltage value The Auto Measurement Area of this software shows a variety of real-time measurement data for the waveform currently displayed in the Waveform Display Area. Click on the channel tabs to switch. Note: If the waveform displayed is shorter than one period or longer than 50 cycles, the results of time-related measurements will be displayed as 0, but that doesn’t mean the actual value is 0. 15 / 27 BM 2014-05-22 5.2.5 Menu 5.2.5.1 File Save Data: Save the collected data in the text format (.txt). Save Setup: Save the current settings in the text format (.set). Load Setup: Load the file of text format (.set) into current settings . Print: Print the current waveforms which displayed on screen. Print Preview: Preview the current waveforms to print. 5.2.5.2 View 16 / 27 BM 2014-05-22 FFT: FFT measurement includes amplitude measurement (displayed on the vertical axis) and frequency measurement (displayed on the horizontal axis). CH1+CH2 CH1-CH2 CH1*CH2 Record and Review: Show or hide the panel of Record and Review. Toolbar: Show or hide the toolbar. Control Window: Show or hide Time knob and Voltage knobs. 17 / 27 BM 2014-05-22 5.2.5.3 Display Line Type: Vectors: Solid lines to draw the waveform. Dots: Dot lines to draw the waveform. Grid: Show or hide the grid in the waveform area. 18 / 27 BM 2014-05-22 Intensive: Set the intensity of waveform and grid. 5.2.5.4 Utility Default Setup: Calibrate: Load the factory setup. Adjust the zero-input voltage to zero position. You should remove all the probes and turn on both ch1 and ch2 in the toolbar before performing this calibration. CH1: CH2: 5.2.6 Horizontal Toolbar (Settings) Coupling Mode: DC / AC coupled Turn on/off Channels: Channel is ‘on’ and channel 2 is ‘off’ by default. Probe Settings: Set this to match your probe attenuation factor (1X, 10X or 100X). 19 / 27 BM 2014-05-22 Trigger: Channel Selection: CH1 / CH2 /Ext When you choose Ext channel trigger, there will be a start button appeared beside ,click on the start button to initiate an Ext trigger, the button will turn into a waiting state .When a TTL digital uprising edge happened, trigger would be completed and show the triggered waveform, and then, the button turns into “start” again for your next triggering., Trigger method: Rising Edge Trigger / Falling Edge Trigger Trigger type: No Trigger / Normal /Single* Auto Trigger Modules: Oscilloscope / Oscilloscope + Signal Generator / Logic Analyzer Trigger level: When trigger type “Normal” or “Single” is selected, a triangle marker (“T”) will appear in the Waveform Display Area. Drag it to adjust trigger level. 20 / 27 BM 2014-05-22 Rising Edge Trigger / Falling Edge Trigger 5.2.7 Toolbar Save Data: Print: Save the collected data in the text format (.txt). Print the current waveforms which displayed on screen.. Intensity: Zero Calibration: Set the intensity of waveform and grid. Adjust the zero-input voltage to zero position. 21 / 27 BM 2014-05-22 You should remove all the probes and turn on both ch1 and ch2 in the toolbar before performing this calibration. CH1: CH2: Record and Review : Factory Setup: Shortcut for “Record and Review”. Load the factory setup. 5.2.8 Record and Review Waveform records will be saved in a unique file format (“.dds120” or “dds140”) in the application folder. File name will be automatically generated using date and time when the recording begins. File name format is: Year + Month + Day + Hour + Minute. Configuration 22 / 27 BM 2014-05-22 Click the Configuration button to set the number of frames you want to record. A window for settings will pop up. Record Click the Record button to start recording (when it’s red) and the button will start flashing, indicating that the waveforms are being recorded. This button is gray when the recording function is temporally unavailable. Possible causes are: the device is not properly connected, the data collection has not started or the waveform is being played back. The recording function not only records all the waveform data on the screen, but also the following settings. These settings will be automatically restored during playback. 1 Selected value of the Time knob 2 Selected value of the Voltage knob(s) for channel(s) that is/are turned on Channel Status (On/Off) 3 Playback 1. Click the Folder button . 2. Select the file you want to open and click “Open”. The full path of the selected file will be displayed in the text field below the button and playback will start. 23 / 27 BM 2014-05-22 4. A dialog box will prompt when the software finishes playing the file. Play Control: This shows the total number of frames the file contains and the frame which is currently being played. You can move forward or backward by clicking Up / Down arrows or enter the frame number that you want to play. Click to start / pause. Note: 1. Real-time data collection will stop when the software starts playing a selected file. 2. One of the ways to tell whether the software is collecting real-time waveform data or playing a selected file is to look at the background color of the Waveform Display Area. Real-time collection Dark Blue Playback Brown 24 / 27 BM 5.3 2014-05-22 Signal Generator Software Function When the Signal Generator module is plugged in, please select "Oscilloscope + Signal Generator" here to enable relevant functions (shown in a new tab). Click this Action button to start signal output. Click it again to stop. 5.3.1 PWM Select the PWM to output standard square wave signal (maximum frequency: 20K). The duty cycle could also be adjusted, stepping at 10%. Frequency can be specified using the keypad provided. The default output settings are 500Hz and 50% duty cycle. 25 / 27 BM 2014-05-22 5.3.2 Basic Waveform Signal Select one of the waveforms: square wave, sine wave, triangle wave. Frequency can be specified using the keypad provided (1Hz ~ 20MHz). The amplitude and offset can be easily set via slider control. 5.4 Logic Analyzer Software Function When the Logic Analyzer module is plugged in, please select "Logic Analyzer" here to enable relevant functions. Logic Analyzer Interface Front View The numbers on the left side indicate the channel number. Waveforms for different channels are identified by color. 26 / 27 BM 2014-05-22 Use the Time knob to change the time base parameter (Time/DIV) for all channels. Click the Start button to start. Click again to stop. 27 / 27