1
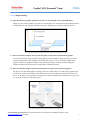
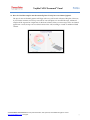
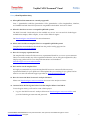
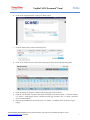
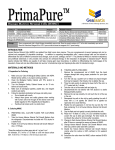
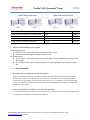
TaqMan® hPSC Scorecard™ Panel
TaqMan® hPSC Scorecard™ Kits
A15871
FAQs
TaqMan® hPSC Scorecard™ Panels
A15872
A15876
A15870
Product
Qty
Cat. No.
TaqMan® hPSC Scorecard™ Kit 2 x 96w FAST
1 kit
A15871
TaqMan® hPSC Scorecard™ Kit 384w
1 kit
A15872
TaqMan® hPSC Scorecard™ Panel 2 x 96w FAST
2 plates
A15876
TaqMan® hPSC Scorecard™ Panel 384w
1 plate
A15870
1.
What is included with each kit or panel?
Panel configurations:
Two 96-well (2 x 96w FAST) plates with optical plate covers
One 384-well (384w) plate with optical plate covers
Kit configurations:
Two 96-well (2 x 96w FAST) plates with optical plate covers & TaqMan® Gene Expression
Master Mix
One 384-well (384w) plate with optical plate covers & TaqMan® Gene Expression Master
Mix
Part 1: Sample Generation
2.
How many cells are required to run one experiment?
While we recommend that you use about 0.5 million cells per experiment, or the number of cells
equivalent to 1 well of a 6-well dish, you can use as few as 100,000 cells when performing RNA
purification. If you perform a lysis protocol using Cells-to-CT™ or CellsDirect™ One-Step qPCR kits,
as few as 15,000 cells is sufficient. Please note, however, that reducing cell number can compromise
the quality of the results.
3.
Can I use cells that are on feeders or in feeder-free conditions?
Yes. The hPSC Scorecard™ Panel measures the potential for self-renewal and trilineage differentiation
of PSCs grown on feeders or in feeder-free conditions.
Visit thermofisher.com/scorecard for more product information, data, protocols, and troubleshooting tips or contact
[email protected] for support.
1
TaqMan® hPSC Scorecard™ Panel
4.
FAQs
How do I harvest human PSCs cultured using feeder-dependent culture systems?
We recommend removing feeders from your culture before proceeding with Scorecard™ analysis. To
remove feeders, harvest your PSCs with collagenase, allow the colonies to settle by gravity
sedimentation to reduce feeder-carryover, and re-seed cells in feeder-free conditions on Geltrex®
matrix-coated dishes and MEF conditioned medium for a 1 to 2 passages. The presence of feeders can
contribute to gene expression measured in the assay, thus altering the gene-signature pattern.
5.
Can I use cells on a feeder-free system cultured in novel media?
The hPSC Scorecard™ Panel measures self-renewal and trilineage differentiation potential of PSCs
and is not restricted by culture conditions. You should be aware that using novel media systems may
have particular effects on the cells in terms of pluripotency and/or their differentiation. We
recommend designing experiments that use novel media by including a control condition that utilizes
traditional media or media in which expression patterns have been tested and confirmed. The most
recent version of the hPSC Scorecard™ Analysis application offers a differentiation index plot for
viewing gene expression in EBs relative to the undifferentiated state.
6.
What is the minimum time required to form EBs and is there a specific protocol?
You can differentiate cells using any of the established methods. When using suspension embryoid
bodies, we recommend that you allow at least 7 days of differentiation prior to analysis.
7.
I am only interested in directed differentiated cells. Do I need to use a particular method?
You can perform directed differentiation according to your own methods. However, the time point
when expression is noticeable will largely depend on the robustness of the methods. We recommend
testing a few time points to monitor differentiation with time.
8.
Have you tested cells grown in NIM with Scorecard ™ analysis?
In the data shown for directed differentiation of cells into ectoderm in monolayer culture, the 3-day
time point is too early to detect ectoderm expression, but the cells become positive for ectoderm by
day 5. H9 cells were differentiated into NSCs using Gibco ® PSC Neural Induction Medium (denoted
as NIM) and hPSC Scorecard™ analysis was performed at various time points. The control sample is
undifferentiated H9 ESC.
Visit thermofisher.com/scorecard for more product information, data, protocols, and troubleshooting tips or contact
[email protected] for support.
2
TaqMan® hPSC Scorecard™ Panel
Sample Name
9.
FAQs
Self-renewal
Ectoderm
Mesoderm
Endoderm
H9-CM-Ctrl
0.61
-0.53
-0.80
-1.57
H9-NIM-Day3
-3.62
-0.11
-1.06
-1.79
H9-NIM-Day5
-4.56
1.16
-1.12
-1.99
H9-NIM-Day7
-5.62
0.96
-1.75
-1.73
What is the earliest passage that I can use when I generate iPSCs?
We recommend that you culture iPSC clones to at least passage 8–10 until they are stable and
homogeneous, prior to analyzing the hPSC Scorecard™ Panel. Early passage iPSC clones may give
low self-renewal (“pluri” in v1.1 of the analysis software) scores or show higher expression of lineage
genes. See “Part 6: Examples of results” for more information on how to interpret the hPSC
Scorecard™ Analysis Software output.
Table 1. Comparison of hPSC Scorecard™ Panel results at different
passage numbers. At passage 5 (P5), the expression profile of cells does
not correlate to that of a truly pluripotent cell line. At passage 8 (P8), the
expression profile matches the reference standard for the four “good”
clones (BS4-iPSC1, BS4-iPSC3, BS4-iPSC7, BS4-iPSC8), but not for the
one “poor” clone (BS4-iPSC5). Scores close to zero (0) for “pluri”, endo,
meso, and ecto represent qualities of a “good” clone; those shaded green
indicate upregulation (>1) and shaded red indicate downregulation (<1).
10. When I use Sendai virus (SEV) to generate iPSCs, can I check for the presence of residual virus?
SEV is included in the panel and can detect the presence of the Sendai virus backbone. Note that this
method will not distinguish between the different reprogramming factors but just the presence or absence
of the residual virus in the cells. If an unexpected signal is detected, check the amplification curve to
determine if it is a false positive. If it’s a false positive, you may ignore the flag.
Visit thermofisher.com/scorecard for more product information, data, protocols, and troubleshooting tips or contact
[email protected] for support.
3
TaqMan® hPSC Scorecard™ Panel
FAQs
11. Will the presence of Sendai virus affect my results?
Results indicate that the presence or absence of Sendai virus in established iPSC clones does not have
an impact on pluripotency.
12. Does the reprogramming method affect the Scorecard™ results?
Minor differences in gene expression profiles are sometimes observed based on the reprogramming
method, but in general the hPSC Scorecard™ results do not change significantly for lines derived
using various reprogramming methods. As an example, ESC and iPS derived using episomal or
Sendai-based reprogramming systems were tested before and after seven days of spontaneous
differentiation. Cells were grown in KSR-based media on irradiated MEFs prior to removal of FGF for
EB formation.
Figure 1. The top panel shows the pass/fail results in the main interface of the hPSC Scorecard ™ Analysis Software. The graphs on the bottom
show the scores for each of the four sub-panels tested. These scores measure how closely the sample aligns to the expression profile of the
nine undifferentiated pluripotent stem cell lines in the reference set. In general, scores close to zero indicate similarity to the reference set, and
scores greater than about 1 indicate upregulation relative to the reference set and scores less than -1 indicate downregulation relative to the
reference set. Notice that after seven days of EB formation, the pluripotency (or self-renewal) markers are significantly downregulated and
ecto, meso and endo factors are upregulated. Also note that the scores for each germ layer are independent of the others. For example, the
magnitude of the scores for ectoderm cannot be compared to the magnitude of the scores for endoderm. Scores can only be compared
among different samples for the same germ layer.
Visit thermofisher.com/scorecard for more product information, data, protocols, and troubleshooting tips or contact
[email protected] for support.
4
TaqMan® hPSC Scorecard™ Panel
FAQs
13. Can I analyze somatic non-pluripotent primary cells with the TaqMan ® hPSC ScorecardTM Panel?
Somatic non-pluripotent primary cells, such as the parental lines used for iPSC generation, are not
pluripotent in nature and their scores will be low. However, the expression of lineage markers will
largely rely on homogeneity of the cells. Note that the markers in the panel are designed to evaluate
early germ layer specification and not any particular terminally differentiated state.
Visit thermofisher.com/scorecard for more product information, data, protocols, and troubleshooting tips or contact
[email protected] for support.
5
TaqMan® hPSC Scorecard™ Panel
FAQs
Part 2: Sample Preparation
14. How long can I store cells harvested in TRIzol® reagent?
You can store homogenized samples at room temperature for a few hours, or at –60 to –70°C for at
least one month.
See http://tools.invitrogen.com/content/sfs/manuals/trizol_reagent.pdf for more information.
15. Can I prepare RNA using the RNA kit of my choice?
Yes, but we recommend using Life Technologies products because the hPSC Scorecard™ Panel
protocol was developed and optimized using Life Technologies reagents and kits.
16. Can I skip the RNA purification step and use a lysis protocol instead?
Yes, while RNA purification is recommended, it is not strictly required.
H9 ESC
Sample Name
Self-renewal
Ectoderm
Mesoderm
Endoderm
H9 TRIzol
0.25
-0.69
-0.52
-0.86
H9 CellstoCt
0.04
-0.45
-0.34
-0.62
H9 CellsDirect
0.52
-0.91
-0.45
-0.94
Figure 2. All samples, regardless of sample size, pass the test for undifferentiated cells. Cells were cultured in KSR-based media on irradiated
MEFs in the culture dish formats shown prior to Scorecard™ analysis. Note that negative scores for germ layer markers in undifferentiated
samples just indicates lower levels of these factors relative to the undifferentiated reference standard lines, and is a perfectly acceptable
result. The difference between scores of the self-renewal (pluripotency) factors in these samples is unlikely to be statistically significant. A
minimum of 15,000 undifferentiated cells or 6 embryoid bodies is required to obtain an answer with the hPSC Scorecard™ analysis using the
Cells-to-Ct or CellsDirect protocols. When purifying RNA, a minimum of 100,000 cells is recommended.
Visit thermofisher.com/scorecard for more product information, data, protocols, and troubleshooting tips or contact
[email protected] for support.
6
TaqMan® hPSC Scorecard™ Panel
FAQs
17. Do I need to perform DNase treatment?
We recommend that you include DNase treatment of all samples as a good practice, despite the fact
that the majority of primers span across an intron and do not amplify (or in some cases, minimally
amplify) contaminating genomic DNA.
See http://products.invitrogen.com/ivgn/product/AM1906 for more information.
18. How long can I store RNA after it is prepared?
Properly prepared RNA will last for years when stored properly at –80 C.
19. How much RNA is required for the RT reaction?
We recommend using 1 µg of RNA per sample.
Visit thermofisher.com/scorecard for more product information, data, protocols, and troubleshooting tips or contact
[email protected] for support.
7
TaqMan® hPSC Scorecard™ Panel
FAQs
Part 3: Sample Loading
20. Why should I set up cDNA synthesis in 8 wells of a 96-well plate or in 8-well PCR strips?
Setting up your cDNA synthesis in 8 wells of a 96-well plate or in 8-well PCR strips facilitates sample
loading of the 96-well and 384-well hPSC Scorecard™ Panel plates. Follow the schematic below:
21. How do I load the samples on to my 384-well plate if I don’t have a multichannel pipette?
You can load samples using a single channel pipette, but this method is time-consuming and may
increase pipetting error. We strongly recommend that you use an 8- or 16-channel multichannel
pipette. You also can dispense samples using automated systems, with the understanding that
additional sample will be required to compensate for the dead volume.
22. How do I load the samples onto the 384-well plates if I only have an 8-channel pipette?
The tips of most 8-channel pipettes will align with every other well so you will need to pipette twice
to load every well in each column of the plate. The first set of 8 samples can be loaded in rows A, C,
E, G, I, K, M, and O. The second set of 8 samples can then be loaded into the alternate rows B, D, F, H,
J, L, N, and P. Follow the schematic below:
Visit thermofisher.com/scorecard for more product information, data, protocols, and troubleshooting tips or contact
[email protected] for support.
8
TaqMan® hPSC Scorecard™ Panel
FAQs
23. How do I load the samples onto the 384-well plates if I only have a 16-channel pipette?
The tips of most 16-channel pipettes will align with every well in each column of the plate. However,
if your cDNA reactions were set up in 8 wells of a 96-well plate or in 8-well PCR strips, additional
sample will be required to compensate for the dead volume. When you insert 2 tips of the 16-channel
pipette into 1 well, the tips can’t reach the bottom of the well, resulting in a need for additional dead
volume.
Visit thermofisher.com/scorecard for more product information, data, protocols, and troubleshooting tips or contact
[email protected] for support.
9
TaqMan® hPSC Scorecard™ Panel
FAQs
Part 4: Gene Expression Assay
24. What qRT-PCR instruments are currently supported?
ViiA™ 7, QuantStudio™ 12K Flex, QuantStudio™ 7 Flex, QuantStudio™ 6 Flex, StepOnePlus®, 7500 Fast,
and 7900HT Fast Real-Time PCR systems are compatible with the hPSC Scorecard™ Panel.
25. What if I don’t have access to a compatible qRT-PCR system?
The hPSC Scorecard™ Panel analysis is also available as a service. You can send Life Technologies
isolated RNA samples, cDNA samples, or even cells in TRIzol® reagent.
See lifetechnologies.com/cellmodel for more information.
26. Where can I find the run template files for a compatible qRT-PCR system?
Template files are available for download from the product catalog pages and at:
lifetechnologies.com/scorecardhelp.
27. How do I set up my experimental run?
The template files contain all of the necessary experimental details for you to run your instrument.
There is no need to modify any of the experimental details if you are using the template file (.edt).
Step-by-step guides on how to run the qPCR instruments are available at:
lifetechnologies.com/scorecardinstrument.
28. Do I need to use the template files?
We highly recommend that you use the template file because it contains all of the necessary
experimental details for your qPCR run. If the template file is not working for you, please send an
email to our stem cell technical support specialists at [email protected].
29. How do I access the hPSC Scorecard™ Analysis Software?
Please visit lifetechnologies.com/scorecarddata for access to the analysis software.
30. I want to know the list of genes before I run the samples? Where I can find it?
To see the gene names, you’ll need to create a demo project.
a.
Log in to the hPSC Scorecard™ Analysis Software at lifetechnologies.com/scorecarddata with
your Life Technologies username and password.
Visit thermofisher.com/scorecard for more product information, data, protocols, and troubleshooting tips or contact
[email protected] for support.
10
TaqMan® hPSC Scorecard™ Panel
b.
Click on the encircled link to create your demo project.
c.
Click the Demo Project name in the Project list.
FAQs
d. Click on the checkbox next to the name of the project above the results summary panel.
e.
f.
g.
Click the dark gray “Reports” Button at the upper right of the software.
Click the “Excel (XLS)” tab, select the results to include (“Scorecard results”, “Scorecard values”,
“CT values”, “Fold change values”, and the Excel file type as either “XLS” or “XLSX”) and then
click “Download Data.”
Open the spreadsheet file, and click on the “CT Values” worksheet tab to see the list of gene
targets.
Visit thermofisher.com/scorecard for more product information, data, protocols, and troubleshooting tips or contact
[email protected] for support.
11
TaqMan® hPSC Scorecard™ Panel
FAQs
31. How many genes are tested per sample?
93. There are 9 self-renewal genes, 74 lineage specific genes, and 10 housekeeping and control genes.
32. I accidentally ran a comparative Ct experiment type instead of a standard curve experiment type.
Can I still use my data with the hPSC Scorecard™ Analysis Software?
The hPSC Scorecard™ Analysis Software currently only accepts data collected with the “Standard
Curve” experiment type. To change your experiment type, open your data in the instrument
software. In the “Set-up” menu, change your experiment type to “Standard Curve.” You may receive
a warning message, but that is okay. After you change the experiment type, return to the Analysis
menu and reanalyze the data by pressing the green “Analyze” button. After you save your data, you
can import the file into the hPSC Scorecard™ Analysis Software.
Visit thermofisher.com/scorecard for more product information, data, protocols, and troubleshooting tips or contact
[email protected] for support.
12
TaqMan® hPSC Scorecard™ Panel
FAQs
Part 5: Data Analysis
33. What web browsers are compatible with the analysis software?
The hPSC Scorecard™ Analysis Software is compatible with the following web browsers:
Internet Explorer® 9
Safari®
Google® Chrome™
34. How do I access the hPSC Scorecard™ Analysis Software?
Please visit lifetechnologies.com/scorecarddata for access to the analysis software.
35. I can’t sign-in to my Life Technologies account, what should I do?
Retrieve your username or password using the appropriate links on the sign-in page. If you don’t
have a username and password, click “Register Now” in the New Customer section of the log-in
page.
36. Where do I find more information about how to use the software?
The user manual is available from the help menu within the software, and at
lifetechnologies.com/scorecardsoftware.
37. How do I create a project and upload my data?
Click “Create a Project” to identify its Name, Instrument Type, Block, and Description, click “OK”,
and then click “Upload Data” to start using the analysis software.
Visit thermofisher.com/scorecard for more product information, data, protocols, and troubleshooting tips or contact
[email protected] for support.
13
TaqMan® hPSC Scorecard™ Panel
FAQs
38. My data isn’t being uploaded, what should I do?
The analysis software validates the data file upon import. If your file is not imported (or you receive
an error), click the pencil icon
to edit the project, confirm that you have the correct Instrument
Type and Block designated in the project window, and verify that you have used one of the following
TaqMan® hPSC Scorecard catalog products: A15870, A15876, A15872, or A15871. The analysis
software is compatible only with data obtained with those specific panels.
If you see an error message that identifies that the experiment was not analyzed by the Ct method,
follow the steps outlined below.
a.
b.
c.
Open the .eds file in your data collection software.
Click to open Analysis Settings dialog (from the menu, go to Analyze -> Analysis Settings).
Check to see if Ct algorithm is selected.
i. If Ct is selected, close Analysis Settings dialog.
ii. If Crt is selected, change it to Ct, and then save and close the Analysis Settings dialog.
d. Click the Analyze button.
e. Save it.
f. Click “Upload Data” to import the new file.
39. What sample type should I select?
The software allows you to easily evaluate pluripotency and/or inductive differentiation one germ
layer at a time. To make it a little easier, a set of common sample types have been already built into
the software to allow you to get to your results faster:
All Pluripotency: Quickly confirm the self-renewal capacity of undifferentiated samples.
All Ectoderm / All Endoderm / All Mesoderm: Evaluate the inductive differentiation specified to
one or more germ layers.
All Trilineage: Evaluate all three germ layers simultaneously (e.g. of EB samples).
Multiple Sample Types: Allows you the flexibility to mix and match samples types for analysis.
40. Do I need to run a new sample if I want to look at a different sample type?
No. The software analyzes and retains all of the qPCR data from the plate upon import. If you want
to look at a different sample type, simply select the desired sample type from the drop down list, and
the analysis software will automatically update the results.
Visit thermofisher.com/scorecard for more product information, data, protocols, and troubleshooting tips or contact
[email protected] for support.
14
TaqMan® hPSC Scorecard™ Panel
FAQs
41. My sample has a red flag on it, or is not showing any results. What does that mean?
The hPSC Scorecard™ Analysis Software performs a set of quality controls checks upon data import
to ensure the quality of the results. For more information about “hPSC Scorecard assay results” and
how to “Interpret results”, refer to the hPSC Scorecard™ Analysis Software Help system.
You may see one of the following red flag warnings:
Internal positive control: The expression levels of the housekeeping genes were low, signifying
that there was an issue with the qRT-PCR. The sample is excluded from analysis and must be
repeated.
Bad Rox: The ROX™ dye is used as a passive reference during the qPCR. If the ROX™ dye is not
detected, it is suggestive that some of the assay wells may not have received the proper amount
of Master Mix. This may explain why a particular assay is not showing the anticipated gene
expression level.
Sendai Virus Detected (SEV): The hPSC Scorecard™ Panel includes a control to look for Sendai
virus expression. A flag will appear if a Ct value of greater than 30 is observed for this control.
On some rare occasions, the SEV oligonucleotides will cross react with other genes resulting in a
false SEV flag in differentiated cells. If you see this flag, and did not anticipate Sendai virus
detection, you may want to repeat the sample or look at the amplification plot (In the 96 well
plate: well B9; in the 384 well plate: wells D3, D9, D15, and D21) to see if the automated Ct value
call is real, or just an error.
Insufficient Data: The analysis software requires a minimum number of genes to be amplified in
each the four categories (i.e. self-renewal (“pluri”), ectoderm, mesoderm, and endoderm) to
accurately analyze your data. If the minimum number of genes in each category does not
amplify, or if data has been omitted by the user, the Insufficient Data flag will appear and the
sample is excluded from analysis. The sample should be repeated.
42. What lines were used to generate the reference standard?
Thirteen pluripotent stem cell lines were used to generate the reference standard including:
H9 ESC P28
iPS BS3C P35
iPS18C P29
HUES9 P28
HUES13 P56
HUES28 P28
HUES44 P25
HUES48 P21
HUES49 P21
HUES53 P24
HUES63 P46
HUES64 P30
HUES65 P29
43. How are the scores calculated?
A proprietary algorithm compares the Ct values for each marker set to the values in the reference
database and calculates the score based on how well the expression correlates. In general, scores close
to 0 indicate comparable expression to that of the reference standard using undifferentiated cells.
Scores higher than 1 indicates up regulation relative to undifferentiated cells and less than -1 indicate
down regulation relative to undifferentiated cells.
Visit thermofisher.com/scorecard for more product information, data, protocols, and troubleshooting tips or contact
[email protected] for support.
15
TaqMan® hPSC Scorecard™ Panel
FAQs
44. How do I export Ct values in the software?
The only way to view the Ct values in the current version is through the expression plot. We expect
the software’s Excel export in include the gene names and Ct values in a future version of the
software.
45. My results don’t look right, how do I get help?
Please send an email to our stem cell technical support specialists at [email protected].
46. Will I need to update my software?
No software update is ever required. Because the hPSC Scorecard™ Analysis Software is cloud based,
you will always have access to the most up-to-date version of the software every time you log in.
Visit thermofisher.com/scorecard for more product information, data, protocols, and troubleshooting tips or contact
[email protected] for support.
16
TaqMan® hPSC Scorecard™ Panel
FAQs
Part 6: Examples of Results
The hPSC Scorecard™ Analysis Software algorithm compares the data in the user’s file to the data in the
reference cloud and assigns a score based on how closely the data align with the reference set of nine
undifferentiated pluripotent stem cell lines. The plus or minus sign in the user interface indicates whether
the sample’s score met the criteria for either self-renewal (pluri) or trilineage differentiation (ecto, endo,
meso).
For more information about “hPSC Scorecard assay results” and how to “Interpret results”, refer to the
hPSC Scorecard™ Analysis Software Help system.
EB time course: H9 ESCs randomly differentiated using EB formation show the appearance of markers
that are representative of the 3 germ layers as early as Day 4 of differentiation.
H9 ESCs were culture in KSR-based media on irradiated MEFs prior to removal of FGF. H9 EBs were cultured in suspension over the course of
14 days prior to scorecard analysis. The summary shows that the cells are positive for pluripotency. EB formation at day 2 is positive for
ectoderm but negative for meso and endoderm. As the EB formation progresses from day 4 to day 14, the scores for all three germ layers
continue to increase, whereas the scores for the self-renewal factors decrease. The table with the scores also reflect the same pattern. You
may notice a tiny red flag ( ) in one of boxes, which appears because the software includes quality control checks and lets you know that
feedback and additional information is waiting for you.
Random differentiation via EB formation versus monolayer: H9 ESCs differentiated for four days either
using EB formation or monolayer differentiation in EB media show appearance of markers for the 3 germ
layers by Day 4.
Visit thermofisher.com/scorecard for more product information, data, protocols, and troubleshooting tips or contact
[email protected] for support.
17
TaqMan® hPSC Scorecard™ Panel
FAQs
When a culture is allowed to differentiated by removing FGF or not changing media, the expression of SSEA4 drops and the scorecard fails
pluripotency but shows trilineage differentiation.
Early versus late passage iPSC: BS3C iPSC, an established iPSC clone, is scored as pluripotent and the
parental fibroblast displays mesoderm positive expression. The 5 clones derived from BJ fibroblasts using
CytoTune reprogramming at passage 5 and 8 are marked pluri negative at early passage but marked
pluri positive by P8. This may be due to heterogeneity of the cultures at early stages and therefore iPSC at
closer to passage 10 is recommended for the hPSC Scorecard™ Panel analysis. Red flag indicates the
presence of SEV that is detected at P5 in some clones but is diluted and not detected at P8. 4 of the 5
clones pass the self-renewal test (“pluri”) at P8 while 1 clone fails at P8 and hence is not ideal to be chosen
for further culturing.
RNA was isolated from early and late passage iPS clones that were cultured in KSR-based media on irradiated MEFs, then analyzed using the
hPSC Scorecard. CytoTune v1 is detected at passage 5 in these clones. They do not clear the Sendai virus [ the tiny red flags ( ) indicate
SeV+] and pass pluripotency until passage 8.
Visit thermofisher.com/scorecard for more product information, data, protocols, and troubleshooting tips or contact
[email protected] for support.
18
TaqMan® hPSC Scorecard™ Panel
FAQs
Impact of SEV presence on pluripotency: Clones derived using CytoTune® reprogramming kits that
have residual presence of SEV do not affect pluripotency or trilineage differentiation.
Examples of results obtained primary cells can be highly variable since the panel was not designed for use with terminally differentiated cells.
In addition, donor-to-donor variation is to be expected.
Skewed lineage and non-pluripotent somatic cells: NSCs derived from H9 ESCs show expression of
ecto without endo or meso genes. The efficiency and specificity of the differentiation method largely
dictates the expression pattern. Non-pluripotent stem cells, such as BJ fibroblast-derived human foreskin
cells, show expression in ecto. However, prolonger culture of these cells can create a drift and BJs with
ecto and meso positive pattern have also been observed.
H9 ESC
BS3C iPS
Note that all media conditions show expression profiles similar to the reference set for the self-renewal factors and comparable or downregulated germ layer factors.
Non human cells and genomic DNA: Because the primers are human specific and most assays are not
amplified, murine embryonic feeders show up as insufficient data (left most data). However, cells
harvested along with MEFs may result in an incorrect self-renewal read out since the 10% genes that are
amplified can impact the results. It is therefore recommended to harvest ESCs with minimal MEF
contamination. Genomic DNA harvested from cells also are called out as insufficient data because most
Visit thermofisher.com/scorecard for more product information, data, protocols, and troubleshooting tips or contact
[email protected] for support.
19
TaqMan® hPSC Scorecard™ Panel
FAQs
primers span an intron to prevent amplification of contaminating gDNA. However, as best practice,
DNase treatment is recommended.
MEFs
H9 ESC + MEFs
H9 ESC
H9 ESC Genomic DNA
Cells in feeder-free media system: H9 ESC and CytoTune® kit-derived iPSC cultured in feeder-free
media system such as StemPro® SFM on Geltrex or Essential 8™ Medium on Vitronectin are scored
positive for self-renewal (“pluri”).
Visit thermofisher.com/scorecard for more product information, data, protocols, and troubleshooting tips or contact
[email protected] for support.
20
TaqMan® hPSC Scorecard™ Panel
FAQs
Part 7: Troubleshooting Information
Troubleshooting Guide
Result
Probable Cause
Remedy
Pluripotent Failure: My cells are pluripotent but are called out Pluri Fail
Pluripotent lines may have
marginal differentiation.
Ensure that the cells are high quality with
little to no differentiation at the time of
harvest for gene expression analysis.
Cells may be contaminated with
MEF feeders. While most primers
are specific for human cells, a few
lineage primers cross react with
mouse cells and may skew
results, especially for the
ectoderm layer.
We recommend that you eliminate
contamination from the cells cultured
under feeder-dependent conditions by
performing at least one feeder-free
passage.
Pluri scores are low;
Lineage scores are high
There may have been extensive
differentiation during culture or
clones may have reprogrammed
partially or incompletely.
We recommend using stable iPSC clones
that show minimal spontaneous
differentiation (<P8). If you use lower
passage clones, ensure the homogeneity
of the culture based on morphology and
growth characteristics.
All values are negative;
my cells are negative
for pluri and lineage
Cells may be contaminated with
genomic DNA (gDNA). Although
most primers span across introns,
some of the control genes cross
react with gDNA. This crossreactivity is factored in during
normalization, resulting in scores
that shift toward the negative.
We strongly recommend using DNase
treatment. If you use a method of RNA
isolation or sample preparation that is not
recommended by the provided protocol,
it is best to confirm that the sample
resulting from the method is of a
sufficiently high quality.
A260/280 and
A260/230 values are
within range,
indicating high RNA
quality, and DNase
treatment was not
performed
Because DNA and RNA each
have absorbance at A260, the
A260/280 ratio is not a good
indicator of the presence of
contaminating genomic DNA.
The ratio instead can be used to
identify the absence of
contaminants, such as protein or
organic solvents.
We recommend that you design your
experiment with a “no RT control” using
a recommended test primer (ACTB
Hs01060665_g1) to test for gDNA
contamination. In the absence of gDNA
contamination, the resulting CT value
would be close to 40. If gDNA
contamination is present, you will
observe lower CT values.
Pluri scores are high;
Lineage scores are high
Visit thermofisher.com/scorecard for more product information, data, protocols, and troubleshooting tips or contact
[email protected] for support.
21
TaqMan® hPSC Scorecard™ Panel
Value Range Definitions
High
(positive Scorecard value)
FAQs
Zero
Low
(Scorecard value close to 0)
(negative Scorecard value)
Pluripotent
When compared to the Reference standard, pluripotent markers are:
Upregulated
Comparable
Depending on germ layer markers, sample may be pluripotent.
Downregulated
Sample is not pluripotent.
Germ Layers: Ectoderm, Mesoderm, Endoderm
When compared to the Reference standard, germ layer markers are:
Upregulated
Sample is differentiated, not pluripotent
Comparable
Downregulated
Depending on pluripotent markers, sample may be pluripotent.
For Research Use Only. Not for use in diagnostic procedures.
Last update: 15 Oct 15
© 2015 Thermo Fisher Scientific Inc. All rights reserved. All trademarks are the property of Thermo Fisher Scientific and its
subsidiaries unless otherwise specified. Essential 8 is a trademark of Cellular Dynamics International, Inc. TaqMan is a
registered trademark of Roche Molecular Systems, Inc., used under permission and license. TRIzol is a registered trademark of
Molecular Research Center, Inc. Google and Chrome are trademarks or registered trademarks of Google, Inc. Internet Explorer
is a registered trademark of Microsoft Corporation in the United States and/or other countries. Safari is a trademark of
trademarks of Apple Inc., registered in the U.S. and other countries.
Visit thermofisher.com/scorecard for more product information, data, protocols, and troubleshooting tips or contact
[email protected] for support.
22