1
This project is entitled
DATA ACQUISITION SYSTEM
FOR
MUON LIFETIME EXPERIMENT
Submitted by
Santosh Kumar Cheekatmalla
in partial fulfillment of the requirements
for the award of the degree
M.S. in COMPUTER SCIENCE
Committee
Dr. Mukesh Singhal
Professor, Department of Computer Science
Dr. Tim Gorringe
Professor, Department of Physics and Astronomy
Dr. D. Manivannan
Assistant Professor, Department of Computer Science
UNIVERSITY OF KENTUCKY
DEPARTMENT OF COMPUTER SCIENCE
2004
I
ACKNOWLEDGEMENTS
I would like to express my gratitude to my advisor Dr. Mukesh
Singhal, who has been a constant source of encouragement and inspiration. In
spite of his busy schedule, he always found time to help me out by allocating
suitable time slots to discuss about my project. I thank Dr. Tim Gorringe,
who has given me an opportunity to work for muon lifetime analysis
experiment. He was always available to discuss the problems at hand with my
project. His invaluable suggestions and ingenious ideas have taken the shape of
this project. He was solicitous person not only in academic affairs but also in
other matters and it shall remain as reminiscence.
I also wish to express my gratefulness to Dr. Manivannan, for his time
and interest shown in my project. I am thankful to him for being part of my
project defense committee.
Santosh Kumar Cheekatmalla
II
ABSTRACT
I have designed, developed and deployed a data acquisition (DAQ) to meet the
needs of the “µLan” nuclear physics experiment. The main goal of µLan is to
measure the positive muon lifetime to a precision of 1 part in 106. This
represents more than an order of magnitude increase in precision beyond the
current world average. The DAQ design is motivated by the very high data rate
that this experiment will produce. The collaboration anticipates a muon decay
rate of 106 µ+’s (positive muon’s) per second and a raw data rate of 100 MB per
second.
This experiment will be performed with the proton accelerator at Paul Scherrer
Institut in Villigen, Switzerland. To develop the µLan DAQ, I have set up a mock
experimental setup at the University of Kentucky. The design and development
of the DAQ software was conducted using this mock up setup and was finally
deployed at Paul Scherrer Institut.
Two major components of the µLan DAQ are the front-ends and the
analyzers. The front-ends are software components developed to collect the
information related to incoming muons decay and outgoing electrons hits.
Front-ends collect and store information in the form of data banks. Analyzers
are the software components that read the information from data banks and
plot various histograms as is required by the experimenters.
III
CONTENTS
Chapter I
1.1
1.2
1.3
Chapter II
2.1
2.2
2.3
Introduction
Project Overview
Issues in designing the DAQ
Organization of Report
1
2
4
DAQ Architecture Overview
Three-Tier Architecture
2.1.1 Hardware and front-ends Layer
2.1.2 Backend and Data Storage Layer
2.1.3 Data Analysis Layer
DAQ Network Layout
DAQ Issues
2.3.1 Data Taking Philosophy
2.3.2 Event Synchronization
2.3.3 Event Builder
2.3.4 Online Database
5
6
7
7
8
9
9
10
12
13
Chapter III Front-ends
3.1
3.2
3.3
Data Acquisition Programs
Modes of Operation
CAEN Front-end
3.3.1 CAEN Data Format
3.3.2 CAEN Design
14
14
15
17
18
IV
3.4
3.5
3.6
3.3.3 CAEN Activity Diagram
3.3.4 CAEN Implementation
EMC Front-end
3.4.1 EMC Data Format
3.4.2 EMC Design
3.4.3 EMC Implementation
WFD Front-end
3.5.1 WFD Design
3.5.1 WFD Data Compression
3.5.1 WFD Implementation
Software Testing
Chapter IV Conclusion
20
21
23
24
25
27
31
31
32
33
34
35
Appendix
A
B
C
D
Obtaining Software from CVS Repository
Analyzers
Slow Control
Front-end Parameters
CAEN
EMC
WFD
REFERENCES
36
37
39
40
40
41
43
45
V
__________
CHAPTER
1
__________
INTRODUCTION
1.1
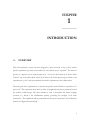
OVERVIEW
This data acquisition system has been designed to meet the needs of the “µLan” nuclear
physics experiment [1], where µLan stands for “muon lifetime analysis experiment”. The name of
project as it appears on its original proposal is “A Precision Measurement of the Positive Muon
Lifetime Using a Pulsed Muon Beam and the µLan Detector” [2]. In this project report I refer to the
experiment as “µLan” and the researchers involved in experiment as the collaboration.
The main goal of the experiment is to measure the positive muon lifetime to a precision of 1
part in 106. This represents more than an order of magnitude increase in precision beyond
the current world average. The muon lifetime is used to determine the Fermi coupling
constant, GF, which is the fundamental quantity governing the strength of all weak
interactions. The experiment will be performed with the proton accelerator at Paul Scherrer
Institut in Villigen, Switzerland [10].
1
The universities involved in this experiment are Boston University, James Madison
University, University of California at Berkeley, University of Illinois at Urbana-Champaign,
and University of Kentucky.
The University of Kentucky has been assigned the responsibility for the design, development
and deployment of the data acquisition for the µLan experiment. The design of the data
acquisition system (DAQ) design is based on the Maximum Integrated Data Acquisition
System (MIDAS) [3]. It is a general purpose system for event based data acquisition in small
and medium scale physics experiments. It has been developed by Dr. Stefan Ritt, a research
scientist at Paul Scherrer Institute, Switzerland and Dr. Pierre Amaudruz at TRIUMF
laboratory, Canada.
1.2
ISSUES IN DESIGNING THE DAQ
The goal of µLan is a measurement of the µ+ (positive muon) lifetime to 2 pico-seconds. The
µLan experiment will use a pulsed muon beam, which comprises a fill period (beam on) and
a measurement period (beam off). The pulsed muon beam will typically involve a 5 µs fill
period and a 25 µs measuring period. Approximately 30 µ+ s will arrive per fill period and
approximately 10 electrons are detected per measurement period. This yields about 4 x 10⁵
decay electrons per second or 1 x 10¹² decay electrons in roughly thirty days of 100% - live
running. The time spectrum of the decay electrons after the fill-period will determine the
muon lifetime [1].
The incoming µ+ s are counted in an Entrance Muon Counter (a multi wire-chamber) and a
T0 counter (a plastic scintillator) and stopped in a solid target. The solid target may either be
a polarization destroying target like AK3 (a ferromagnetic alloy) or a polarization retaining
target like silver. The decay electrons are counted in a nearly 4 ∏ scintillator array in the
shape of a truncated isocahedron of 170-elements of scintillating tile pairs that are
symmetrically arranged about the target center. The signals from the tiles will be fed to 500
MHz, 8-bit resolution, waveform digitizers (WFD).
2
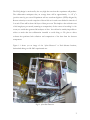
The DAQ design is motivated by the very high data rate that this experiment will produce.
The collaboration anticipates that, on average there will be approximately 1 x 10⁶ µ+’s
(positive muon’s) per second. Experiment will use waveform digitizers (WFD) designed by
Boston university to record a snapshot of about 100 ns for each event divided in intervals of
2 ns each. There will be about 100 bytes of data per event. This implies a data collection rate
of 100 megabytes per second (assuming no compression). In the course of recording 2 x 10¹²
events, we would then generate 200 terabytes of data. It would not be entirely impossible to
collect so much data but collaboration intended to avoid doing so. We plan to devise
software that performs both collection and compression of the data from the detector
components.
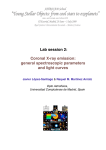
Figure 1.1 shows you an image of the “µLan Detector” at Paul Scherrer Institute,
Switzerland during our fall 2003 experimental run.
Fig 1.1 µLan Ball Detector
3
The software performing the data readout out of a hardware module such as the WFD or
the EMC is termed a “front-end”. We have designed our WFD front-end to both read-out
the raw data and compress the raw data. The compressed data derived by WFD front-end
consists of the time, area, height and width of each pulse. Also, we will retain the
uncompressed raw data for about 1% of events in order to allow for systematic studies of
compression algorithms. For all other pulses only the compressed data will be stored. To
read-out the complete “µLan Detector”, the final µLan experiment run will need 340 WFDs
to perform the data collection from the µLan Detector. These 340 WFDs are distributed
over 5 dual processor machines. I have also contributed in developing the software frontends for various other components such as multi-hit time-to-digital converters (MHTDCs),
the multi wire chamber and the flight simulator. The multi wire chamber is used to
determine the position and rate of incident muon’s and flight simulator is a programmable
pulser.
1.3
ORGANIZATION OF REPORT
This report is organized in five chapters. Chapter 2 delineates an insight into the details of
DAQ Architecture. Chapter 3 provides details about the software components that collect
the data in the experiment. These software components are termed as front-ends. Finally
Chapter 4 gives the Conclusion. The appendix provides an overview into other components
of the DAQ. Topics covered in the appendix are slow-control front-ends, data analyzer, and
details about obtaining software from the CVS repository.
4
__________
CHAPTER
2
__________
DAQ ARCHITECTURE
OVERVIEW
2.1
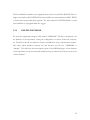
THREE-LAYER ARCHITECTURE
The DAQ for µLan has been designed in three-layer architecture to distribute the complexity
involved in the data acquisition system.
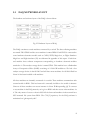
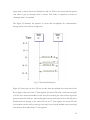
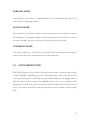
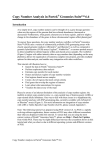
Figure 2.1 illustrates the three layers of the data acquisition system. The rectangles in the
diagram represent either the software or hardware components involved in the experiment.
The ellipses represent the buffers created to store data fragments from various software
components. The rectangles with rounded corners represent data stored in a file. The
horizontal double lines are used to separate different levels.
5
Fig. 2.1 The Three-Tier Architecture for DAQ.
The three layers of the DAQ are explained below:
2.1.1 HARDWARE AND FRONT-END LAYER
(Level one)
This layer of DAQ consists of the hardware and software components needed to collect data
from the detector. The various electronic modules that record the incoming muon hits and
outgoing electron hits are waveform digitizer’s (WFD) and multi-hit time-to-digital
converter’s (MHTDCs) also known as CAENs. Each of these modules has specific software
for data read-out and data compression. These software components are described in the
front-end’s section of this documentation. This layer consists of several dual processor
machines that host the front-end software that performs the read-out of data.
6
2.1.2 BACKEND AND DATA STORAGE LAYER (Level two)
Data collected by various front-end software components is collected in data segments.
Each data segment contains many muon decay events. This level involves a dual processor
machine called the “backend” that collects data from several front-end machines from level
one. The software component that collects data from each machine and builds a complete
event is called the “event builder”. The software component that performs the task of
collecting data from the event builder and storing it on disk is called the “logger”. The data
collected is stored on various terabyte disk arrays.
2.1.3 DATA ANALYSIS LAYER (Level three)
Once data has been collected and properly stored on a terabyte storage device, this level
hosts various software components called “analyzers” that helps the collaboration perform
their analysis on collected data (e.g. building histograms, fitting spectra).
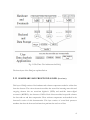
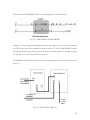
Level
Hardware Components
Software Components
Hardware and front ends
Several dual processor machines.
MHTDC readout
(front-ends)
WFD readout
EMC readout
Slow Control
Backend
One dual processor machine.
Event Builder
(backend)
Data Logger
Experiment Control
Data Analysis
Terabyte storage machine.
Data Analysis tools
(terabyte)
Mql and ‘C’ Analyzers
Fig. 2.2 Hardware and software components on each level of the DAQ architecture
7
2.2
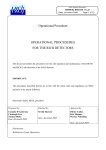
DAQ NETWORK LAYOUT
The hardware and software layout of the DAQ is shown below:
Fig. 2.3 Hardware Layout of DAQ
The DAQ constitutes several machines connected by a switch. The data collecting machines
are named FE01-FE0N and the server machine is named BE01. Each FE0X is connected to
some hardware electronics module such as CAEN, WFD, Magic box, or Flight Simulator.
Magic-box and flight simulator (FS) are elaborated in appendix of this report. Each frontend machine hosts software components corresponding to hardware electronic modules
attached to it. The terabyte storage device is named TB01. This machine hosts a Redundant
Arrays of Inexpensive Disks (RAID) consisting of 6 200 GB hard-drives. We had a few
terabyte storage devices in the fall 2003 and will have more machines for fall 2004. Red hat
Linux 9.0 has been installed on all machines.
All these machines are internally connected via a switch. These machines communicate with
external world via BE01. This local network is externally invisible to the world via internet.
However all these machines can access internet via Linux IP Masquerading [4]. To connect
to any machine in the DAQ network, we log in to BE01 and then access other machines via
it. The only means of access to them is SSH. All the front-end machines in the network have
NFS mounted file system from BE01. The CVS [5] repository for the DAQ software is
maintained on “gluon.pa.uky.edu”.
8
2.3
2.3.1
DAQ DESIGN ISSUES
DATA TAKING PHILOSOPHY
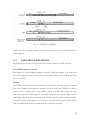
The beam we use for taking data is a pulsed muon beam, which comprises a fill period
(beam on) and measurement period (beam off). We collect the data in segments of length
0.7-100 milliseconds. The time duration of a data segment is a hardware selectable quantity.
Fig. 2.4 Time structure showing data segments and beam fills
A run comprises a period of continuous data taking that’s stored in a single data file. The
time duration of a run is not fixed. Each run consists of multiple data segments and each
segment consists of multiple fills. The duration of each segment and fill is fixed in hardware.
During each segment, we have fills consisting of a fill period and a measurement period. The
beginning of the fill (BOF) and end of the fill (EOF) is indicated by the hardware circuit and
it is fed to the data stream. We collect the muon hits throughout the time segment. The
muon decay data that’s collected during the measurement period is used to determine the
muon life time.
9
Since data collection modules are distributed over various front-ends, we need a mechanism
to make sure that no software front-end should start reading a new data segment while other
front-ends are still reading out a previous data segments. This is achieved by synchronizing
these software components.
We also have another issue which relates to distributing data collecting software among
various machines. Each machine collects data in fragments and sends it over to the backend.
Therefore we need a software component which runs on the back end machine merging data
fragments from various software front-ends. The data merging component is called the
“Event Builder”.
2.3.2
EVENT SYNCHRONIZATION
We need event synchronization to make sure that no front-end will start reading a new data
segment while other front-ends are still reading out the preceding data segment. I have used
remote procedure call (RPC) routines in C programming to achieve event synchronization.
RPC routines allow C programs to communicate with programs on other machines across
the network.
I have designated one software component as the master front-end, which is the main frontend performing the event synchronization. We start reading out data from the master frontend, only when we receive a signal via the parallel port. The master front-end will keep
polling via the parallel port, to check if it is ready to start read out. This mode of operation is
termed as polling mode. When the master front-end gets a signal to start read out, it checks
if all its slaves have finished the preceding read-out. The master can schedule for read-out of
current time segment, only after all the slaves have finished reading out previous segment. If
all the slaves have not finished read-out, it will wait until it gets a signal from each front end
that they are finished.
The other software components operated by the master front-end are termed as the slave
front-ends. Slave front-ends will start reading out data only when they receive an RPC signal
from the master front-end to start the readout. Once finishing the readout, the slave will
10
report back to master that it has finished the read-out. Thus a slave front-end will operate
only when it gets an interrupt from its master. This mode of operation is known as
“Interrupt mode” of operation.
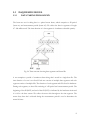
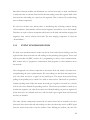
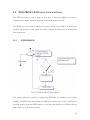
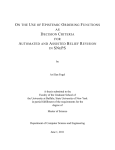
The Figure 2.5 illustrates the sequence of events that accomplishes the synchronization
among various other software components.
Fig. 2.5 Event Synchronization
Figure 2.5 shows only one slave FE, but in reality there are multiple slave front-ends. In the
above figure at the start of the nth data segment, the master FE sends a start read-out signal
to all the slave front-end machines. Each slave after receiving the start read-out signal will
perform actual data read-out. After reading data from the electronics the slave FE will send a
finished read-out message to the master FE. In (n+1)th data segment, the master FE will
send another start the read-out message only after it has received finished read-out message
from all slave front-ends for the nth data segment.
11
I have designed DAQ with enough flexibility that the number of slave front-ends maintained
by master front-end is user configurable.
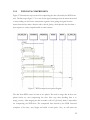
2.3.3
EVENT BUILDER
Event builder is a software component that merges data segment fragments from different
front-end’s in to a complete data segment.
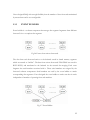
Fig 2.6 Events from various front-ends
The data from each front-end arrives at the backend stored in shared memory segments
which are termed as “buffers”. The data from various front-ends FE01-FE0N are stored in
BUF1-BUFN, and transferred to the backend via the network for merging. Each event
fragment has serial number associated with it. These serial numbers are assigned by the
front-end software components. Serial numbers are used by the event builder to match
corresponding data segments. I have designed the event builder to make sure that it works
independent of number of operating front end machines.
Fig. 2.7 Event Builder
12
The Event Builder assembles event fragments from various event buffers BUF1-BUFN in to
single event buffer called SYSTEM. The Event builder uses serial numbers in BUF1-BUFN
to match the corresponding data segments. The data collected in SYSTEM buffer is stored
onto hard disk via a program called the “logger”.
2.3.4
ONLINE DATABASE
We store the experiment settings in a file named “.ODB.SHM”. This file is considered to be
the database of the experiment, storing the configuration of various front-ends, analyzers,
etc. The data in this file can either be viewed or modified by using a web-browser interface.
The utility which interfaces between the web browser and the file “.ODB.SHM” is
“mhttpd”. This utility has been developed as part of the MIDAS package. As the database
of the experiment can be accessed and modified using an online web browser we call it the
“online database”.
13
__________
CHAPTER
3
__________
FRONTENDS
3.1
DATA ACQUISITION PROGRAMS (FRONTENDS)
All of the front-end programs are software routines written in ‘C’ programming language
and according to MIDAS specifications. Hence, they can easily be integrated into the
complete MIDAS framework. Compliance with MIDAS specifications permits the use of
various MIDAS utilities such as online data-base.
Each front-end has been specifically written to handle a unique electronic module. The main
routine in each front-end program is named “read_FOO_event”. The value of FOO differs
in each front-end. It is generally the name of the electronic module we plan to read. The
“read_FOO_event” routine is also known as the read out routine.
3.2
MODES OF OPERATION
The software front-end can be running in any of the following three modes:
14
PERIODIC MODE
The read_FOO_event routine is called periodically with a user specified time period. This
value can be set using online database.
POLLING MODE
The read_FOO_event routine is called based on the input from an external device such as
the parallel port. Our program examines a specific parallel port bit, and when it’s set we call
the read-out routine. This type of operation is useful for the master front-end.
INTERRUPT MODE
This mode of operation is useful for slave front-ends. These front-ends start their read out
routine if, and only if, they are interrupted by the master front-end.
3.3
CAEN FRONT-END
The CAEN front-end is the software that reads out data from a multi-hit time-to-digital
converter (MHTDC). MHTDCs are used for collecting the times of hits in the 340 detectors
of the “µLan ball detector”. CAEN [8] is a company producing electronic modules that are
used for nuclear physics research. The MHTDCs that we use in our experiment were
developed by CAEN. Hence we term this front-end the CAEN front-end. This front-end
serves as the master front-end for the data acquisition system, and hence works in polled
mode.
15
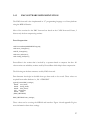
The hardware CAEN MHTDC works in start gating mode as described below:
Fig 3.1 CAEN START GATING MODE
In figure 3.1, hits are generated independent of the start signal. The start signal is generated
by CAEN logic circuit that’s explained in detail in section 3.3. The CAEN MHTDC records
hits generated only during the gate period defined by the start signal. For example in figure
3.1 only hits 2, 3, 4, and 5 are recorded in an event.
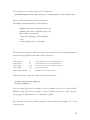
The MHTDC will read data based on the start signal generated by the logic circuit shown in
figure 3.2.
Fig 3.2 CAEN LOGIC CIRCUIT
16
The input for logic circuit in figure 3.2 is driven by the software front-end, and the output
generated by the above circuit enables the CAEN to work in polled mode. We select the
length of the data segment by selecting an appropriate time value with the gate generator.
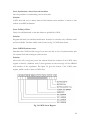
3.3.1
CAEN DATA FORMAT
The format of data generated by the CAEN is as follows:
Each line of data contains 32 bits. Data in each data segment starts with a header word
which contains an event number, and a start word which contains the start time of data
segment. Then we will record the time of each muon hit and information about channel
which generated the hit. At the end of the data segment we identify the end of segment with
a 32 bit End of Buffer (EOB) marker. EOB marker also gives the number of hits in a data
segment.
A 32 bit pattern is identified as a header, start, data or EOB based on a unique identifier in
bits 23 and 24. Valid data consists of 20 bits for hit time and 7 bits for the channel on which
hits were recorded.
The figure 3.3 has been taken from CAEN user manual [9].
17
Fig 3.3 CAEN DATA FORMAT
CAEN can also sometimes generate invalid data words, which can be discarded based on
their bit pattern.
3.3.2
CAEN FRONT-END DESIGN
The following are the various design issues and solutions related to CAEN front-end:
Issue: CAEN memory is limited
The memory of CAEN hardware module is limited to 32K data segment. If we wait to the
end of data segment for the CAEN read-out, the CAEN memory will overflow and hence
we lose some data.
Solution:
The CAEN front-end works in polled mode of operation. We call read_cean_event routine
only when a hardware data segment is complete, but by that time the CAEN may overflow.
Hence we have a routine called “Loop readout”, which reads data into a temporary array,
until we reach the end of data segment. Until then “Loop read out” runs in a tight loop just
transferring data into an array, and allowing the CAEN hardware to collect more data. When
we reach the end of a data segment, we are ready to call the read_caen_event, which finishes
read-out and transfers the data over the network to backend for storage.
18
Issue: Synchronize various front-end machines
Solve the problem of synchronizing various front-ends.
Solution:
CAEN front-end acts as master front-end and informs other machines of when to start
readout via an RPC mechanism.
Issue: Validity of Data
Check for valid data based on the data format as specified by CAEN.
Solution:
Program will check for valid data bank format. It checks for a header, start, valid data words
and end of buffer. The data validity check is based on fig 3.3 CAEN data format.
Issue: CAEN Hardware errors
Sometimes the CAEN module can get in an error state due to loss of synchronization with
the external clock and resulting in erroneous data.
Solution:
After every call to read_caen_event, the software checks the contents of the CAEN status
register to identify a hardware error. It then generates an error message over the MIDAS
web interface of the experiment. The figure 3.4 gives the format of the CAEN status
register, which is used to detect a CAEN error.
Fig 3.4 CAEN Status Register
19
Issue: CAEN buffer overflow errors
Sometimes due to electronic noise in detector module, the CAEN can generate a lot of data
and produce CAEN buffer overflows.
Solution:
As mentioned in figure 3.5, after every data segment the software checks the status register
of the CAEN to identify a buffer overflow error. It then generates an error message over the
MIDAS web interface of the experiment.
Fig 3.4 shows the CAEN status register. It is a 32 bit register. Bit 3 indicates if there is an
error in the CAEN. Bits 0, 1, and 2 inform you if they are related to buffer overflow.
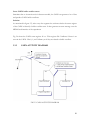
3.3.3
CAEN ACTIVITY DIAGRAM
FIG 3.5 CAEN ACTIVITY DIAGRAM
20
Figure 3.5 summarizes the design of CAEN front-end activity using an Activity Diagram [6].
When the software front-end is started it does the initialization of the CAEN hardware.
After executing initialization routines, the software waits for input from the user to start the
read-out (i.e., it waits for start of run). This waiting stage for user input is indicated by the
first decision box (diamond-shaped box) after the start.
After the user initiates the start of run, the software checks for following two conditions
before starting actual readout: (indicated by second decision box)
1.
Did the hardware finish collecting data? ( we identify this via an input from
parallel port )
2.
Did all slave front-ends finish reading the previous data segment? ( we
identify this via the RPC calls from the slave front-ends )
While waiting for the above conditions to be met the software reads data in to a temporary
array as shown in figure 3.5. After above conditions are met the software completes data
collection. Later data is stored in a shared memory segment called “buffer” and is transferred
to event builder for merging event fragments.
At the end of each data segment we check CAEN status registers to see if it reported an
error. If the status register reports an error, appropriate error handling routines are invoked.
3.3.4
CAEN SOFTWARE IMPLEMENTATION
All of the front-ends are implemented in “C” programming language over a Linux platform
using the MIDAS libraries.
In this section I discuss the important routines of this code and also briefly elaborate on the
functionality of the code.
21
Initialization routines:
void CAENopwrite(short code, int CAENindex);
INT frontend_init();
void InitializeCAENChannels(int CAENindex);
The above routines collect information needed to initialize hardware from online database
file “.ODB.SHM” and initialize the necessary electronic modules. These modules also
initialize the parallel port connections needed for the communication between the software
and hardware.
Loop readout routines:
void CAENLoopRead(int CAENnum);
This routine is used to collect the data fragments into a temporary array while waiting for the
conditions to be met for the end of data segment.
Slave front-end configuration routines:
INT rpc_ready_for_readout(INT index, void *prpc_param[]);
INT interrupt_configure(INT cmd, INT source, PTYPE adr);
The above routines establish RPC connections to all of the slave front-end machines. The
“rpc_ready_for_readout” routine sends “start read out” message to all slaves.
CAEN final readout routine:
INT read_CAEN_event(char *pevent, INT off);
This routine performs final data reading from hardware. After collecting data it is stored in a
shared memory segment called “buffer”, which is read by the event builder in order to merge
the data fragments into complete data segments.
22
Error Checking Routines:
INT CheckCAENStatus(long CAENnumber);
INT ClearCAEN(long CAENnumber);
This routine checks CAEN status registers to identify an error. When the status register
reports an error, the error handling routine “ClearCAEN” is invoked.
3.4
EMC FRONT-END(ENTRANCE MUON COUNTER/WIRE CHAMBER)
Entrance Muon Counter (EMC) is equipment used to determine the number and position of
incoming beam particles. The EMC has a set of vertical wires termed as ‘X-wires’ and a set
of horizontal wires termed as ‘Y-wires’. The EMC data is read out via CAEN MHTDC.
Whenever a muon passes through the wire chamber one or more of the X and Y wires is
triggered. By collecting the information regarding the time of hits and the positions of X and
Y wires, we can find the position of the incident beam particles. A single muon hit can
sometimes trigger more than one X wire or Y wire. The group of wires triggered for a single
muon is termed a “clump”. The software needs to recognize hits within a specific period of
time and group them together as a single clump.
The EMC front-end is a CAEN front-end with special features added to meet the needs of
an EMC. The EMC generates a lot of data but in general we are interested in the individual
hits during the measurement period and the total number of hits in the fill period.
We plan to collect data and compress it and then transfer the data to the backend. The EMC
front-end operates in interrupted mode and is controlled by the CAEN front-end.
23
3.4.1
EMC DATA FORMAT
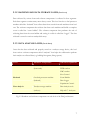
The compressed data can be of following two types.
Clump by Clump Data:
In this format of data we store information of each clump. Hence we store information
regarding each muon that passed through wire chamber.
Clump by Clump data has the following format:
Each line of data is a 32 bit word.
For each fill period we have:
FILL MARKER
//
Marker we use is 0xdeadbabe
FILL_NUMBER
//
Number of Fill 0….N
HIT_COUNT
//
Number of Hits with a Fill
CLUMP_COUNT
//
Number of Clumps during Fill period
FILL_TIME
//
Time at start of Fill
For each clump in a fill we have:
CLUMP_SIZE // Number of hits with in a clump
CLUMP_TIME
// Time of clump
X_POSITION
// Weighted X coordinate
Y_POSITION
// Weighted Y coordinate
The threshold “delta time” is used to distinguish clumps.
Histogram data
In this mode of operation we do not store the event by event information for each clump.
Rather we store only the number of hits recorded during a fill period and their x, y and time
spectra.
The histogram data has the following data format:
Each line is a 32 bit word.
24
For each fill period we have:
3.4.2
FILL MARKER
//
Marker we use is 0xdeadbabe
FILL_NUMBER
//
Number of Fill 0….N
HIT_COUNT
//
Number of Hits with a Fill
CLUMP_COUNT
//
Number of Clumps during Fill period
FILL_TIME
//
Time at start of Fill
X_Spectrum
//
distribution of hits in X wires
Y_Spectrum
//
distribution of hits in X wires
Time_Spectrum
//
time distribution
EMC DESIGN
The EMC operates on a dual processor machine. To get the most of dual processor machine
the EMC software forks a new thread to process collected raw data after each time segment.
At the end of each time segment we store the collected data in a buffer and fork a new
thread to compress it. After forking the new thread we continue with reading out the EMC.
The design of EMC front-end can be summarized in following activity diagram. Similar to
the CAEN, after the software front-end is started it performs the initialization of the
hardware. After executing initialization routines, the software waits for input from the user
to start the readout (Waits for start of run). This waiting stage for user input is indicated by
first decision box (diamond-shaped) after the start.
After the user signals the start of readout (start of run), the software waits for a signal from
the master front-end as indicated in second decision box. While waiting for signal software
reads data in to an array as shown in figure 3.6.
25
FIG 3.6 EMC Activity Diagram
When the front-end is ready for final data reading for current data segment, it performs the
final data reading from hardware. After collecting data it compress the data collected and is
stored in a shared memory segment called “BUF07” and is transferred to event builder for
merging event fragments. The compressing of data is executed by a separate thread, so that
compressing data will not slow down the front-end in collecting data for the next data
segment.
At the end of each data segment we check CAEN status registers to see if an error has
occurred. If the status register reports an error appropriate error handling routines are
invoked.
26
3.4.3
EMC SOFTWARE IMPLEMENTATION
The EMC front-end is also implemented in “C” programming language on a Linux platform
using the MIDAS libraries.
Most of the routines for the EMC front-end are based on the CAEN front-end. Hence, I
discuss only the data compressing routines.
Data Compression:
void ProcessData(ARGUMENT argum);
void store_clump(int i);
void fill_clump(int i);
void time_order(int i);
void clump_histo(int i);
ProcessData is the routine that is invoked by a separate thread to compress the data. All
other routines are subsidiary routines used by ProcessData which help in data compression.
The following are the data structures used by EMC front-end.
Data Structure that helps in decided what type data needs to be stored. These values are
acquired from online database i.e., file “.ODB.SHM”
typedef struct EMC_settings {
BOOL raw_bank;
BOOL clump_bank;
BOOL histo_bank;
INT
deltaTime;
BOOL mode;
} EMC_SETTINGS;
EMC_SETTINGS emc_settings;
These values can be set using the MIDAS web interface. Figure 4.6 and appendix D gives
more information about these settings.
27
We fork a new thread using following “pthread” system call:
if(emc_settings.clump_bank||emc_settings.histo_bank)
pthread_create(&th,NULL,(void *)ProcessData,&argu);
We verify that at least one of the compressed data banks is enabled before invoking a
separate thread for compressing data. Once a new thread is forked, we continue collecting
data for the next time segment. At end of the new time segment, we look for compressed
data from the previous time segment by waiting for the thread to complete using following
system call:
if(emc_settings.clump_bank||emc_settings.histo_bank)
ret = pthread_join(th, NULL);
The CAEN time is represented by 20 bits. The time rollovers for data segment longer than
0.76 ms. The analyzer accounts for the time rollover. Since the CAEN data is not properly
time-ordered. I sort the data based on the time of the hit. The time_order() function helps in
detecting rollover’s and to sort data based on time hits.
The code segment to detect time rollover is mentioned below:
if(time > prevtime){
// Check if a fake rollover
if(time>(prevtime+5e5))
time = time – 0xfffff;
}
else if(time < prevtime){
if (prevtime > (time + 1e5) ){
if((prevtime - time)<(5e6)){
// Valid rollover
overflow += 0xfffff;
time += 0xfffff;
}
28
We use quick sort to sort data based on time of muon hit.
qsort(&(CAEN[i].process[1]), output_bank_size-1, sizeof(compress_caen),compare_caen);
Quick sort uses the following comparison routine:
int compare_caen(const void *p1, const void *p2)
{
compress_caen *hit1 = (compress_caen *) p1;
compress_caen *hit2 = (compress_caen *) p2;
if(hit1->time == hit2->time) {
return (hit1->identifier - hit2->identifier);
} else {
return (int) (hit1->time - hit2->time);
}
}
The Histogram settings for EMC front-end are governed by the user specified parameters
mentioned in appendix D. Other hard-coded constants are:
#define MAX_X
#define MAX_Y
48
// Total number of X wires in histogram spectra
48
// Total number of Y wires in histogram spectra
#define MAX_T
1024
// Total number of time bins in histogram spectra
#define T_BIN
10e3
// Size of each time bin
#define WORD_LENGTH
32
// Number of bits in unsigned integer
The data structures used to store EMC spectra information are:
int clump_x[MAX_X],clump_y[MAX_Y];
int clump_time[MAX_T];
The array clump_x[i] stores the number of count of number of hits on ith X wire of EMC.
Similarly, clump_y[i] stores the number of count of number of hits on ith Y wire. The array
clump_y[i] is incremented when “i = (clumpTime/T_BIN)”.
The following are the user specified parameters which determine the length of X, Y and
Time spectrum.
29
#define nXBits
#define xBinSize
#define nYBits
#define yBinSize
hist_settings.nxbits
hist_settings.nxbinsize
hist_settings.nybits
hist_settings.nybinsize
#define nTimeBits
hist_settings.ntbits
#define timeBinSize
hist_settings.ntbinsize
Above values can be specified using MIDAS web interface. Appendix D and figure 4.6
specifies more details about setting these parameters. The lengths of X, Y and Time
spectrum are determined as follows:
xSpectrumSize = (MAX_X/xBinSize)*nXBits;
ySpectrumSize = (MAX_Y/yBinSize)*nYBits;
timeSpectrumSize = (MAX_T/timeBinSize)*nTimeBits;
The following loop is used to fill the respective spectra:
for(x_count = 0,count=0;count<number_of_bins;count++)
{
binvalue = 0;
for(bin_count=0;(bin_count<xBinSize)&&(x_count<MAX_X);bin_count++)
binvalue+=clump_x[x_count++];
if(binvalue>=(1<<nXBits)){
binvalue = (1<<nXBits)-1;
x_overflow = 1;
}
Similarly, Y and time spectra are filled.
When CAEN hardware is reported to be in error state by the CAEN status register, we first
try to correct the CAEN error by trying to reset the CAEN MHTDCs. These errors can be
eliminated by stopping the front-end and starting it again. Via this sequence we reset the
CAEN hardware and execute all of the CAEN hardware initialization routines once again.
Every time the front-end stops we reset the CAEN VME crate.
30
3.5
WFD FRONT-END (WAVE FORM DIGITIZER)
The WFD front-end is used to read out data from a Waveform digitizer. It works in
interrupted slave mode. Interrupts originate from CAEN master front-end.
The WFDs are custom made by Boston University. Similar to the EMC, the WFDs also
generate large amounts of data, hence we need to compress the data before we transfer data
over the network.
3.5.1
WFD DESIGN
FIG 3.7 WFD ACTIVITY DIAGRAM
The various parameters needed for compressing WFD data are available via the online
database. The WFD front-end is similar to CAEN front-end but does not have CAEN error
checking module. Since the WFD memory is very large and the data per WFD is relatively
small, there is no loop read-out routine.
31
3.5.2
WFD DATA COMPRESSION
Figure 3.7 illustrates the steps involved in compressing the data collected by the WFD frontend. The first step in figure 3.7 is to wait for the signal (interrupt) from the master front-end
to start reading out data for the current time-segment. After getting the signal from the
master front-end we make a function call to decode_bank(), which decodes the data from a
byte sequence to values comprehensible to other routines.
Figure 3.7 WFD compression sequence diagram
The data from WFD comes in form of two phases. We need to merge data in these two
phases before we start compressing the data. Next step after decoding data is to
merge_events(). After merging the data we make a call to Fit_Events() which is responsible
for compressing the WFD data. The compressed data derived by the WFD front-end
comprises of the time, area, height and width of each pulse. Also, we will retain the
32
uncompressed raw data for about 1% of the time in order to allow for systematic studies.
For all other pulses only the compressed data will be stored. These various parameters and
thresholds needed by front-end are discussed in appendix D. Later compressed data is stored
in a data bank via fill_bank() and is transferred to event builder for merging event fragments.
At the end, we signal to the master front-end that we are ready for collecting data for next
time segment.
There are two different WFDs. They are old WFD and BU WFD. In old WFD data is
collected in two phases where as the new BU WFD collects complete data segment. The
above compression schema is applicable only to old WFD. New BU WFD has the same
compression schema except that it does not have the phase merging stage.
3.5.3
WFD IMPLEMENTATION
WFD front-end is also implemented in “C” programming language on a Linux platform
using the MIDAS libraries. Most of the routines for the WFD front-end are similar to other
front-ends. Hence, I discuss only data compressing routines.
Data Compression:
int DecodeBank(int*);
int defFit(int,int,int,int,int);
int fillRawBank(int,int,DWORD *);
int fillFEBank(DWORD,int,int*);
The data structure used to store WFD data compression routine thresholds is:
typedef struct {
INT
threshold;
INT
leftwindow;
INT
rightwindow;
} WFD_SOFT_SETTINGS;
33
fillFEBank() is the routine that is invoked to compress the data. All other routines are
subsidiary routines used by read_wfd_event() which help in pre-processing data before
compressing it.
3.6
SOFTWARE TESTING
Software can either operate in debug mode or experiment mode. In debug mode the frontend reads data from a file rather than an electronic module. This mode has been very helpful
for testing the code given the absence of the final hardware. During unit testing phase, I
tested components for their individual operations first. After assuring that these front-end
components work correctly on their own, I have conducted various rate tests to evaluate the
performance of these front-ends together and also found maximum data rate that can be
handled by our front-end. I have used “gprof” a gnu profiling tool [11], to analyze and find
the processor intensive code segments. I have later tried to eliminate the code inefficiencies
found using “gprof”. After thorough unit testing, I have conducted integration testing. I
used an iterative process while integrating various DAQ components, integrating a new
component in each step.
34
__________
CHAPTER
4
__________
CONCLUSION
Data acquisition system for the mulan experiment will be deployed at the Paul Scherrer Institut.
The experiment will measure the positive muon lifetime about one part per million. The data
acquisition must handle both very high data rates and very large data values. I have
developed, tested and deployed the DAQ in following stages:
At Nuclear Physics Laboratory at University of Kentucky, I have set-up a mock
experimental setup in order to develop and test the DAQ components. Initially I have
tested programs individually with simulated data read from the hard disk. Next, I tested each
software component by reading actual electronic modules. A flight simulator was used to
simulate signals to the electronics modules. After performing unit testing [6], I performed
integration testing by testing the inter-operation of multiple front-ends.
Stress testing [6] for DAQ with real electronic modules was performed at the Nuclear
physics laboratory at University of Illinois Urbana-Champaign. Finally, I have deployed the
whole DAQ at successfully at Paul Scherrer Institut in Villigen, Switzerland.
35
__________
APPENDIX
__________
A.
OBTAINING THE DAQ FROM CVS
CVS is the Concurrent Versions System, the dominant open-source network-transparent
version control system. CVS for data acquisition system is maintained on “gluon.pa.uky.edu”
in the Nuclear Physics Laboratory at the University of Kentucky.
Organization of CVS:
The DAQ repository is organized in the following directory hierarchy:
Analyzer:
This directory contains analysis code.
Front-ends:
The front-end code directory contains various front-ends.
Midas:
This folder constitutes of MIDAS libraries needed by front-ends.
36
Obtaining a copy from CVS:
To obtain DAQ from CVS repository:
First set the following environment variables CVSROOT, CVS_RSH
Then checkout the package "mulan":
# export CVSROOT=:ext:[email protected]:/home/admin/archive/
# export CVS_RSH=ssh
# cvs checkout muLan
Use the admin account to have write privileges to the archive and use the guest account for
read-only access.
B.
ANALYZERS
There are several analyzers developed for analyzing the data collected by the DAQ. The
analyzers that I have developed are written in ‘C’ Programming Language.
The tasks accomplished by my ‘C’ CAEN data analyzer are as follows:
1. Combine data from several CAEN electronic modules in to a single derived data
bank.
2. The CAEN time is represented by 20 bits. The time rollovers for data segment
longer than 0.76 ms. my analyzer accounts for the time rollover.
3. The CAEN data is not properly time-ordered. So, I sort the data based on time of
hit.
4. I map CAEN channels into detector identifier for the tiles of the µLan ball detector.
5. I store this refined data in the MIDAS data bank format, so that other analyzers can
use this new data.
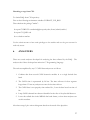
After these steps, I plot various histograms based on the needs of the physicists.
37
The following are some of the plots made by the analyzer.
Fig 4.1 Histogram with time of hit with respect to fill
Fig 4.2 Distribution of hits in CAEN channels
38
C.
SLOW CONTROL
Typically experiments require control of high voltages, readout of temperatures and similar
parameters, which are generally referred to as "slow control". MIDAS incorporates a
complete slow control system into the data acquisition system. This makes it possible to
write all slow control data together with the normal data to disk. Since the slow control data
is stored in the online database, all programs running in an experiment have access to it.
There are some slow control items which specifically relates to µLan DAQ like the magic
box and flight simulator.
The Magic box is a programmable pulser based on XILINX field-programmable gate array
(FPGA). It is controlled and monitored by a standard PC via the enhanced parallel port. It
generates the data segment and fill-segment markers needed by our experiment.
The Flight simulator (FS) is a 32 Channel programmable pulse generator. It is used to
simulate the experimental data. Flight simulator pulses have been extremely useful for testing
the DAQ. The FS can simulate various pulse trains such as a periodic pulse sequence,
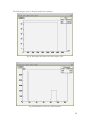
random pulse sequence and an exponential decay pulse sequence. An exponential
distribution simulated by flight simulator is shown in figure 4.3.
Fig 4.3 Exponential distribution generated by a FS
39
D.
FRONTEND PARAMETERS
The following are screen captures of various software front-end component parameters. All
the parameters are stored in file “.ODB.SHM”, also termed the online database. These
screen-shots are taken of the MIDAS web interface.
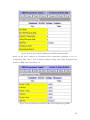
CAEN PARAMETERS
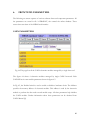
Fig 4.4 This page lists all the CAEN electronic modules managed by a single front-end.
The figure 4.4 shows 4 electronic modules managed by single CAEN front-end. Each
CAEN0X has its own module parameters shown in figure 4.5.
In Fig 4.5, the Enabled switch is used to enable or disable a hardware device. The Address
specifies the memory address of electronic module. This address is used by the electronic
module to perform the data read-out and module setup. All other parameters help initialize
the CAEN module. Further information about these parameters can be obtained from
CAEN Manual [9].
40
Fig 4.5 Lists the Parameters needed by CAEN hardware module.
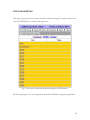
EMC PARAMETERS
The following screen-shots list the Parameters used by EMC software module. EMC has all
the parameters applicable to CAEN module, in addition EMC has following options
provided to user to enable or disable various compression algorithms.
41
Fig 4.6 Lists the data formats enabled by the EMC software module.
Based on the above switches we determine which compression algorithm to use for
compressing EMC data. I have described clump-by-clump, and clump histogram data
formats, in EMC front-end section 3.4.
Fig 4.6 Lists the parameters needed by EMC data compressing algorithm.
42
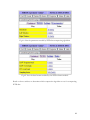
WFD PARAMETERS
Following screen-shot shows various electronic modules managed by single software frontend. Each WFDXX has its own module parameters.
Fig 4.7 lists various electronic modules managed by WFD software.
The following figure lists various parameters needed by WFD data compressing algorithm.
43
Fig 4.8 Lists the parameters needed by WFD data compressing algorithm.
Fig 4.9 Lists the data formats enabled by the WFD software module
Based on above switches we determine which compression algorithm to use for compressing
WFD data.
44
REFERENCES
[1]
University of Kentucky µLan Homepage.
http://www.pa.uky.edu/mulan/
[2]
Proposal for: “A Precision Measurement of the Positive Muon Lifetime
Using a Pulsed Muon Beam and the µLan Detector”
http://www.npl.uiuc.edu/exp/mulan/proposal/proposal.html
[3]
Midas Home page
http://midas.psi.ch/
[4]
Linux IP Masquerade
http://en.tldp.org/HOWTO/IP-Masquerade-HOWTO/
[5]
CVS Manual
https://www.cvshome.org/docs/manual/
[6]
Roger S. Pressman, “Software Engineering”.
[7]
Richard Fairley, “Software Engineering Concepts”.
[8]
CAEN Web Link
http://www.caen.it/index.php
[9]
CAEN V767 - 128 Channel Multi-hit TDC Manual
http://www.caen.it/nuclear/product.php?mod=V767
[10] Paul Scherrer Institut in Villigen, Switzerland.
http://www.psi.ch/index_e.shtml
[11] A GNU profiling utility : “gprof”
http://www.gnu.org/software/binutils/manual/gprof-2.9.1/gprof.html
45