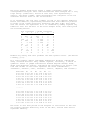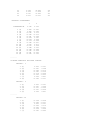
1
THE NewMDSX SERIES OF MULTIDIMENSIONAL
SCALING PROGRAMS
USERS’ MANUAL
FOR WINDOWS 9x / NT / 2000/XP
First published : October 2001
Revised :
August 2004
© The NewMDSX Project
Background
The original MDS(X) Project was funded (1974-1982) by the U.K. Social
Science Research Council in conjunction with the Program Library Unit of
the University of Edinburgh. It grew out of the frustration of a research
group at Edinburgh University trying to work out the similarities and
differences in programs coming from different sources – particularly Bell
Laboratories and University of Michigan (Guttman-Lingoes). The project was
designed to:
•
•
•
•
•
Collect MDS and related programs in common use or of particular interest
rewrite the source-code up to Fortran77 specifications
replace the common subroutines by numerically efficient versions
provide a common instruction set for running programs
produce a utility for producing measures from raw data for input into
(any) multidimensional scaling programs.
For many years, a mainframe version was widely available, and maintained
until recently by Manchester Information and Associated Services
[http://www.mimas.ac.uk/]. Until recently its main use has been on PCs
operating under MD-DOS. This manual describes a new version for use with
Windows 9x, NT, 2000, and XP.
The Windows version now includes programs for Correspondence Analysis
(CORRESP) , analysis of sorting data (MDSORT), and principal components
analysis (PRINCOMP), in addition to the routines originally available in
MDS(X).
For information about MDS(X) on MAC machines contact Wolfgang Otto:
[[email protected]]. He has also operated NewMDSX for Windows
successfully using the MAC PC emulator.
A version of NewMDSX for Linux is in preparation.
The NEWMDS Project has a number of SPONSORS
addition to the Core Project Team.
and COUNTRY REPRESENTATIVES in
1. SPONSORS
<LIST TO FOLLOW>
2. COUNTRY REPRESENTATIVES
<LIST TO FOLLOW>
3. NEWMDSX PROJECT TEAM
Professor A. P. M. Coxon (University of Edinburgh)
[email protected]
[email protected]
Dr A.P.Brier
Professor C.L. Jones (University of Toronto)
[email protected]
Mr D.T. Muxworthy (University of Edinburgh)
[email protected]
Mr W. Otto (University of Zurich)
[email protected]
Dr S.K. Tagg (Strathclyde University)
[email protected]
Dr. Wijbrandt H. van Schuur (University of Groningen)
[email protected]
Dr Nico Tiliopoulos (Queen Margaret University College, Edinburgh)
[email protected]
==========================
All enquiries about NewMDSX should be directed to [email protected]
The NewMDSX Home Page is at
http://www.newMDSX.com
INTRODUCTION
Why scale to begin with ?
The purpose of scaling is to obtain a quantitative representation of
a set of data.
How is such a representation obtained ? The basic idea is that much
data can be thought of as giving information about how similar or
dissimilar things are to each other. Scaling models then take this idea
seriously, and represent the objects as points in space. In this space, the
more similar objects are, the closer they lie to each other. The pattern of
points which most accurately represent the information in the data is
referred to as ‘the solution’ or ‘final configuration’. Some common uses of
MDS are:1.
to measure an attitude, attribute or variable. e.g. the subjective
loudness of a series of tones, the degree of ethnocentrism, the
intensity of a particular sexual orientation, preference for a range
of educational policies, the utility of a set of goods, the prestige
of a group of occupations.
2.
to portray complex data in a simpler manner. e.g. to represent the
relationships between a set of objects in an easily assimilable,
usually spatial, form.
3.
to infer latent dimensions or processes. e.g. to identify the factors
involved in peoples’ judgements of the desirability of types of
housing, or the most likely historical sequence of a set of graves, or
how subjects' overall judgements of similarity relate to the known
properties of the objects concerned.
DATA THEORY AND MEASUREMENT
The main impetus towards developing MDS models came from the wish to
develop distance models as a paradigm for the measurement and analysis of
psychological and social science data, and to build such models without
being committed to the strong distributional or measurement assumptions
usually made. This so-called “non-metric” orientation has been associated
above all with Clyde Coombs (1964) who pioneered much early non-metric MDS
modelling, and whose viewpoint might be summarised in the following
propositions:
i)
Assumptions about the “level of measurement” of one’s data, and
assumptions involved in the scaling models used to analyse
data, commit one to substantive hypotheses about human
behaviour.
ii)
It is better to err on the side of conservatism in attributing
metric properties to social science data, and to use weaker
measurement structures to represent them.
iii)
Because most social science data have been elicited in nonexperimental settings, and often refer to diversified or non-
homogeneous populations, it is well to be especially sensitive
to individual or group differences, which may be crucial to the
interpretation of the processes generating the data, but which
are typically “washed out” in the usual aggregation procedures.
Coombs’ initial work lay in the analysis of preferential data and he
evolved a distance model for their analysis. This model, which he termed
“Unfolding Analysis” was especially sensitive to individual differences.
The failure to develop a workable algorithm for fallible data meant that
Unfolding Analysis was of little interest to the practising scientist,
however attractive it was, or sensitive it was to representing individual
differences. A tractable algorithm in fact awaited the development of
multi-dimensional scaling procedures, which were equally committed to
making use only of ordinal information to obtain a metric solution to the
data.
NON-METRIC MDS:
THE BASIC MODEL
Developments in non-metric MDS procedures and models represent one of
the most significant methodological advances of the last forty years.
Stated simply, their purpose seems very pedestrian – namely to relax the
assumption of linearity usually made about the kind of function linking the
dissimilarities (the data) and the distances in the solution. In this
sense, it could be seen as analogous to the shift of interest to nonparametric statistics. The greatest pay-off from the use of non-metric MDS
is that the same basic algorithm is easily extended to very different types
of data, to different models (other than just the distance model) and it is
readily applied in a wide variety of situations and in disciplines as
diverse as archaeology and electronics as well as the usual social science
applications. Moreover, unlike conventional multivariate models,
assumptions about distributions rarely need to be made and the procedures
in no way depend upon the particular measures of similarity used. For
example, frequencies, probabilities, ratings, co-occurrences are quite as
appropriate as measures of similarity as are composite indices like
coefficients of correlation, covariance, association and overlap. Perhaps
most importantly, however, non-metric MDS solutions are “order-invariant”.
That is to say that only the ordinal content of the data is made use of in
obtaining a solution, so that any set of data with the same ordering of
(dis)similarities will generate the same metric solution.1
The basic rationale of non-metric MDS is well discussed in Shepard
(1962). He begins by considering the difficulty of achieving numerical
representation when only a ranking of the objects is known. This stems from
the fact that points representing the objects can be moved very extensively
(i.e. can take on a large range of numerical values), whilst still
satisfying such ordinal constraints. However, once the representation must
in addition satisfy “ordered metric” constraints (i.e. once the data
contain, in addition, information on the order of the inter point
distances) the range of possible numerical values is greatly reduced:
“if non-metric constraints are imposed in sufficient
number they begin to act like metric constraints ...
As the points are forced to satisfy more and more
Inequalities on the inter-point distances ... the
Spacing tightens up until any but very small
Perturbations of the points will usually isolate
one or more of the inequalities” (ibid. 288).
The notion that order relations on distances impose very severe
constraints on the uniqueness of numerical representation is now
commonplace, but its convincing demonstration awaited the development of an
iterative algorithm to implement the set of constraints obtained from the
data. The basic rationale for this non-metric MDS algorithm is given by
Kruskal (1964) and this has formed the basis for almost all subsequent work
in this area.2
2.1 The empirical data are interpreted as follows
i)
There is a set C of objects (often termed stimuli), and these
objects will be represented as points in a multidimensional
space. Significant information about the relations between the
objects is contained in some empirical measure of
dis/similarity, linking pairs of objects. Only the (possibly
weak) ordering of these dissimilarity coefficients
δ(ci , cj) = δij
will be preserved in obtaining the solution.
In common terminology, the measures input to MDS are termed “proximities”
or “dis/similarities”. This usage emphasizes the fact that such measures
may be EITHER similarities OR dissimilarities; the only difference is that
dissimilarities will be positively related to the distances of the solution
whereas similarities will be related negatively to the distances of the
solution. Thus if similarity measures (such as correlations, co-occurrences
as well as actual similarity ratings)are input then the higher the
similarity of two objects, the closer they will be made to be in the
solution space, whereas if a dissimilarity measure (such as the Index of
Dissimilarity, Euclidean distance or dissimilarity ratings)is input, the
higher the dissimilarity of two objects, the more distant they will be made
to be in the solution space. Users should be especially careful to check
which of the two types their data measure is, as this is one of the most
common mistakes made in MDS runs, and even if such a mistake is made, a
program will still run to completion, giving high-stress “inverted”,
meaningless solutions.
Because input measures are most commonly similarities, this is usually the
default value in programs. However, in explaining MDS, it is often simpler
to talk of data as dissimilarities, because they are semantically analogous
to the distances of the Distance model.
ii)
The solution, or configuration of points xia
(corresponding to the coordinate of each point ci
on dimension a) is embedded in a r-dimensional
metric space, and a distance function
d(ci , cj) = dij
is defined on this space. For simplicity, this
distance is assumed to be Euclidean.
ii)
The goal of any non-metric MDS procedure (at least for a
distance model) is to find a set of points (X) in a space
of minimum dimensionality such that the dissimilarities
(data) are a monotone (ordinal) function of the distances, i.e.
that whenever
δij
<
δkl
dij
<
dkl
then
(Kruskal’s Weak Monotonicity Criterion)
A configuration in r-space which satisfies this criterion is a
r-dimensional solution for the data.
Shepard (1962) first developed an algorithm to obtain such a solution
as a two step iterative process consisting of:
(i) determining the metric configuration that best reproduced the
data, and (ii) emphasising or “flattening” the resulting configuration into
as few dimensions as possible. Besides proving the viability of this
approach, he also showed that it was possible to recover the specific form
of the monotone function specified in the model. Thus, so long as the δij
are any monotone function of the “genuine” distances, the plot of δij by the
recovered distances will reveal the form of that transformation. Non-metric
MDS can incorporate any monotone function linking the δij and dij .
Kruskal (1964), starting from Shepard’s work, defined non-metric MDS
as follows:
“We view multidimensional scaling as a problem of
statistical fitting – the dissimilarities are given
and we wish to find the configuration whose distances
fit them best.”
This he did by explicitly introducing a “badness of fit” quantity to
be minimized in the iterative process, namely STRESS, which is a normalized
residual sum of squares from monotone regression (see Carroll and Kruskal
1969).
Si =
[ Σi<j (dij – ˆdij)2 ]½
___________________
Σi<j d2ij
and he introduced the new fitting quantities ˆdij (known variously as
“pseudo distances”, “disparities” or “discrepancies”), which are the leastsquares fit to the distances (dij) and are as close as possible to being in
the same order as the data. (These quantities incidentally avoid performing
arithmetic on the data quantities (δij ) which is ex hypothesi excluded by
the non-metric approach). These dij are obtained by a technique known as
monotone or isotonic regression (see ibid, 126).
The iterative procedure developed by Kruskal basically proceeds as follows:
i)
an initial configuration in a user-determined
dimensionality is produced.3
ii)
the configuration is normalised.
iii)
pairwise distances between the points in this space
are then calculated.
iv}
monotone regression: The distances are fitted by a best
fitting monotone function, giving a set of “disparities”.
v)
the stress (badness of fit) of the current configuration
is calculated from the distances and disparities.
vi)
if stress is acceptably low, the final configuration and
summary data are output. Alternatively:
vii)
a correction factor is next calculated to move the
configuration in the direction of lower stress. This
moves the points in the direction giving a new
configuration which has greater conformity with the data
(i.e. to a configuration of lower stress).
viii) If the gradient is zero, then a (possibly local) minimum
has been reached in the sense that any further gradual
change in the configuration will increase stress.
This basic algorithm of Kruskal’s, often referred to as M-D-SCAL,
differs slightly from the approach implemented by MINISSA in the NewMDSX
series: Roskam’s approach in MINISSA is to manipulate simultaneously the
disparities and the distances. This is discussed at greater length in the
documentation of MINISSA. This process of minimization using negative
gradients has now been replaced by more efficient methods in many programs.
EXTENSIONS OF THE NONMETRIC MULTIDIMENSIONAL DISTANCE MODEL
MDS procedures can be differentiated by three criteria:
the form of the data to be analysed;
the model which specifies the precise way in which the data are
represented in the space; and
the transformation or function which is assumed to relate the
original data to the solution. (This third criterion is often referred to
as the ‘level of measurement’). Thus the basic non-metric model, which may
be considered as a paradigm, provides for:
(DATA)
(1)
(2)
(3)
(4)
the internal analysis of a
square
symmetric
two-way data matrix by a
(MODEL)
(5)
(6)
Euclidean
distance model, involving
(FUNCTION)
(7)
a monotonic transformation of the data.
The restrictions implied by each emphasized qualifier in the previous
Sentence have been successively relaxed allowing the extension of MDS to a
very wide class of models for very different types of data: examples of
each generalisation are given below:
3.1
Internal vs. External analysis
The basic MDS algorithm generates a configuration of points purely in
accordance with the ordinal information in the data, i.e. the result is
defined “internally” by the data matrix.
In some cases, however, the positions of the stimuli may be already
known or assumed, and in this case so-called “external” analysis is
performed, using additional external data information (often called
“properties” and fitting the new properties within this frame. A
particularly important example occurs in preference mapping where a set of
preference judgements (external properties) are related to a known
configuration of stimulus points (see PREFMAP).
3.2
Various matrices
A very useful generalisation is the extension to conditional
similarity data, where data are treated as comparable only within rows (or
only within columns). Data relating two distinct sets of objects (e.g.
subjects and stimuli) thus become analysable in the MDS framework. The most
common example of this type is preference data (e.g. where a set of
subjects judges, say, a set of alternative political policies in terms of
their desirability). The most obvious benefit of this extension is that it
provides a tractable method of analysis for unfolding models.
Briefly, the Unfolding Model seeks mapping in the same space of a set
of points representing stimuli (usually the objects of choice or
preference) and a distinct set of points representing the subjects (each
point representing the most preferred or ‘ideal’ location of the subject
concerned. In the resulting configuration, therefore, a more-preferred
stimulus is closer to the subject’s ‘ideal’ point than a less-preferred
point, and hence an individual’s preference order represents the rank order
of that distance between his/her (fixed) ideal point and the locations of
the set of stimuli.
It is a relatively simple matter to adapt the non-metric MDS
algorithm to deal with such data and produce procedures for
‘multidimensional unfolding analysis’ where the final configuration
represents a mapping of both ‘subject’ and ‘object’ points into a
multidimensional space. (For a fuller discussion see MINIRSA).
A parallel move away from the paradigm case involves the analysis of
square but asymmetric data matrices, such as might for instance be obtained
from a sociometric experiment in which each of a set of subjects is asked
to rank or rate the other members of the set in terms of, say, friendship.
In this case the same set may be mapped twice, first as a set of judges and
secondly as stimuli. A possibility of external preference analysis is given
in the present series by the PREMAP program (q.v.).
NewMDSX also includes programs specifically written for thye direct
analysis of special types of data, such as free-sortings (MDSORT), triadic
judgments (TRISOSCAL), as well as frequency Tables (CONJOINT, CORRESP) and
Profiles(PARAMAP).
3.3
Extensions from the Euclidean distance model
A Euclidean distance (djk) is defined as:
djk = ⎧ ∑ | xja - xka |
⎩
a
2
⎫ ½
⎭
where xja is the co-ordinate of point j on the a’th distance.
To date, the vast majority of MDS studies have used the Euclidean
distance model, whether through convenience, beliefs about its robustness,
or attachment to its substantive implications (Shepard 1969, Sherman 1970).
Euclidean distance is, however, a special case of a more general family of
Minkowski metrics, defined as:
djk = ⎧ ∑ | xja - xka |
⎩
a
r
⎫ 1/r
⎭
where the so-called Minkowski parameter r can lie between 1 and infinity.
A good deal of psychological research (Attneave 1950) shows that when
dimensions of judgement are few and sufficiently salient or recognisable,
the ‘city-block’ metric (r = 1) provides a better explanation of, and fit
to, judgemental data. By contrast, the ‘dominance metric’ (r = infinity),
where the largest single dimensional difference dominates all others,
should fit a good many complex stimuli. Arnold (1971) provides an
interesting test of the behavioural assumptions of different metrics on the
ratings of similarities between pairs of words drawn from distinct wordclasses. The possibility of varying the Minkowski parameter is allowed
inMRSCAL (q.v.) and MINISSA (City Block and Euclidean only).
Lingoes (1972) and others have also developed non-metric analogues of
factor analysis. Once again, the purpose is to provide a lowest-stress fit
to a monotone transform of the symmetric data matrix of (dis)similarities.
An example of a metric factor analysis (or vector) model is the MDPREF
model, where, as in the distance model, stimuli are represented as points
in a multidimensional space, but a subject’s preferences are represented in
this space as a vector or line oriented to the region of his/her greatest
preference. The order of projections of stimuli points on this line
represents the subject’s order of preference.
A further instance of the generalisability of the non-metric MDS
algorithm is its extension to an additive model, which regards the data as
some additive combination of factors rather than of the complex distance
function. This additive model is a special case of conjoint models
implemented by the CONJOINT program (q.v.) and in effect provides a nonmetric version of analysis of variance.
3.4
Metric and non-metric approaches
Historically, the first MDS models were designed to preserve metric
information in the data and assumed that the empirical (dis)similarities
were some linear function of the model distances. The main metric program
of the present set differs, however, in many ways from ‘classic’ metric
MDS. As we have seen, the more recent approach used ordinal information,
and hence the much broader class of monotonic functions is available. In
MDS procedures, this distinction has basically been implemented by the form
of regression used – usually linear regression of data upon distances in
the metric case, and monotonic regression in the non-metric case.
This class has been extended to allow Kruskal’s suggestion that
multivariate linear regression or polynomial regression (of higher than
linear degree) be exploited in some circumstances (Kruskal 1969), and
secondly Shepard and Carroll’s (1966) Parametric mapping model PARAMAP,
which seeks to maximise an index of continuity which assures that the
function will be at least locally monotone.
3.5
Three-way scaling
Perhaps the most far-reaching development in multidimensional scaling
has been the extension to 3- or higher-way data matrices. To call a data
matrix ‘two-way’ is in fact to say nothing more than that it is a matrix,
i.e. it is composed of some measure between two sets of objects which, as
we have seen, may or may not be identical. If the data are, say, adjudged
dissimilarities on a set of stimuli by one individual at one time then the
solution is simple. But in the case of a matrix of similarity judgements
elicited from a number of subjects (usually, though not necessarily,
individuals)4 the third ‘way’ is the ‘stack’ of these two-way matrices.
The basis of the problem is that if data from a number of subjects are
aggregated before analysis, there is no way of knowing whether important
and systematic differences exist in subjects’ judgements, and hence whether
the aggregate solution represents anything but a statistical artefact.
Conversely, however, even if a solution is obtained from each subject
individually, there is no obvious way in which the degree of commonality
between subjects’ ‘cognitive maps’ can be assessed. One attractive
conceptualisation of the problem by Horan (1969) suggests that a “Normal
Attribute Space” be defined as the union of all dimensions used by
subjects. This space, which is called the “Group Stimulus Space” in the
INDSCAL program will usually be of high dimensionality (since it may very
well include purely idiosyncratic dimensions) has the advantage that every
subject is using some subset of the dimensions. Carroll and Chang (1970) in
their classic paper on three-way scaling go on to suggest that, rather than
subjects’ use of dimensions being ‘all or nothing’, they rather attach
weights (representing differential salience or importance) to them. Thus,
when an individual’s set of weights are applied to the Group Stimulus
Space, the effect is to differentially stretch or contract the dimensions
and yield an idiosyncratic, transformed, configuration of points (the socalled “Private Space”). This general approach and specific method are more
fully discussed in the section on INDSCAL.
Notes
1.
See Lingoes (1966) and Sibson (1972) for an extended discussion of
these points.
2.
See Shepard (1962), Guttman (1965), Lingoes and Roskam (1971) for
basic contributions to the development of the algorithm. The
technical issues involved will only be touched on here, but are fully
discussed in Lingoes and Roskam, and in Green and Rao (1971). The
most robust and near-optimal algorithms are represented by the
Guttman-Lingoes-Roskam series (Lingoes and Roskam 1971 In the NewMDSX
series, the program implemented is MINISSA (v.i.).
3.
Kruskal initially recommended the generation of a random or arbitrary
starting configuration. It has subsequently been shown that this will
considerably increase the probability of a process finishing in a
local minimum. A “quasi-non-metric” initial configuration defined by
Guttman-Lingoes or Torgerson is greatly preferable. See Lingoes and
Roskam (1971).
4.
Subjects may be not only individuals but “pseudo-subjects”
groups,
distinct times, places, replications, or, indeed, in an interesting
application, scaling solutions obtained from different MDS programs
(see Green 1972).
BIBLIOGRAPHY
Arnold, J.B. (1971) A multidimensional scaling study of semantic
difference. J. of Exp. Psychology, 90, 349-372.
Attneave, F. (1950) Dimensions of similarity. Amer. J. of Psychol.,
63,516-56.
Coombs, C.H. (1964)
A Theory of Data, New York: Wiley.
Green, P.E. and V.R. Rao (1972) Applied multidimensional scaling.
New York: Holt Rinehart.
Kruskal, J. B. (1964) Multidimensional scaling by optimizing goodness of
fit to a nonmetric hypothesis, Psychometrika, 29, 1-27
Kruskal, J.B. and J.D. Carroll (1969) Geometric models of
badness-of-fit functions, in P.R. Krishnaiah (ed.)
Multivariate Analysis II, New York: Academic Press.
Lingoes, J.C. (1966) Recent computational advances in non-metric
methodology for the behavioral sciences. Reprinted in Lingoes (1977).
Lingoes, J.C. (ed.) (1977) Geometric representations of relational data,
Mathesis Press, Ann Arbor, Michigan.
Lingoes, J.C. and E.E.Roskam (1971) A mathematical and empirical
Evaluation of two multidimensional scaling algorithms. Psychometrika,
38,(4.2).
Shepard, R.N. (1962) The analysis of proximities: multidimensional
scaling with an unknown distance function (parts 1 and 2),
Psychometrika, 27, 125-246.
Shepard, R.N. et al. Multidimensional Scaling (2 vols.). New York:
Academic Press.
Sibson, R. (1972) Order invariant methods for data analysis. Journal
of Royal Statistical Society, 34, 311-349.
HOW TO USE NewMDSX FOR WINDOWS
1.1
Overview
The main Editor/Interface appears automatically when the program is loaded,
and is used to control the creation and editing of files and the execution
of the various NewMDSX procedures. It consists of two resizeable panels,
the upper for input and the lower(closed in the following)for output files.
Before selecting an input file or entering new data, the name of the
NewMDSX program to be used must first be selected in the pull-down window
to the right of the toolbar. In the above illustration, this is MINISSA.
A number of demonstration input (*.inp) files for the various NewMDSX
procedures are automatically installed with the program. These can be
loaded from the File menu or by using the open file button on the toolbar,
after first selecting the name of an NewMDSX procedure from the pull-down
menu to the right of the toolbar. In the above illustration, the file
Test_MINISSA.inp has been selected. Besides offering to open or save files,
the File menu also allows you to Reopen files you have recently used,
without having to search for them again. Clicking on the Run button on the
toolbar will execute the procedure selected in the pull-down menu, taking
as input the file currently displayed in the editor window.
The main window also serves as a fully-functional text editor, with the
ability to change font types, sizes and colours, to search for strings in
the file displayed, edit, annotate and save input and output files
associated with the various NewMDSX procedures. When images have been
saved, it can also be used to amend them, to outline and label features of
interest as required.
Clicking on the Data Entry button (or the Tools|Data entry menu item)
calls the WOMBATS routine (Work Out Measures Before Attempting To Scale).
This generates matrices of a wide variety of measures of (dis)similarity
which can be stored for use by NewMDSX procedures or by other programs.
Use the adjacent button (or Tools|Matrix conversion ) to call a utility to
convert between different matrix formats.
New input files to the selected NewMDSX procedure can be created most
conveniently with the help of the corresponding Input Wizard. This also
offers a facility for data input in spreadsheet form, according to the
parameters which the user has selected, and automatically initiate the
corresponding analysis, displaying the results in the main window.
Clicking on the Graphics button when output from one of the NewMDSX
procedures is displayed will open a graphic display of the configuration
or diagram following the current cursor position (see below, 1.4.).
1.2. Data entry
When using the input Wizard to create an input file for one of the NewMDSX
routines, simply follow the prompts for the necessary commands, as they
appear in the Wizard’s opening window, in the following example creating an
input file to MINISSA:
The data to be analysed are entered into the following spreadsheet,
displayed after clicking on the button marked Next in the above window.
This will invite a rectangular or lower-triangular data matrix of the
dimensions specified by the user, according to the requirements of the
procedure currently selected and the value of the DATA TYPE parameter.
Note that it is also possible to enter your own row and column names in the
spreadsheet, to help identify the stimuli in the output. This simply adds
an appropriate LABELS specification (see p. 24) to the input file created
by the input Wizard.
After positioning the spreadsheet cursor in an appropriate starting
location, you may also click on Read from file to load data in the
appropriate order from a free format plain text file, which may have been
exported directly from another program or created by cutting and pasting
from a file in another format. Alternatively, click on Edit to paste data
direct from the Windows clipboard. If the first line of data to be read, or
pasted, in this way contains a series of variable labels,
for example:
VAR1
99.0
51.1
71.4
63.0
58.6
VAR2
51.1
99.0
75.8
52.7
57.7
VAR3
71.4
75.8
99.0
36.9
40.8
VAR4
63.0
52.7
36.9
99.0
32.3
VAR5
58.6
52.7
40.8
32.3
99.0
where a symmetric matrix of similarity values is headed by simple variable
names, these will be inserted in the spreadsheet in the appropriate
locations.
For PINDIS (see pp124ff), which allows the input of labelled
configurations, the format is as follows:
VAR1 -0.1358 0.2993 -0.7294
VAR2 0.2229 -0.6381 0.5729
VAR3 0.2679 -0.7446 -0.3938
VAR4 -1.1287 0.2396 0.2875
VAR5 0.7737 0.8437 0.2628
These are the techniques to use to speed up importing and exporting data to
and from NewMDSX. It is worth spending some time looking at them, in
conjunction with the demonstration data provided with each routine, before
attempting to enter your own data for analysis.
Finally, click on Continue to close the spreadsheet window and create the
corresponding input file.
It is, of course, also always possible to use the main editor/interface to
directly enter or modify input files as required.
1.3
Matrix conversion
A utility has been included in NewMDSX for Windows to facilitate conversion
between the matrix formats commonly encountered in importing from and
exporting to other programs, as well as between routines in NewMDSX.
Clicking on Continue in the
to create the input matrix,
program and saved in a free
the Windows clipboard ready
window shown above opens a spreadsheet window
which may have been exported from another
format text file, or may have been placed in
to be copied into the spreadsheet displayed:
Click on Read from file to load numerical data from a text file, or on
Edit, to paste data direct from the Windows clipboard. Click on Continue to
close the spreadsheet window and display the resulting matrix in the input
window, from where it can be saved or copied for further use.
1.4. Graphics
When a NewMDSX procedure has been executed and the results are displayed in
the output window, clicking on the Graphics option invokes a graphic
display of the first suitable data configuration or diagram which the
program can locate in the listing following the current position of the
editor cursor.
1.4.1 When the results of a HICLUS cluster analysis are displayed in the
editor window, this will show the cluster diagram (if any), immediately
following the current cursor position, as a graphic dendrogram:
1.4.2
When the results of the other NewMDSX procedures are displayed in
the editor window, clicking on the Graphics button will show the
configuration (if any) for which the data are listed following the
current cursor position, in the form of a pseudo-3-dimensional
display, as follows. Alternatively, click on the Graphics button
when the cursor is inside one of the ‘line-printer’ output plots.
This display can be manipulated as follows:
•
click on the buttons on the toolbar, or use the short-cut keys indicated
to rotate, zoom, or reflect the display. Click on any point to highlight
its label.
•
Back and Forward change the combinations of dimensions displayed if the
configuration selected in fact contains more than three dimensions
•
click on the axis end points to see the effect of incremental clockwise
rotations of the configuration with respect to the selected axis (the
numerical keys 1, 2, and 3 have the same result). Use Configuration to
keep track of this process and save rotated configurations if required.
Use the menu item Reflect to see the result of reflecting the display
about the vertical or horizontal axes. To see reflection about dimension
2, first rotate the display to two dimensions only.
•
hold down the right mouse button with the pointer on the display, move
the pointer to another position and release the mouse button again, to
drag the display to a different location in the window.
•
Click on the menu item Labels to adjust the maximum number of
characters, the font and character size displayed in point labels.
Clicking Draw allows you to draw on the display with the mouse, to
highlight features of interest. Lines enables you to draw straight lines,
from a point where the mouse button is depressed to a point where it it
liftes again. Clicking Text causes a box to appear to enter text. On
closing this box, move the mouse to the position required and press a mouse
button to add the text to the image displayed. The image as amended must
then be saved immediately on completion, as the additions will be lost when
the display is further changed. Click on Refresh Display to clear and
return to the original image.
1.4.3 For graphical display of higher-dimensional configurations, Andrews
plots are offered as an alternative to a series of pseudo-3-dimensional
displays.
If the data are k-dimensional, each point x' = (x1, x2 , . . . , xk) defines
a function
fx(t) = x1/sqrt(2)+ x2.sin(t)+x3.cos(t)+x4.sin(2t)+x5.cos(2t)+
. . .
which is plotted over the range -π < t < π.
In these plots, points in a higher-dimensional configuration which are
close together in Euclidean space are represented by functions which remain
close together for all values of t. Outlying values on the other hand lead
to a peak in the corresponding function for some t. This form of plot is
useful to summarise higher-dimensional data when the number of individual
stimuli in the MDS analysis remains relatively small, say less than 10. The
plots become confusing, however, for larger numbers of stimuli/variables.
See D.F.Andrews, "Plots of high-dimensional data" Biometrics,28, 1972, pp.
125-136, for a full discussion of this plotting technique in the
interpretation of data.
1.4.4. The output from most NewMDSX procedures includes Shepard diagrams,
relating values fitted by scaling to the original data. Placing the editor
cursor in front of the words ‘SHEPARD PLOT’ (or ‘CORRELATION’, in the case
of output from PROFIT, will open a graphic display of the diagram which
follows.
Click on the Save button in each of these displays to save them in a
graphics file for later reference. Alternatively, you may use ALT+PrtScr to
save the display to the Windows Clipboard for inclusion in other documents.
Click on the Close button in the display window to close it and return to
the main NewMDSX window.
1.5.
THE NewMDSX COMMAND LANGUAGE
The NewMDSX procedures themselves employ a set of commands similar
to, though not identical with, those originally used in SPSS. Programspecific parameters are set with the command PARAMETERS. (Consult the
documentation for the individual procedures for full details of their
particular commands and PARAMETERS).
All commands in NewMDSX may be entered in UPPER or lower case letters
and in free format. Spaces are ignored except in keywords, which must be
typed in full. All input is expected to be in free format, separated only
by spaces. In certain instances, where data are taken from other sources,
it may not be possible to read them correctly in free format. In such cases
a fixed format for the data can be specified, using the Fortran-style INPUT
FORMAT statement (several of the example data sets supplied with the
program illustrate how this is done).
The output commands PRINT, PLOT and PUNCH are retained in their
original form, for compatibility with earlier versions of MDS(X) although
they now have different functions. PRINTed and PLOTted output now all
appears in the main output file generated by a NewMDSX procedure, while
PUNCHed output is placed in a secondary output file and may be saved for
separate use, as required.
1.5.1 FORMAT OF COMMANDS
A command has two distinct parts:
i)
the command word itself, and
ii)
an operand (or parameters) field which follows the command word,
separated by any number of spaces.
The operand field may be blank for some commands.
The command word
All commands in NewMDSX may be entered in upper or lower case letters,
but the spelling (and any spaces in the command) must conform to the
specifications in section 1.5.2.
The operand field
The operand (or parameters) field may also be in upper or lower case
characters, and must follow the command word, separated from it by an
arbitrary number of spaces. All spaces in the operand are ignored except in
the spelling of keywords, which must be typed in full.
Commands must occupy one and only one line of input except for the
PARAMETERS command, COMMENT, LABELS and the three output option commands
PRINT,
PLOT and PUNCH which may continue for as many lines as necessary, in free
format.
Generally, there is no fixed order of precedence of commands.
However, all data definition instructions (N OF SUBJECTS, N OF STIMULI,
PARAMETERS, etc.) must precede READ MATRIX. For compatibility with earlier
versions of MDS(X), each READ MATRIX or READ CONFIG command may be preceded
by an INPUT FORMAT specification, if one is used, although by default all
data will be assumed to be in free format, with the values separated by
spaces. It is therefore only necessary to consider using a fixed INPUT
FORMAT specification when the data for some reason will not be correctly
interpreted in this way.
It should also be noted that the PRINT, PLOT and PUNCH commands must
precede the COMPUTE command.
All commands are echoed in the output and all errors (up to the
specified ERROR LIMIT) are flagged. If an error has occurred then the
remaining input will be scanned for errors.
1.5.2
NewMDSX COMMANDS (obligatory commands are marked with an asterisk
for ease of reference)
1.
The RUN NAME
-----------------------------------------------------------------------RUN NAME
any descriptive title for the run
----------------------------------------------------------------------Function : Provides a name for the run
Status
:
Optional
2.
The TASK NAME
-----------------------------------------------------------------------TASK NAME
any descriptive title for a subtask
-----------------------------------------------------------------------Function :
Status
Notes
:
:
Provides a name for the task (Useful in runs
where more than one task is performed)
Optional
On encountering a second (and subsequent)
TASK NAME, PARAMETERS will resume their
default values.
3.
The COMMENT command
-------------------------------------------------------------------------COMMENT
any comments
-------------------------------------------------------------------------Function :
Status
:
Allows the user to insert comments and notes at
any point in the run. Comments may be continued
on subsequent lines in free format.
Optional
4.
The LABELS command
-------------------------------------------------------------------------LABELS
plus a series of variable labels, on successive
lines, beginning with the one containing the command
-------------------------------------------------------------------------Function :
Status
:
Available in most procedures to allow the
association of labels to assist in identification
of variables in tables and plots.
Optional
5.
The PRINT DATA command
-----------------------------------------------------------------------PRINT DATA
(YES)
(or )
(NO )
----------------------------------------------------------------------Function :
Status
Notes
*6.
Allows the user to have any input data echoed in
output. Can be useful if the system appears to be
misreading your data.
: Optional
: PRINT DATA is initially set to NO and will remain
in force until the end of the run or another
PRINT DATA is encountered.
The # OF SUBJECTS instruction
--------------------------------------------------------------------# OF SUBJECTS
number of subjects in the analysis: must
or
be an integer value
NO OF SUBJECTS
or
N OF SUBJECTS
--------------------------------------------------------------------Function : Provides the system with the number of subjects
in the analysis.
Status
: Obligatory for most procedures
Notes
: Not applicable to some procedures: see the
relevant program documentation.
CORRESP uses N OF ROWS
*7.
The # OF STIMULI instruction
--------------------------------------------------------------------# OF STIMULI
number of stimuli in the analysis: must
or
be an integer value
N0 OF STIMULI
or
N OF STIMULI
--------------------------------------------------------------------Function : Provides the system with the number of stimuli
in the analysis
Status
: Obligatory for most procedures
Notes
: Not applicable to some procedures: see the
relevant program documentation.
CORRESP uses N OF COLUMNS
*8.
The DIMENSIONS instruction
---------------------------------------------------------------------DIMENSIONS
<number>
<number list>
Not possible for all procedures:
<number> TO <number>
consult program documentation
--------------------------------------------------------------------------Function : Sets the dimensionalities for the analysis
Status
: Obligatory
Notes
: Solutions are usually computed from the highest
dimensionality down to the lowest, whatever the
order specified in the command.
9.
The PARAMETERS command
--------------------------------------------------------------------------PARAMETERS
keyword (value), keyword (value) etc.
--------------------------------------------------------------------------Function : Allows the user to set program parameters to
control the analysis
Status
: Optional
Notes
: See the relevant program documentation for full
details of keywords and values.
10.
The ITERATIONS instruction
--------------------------------------------------------------------ITERATIONS
maximum number of iterations to be performed
--------------------------------------------------------------------Function : Sets the maximum number of iterations to be
performed in the analysis
Status
: Optional
Notes
: Applicable only to those procedures which employ
an iterative procedure. A maximum of 100 iterations
will be assumed if this instruction is not used.
11.
The INPUT FORMAT instruction
---------------------------------------------------------------------INPUT FORMAT
a FORTRAN format descriptor enclosed in brackets
(excluding the word FORMAT)
--------------------------------------------------------------------Function :
Status
:
Notes
:
Describes the data to be read in
Optional; free format input is assumed if not used.
This is included for the sake of completeness. Most
users will probably be content to use free format input.
The format, if specified, must be suitable for reading
real numbers. Please consult the relevant program
documentation.
If in doubt, consult a FORTRAN programmer.
12.
The READ MATRIX command
------------------------------------------------------------------READ MATRIX
blank
------------------------------------------------------------------Function :
Status
Notes
:
:
Instructs the system to begin reading the data
matrix (or matrices) from the selected INPUT
MEDIUM (according to INPUT FORMAT, if used).
Obligatory
READ MATRIX may be preceded by an INPUT FORMAT
Command, and where applicable # OF SUBJECTS and
# OF STIMULI instructions. See relevant program
documentation for the type of matrix expected.
The data matrix must immediately follow
the READ MATRIX instruction.
13.
The READ CONFIGURATI0N command
----------------------------------------------------------------------READ CONFIG
blank
----------------------------------------------------------------------Function :
Status
Notes
Instructs the system to read in an initial
configuration rather than generating its own.
Use of this option can often cut the time taken
to reach the solution.
: Optional
: READ CONFIG, if used, may be preceded by its
own INPUT FORMAT instruction if free format input
is not satisfactory and, where applicable,
# OF SUBJECTS, # OF STIMULI, and DIMENSIONS
instructions.
See the relevant program documentation for the type
of matrix expected.
The configuration must immediately follow the
READ CONFIG instruction.
*14. The COMPUTE command
---------------------------------------------------------------------COMPUTE
blank
-----------------------------------------------------------------------Function : Instructs the system to start the computation
Status
: Obligatory
Notes
: COMPUTE must be preceded by READ MATRIX.
15.
The PRINT, PLOT and PUNCH commands
----------------------------------------------------------------------PRINT
or
PL0T
or
PUNCH
ALL
ALLBUT
EXCEPT
<matrix name (dimensions)>
<matrix list>
<null>
----------------------------------------------------------------------Function : Allows user control over the amount of output generated
Status
: Optional
Notes
: These are retained for in their original form for
compatibility with earlier versions of MDS(X). PRINTed
and PLOTted selections appear in the main output file,
and PUNCHed selections in a secondary output file.
For convenience, specifying a PLOT option will
automatically also PRINT the corresponding values in
tabular form in the output file.
See the relevant program documentation for details of
options available in each procedure.
16.
The ERROR LIMIT instruction
--------------------------------------------------------------------ERROR LIMIT
<number>
----------------------------------------------------------------------Function :
Status
Notes
Sets the number of errors to be encountered in
reading the input file before processing ceases
: Optional
: The default value allows for 20 errors.
17.
The FINISH command
----------------------------------------------------------------FINISH
----------------------------------------------------------------Function : Terminates the run
Status
: Obligatory (must be the last command in the run
instructions)
PROGRAMS WITHIN NEWMDSX
2.
CANDECOMP (CANonical DECOMPosition)
2.1
OVERVIEW
Concisely: CANDECOMP (CANonical DEC0MPosition)
provides internal analysis of a 3- to 7-way data matrix of (dis)similarity
matrices, by a weighted scalar product distance model using a linear
transformation of the data.
Following the categorisation developed by Carroll and Arabie
(1979) the program may be described as:
Data:
Three- to seven-way
Two- to seven-mode
Polyadic
Linear
Complete
Model:
Generalised Scalar products
Two to seven sets of points
Internal or External
2.1.1 ORIGIN, VERSIONS AND ACRONYMS
The present CANDECOMP program performs the analysis described
in Carroll and Chang (1970) as “Canonical decomposition of N-way
matrices”. The original INDSCAL program performed both this N-way
analysis and contained as a special case, the 3-way, 2-mode analysis which
became known as the INDSCAL model. These two are now separated, and the 3way 2-mode model is implemented by INDSCAL-S. The CANDECOMP program is
adapted from the original Bell Laboratories(1971) INDSCAL program.
2.1.2 CANDECOMP IN BRIEF
CANDECOMP takes as input a table of data values with between
three and seven "ways". In the solution, each of these ways is
represented by a configuration of points representing the elements of
that particular way in a space of chosen dimensionality. Each data
value is regarded as being the scalar product between the relevant
elements. The program assumes that the data are at the interval
level of measurement.
2.1.3 RELATION OF CANDECOMP TO OTHER NewMDSX PROGRAMS
CANDECOMP may be used to perform individual differences analysis
if there are more than three ways (e.g. if the study involves
replications).
The present program is a modified version of Carroll and Chang's
original INDSCAL program. The so-called INDIFF option in that program
(i.e. the special case when there were three ways and two modes in
the data) became generally known, rather confusingly, as the INDSCAL
model or, simply, "individual differences scaling". This INDIFF option
now forms the INDSCAL-S program in the NewMDSX series, while CANDECOMP
provides the full range of options available in Carroll and Chang's
original program.
2.2.
DESCRIPTION OF INPUT
2.2.1 DATA
There are two basic forms of data input to CANDECOMP, which
we will refer to as being applicable to
and
1.
2.
an "extended INDSCAL" analysis
the CANDECOMP analysis proper.
What we call the 'extended INDSCAL' analysis refers to the case
Where two of the ways of the matrix refer to the same set of objects,
that is, one of the matrices is square and the row- and column-elements
refer to the same set of objects. These objects will be represented
by only one configuration in the output. By contrast all the ways
of the CANDECOMP analysis are regarded as distinct.
2.2.1.1 The extended INDSCAL analysis
Users who wish to analyse three-way, two-mode data are referred
to the INDSCAL-S program.
In an INDSCAL analysis of this sort we have a set of matrices
obtained from a set of subjects. Each matrix is a matrix (dis)similarity
coefficients of some sort between a set of stimuli. There will thus
obviously be as many matrices as there are subjects and each matrix
will have as many rows as there are stimuli. The INDSCAL model analyses
the way in which the subjects differentially perceive the stimuli.
Suppose that we are interested in extending this analysis to take
account of the effect of other factors. We might, for instance, replicate
a study, use different forms of data collection, split subjects into
some rational groupings etc. etc., and wish to use the INDSCAL model
to analyse the effects of these factors by the same model as we used
to investigate the subjects in the original analysis.
If the user is analysing data of this type, then the parameter
SET MATRICES should be given the value 1 in the PARAMETERS command.
This tells the program that two of the ways of the matrix - those
corresponding to the stimuli - are identical and should be set
equal (see 2.2).
The DATA TYPE parameter should also be given a
suitable value. Users should read 2.1.3 for a description of the
use of the SIZES parameter.
2.2.1.2 The CANDECOMP analysis
As we have noted, this 'extended INDSCAL' analysis is a special
case of the general CANDECOMP analysis where two of the ways are
identical. We now consider the general case, where all the ways are
considered distinct. (They need not, of course, actually be distinct
sets of entities, they will merely be regarded as such by the program and
be given a separate set of weights).
Consider the typical case where a set of subjects has given
numerical ratings to a set of stimuli on a number of criteria.
Since the procedure is linear, the use of rankings is not recommended.
The data consist of a set of matrices, one for each criterion, each
of which contains as many rows as there are subjects and as many
columns as there are stimuli. If such a study was replicated after a
period of time, thus forming a fourth way, then the resulting data
constitute another block of such matrices.
The default parameter values allow for this analysis.
2.2.1.3 The presentation of data to CANDECOMP
Data are read by the READ matrix command in free format, or using an
associated INPUT FORMAT specification if preferred. The dimensions of the
input matrix are given to the program by means of the SIZES command which
is peculiar to CANDECOMP. This replaces the N OF SUBJECTS, N OF STIMULI
commands which are not recognised by this program. SIZES takes as operand
up to seven numbers, separated by commas each of which is the number
of objects in one of the ways of the matrix. There are as many
numbers as there are ways in the data.
2.2.1.3.1
The order of the SIZES command
NOTE: The order in which the ways are entered in SIZES is crucial.
The number of columns in the data matrix should be specified as
the third number in the SIZES specification.
The number of rows in the basic matrix should be the second
number on the command.
The number of matrices in the third way is the first number.
The number of elements in the fourth, fifth, sixth and seventh
ways is given by the fourth, fifth, sixth and seventh numbers
respectively.
In the case of the extended INDSCAL analysis, the first and second
ways are identical, thus the second and third numbers in the SIZES
specification must be equal.
2.2.1.3.1.1 Example
suppose we are interested in assessing the sound-quality of
stereo amplifiers*, and that we have ten different makes of equipment.
We gather together say twenty listeners and proceed in the following way.
A tape containing extracts of different types of music and speech is
________________________________________________________________________
*
Thanks are due to S.P. Thomas and Q. Deane of the Consumers Association
for suggesting this application and describing the basic form of the
experiment.
________________________________________________________________________
played to the listeners using each of the amplifiers in turn. Before
each of the amplifiers is used the tape is played through a 'reference'
machine. The listeners are asked to assess each of the sets on, say,
five criteria (e.g. distortion, frequency response and channel separation.)
This assessment is done on a nine-point scale in comparison with
the reference set which is scored as an arbitrary 5, Thus, so far we
have a three-way data matrix, listeners x amplifiers x criteria. Since
it is possible that some of the criteria may be influenced by the
characteristics of, say, the speakers used in the reproduction of the
tape, a further way might be added by playing the tape through each
amplifier, say, four times, each time through a different set of
speakers. Replications in say, three rooms of different acoustic
properties might constitute a fifth way, and if we were foolhardy
and/or rich enough to repeat the whole procedure, without serious
revolt from the listeners, we might add a sixth way. Thus we have 20
listeners, 10 sets, 5 criteria, 4 speakers, 3 rooms and 2 replications.
Arranging the data so that the sets (in which we are primarily
interested form the rows of the matrix (see 2.2 )) our data look like
this.
Each matrix has ten rows and five columns, this being the set of
ratings given to each of the sets on each of the criteria by one of
the listeners and there will be twenty such matrices corresponding to
the twenty listeners. (i.e. (20 x 10) = 200 lines in all, since the
matrices follow each other without break). There will then be another
three such blocks of 200 lines (making four blocks, 800 lines in all)
corresponding to the different speaker types. Each of the three rooms
will have provided 800 lines in this way, making 2400 lines and since
there are two replications there will be in all 4800 lines, each of
five columns in the data matrix. The SIZES specification corresponding to
this matrix would be
SIZES
20, 10, 5, 4, 3, 2
2.2.2. THE MODEL
The CANDECOMP program generates one configuration for each way
of the analysis and the number of points in each configuration will
be the number of elements in the corresponding way of the matrix.
In the extended INDSCAL analysis however (i.e. when SET MATRICES (1))
matrices two and three - those corresponding to the second and third
numbers in SIZES - are set equal when the algorithm has converged.
One more iteration is then performed and only one configuration then
produced for this way of the data (see INDSCAL-S).
The axes of the solution space are identical in each configuration
and the solution should be interpreted in relation to these axes which
it has usually been found, yield readily to substantive interpretation.
Each configuration then reflects the differential importance of the
properties represented by the axes in the following way. Each point
in each configuration is properly considered as the terminus of a
vector drawn from the origin of the space and for each vector the ratio
between its coordinate on axis a and on axis b reflects the differential
importance of the properties represented by those axes in the judgement
of that subject and analysis should focus on this patterning.
All the configuration are normed so that the sum of squares of
the coordinates on each axis is unity except for matrix 1. This means
that strictly speaking the patterning of weights (coordinates) is
comparable across 'ways'. It is not, however, clear how this is to
be interpreted in the general case. The first matrix, being un-normed,
will tend to show greater dispersion among the vectors and it is
recommended that the 'way' in which the user wishes to concentrate forms
the first way of the data. (i.e. the second element in the SIZES
specification).
2.2.2.1. The algorithm
1.
The input data matrices are converted into matrices of scalar
products.
2.
The scalar products between the elements in the input configuration
input by the user or generated by the program are calculated
to serve as initial estimates of the solution.
3.
Each scalar product is assumed to be the result of the vector
multiplication of as many vector coordinates as there are ways
in the data matrix. At each iteration, all but one of these
is held constant while the remaining parameter (coordinate) is
estimated (the alternating strategy, akin to Alternating Least
Squares).
4.
When this process has converged, the two matrices referring to
the symmetric matrix are set equal (if SET MATRICES (1)), the
appropriate normalisation performed (see 2.3.1) and the solution
output.
2.2.3 FURTHER FEATURES
2.2.3.1 Normalisation options
Two different questions of normalisation arise:
input data and over the solution.
2.2.3.1.1
Normalisation of the data input
over the
If the program is being used to perform a higher-way INDSCAL
analysis, then the input matrices are normalised so that the influence
of each subject is equalised in the analysis before the data are
converted to scalar products. When a set of covariances or correlations
are input the program does not convert to scalar products (since both
covariances and correlations are scalar products) and, in the case of
correlations, neither does it normalise. It is therefore important
that data of this type be announced to the program by means of the
relevant DATA TYPE parameter value.
In the case of the general CANDECOMP analysis the data are not
normalised and differences in magnitude between subjects' judgements
will affect the analysis. It is recommended, however, that the data
for a CANDECOMP analysis be centred before the analysis proceeds both
to provide a common origin for the various 'ways' and to eliminate
consensual effects which often overwhelm fine structural detail.
2.2.3.1.2 Normalisation of the solution
Each of the configurations except that referring to the subjects
of the solution is normalised as noted above (2.2).
It is therefore
recommended that the way in which the user wishes more variation to be
concentrated form the first way (rows) of the input matrix.
It should, however, be noted that differences in the magnitude
of scales needed by different subjects will affect the length of the
vectors (the distance of a particular point from the origin) in
this space and it is more than ever important to concentrate on the
ratio between the coordinates on the respective axes.
2.2.3.2 Initial configuration
An initial configuration, which provides the initial estimates
for the iterative procedure, is normally generated by the program from
a pseudo-random distribution. CANDECOMP is prone to suboptimal solutions
and users are recommended to make a number of runs with different starting
configurations. A series of similar (preferably identical) solutions
will usually indicate that a global minimum has been found.
2.2.3.2.1 Initial configuration for the extended INDSCAL option
If the CANDECOMP program is being used to perform the extended
INDSCAL analysis (i.e. SET MATRICES(1)) then the user may choose to
input an initial configuration of the points represented by the symmetric
matrix (the stimulus matrix). This may be an a priori guess at the
solution or the result of a MINISSA analysis in which the averaged
judgements have been analysed. In this case the configuration is
input after the READ CONFIG command. It consists of the coordinates
of the stimulus points in the maximum dimensionality requested. These
are read according to the associated INPUT FORMAT specification, if used.
Otherwise data are assumed to be in free format.
2.2.3.3 External analysis
Users may wish to use CANDECOMP to perform an "external" INDSCAL
analysis by holding constant a known configuration and estimating the
configurations of subjects etc. This may be done only if SET MATRICES(1).
A configuration is input by the user as described above and the FIX
POINTS parameter is set to 1 in the PARAMETERS statement. The program will
then estimate only the remaining matrices.
2.3.
INPUT COMMANDS
Keyword
SIZES
Operand
up to seven numbers,
separated by commas
DIMENSIONS
READ MATRIX
<number>
<number list>
<number> TO <number>
COMPUTE
FINISH
2.3.1
Function
specify the numbers of
objects in each of the
ways of the matrix.There
must be as many numbers as
there are ways in the data.
The number of dimensions to
be listed and plotted in
detail
Start reading input data,
according to DATA TYPE
Start computation
Final statement in the run
LIST OF PARAMETERS
The following values may be set, following the keyword PARAMETERS
Keyword
DATA TYPE
RANDOM
Default
0
12345
SET MATRICES
0
FIX POINTS
0
CRITERION
0.005
CENTRE
0
Function
0: An N-way table is input.
1: Lower triangle similarity matrix.
2: Lower triangle dissimilarity matrix.
3: Lower triangle matrix of distances.
4: Lower triangle correlation matrix.
5: Lower triangle covariance matrix.
6: Full symmetric similarity matrix.
7: Full symmetric dissimilarity matrix.
(Any positive integer) Seed for pseudorandom number generator.
0: The CANDECOMP analysis is performed.
1: The performed extended INDSCAL analysis
is performed (matrix 2 and 3 are set
equal.
0: Iterate and solve for all matrices.
1: One matrix is held constant (external
analysis).
(values between 0 and 1)
Sets improvement level for terminating
iterations.
0: No action.
1: If an N-way table is input
(DATA TYPE (0)) it will be centred by
subtracting the 'row means' in each
of the N-ways (see section 2.3.1).
2.3.2 NOTES
1.
The control statement SIZES is obligatory for CANDECOMP.
(N )
(SUBJECTS)
(# ) OF (
) are not valid with CANDECOMP.
(NO)
(STIMULI )
2.
The commands
3.
When DATA TYPE takes values 1 through 5 no diagonal is input.
For values 6 and 7 the diagonals are input but ignored.
4.
In the parameters SET MATRICES and FIX POINTS the spaces are
significant characters.
5.
Program Limits
Maximum no. of dimensions
Maximum no. of elements per way
Way 1 x Way 2 x Way 3
=
10
= 100
< 1800
The general format for PRINTing, PLOTting and PUNCHing options
is as follows. n denotes the number of ways in the analysis
(3 < n < 7), m the number of modes (2 < m < 7).
2.3.3.1 PRINT options
Option
INITIAL
Form
n matrices
will be listed.
FINAL
m matrices
HISTORY
Description
The initial estimates of the
configurations are listed. Each
matrix contains the coordinates of
the points on the required
dimension.
If the user has input an initial
configuration, then the second two
matrices will be identical.
The solution configurations are
listed. Each matrix contains the
coordinates of the relevant number
of points on the axes of the space.
These are followed by the
correlations between each
subject's data and solution
The matrix of cross-products
between the dimensions is listed.
The overall correlation at each
iteration is listed. The
unnormalised matrices at
convergence are also listed
(there will be n of these).
By default only the FINAL matrices and the overall correlation at
convergence are listed.
2.3.3.2 PLOT options
Option
INITIAL
Description
The initial configuration may be
plotted as r(r-1)/2 plots only if
one has been input by the user.
CORRELATIONS
The overall correlation at each
iteration is plotted in the form
of a histogram.
WAY1
WAY2
WAY3
WAY4
WAY5
WAY6
WAY7
r(r-1)/2 plots are produced for
each way specified.
2.4.
EXAMPLE
RUN NAME
EXAMPLE FROM SEC. 2.1
TASK NAME
LISTENING TESTS AD NAUSEAM
DIMENSIONS
4 TO 2
SIZES
20,10,5,4,3,2
PRINT DATA
YES
READ MATRIX
<all the data follow here>
COMPUTE
PRINT
ALL
FINISH
BIBLIOGRAPHY
Bloxom B. (1965) Individual differences in multidimensional scaling,
Princeton University Educational Testing Service Research Bulletin,
68-45.
Carmone, F.J., P.E. Green and P.J. Robinson (1968) TRICON: an IBM
360/65 program for the triangularisation of conjoint data,
Journal of Marketing Research, 5, 219-20.
Carroll, J.D. (1974) Some methodological advances in INDSCAL, mimeo,
Psychometric Society, Stanford.
Carroll, J.D. and P. Arabie (1979) Multidimensional scaling, in
M.R. Rozenzweig and L.W. Porter (eds.) 1980 Annual Review of
Psychology, pp 607-649, Palo Alto Ca., Annual Reviews.
Carroll, J.D. and J.J. Chang (1970) Analysis of individual differences
in multidimensional scaling via an N-way generalization of 'EckartYoung' decomposition, Psychometrika, 35, 283-319.
Carroll, J.D. and M. Wish (1974) Multidimensional perceptual models and
measurement methods, in E.C. Carterette and M.P. Friedman
Handbook of Perception, Vol.2, New York: Academic Press (Ch. 5
Individual differences in perception).
Carroll, J.D. and M. Wish (1975) Models and methods for three way
multidimensional scaling, in R.C. Atkinson, D.H. Krantz, R.D. Luce
and P Suppes (eds.), Contemporary Methods in Mathematical Psychology,
San Francisco: Freeman.
Coxon, A.P.M. and C.L. Jones (1974) Applications of multidimensional
scaling techniques in the analysis of survey data, in C.J. Payne
and C.O'Muircheartaigh, Survey Analysis, London: Wiley.
Gower, J.C. (
) The analysis of three-way grids, in P. Slater (ed.)
Dimensions of Intrapersonal Space (Vol.2), London: Wiley.
Horan, C.B. (1969) Multidimensional scaling: combining observations when
individuals have different perceptual structure, Psychometrika, 34,
2, pt.1, 139-165.
Jackson, D.N. and S.J. Messick (1963) Individual differences in social
perception, British Journal of Social Clinical Psychology, 2, 1-10.
Kruskal, J.B. (1972) A brief description of the 'classical' method of
multidimensional scaling, Bell Telephone Laboratories, mimeo.
Tagg, S.K. (1979) The analysis of repertory grids using MDS(X),
MDS(X) Project working paper.
Torgerson, W.S. (1958)
Theory and methods of scaling, New York: Wiley.
Tucker, L.R. (1960) Intra-individual and inter-individual
multidimensionality, in H. Gulliksen and S. Messick (eds.),
Psychological scaling: Theory and applications, New York: Wiley.
Wish, M. and J.D. Carroll (1974) Applications of individual differences
scaling to studies of human perception and judgment, in
Carterette and Friedman (1974): see Carroll and Wish 1974 above.
Wold, H. (1966) Estimation of principal components and related models
by iterative least squares, in P. Krishnaiah (ed.), International
Symposium on multivariate analysis, New York: Academic Press.
Tucker, L.R. (1972). Relations between multidimensional scaling and threemode factor analysis. Psychometrika, 37, 3-27.
Harshman, R.A., & Lundy, M.E. (1984a). The PARAFAC model for three-way
factor analysis and multidimensional scaling. In H.G. Law, C.W. Snyder
Jr., J.A.Hattie, and R.P. McDonald (Eds.), Research methods for
multimode data analysis (pp. 122-215). New York: Praeger.
APPENDIX
No other known programs perform the CANDECOMP type of analysis,
though it is akin to both the PARAFAC model and Tucker’s 3-mode Factor
Analysis. See also P.M.Kroonenberg’s three-mode web site at
http://www.leidenuniv.nl/fsw/three-mode/index.html.
3.
CONJOINT (unidimensional CONJOINT measurement)
Concisely:
CONJOINT (unidimensional CONJOINT measurement) analyses
DATA: data in the form of a rectangular N-way array of integers
TRANSFORM: using a monotonic transformation of the data
MODEL: by means of any of a family of simple composition functions
Being a conjoint measurement model, CONJOINT is not easily or
helpfully described in terms of the Carroll and Arabie classification.
3.1.1 ORIGIN, VERSIONS AND ACRONYMS OF CONJOINT
CONJOINT is a product of the Nijmegen stable (Roskam 1974), previously
known as UNICON (Unidimensional Conjoint Analysis), and is a general
version of the earlier ADDIT program, which in turn developed from the
Guttman-Lingoes CM (for conjoint measurement) programs (see Lingoes, 1967,
1968; also Lingoes, 1978).
3.1.2 BRIEF DESCRIPTION OF CONJOINT
The CONJOINT program provides the common analysis which takes a
dependent variable and a set of independent variables and then estimates
for a given simple composition function, that monotone transformation
which will best fit that function. By a 'simple composition function'
we mean an expression linking the independent variables by means of the
operators +, - and x.
The most common application of CONJOINT is to use the additive ( + ) model,
when the model becomes identical to Kruskal’s MONANOVA (Monotonic Analysis
of Variance) <ref>. Several applications have shown that by employing a
monotonic transformation, interactions shown by the linear ANOVA model can
be eliminated and hence shown to be artefacts of the level of measurement
chosen.
The program implements the conjoint measurement models developed by Luce
and others <Krantz et al 1971 & other refs> as a form of fundamental
measurement.
3.1.3 RELATION TO OTHER NewMDSX PROCEDURES
CONJOINT, like HICLUS (q.v) is unusual in the NewMDSX series in that
it does not seek representation of the data in terms of distance, but
rather seeks that monotone transformation of the data which best accords
with the form of the model specified.Moreover, it is inherently uni-variate
in the sense that each way is represented as a unidimensional variable.
3.2.
DESCRIPTION OF THE PROGRAM
3.2.1 DATA
The user must supply two things for a run of CONJOINT:
i)
ii)
the data
the form of the composition model
and the program then estimates the best fit to the model by monotonically
transforming the data.
The data are presented to the program as a rectangular N-way
array of integers, whose "facets" or "ways" (these terms are used
interchangeably) will be the number of categories contained in each of
the variables.
3.2.1.1 Example
Suppose a researcher is investigating the determinants of support
for the Official Irish Republican Army, (measured, say, in terms of
a Likert rating scale), and also has information on the gender, Left-Right
political allegiance, and religious affiliation of his subjects:
Let
Q
represent the dependent variable
and
A ⎫
│
B │
│
C ⌡
represent the independent
variables (or "facets")
(in this case, Attitude to
the Official IRA)
⌠ Sex
=
│
│ Politics =
│
│ Religion =
⎩
{Male, Female}
{Left, Centre, Right}
{Catholic, Anglican,
Protestant, Other}
In this case the data for input to CONJOINT will consist of a
3-way ("cube") of data whose characteristic entry δjkl gives the
average attitude scale value for the subjects who are in the jth category
of Sex, the kth category of Politics and the lth category of Religion:
e.g
δ
111
contains the average attitude score for those who are
Male (j = 1),
Left (k = 1)
and Catholic ( l = 1)
The cube will consist of four matrices, (one for each denomination)
each with three rows and two columns (NB. not two rows and three columns),
corresponding to the facets of religion, politics and sex respectively.
(For details of input format see Section 3.3.2).
3.2.1.2 The form of the composition function
The user is also asked to supply the form of the composition
function postulated to underlie the data. In the case of the above
example, an additive composition function might be chosen, where
dependent score (Attitude to the IRA) is considered to be a monotonically
rescaled, additive composition of the three facets of Sex, Politics and
Religion, i.e:
q
jkl
≈
Here
function.
≈
m(a + b + c )
j
k
l
stands for a least-squares fit and 'm' is a monotone
Any more complex model which can be expressed by means of a
combination of addition, subtraction and multiplication of the facets
is acceptable to the program. Bracketing is allowed subject to the
restriction that a multiplication may not be followed directly by a
left parenthesis. (This problem may usually be overcome by permuting
the facets).
3.2.1.2.1 The input of composition functions
The user must specify two things:
i)
ii)
the form of the model
the number of categories in the facets
3.2.1.2.1.1 The coding of models
CONJOINT makes use of a control statement peculiar to it for the
coding of the model. The command is MODEL and it contains in the
parameter field a specification in ordinary notation of the model to
be fitted. For example, for the study with three facets mentioned
above, we might use the simple additive model. In this case the
command would be
MODEL
A + B + C
Spaces in the parameter field are not significant, and no INPUT
FORMAT is required. It may be the case that one facet is a subset
of another (or indeed may be identical). In this case the name of
the first facet can be repeated. Thus for a study for three facets when
the third is a subset of the second and the model is multiplicative, then
MODEL
A * B * B
Note that the asterisk (*) is used to denote multiplication when
encoding a model.
3.2.1.2.1.2 The coding of categories
The numbers of categories in each of the facets (and thus the
dimensions of the input array) are given by the parameter A-FACET,
B-FACET, C-FACET, D-FACET and E-FACET in the PARAMETERS command. No
more than five facets are allowed. The argument to each of these
parameters is the number of categories in each of the facets, thus
in our example (2.1.1) above:
PARAMETERS
A-FACET(2), B-FACET(3), C-FACET(4)
Note that the hyphen is a significant character and the shortening
of B-FACET to its significant length.
If sub-setting is involved, then A-FACET refers to the first facet,
B-FACET to the second etc., regardless of the actual names given in the
MODEL specification.
For example, consider the example given above where
MODEL
A * B * B
where the third facet is a subset of B, and suppose further that A
consists of three categories, B of ten and the 'subset' is a recoding
of the ten categories into two.
The PARAMETERS command in this case would then be
PARAMETERS
3.2.2
A-FACET(2), B-FACET(10), C-FACET(2)
THE MODEL
The program finds that monotone transformation of the data (δ)
which is as close as possible (in a least squares sense) to a set of
values (d) which conform to the requirements of the composition function
specified. This is analogous in the basic model of MDS to the set
of fitting values which approximate the actual distances in the solution
space.
3.2.2.1
The Algorithm
1.
A set of initial estimates of the independent variables is
generated by a pseudo-random number device.
2.
These are combined in the manner specified by the MODEL
statement.
3.
Fitting values are calculated.
4.
The measure of departure in the trial solution from
monotonicity (STRESS) is calculated.
5.
A number of tests are performed: e.g.
Is the STRESS sufficiently low ?
Has the improvement in STRESS in the last
iteration been so small as to be not
worth proceeding ?
Has a maximum number of iterations been
performed ?
If the answer to any of these is YES, then the current estimates
are output as solution.
6.
The direction in which each value has to be moved to bring it
into closer accordance with the fitting values and the
approximate magnitude of the move are calculated.
7.
The values are moved in accordance with the information
calculated in 6 and the program returns to step 2.
3.2.3
FURTHER OPTIONS
3.2.3.1 Missing data
The program allows the user to specify, by means of the MISSING
DATA parameter a code which instructs the program to ignore that entry
in its calculation of STRESS. This may also help the user in coding
of fractional replications (v.i.).
3.2.3.2 Ties in the data
Two ways of treating tied data values are recognised in the
CONJOINT program: the so-called primary and secondary approaches.
user is given the option by means of the TIES parameter in the
PARAMETERS command.
The
3.2.3.2.1 The primary approach (TIES(1))
In the primary approach, ties in the data are broken in the
fitting values, if, in so doing, STRESS is made less. This option
places little or no importance on the appearance of ties.
3.2.3.2.2 The secondary approach (TIES(2))
By contrast, the secondary approach regards the information on
ties as important and requires that tied data values are fit by
equal fitting values.
3.2.3.3 Levels of measurement in the data
CONJOINT treats each facet as being a nominal scale, and estimates
an interval level weight for each category of each facet. If the
categories happen to be ordered (say, High, Medium and Low Status)
there is nothing in the procedure which will guarantee the category
weights will be similarly ordered.
3.2.3.4
Replications
Users may wish to analyse by the same model a number of
replications of the same study. Such a study is signalled to the
program by means of the REPLICATIONS parameter. This parameter sets
the number of sets of data not the number of replications, i.e. if
you have an original study and two follow-ups then the correct coding
is REPLICATIONS (3).
If a replicatory study provides data on only a subset of the
original variables, then it is suggested that the study be coded as a
replication with MISSING DATA values inserted at the appropriate places
in the data matrix.
In the case of replica studies the program will obviously estimate
only one set of averaged fitting values but as many sets of distinct
fitting values as there are data sets.
3.2.3.5 The CRITERION parameter
At step 5 of the algorithm the program calculates the improvement
in STRESS between the values of this iteration and those at the previous
one. If this improvement is less than the value specified on the CRITERION
parameter then the process is stopped and the current values output as
solution.
It is recommended that in exploratory studies or when a number of
models is being tested on a set of data that this value be increased in
order to save on machine time.
3.2.3.6 Local minima
The program begins the iterative process by assigning to each of the
parameters a randomly-generated value. The starting 'seed' for the
random number generator is specified as RANDOM in the PARAMETERS command.
The values so produced are statistically random, in the sense that each
value has a known and equal probability of occurrence. They are not,
however, random inasmuch as the same series of numbers will emerge
from the same starting value.
The procedure minimises STRESS by manipulating these initial,
pseudo-random numbers. It has been noted (Roskam, 1969) that random
starts are prone to the problem of local minima. A local minimum
occurs when, although in the 'local' environment STRESS is at a
minimum, inasmuch as to change any of the values only slightly, would
be to increase its value, there nevertheless exists a set of numbers
outside of that 'local environment' which generate a lower 'globally'
minimum STRESS value.
It is suggested that the user make a number of runs using the
same data but using different starting values. This is done automatically
within one run of CONJOINT by means of the keyword RESTARTS in the
PARAMETERS command. The number specified by this parameter should be the
number of different starts required.
The appearance of a number of highly similar (or identical) solutions
is inductive proof of a global minimum.
3.3.
INPUT COMMANDS
Keyword
MODEL
letters for each
facet in the data
with operators +
or *
READ MATRIX
Function
specifies the form of the composition
function postulated to underly the data.
See the detailed description above.
read the data according to the facets
specified
start computation
final statement in the run
COMPUTE
FINISH
3.3.1
LIST OF PARAMETERS
The following values may be specified following the keyword PARAMETERS
Keyword
TIES
Default Value
1
REPLICATIONS
RANDOM
1
12345
MISSING
0
RESTARTS
1
A-FACET
B-FACET
C-FACET
D-FACET
E-FACET
CRITERION
1
0.00001
Function
1: Primary approach
2: Secondary approach
Sets number of data-sets for
replicated studies.
Seed for pseudo-random-number
generator
Sets value to be regarded as missing
datum.
Sets number of times the program
will restart analysis using different
random starts.
Sets the number of categories in
each facet.
Sets stopping value for stress.
3.3.2 NOTES
1.
The control statement MODEL is obligatory for CONJOINT.
2.
The following commands are not valid:
READ CONFIG
LABELS
ITERATIONS
# ⎫
N ⎬ OF STIMULI
No ⎭
# ⎫
N ⎬ OF SUBJECTS
No ⎭
3.
4.
The program accepts as input integer (I-type) variables. An
INPUT FORMAT specification, if used, should take account of this
and should read one row of the data.
The data for CONJOINT are input as a rectangular array of
integers in which the first facet is that associated with
the fastest-running subscript. Consider first the two-facet
case. If facet A has 5 categories and facet B has three
then the input array will have five columns and three rows.
(NOT five rows and three columns). If a third facet C were
added, which had two categories, then two such 3 x 5 arrays
would be input (six rows in all, each of five columns).
A fourth facet with four categories would result in four
such blocks, i.e. twenty four rows in all. The data follow
without separation.
3.3.3
PRINT, PLOT AND PUNCH OPTIONS
The general format for PRINTing, PLOTting and PUNCHing output
is described in the Overview. In the case of CONJOINT the options are
as follows:
3.3.3.1
Option
TABLES
PRINT options
HISTORY
SOLUTION
Description
Two matrices are listed:
1. the matrix of fitting-values
2. the solution matrix.
Both will, of course, be of the same
order as the input data.
An extended history of the iterative
process. For details see Appendix 3.
By default, only the SOLUTION will be listed, along with the
final STRESS value.
14.3.3.2
Option
STRESS
PLOT options
SHEPARD
RESIDUALS
Description
A Histogram of STRESS at each iteration
is produced.
A Shepard diagram plotting data against
solution is plotted and the fitting
values indicated.
A histogram of residual values with
both natural and logarithmic values
is produced.
A Shepard diagram is produced by default.
3.3.3.3
Option
SPSS
PUNCH options
FINAL
STRESS
Description
The following values are output.
I, J, K, L, M (being indices of the
five possible facets) DATA, FITTING,
SOLUTION, RESIDUALS, being the
corresponding values in a fixed format.
The solution is saved.
A listing of STRESS values at each
iteration is produced in a fixed format.
By default, no secondary output is produced.
3.3.4 PROGRAM
Maximum number
Maximum number
Maximum(number
Maximum number
3.4.
LIMITS
of facets = 5.
of categories = not specified.
of elements x number of replications)
of scale values = 500.
=
2500
EXAMPLE
RUN NAME
TASK NAME
COMMENT
INPUT FORMAT
PRINT DATA
MODEL
PARAMETERS
PRINT
PLOT
READ MATRIX
1.74 1.79 1.96 2.00
FERTILITY BY PRESENT HUSBAND'S ORIGIN & STATUS
* * * TWO WAYS DISTINCT * * *
DATA FROM HOPE 1972, TABLE 1.
(4I5)
YES
A + B
A-FACET(4), B-FACET(4), CRIT(0.005), TIES(2)
HISTORY
SHEPARD, RESIDUALS
2.05 2.14 2.51 2.97
1.87 2.01 2.67 3.69
2.40 3.20 3.22 3.68
COMPUTE
FINISH
BIBLIOGRAPHY
Adams, E., R.F. Fagot and R.F. Robinson (1970) On the empirical status
of axioms in theories of fundamental measurement, Journal of
Mathematical Psychology, 7, 379.410.
Carmone, F.J., P.E. Green and P.J. Robinson (1968) Tricon - an IBM-360/65
Fortran-IV program for the triangularization of conjoint data,
Journal of Market Research, 5, 219-220.
Krantz, D.A., R.D. Luce and A. Tversky (1971) Foundations of measurement
Vol.l: Additive and polynomial representations, New York: Academic
Press.
Kruskal, J.B. (1964) Multidimensional scaling by optimizing goodness of
fit to a non-metric hypothesis, Psychometrika, 29, 1-29.
Lingoes, J.C. (1967) (1968) IBM-7090 program for Guttman-Lingoes
conjoint measurement (I,II,III), Behavioral Science, 12, 501-502
(1967); 13, 85-87 and 421-423 (1968).
Lingoes, J.C. (1973) The Guttman-Lingoes non-metric program series,
Ann Arbor, Michigan: Mathesis Press.
Luce, R.D., and J.W. Tukey (1964) Simultaneous conjoint measurement:
a new type of fundamental measurement, Journal of Mathematical
Psychology, 1, 1.27.
Roskam, E.E. (1974) Unidimensional conjoint measurement (CONJOINT) for
multi-faceted designs, Psychologish Laboratorium, Universiteit
Nijmegen.
Tversky, A. (1967) General theory of polynomial conjoint measurement,
journal of Mathematical Psychology, 4,(1), 1-20.
Tversky, A., and A. Zivian (1966) A computer program for additive
analysis, Behavioral Science, 78, 238-250.
APPENDIX 1: RELATION OF CONJOINT TO OTHER PROGRAMS NOT IN NewMDSX
The additive option in CONJOINT is exactly analogous to the
ADDIT program which in turn derives from the MONANOVA (monotonic
analysis of variance) procedure of Kruskal (see above).
APPENDIX 2: OUTPUT FROM CONJOINT
The output of CONJOINT consists of two parts: each part is
preceded by a program identification heading, and printing of the
problem TITLE and the measurement MODEL as it was specified by the
user at input.
The first part of the output, consists of a summary or extensive
history of the iterations, depending upon the PRINT option chosen.
The second part of the output contains the scaling solution,
^
the values of z
and the values of z
jk ..
jk ...
1.
Following the printing of the problem TITLE, the MODEL is printed
in the form of a sequence A B C D E referring to the facets of the
design, each letter preceded by the algebraic operation. For instance,
when the model is z
= (a - b ) x c
and the facets are defined
jk
j
k
as being different from each other, the program will print:
MODEL
( +A - B ) x C
2.
Next, the program will print which facets are identical, if any.
For instance, when z
= a b + a , the program will print:
jk
j
k
MODEL
( +A ) x
B - C
C = A
Note the introduction of parenthesis and of + r symbol, which is redundant
in this example.
3.
After this, the program will write the scaling SOLUTION with the
following form:
S O L U T I O N
A
a
a
a
a
a
a
a
a
a
a
a
a
a
etc.
1
2
3
4
5
6
7
8
9
10 11 12 13
B
b
1
b
2
b
3
C
c
1
c
2
c
3
etc.
etc.
b
4
b
5
b
6
b
7
b
8
b
9
b
10
etc.
etc
Note that identical values will be printed when facets are identical.
So, if for instance, facets B and A are the same, the program will
write B followed by the same values as it printed with A.
4.
Next, the program prints a table of ZHAT values.
^
(z
) match the values
jk ..(h)
These values
z
= f(a ,b ,c ,..) in the least
jk ..
j k
squares sense and are weakly monotonic with the data.
Each entry in this table consists of
x
j k
....
^
z
jk ..(h)
where x is a consecutive number, indexing the elements in this table,
and j,k, ,.. refer to the levels or categories of the facets A,B,C,..
The entries in this table appear in the order of replications, that is:
^
^
first appear z
lk ..(1)
..(2)'
etc.
(j=1,..., k=1,....;
=1,...; etc) then all z
jk
Within each replication, the entries appear in increasing order of r
jk
..(h)'
^
which is also the non-decreasing order of z
jk ...(h)
Missing data are omitted in this table' So, x runs up to the total number
of elements actually present in the data. (Since this table is ordered
according to the ordinal information in the data, the user can also use it
to check for any errors in his input).
Following this table, the program prints the numbers of distinct values
in the data, the number of distinct values in ZHAT ( =
the number of distinct values in Z (=
z
).
jk ..(h)
^
z
) and
jk ...(h)
This count goes
through all replications, bypassing missing data elements. Ideally,
there should be no ties in Z; when there are, this means degeneracy of
the solution (except in those cases where the model calls for equal
values, e.g. z
= z
= a + a ); in other words, the number of distinct
jk
kj
j
k
values in Z should be equal to the number of elements in Q=AxBxCx..
(except of course when some elements from Q are absent in all
replications).
When the secondary approach to ties is used, tied data will be tied in
ZHAT, and should be also in Z if the stress is low. In general, the
number of distinct elements in ZHAT wiil be less than the number of
distinct elements in the data, and the more so when the stress is high.
In the output, the number of distinct elements is labelled: NUMBER OF
EQUIVALENCE CLASSES.
5.
Finally, the program prints a matrix of Z. Unlike the table of
ZHAT, whose entries are different for each replication, the elements
in Z are the same for all replications, and the matrix of Z is of
course printed only once. The order in which the elements of Z are
printed is the same as the input order of the data.
The category labels A1, A2, A3, etc. are printed at the top line.
At the right of each line, the pertinent indices of other facets are
printed, headed by 'B', 'C' etc. at the top line.
For instance:
A1
A2
A3
B
C
z
z
z
1
1
111
211
311
z
z
z
2
1
121
221
321
z
z
z
1
2
112
212
312
z
z
z
2
2
122
222
322
6.
Output items 1 through 5 are repeated for every problem submitted
to the program.
4.
CORRESP (CORRESPondence analysis)
4.1.
OVERVIEW
Concisely: CORRESP provides internal analysis of two-way or multi-way data
of a variety of kinds, and represents them as two sets of “points” (“row”
points and “column points”) in the same space. It can be classified as
follows:
DATA: N-way, n-mode Table
TRANSFORMATION: Linear
MODEL: Chi-square distance
Simple correspondence analysis has typically been applied to represent
row and column categories of a two-way contingency table in a two
dimensional map. But the same procedure can be applied, at least
descriptively, to any matrix which can plausibly be regarded as consisting
of 'pseudo-frequencies'.
It can also be applied descriptively to non-frequency data such as
rankings or profiles, or data representing the intensity of responses to
stimuli, or any of a variety of indices of proximity.
4.1.1
ORIGINS, VERSIONS AND ACRONYMS
Correspondence analysis is a translation of the French ‘analyse des
correspondances’, developed by Benzécri et al.(1973) and made popular by
its adoption by Pierre Bourdieu in Distinction (1979). It was then by no
means a new technique, having been described and differently named and
applied in a number of unrelated fields, since Hirschfield(1935). It is
closely related to canonical correlation and discriminant analysis and has
been called, among other names, the method of reciprocal averages, and dual
scaling, as well as l’analyse factorielle des correspondances.
Correspondence analysis is also one way of implementing unfolding as
introduced by Coombs(1964). Not only have different names been used for the
same techniques in different fields. It is also not always realized that
different computational procedures lead to the same results. Developed by
the Gifi group in the Department of Data Theory at the University of Leiden
for use with relatively large and sparse matrices representing multi-way
categorical data, the HOMALS procedure (Analysis of homogeneity by
alternating least squares) available with SPSS uses an iterative procedure
to achieve the equivalent of multiple correspondence analysis. (see Van de
Geer (1993) Vol.2, Ch.2). CORRESP directly calculates the singular value
decomposition by finding the eigenvalues and eigenvectors of the matrix of
cross-products of the input data matrix, after it has been normalized by
dividing each row entry by the square root of the product of the
corresponding row and column totals. In this it is markedly similar to
PRINCOMP, and especially to MDPREF and differs from the latter only in the
pre-treatment of the data and the form of normalisation (See, in
particular, Weller and Romney(1990)).
The first paper containing a fully worked-out numerical example
corresponding to current definitions is by R.A.Fisher(1940). Canonical
analysis in its classical form is traced to two articles by Hotelling
(1935, 1936) using Lagrange multipliers and eigen-analysis. Psychological
literature most frequently refers to the “Eckart-Young decomposition
theorem”, from an early paper (1936) that clarified how a matrix could be
decomposed into its basic structure of rows and columns.
4.1.2
FURTHER SPECIFICATION
The CORRESP program provides internal analysis of categorical data
which can be input as a series of rows, representing individual subjects or
observations with their values according to a series of column categories.
The classical application is to a two-way, 2-mode contingency table,
where the frequencies represent the numbers of observations classified
according to two sets of categories. In this case, and where data can
properly regarded as frequencies of a similar kind (and expected
frequencies are not too small) it is possible to apply the chi-squared
statistic to test the significance of the canonical dimensions extracted.
Application to other kinds of data can be only descriptive and exploratory.
Input of multi-way indicator matrices, or Burt matrices (obtained by
multiplying an indicator matrix by its transpose) is one form of multiple
correspondence analysis, as is Guttman scaling. Stacking of a series of
two-way tables is another. See the Appendix, below, for further details.
Correspondence analysis is increasingly popular in analyzing
Contingency Tables and in exploring the relationships between frequencies
of artefacts found at different archaeological sites or levels of
excavation ('seriation'), and of animals or plants and habitats ('gradient
analysis').
4.1.3 RELATION OF CORRESP TO OTHER PROCEDURES IN NewMDSX
CORRESP uses a direct singular value decomposition of pre-standardized
data to produce canonical scores for rows and columns which can be plotted
as points in the same space. MDPREF also represents row and column
variables in the same space, but instead fits the row variables as vectors
to the configuration derived from the column variables. For this reason,
MDPREF is sometimes referred to as a "vector" model and CORRESP as a
"point" model. CORRESP examines only interactive factors by neglecting the
magnitude effect after decomposition, but so can MDPREF when treating data
as row-conditional. The main reason for MDPREF projecting one set of points
onto a unit circle/sphere, however, is to remove them from the location of
the set; to facilitate projection interpretation and to discourage interset point distance interpretation, which is otherwise tempting when using
correspondence analysis.
If separate PRINcipal COMPonents analyses are performed on the row and
column correlation matrices of data which have also been standardized by
rows and columns, these produce equivalent sets of results.
If the preference data are expressed as quasi-frequencies that may be
seen as the quantity of choice received by each column item, MDPREF for
column standardized and double-centred data provides similar results to
those obtained by CORRESP and PRINCOMP.
4.2.
DESCRIPTION
4.2.1 INPUT DATA
CORRESP accepts as input data a set of frequencies forming a
rectangular matrix. This can be a simple two-way contingency table of
categorical data, or more generally an indicator matrix of rows
representing subjects and columns representing presence and absence of a
series of binary attributes for each subject. The indicator matrix can be
condensed by adding together identical rows, and will produce the same
scores for equivalent data.
When using correspondence analysis descriptively for data other than
strict frequencies, there are five restrictions to be observed. For some,
CORRESP will report an error if they are violated; for others, it is up to
the user to examine the data to avoid misinterpretation.
1. Inferential tests such as Chi-square are not valid for non-frequencies
(or when expected frequencies are too small).
2. The data must be in the form of 'similarities', i.e. if they are ranks,
they should be ordered from highest to lowest preference (compare DATA
TYPE(4)for MDPREF). If the data are distances, they should be reflected by
subtraction from a number larger than the largest distance, so that they
can be regarded as similarities.
3. When analysing symmetric square matrices, it is essential that the
diagonal from top left to bottom right contain large positive values (see
the Appendix below for an example using stacked matrices.
4. All values in the matrix must be positive, or the results will not be
valid.
5. In the analysis of sparse matrices, consider the possibility that the
data may contain disjoint sets, which should be separated prior to
analysis. It may also be necessary to submit the data to a succession of
analyses, if interpretation is hindered by the presence of obvious
outliers, which should be removed before contining. When deleting outliers,
it is important to remember this may require deletion of both rows and
columns, according to the type of matrix.
4.2.2 THE MODEL
4.2.2.1
Description of the Algorithm
1. The input matrix is first normalized by dividing each row entry by the
square root of the product of the corresponding row and column totals.
2. The cross-products matrix of the columns of the resulting matrix A is
formed.
3. The next step finds the basic structure of A, producing summary row and
column vectors (U and V) and a diagonal matrix of singular values d
corresponding to the columns of A, so that A = Ud(VT). The matrices U and V
are the eigenvectors of the matrices of column (or row) cross-products of
A, and the d values are related to the corresponding eigenvalues
(d=sqrt(D*(n-1)), where D is the diagonal of eigenvalues and n is the
number of rows in A).
4. The canonical or ‘optimal’ scores are calculated for the number of
dimensions requested. These form the configuration output and plotted as
the solution.
4.2.2.2
Interpretation of the solution
The default CORRESP output indicates the number of non-negative
eigenvalues of the matrix of cross-products of the normalized input matrix.
This indicates the rank of the matrix, irrespective of the number of
dimensions the user has requested to be output. They may be inspected in
full by including the PRINT option ROOTS. The largest root will always be
first and the others will follow in decreasing order. Some may be very
small. An appropriate dimensionality may be chosen by means of the familiar
scree-test.
The basic structure (singular value decomposition) of the matrix is
always listed in full. The singular value (otherwise known as latent or
characteristic root or eigenvalue) corresponding to the first, or ‘trivial’
dimension is always 1.0 and is disregarded, while the remainder are termed
the ‘inertia’. Their relative magnitude gives an indication of the amount
of variation in the data accounted for by the corresponding dimension.
Where appropriate, reference can be made to the chi-squared contributions
of each dimension of ‘inertia’ and to the overall chi-squared value for the
analysis.
To assist interpretation of the dimensions, the contributions of the
individual row and column points to ‘inertia’ are listed, followed by the
corresponding canonical, or ‘optimal’, scores, which are conventionally
plotted in reporting the results of correspondence analysis. In the graphic
displays of these results, note that an additional menu item Vectors
enables you optionally to represent the rows of the table as vectors, if
preferred.
The identification of 'outliers' amongst the subjects by visual
inspection is straightforward. It may help to clarify the plotted solution
if these are removed, before repeated the analysis. Note that in removing
an outlier, it is necessary to delete both the row and column of the input
indicator matrix.
4.3.
INPUT COMMANDS
CORRESP requires an input matrix of r rows and c
be equal to c. The optional LABELS command allows the
categories to be identified as appropriate; the first
input values appear in the graphic plots which can be
for Windows.
columns, where r may
column and row
6 characters of these
requested in NewMDSX
The DIMENSIONS command is used here only to limit the number of
dimensions for which details are listed in the output. There is no
PARAMETERS instruction for CORRESP.
Keyword
Function
N OF COLUMNS
c
N OF ROWS
r
DIMENSIONS
n
LABELS
followed by a series
of labels (<= 65 char)
each on a separate line
READ MATRIX
COMPUTE
FINISH
4.3.1 NOTES
1. N OF COLUMNS,
N OF ROWS and
DIMENSIONS are obligatory.
Number of columns in
the input matrix
Number of rows in the
input matrix
Number of dimensions to
list and plot in detail.
Identify the column and
labels, in order, from
right to left and top down.
Start reading input data
Start computation
Final statement in the run
2. READ CONFIG is not valid with CORRESP.
3. LABELS are optional.
4.3.2 PRINT, PLOT AND PUNCH OPTIONS
The general format for PRINTing, PLOTting and PUNCHing output
is described in the Overview. In the case of CORRESP, the options are as
follows:
4.3.2.1 PRINT options
Option
Form
FIRST
r x c
CROSS-PRODUCTS
r x r,
c x c
CORRELATIONS
r x r,
c x c
ROOTS
FINAL
CHISQUARE
Description
The input matrix, rows by columns
Cross-products of the rows and columns
of the normalized input matrix.
The correlation matrices of rows and
columns of the normalized input matrix.
The eigenvalues of the cross-products of
the normalized input matrix.
All of the output described above, in
the chosen dimensionality.
The total chisquared value, with degrees
of freedom, and the contributions of
the individual factors of "inertia".
By default the FINAL output is produced.
4.3.2.2 PLOT options
Option
ROWS
COLUMNS
JOINT
ROOTS
Description
The n(n-1)/2 plots of the canonical
("optimal") row scores in the chosen
dimensionality.
The n(n-1)/2 plots of the canonical
("optimal") column scores in the chosen
dimensionality.
Both the above.
A scree diagram of the latent roots.
By default, the first two dimensions of the joint space only are plotted.
4.3.2.3 PUNCH options
(to secondary output file)
No secondary output file is produced by CORRESP
4.3.3 PROGRAM LIMITS
Maximum no. of rows
Maximum no. of columns
4.4.
4.4.1
=
=
100
60
EXAMPLES
EXAMPLE OF A SIMPLE RUN
RUN NAME
COMMENT
CORRESPONDENCE ANALYSIS EXAMPLE - Weller & Romney(1990) p.60
1660 subjects are classified by parental socio-economic
status (columns) and categories of mental health (rows).
Data from Srole et al. (1962).
N OF COLUMNS
4
N OF ROWS
3
LABELS
A+B
C+D
E
F
WELL
MILD+MODERATE
IMPAIRED
PRINT FIRST FINAL CHISQ
DIMENSIONS
2
READ MATRIX
121 129 36 21
300 388 151 125
86 154 78 71
COMPUTE
FINISH
......
produces the following output
NORMALIZED INPUT MATRIX (A)
ROWS
COLUMNS
1
2
1
0.3067
0.2842
2
0.4291
0.4824
3
0.1937
0.3014
3
0.1262
0.2988
0.2429
4
0.0814
0.2733
0.2444
THE CROSS-PRODUCTS MATRIX HAS 3 EIGENVALUES GREATER THAN ZERO
CORRESPONDENCE ANALYSIS EXAMPLE - WELLER & ROMNEY(1990) P.60
TASK NUMBER 1
ROOTS OF THE CROSS-PRODUCTS MATRIX
**** SOLUTION IN 2 DIMENSIONS ****
EXPLAINED VARIANCE = 100.00%
BASIC STRUCTURE (SINGULAR VALUE DECOMPOSITION)
ROW VECTORS (U MATRIX)
1
2
1
0.4300
-0.7017
2
0.7621
-0.0552
3
0.4841
0.7103
3
-0.5680
0.6452
-0.5110
COLUMN VECTORS (V MATRIX)
1
2
1
0.5526
-0.6378
2
0.6358
-0.0754
3
0.3995
0.4247
4
0.3616
0.6381
3
0.4449
-0.5119
-0.3735
0.6329
SINGULAR VALUES - DIMENSIONS
0
1
1.0000
0.1589
2
0.0083
PROPORTION OF TOTAL VARIANCE
0.9753
0.0246
0.0001
TOTAL
1.0000
EXPLAINED "INERTIA"
0.9973
0.0027
TOTAL
1.0000
CHI-SQUARED
41.9222
0.1136
CONTRIBUTIONS
TOTAL CHI-SQUARED=
42.0358 (DF= 6)
CANONICAL ("OPTIMAL") SCORES
ROWS
DIMENSIONS
1
2
1 WELL
2
3
-1.6317
-1.3209
MILD+MODERATE
-0.0725
0.8466
IMPAIRED
1.4674
-1.0556
CANONICAL ("OPTIMAL") SCORES
COLUMNS
DIMENSIONS
1
2
1 A+B
-1.1541
0.8050
2 C+D
-0.1185
-0.8052
3 E
1.0631
-0.9347
4 F
1.7647
1.7504
The canonical scores are plotted as follows, showing the relationship
between patients‘ parents‘ social class categories and diagonses of the
severity of mental illness:
4.4.2 EXAMPLE 2 : REACTIONS TO STIMULI
RUN NAME Marks's receptor cone colour sensitivity data
COMMENT CA analysis, as discussed in Weller & Romney, Metric
Scaling, pp.9ff. The values
light absorbed by each type
Rows are eye receptor cones
columns are light stimuli.
LABELS Green
Yellow
Red
Blue-I
Bl-Gr
Blue
Green
Orange
Violet
N OF ROWS
11
N OF COLUMNS
9
DIMENSIONS
2
READ MATRIX
12.0
0.0
0.0 153.0 57.0 89.0
32.0 23.0
0.0 154.0 75.0 110.0
14.0
0.0
0.0 152.0 100.0 125.0
154.0 93.0
0.0 101.0 140.0 122.0
152.0 116.0 26.0 85.0 127.0 103.0
151.0 109.0
0.0 78.0 121.0 85.0
97.0 137.0 45.0
2.0 52.0 46.0
84.0 151.0 120.0 65.0 73.0 77.0
86.0 139.0 146.0 59.0 52.0 58.0
55.0 120.0 132.0
0.0 39.0 40.0
56.0 136.0 111.0 27.0 24.0 23.0
PLOT
JOINT
COMPUTE
FINISH
represent the amount of
of receptor cone in goldfish.
1-11,
4.0
24.0
0.0
153.0
148.0
174.0
106.0
102.0
79.0
62.0
72.0
0.0 147.0
17.0 153.0
0.0 145.0
44.0 99.0
75.0 46.0
57.0 73.0
92.0 14.0
154.0 44.0
163.0 87.0
147.0
0.0
144.0 60.0
The resulting plotted values show the sensitivity of the different receptor
cones to the different colours. The stimuli are located in a horseshoe
shape according to the wavelength of light involved (the row label Row2 is
overwritten by stimulus label BLUE-I):
4.4.3
AN EXAMPLE OF MULTIPLE CORRESPONDENCE ANALYSIS
The data used here are for "Hartigans Hardware" from GIFI(1990),pp.128ff. A
series of items are coded according to characteristics of their shape,
length, whether they are threaded, etc. and presented in a full indicator
matrix. The columns are a series of 0,1 codes for presence/absence of the
recorded characteristics and the rows represent the objects.
RUN NAME Hartigans Hardware example
TASK NAME Outlier Object 10 removed
N OF COLUMNS
18
N OF ROWS
23
DIMENSIONS
2
LABELS THREADN
THREADY
FLAT
CONE
ROUND
.....
.....
BOLT6
TACK1
TACK2
NAILB
SCREWB
READ MATRIX
1.0 0.0 1.0 0.0 0.0 0.0 0.0 0.0 1.0
1.0 0.0 1.0 0.0 0.0 0.0 0.0 0.0 1.0
1.0 0.0 1.0 0.0 0.0 0.0 0.0 0.0 1.0
1.0 0.0 1.0 0.0 0.0 0.0 0.0 0.0 1.0
1.0 0.0 1.0 0.0 0.0 0.0 0.0 0.0 1.0
1.0 0.0 1.0 0.0 0.0 0.0 0.0 0.0 1.0
1.0 0.0 0.0 0.0 0.0 1.0 0.0 0.0 1.0
1.0 0.0 0.0 0.0 0.0 1.0 0.0 0.0 1.0
1.0 0.0 0.0 0.0 0.0 1.0 0.0 0.0 1.0
0.0 1.0 0.0 0.0 1.0 0.0 0.0 1.0 0.0
0.0 1.0 0.0 0.0 0.0 0.0 1.0 1.0 0.0
0.0 1.0 0.0 0.0 1.0 0.0 0.0 1.0 0.0
0.0 1.0 0.0 0.0 0.0 0.0 1.0 1.0 0.0
0.0 1.0 0.0 0.0 1.0 0.0 0.0 1.0 0.0
0.0 1.0 0.0 1.0 0.0 0.0 0.0 1.0 0.0
0.0 1.0 0.0 0.0 0.0 0.0 1.0 1.0 0.0
0.0 1.0 0.0 0.0 0.0 0.0 1.0 1.0 0.0
0.0 1.0 0.0 0.0 0.0 0.0 1.0 1.0 0.0
0.0 1.0 0.0 0.0 0.0 0.0 1.0 1.0 0.0
1.0 0.0 1.0 0.0 0.0 0.0 0.0 0.0 1.0
1.0 0.0 1.0 0.0 0.0 0.0 0.0 0.0 1.0
1.0 0.0 1.0 0.0 0.0 0.0 0.0 0.0 1.0
0.0 1.0 0.0 1.0 0.0 0.0 0.0 1.0 0.0
PRINT
FINAL
PLOT
ROWS JOINT
COMPUTE
FINISH
0.0
0.0
0.0
0.0
0.0
0.0
0.0
0.0
0.0
0.0
0.0
0.0
0.0
1.0
1.0
1.0
1.0
1.0
1.0
0.0
0.0
0.0
0.0
1.0
1.0
1.0
1.0
1.0
1.0
1.0
1.0
1.0
1.0
1.0
1.0
1.0
0.0
0.0
0.0
0.0
0.0
0.0
1.0
1.0
1.0
1.0
1.0
0.0
0.0
0.0
0.0
0.0
0.0
0.0
0.0
0.0
0.0
0.0
0.0
0.0
1.0
1.0
1.0
1.0
1.0
1.0
1.0
1.0
1.0
0.0
0.0
1.0
1.0
1.0
1.0
0.0
0.0
0.0
0.0
0.0
1.0
1.0
0.0
0.0
0.0
0.0
0.0
0.0
0.0
0.0
0.0
0.0
0.0
0.0
0.0
0.0
0.0
0.0
0.0
1.0
1.0
0.0
0.0
0.0
0.0
0.0
0.0
0.0
0.0
0.0
0.0
0.0
0.0
0.0
0.0
0.0
1.0
0.0
0.0
0.0
0.0
0.0
0.0
0.0
1.0
1.0
0.0
0.0
1.0
0.0
0.0
0.0
0.0
0.0
0.0
0.0
0.0
0.0
0.0
0.0
0.0
0.0
0.0
0.0
1.0
0.0
0.0
0.0
0.0
0.0
0.0
0.0
0.0
0.0
0.0
0.0
0.0
0.0
0.0
0.0
0.0
1.0
1.0
1.0
1.0
1.0
1.0
1.0
1.0
1.0
1.0
1.0
1.0
1.0
1.0
1.0
1.0
1.0
1.0
1.0
0.0
0.0
0.0
0.0
0.0
0.0
0.0
0.0
0.0
0.0
0.0
0.0
0.0
0.0
0.0
0.0
0.0
0.0
0.0
0.0
0.0
0.0
0.0
1.0
1.0
1.0
1.0
The resulting plot of the rows scores clearly recovers the classification
of the items, identified by descriptive names:
APPENDIX : FORMS OF DATA INPUT FOR CORRESPONDENCE ANALYSIS
It is often helpful to represent categorical data in the form of an
‘indicator’ matrix. In general, for a variable zj with kj categories, the
indicator matrix is a table with kj columns and n rows, where n is the
number of objects. The cells of the matrix Gj contain a 1 if the column
category applies to the row object, and a zero if it does not. In each row,
therefore, there is only one element 1, and the rest are all zero (assuming
the categories are exhaustive and mutually exclusive). A matrix of this
kind is called a complete indicator matrix.
Indicator matrices Gj can be combined in a super indicator matrix G, with n
rows and ∑kj columns. As each row of Gj contains only one element 1, the
rows of G will add up to the number of variables. Matrices of this kind
containing categories for three or more variables provide a means of
presenting data for multiple correspondence analysis, as in the third
example above.
If the transpose of an indicator matrix G is multiplied by the original
indicator matrix, the resultant symmetric matrix, with rows and columns
corresponding to the column categories, in correspondence analysis is
sometimes called a Burt matrix. On the diagonal of this matrix are a series
of two-by-two matrices with counts of the ‘presence’ of an item in the
upper left corner and its ‘absence’ in the lower right corner, the other
elements being zero. This kind of matrix offers another alternative in
generalizing correspondence analysis to multi-way data.
The first example shown above inputs a simple contingency table for
correspondence analysis. This could instead have been arranged into a very
large binary (‘indicator’) matrix of 1660 rows, each representing a
subject, and seven columns, three representing the categories of the row
variables and four those of the row variables.
It is frequently the case that a number of rows of the complete indicator
matrix are identical, representing observed items with identical profiles
in terms of the column categories. Nishisato and Sheu (1980) have shown
that the results are equivalent if it is condensed by adding together any
identical rows. For the data of the first example above, this would yield
the following matrix:
Row
1
121
0
0
129
0
0
36
0
0
21
0
0
categories | Column categories
2
3
| 1
2
3
4
0
0
121
0
0
0
300
0
300
0
0
0
0
86
86
0
0
0
0
0
0 129
0
0
388
0
0 388
0
0
0 154
0 154
0
0
0
0
0
0
36
0
151
0
0
0
151
0
0
78
0
0
78
0
0
0
0
0
0
21
125
0
0
0
0
125
0
71
0
0
0
71
Readers may verify that this produces the same optimal scores. (see Weller
& Romney, p.67).
As a final example, Weller and Romney demonstrate multiple comparisons
using “stacked” matrices. They combine together, vertically, a series of
symmetric tables of judged similarities between English kinship terms,
drawn from different sources, from which the following is an extract (the
rows and columns of each table represent the terms “Grandfather”,
“Grandson”, “Father”, “Son”, “Brother”, “Uncle”, “Nephew”, and “Cousin”):
GrFa
6.00
4.10
4.00
1.43
1.00
1.56
0.81
0.62
GrSo
4.10
6.00
1.62
3.17
1.55
0.77
1.68
1.10
Fa
4.00
1.62
6.00
3.80
2.32
1.95
0.61
0.55
So
1.43
3.17
3.80
6.00
3.68
0.63
1.23
1.43
Br
1.00
1.55
2.32
3.68
6.00
1.61
1.56
1.75
Un
1.56
0.77
1.95
0.63
1.61
6.00
3.71
3.48
Ne
0.81
1.68
0.61
1.23
1.56
3.71
6.00
4.24
Co
0.62
1.10
0.55
1.43
1.75
3.48
4.24
6.00
4.50
1.88
6.00
4.02
2.31
2.13
0.26
0.25
2.31
4.04
4.02
6.00
3.01
0.32
1.02
0.75
1.01
1.36
2.31
3.01
6.00
2.47
1.63
1.75
0.92
0.20
2.13
0.32
2.47
6.00
4.27
3.86
0.31
1.38
0.26
1.02
1.63
4.27
6.00
4.71
0.27
0.81
0.25
0.75
1.75
3.86
4.71
6.00
........
6.00
4.25
4.50
2.31
1.01
0.92
0.31
0.27
4.25
6.00
1.88
4.04
1.36
0.20
1.38
0.81
The value 6.0 has been placed on the diagonal of each matrix as this was
the largest possible similarity score in the data, and has been used to
represent identity.
A correspondence analysis of the combined table provides a visual
representation of the similarities among the different kin terms and the
different data sources simultaneously.
REFERENCES
Benzécri et al.(1973) Analyse des données,
Paris, Dunod.
Bourdieu, P. (1979) La distinction – critique sociale du jugement, Paris,
Éditions de Minuit, Le Sens commun.
Coombs, C.H. (1964) A Theory of Data, New York, John Wiley.
Eckart, C. and Young, G.(1936) “The approximation of one matrix by another
of lower rank”, Psychometrika, 1, pp.211-218.
Fisher, R.A. (1940) “The precision of discriminant functions”, Annals of
Eugenics, 10, pp.422-429.
GIFI,A.(1990) Nonlinear Multivariate Analysis, New York, Wiley.
Greenacre, M.J.(1993) Correspondence Analysis in Practice, London, Academic
Press.
Hill, M.O.(1974) “Correspondence analysis: a neglected multivariate
method”, Applied Statistics, 23, pp.340-354.
Hirschfield, H.O.(1935) “A connection between correlation and contingency”,
Proc. Cambridge Philosophical Society, 31, pp.520-524.
Hotelling, H.(1935) “The most predictable criterion”, Journal of
Educational Psychology, 26, pp.139-142.
Hotelling, H.(1936) “Relations between two sets of variates”, Biometrika,
28, pp.321-377.
Nishisato, S. and Sheu W.-J. (1980) “Piecewise method of reciprocal
averages for dual scaling of multiple-choice data”, Psychometrika 45,
pp.467-478.
Van de Geer, J.P. (1993) Multivariate Analysis of Categorical Data, Vol.1,
Theory, and Vol.2, Applications, Newbury Park, Sage Publications.
Weller, S.C. and Romney, A.K. (1990) Metric Scaling, Sage Publications,
Quantitative Applications in the Social Sciences no. 75.
5.
HICLUS (HIerarchical CLUStering)
5.1 OVERVIEW
Concisely: HICLUS (HIerarchical CLUStering) provides internal analysis of
two-way one-mode (dis)similarity data by means of a hierarchical clustering
scheme using a monotonic transformation of the data.
DATA: 2-way, 1-mode dis/similarity matrix
TRANSFORM: Monotonic
MODEL: Ultra-metric distance
Since HICLUS does not employ a spatial representation, the
Carroll-Arabie (1979) classification is not useful in describing the
program.
Unlike most other programs in NewMDSX, HICLUS is not an iterative
algorithm. Nor is it strictly speaking a monotonic transform. It is the
HICLUS representation of the solution-- a “stacked” series of increasingly
fine partitions -- that remains invariant under monotonic transformation
and not (for instance) the dendogram solution.
5.1.1 ORIGIN, VERSIONS AND ACRONYMS
HICLUS was originally programmed by Johnson (1967) following
work by Ward (1963). The present program is based on the original
Bell Laboratories version of the program.
5.1.2 HICLUS IN BRIEF
The method of hierarchical clustering implemented in HICLUS is
often used as an alternative or as a supplementary technique to the
basic model of MDS and takes the same form of data.
The matrix of (dis)similarities between a set of objects is used
to define a set of non-overlapping clusters such that the more similar
objects are joined together before less similar objects. The scheme
consists of a series of clustering (levels). In the initial level each
object forms a cluster, whilst at the highest level all the objects
form a single cluster. In a hierarchical clustering scheme (HCS) there
are exactly (p-1) levels where there are p objects.
The clustering scheme is hierarchical in the sense that once two
objects have been joined together at a lower level of the scheme, they
may not be split at a higher level.
5.1.3 RELATION OF HICLUS TO OTHER PROCEDURES IN NewMDSX
HICLUS is commonly used as an interpretative aid in analysing
configurations of points resulting from MDS analyses.
5.2. DESCRIPTION
5.2.1 DATA
HICLUS expects data in the form of a lower triangle matrix of
(dis)similarity measures between a set of objects (stimuli). Any of
the types of data suitable for input to MINISSA are suitable (q.v.)'
It is often tempting to submit to HICLUS the solution distances
from (say) a MINISSA run. This is not recommended since a MINISSA
solution will be globally stable, but locally unstable in the following
sense. The location
of the stimulus points in the space is not uniquely defined, since
each may be moved within a fixed region without affecting the goodnessof-fit. It is precisely the small distances affected by such movements
which are crucial in the early stages of the HICLUS analysis. Users
are therefore advised to submit the original data to HICLUS.
5.2.2 THE MODEL
A hierarchical clustering scheme (HCS) consists of a set of
clusterings of a set of objects at increasing levels of generality. At
the lowest level, each object is considered a separate cluster. At the
next level the two most similar objects are merged to form a cluster.
At each subsequent stage either the most similar individual objects
remaining are joined together to form a new cluster or an object (or
indeed cluster) is joined to the cluster to which it is most similar. At
the highest level objects fall into one large, undifferentiated cluster.
5.2.2.0.1
A simple example
Level:
0
1
2
3
4
5
Objects:
C
B
E
D
F
A
.
.
.
.
.
.
.
XXXXX
.
.
.
.
XXXXX
.
XXXXX
XXXXXXXXX
.
XXXXX
XXXXXXXXX
XXXXXXXXX
XXXXXXXXXXXXXXXXXXXXX
In this example, B and E are merged at level 1, F and A are
merged at level 2,
C is merged with the cluster (B,E) at level 3,
D is merged with (F,A) at level 4, and finally (C,B,E) and (D,F,A)
are merged into a single cluster at the fifth level.
Notice that once an object has been assigned to a cluster it may
not "leave" that cluster. This is the defining characteristic of a
hierarchical scheme.
The crucial question when defining a HCS is one which asks how we
are to calculate the (dis)similarity between an object and an existing
cluster.
Consider three objects, a, b and c. If b and c have been joined to
form a cluster (b,c) then the question arises, how are we to find the
dissimilarity of a to (b,c). We might take it to be equal to the
dissimilarity between a and b or to that between a and c or some
average of the two. Since we are committed to using only the ordinal
information in the data we disregard the averaging approach and are left
in the general case, where a cluster may consist of more than two objects,
with two options, which mark the full range of possible options in defining
“the” distance between a cluster and another point: choosing the minimum
distance, and the maximum distance. Clearly, any aggregate measure for
defining “the” distance, such as the mean , the median or the mode will lie
between these extremes.
5.2.2.0.2 The "minimum" method
Also known as the "connectedness" or "single-link" method, this
approach defines the dissimilarity between a point and a cluster as the
smallest of the dissimilarities between the external point and the
constituent points in the cluster. This method tends to join single points
to existing clusters (“chaining”) and schemes resulting from it are often
not easily
amenable to substantive interpretation. The "level" value in this approach
gives the length of the longest chain joining any two points in the
cluster. This approach is chosen by specifying METHOD(1) in the PARAMETERS
statement.
5.2.2.0.3 The "maximum" method
Also known as the 'diameter' or 'complete link' method, this approach
defines the dissimilarity between a point and a cluster to be the
largest (maximum) of the dissimilarities between it and the points
constituting
the cluster. In this case the " level" gives the size of the diameter
of the largest at that level. This method is chosen by
specifying METHOD(2) in the PARAMETERS. The default option
METHOD(3) allows for both methods to be used sequentially.
With perfect data, both methods will give rise to the sameclustering.
5.2.2.1 The Algorithm
At each level:
1.
The smallest dissimilarity (greatest similarity) coefficient
in the data matrix is identified.
2.
The row- and column-element corresponding to this coefficient
are then merged to form a cluster (i.e. one row and one column are
effectively removed from the matrix).
3.
The (dis)similarity coefficients between the new cluster and
each of the remaining elements (points or clusters) are
calculated according to the METHOD chosen.
4.
The matrix is reduced by one row and column and the program
returns to step 1.
5.
When all the points are thus merged the solution is output
in the form of a histogram (the so-called Hierarchical Clustering
Scheme).
5.3.
INPUT COMMANDS
Keyword
N OF STIMULI
LABELS
<integer>
followed by a series
of labels (<= 65 char)
each on a separate line
READ MATRIX
COMPUTE
FINISH
5.3.1
Function
The number of variables in
input matrix.
Identify the variables
in plotting dendrograms.
Labels should contain text
characters only, without
punctuation.
read the data according to the
DATA TYPE specified
start computation
final statement in the run
LIST OF PARAMETERS
The following values may be specified, following the keyword PARAMETERS
Keyword
DATA TYPE
Default
0
0:
1:
2:
3:
METHODS
5.3.2
1.
1:
2:
3:
NOTES
The following commands are not valid with HICLUS.
( # )
( N ) OF SUBJECTS
( NO )
DIMENSIONS
ITERATIONS
PLOT
PUNCH
2.
3.
3
Function
The data are similarities – input is
lower triangle without diagonal
The data are dissimilarities – input
lower triangle without diagonal
The data are similarities – input is
full symmetric matrix
The data are dissimilarities – input
full symmetric matrix
Only the minimum method is used.
Only the maximum method is used.
Both methods are used (independently).
( # )
( N ) OF STIMULI
( NO )
may be replaced with
( # )
( N ) OF POINTS
( NO )
The input should be specified as floating-point (F type) numbers
and should be presented as a lower-triangle matrix without
diagonal.
5.3.3 PROGRAM LIMITS
Maximum number of stimuli =
5.3.4
80
PRINT, PLOT AND PUNCH OPTIONS
The general format for PRINTing, PLOTting and PUNCHing output
is described in the Overview. In the case of HICLUS the options are
as follows:
5.3.4.1
Option
HISTORY
PRINT options
Description
A detailed history of the clustering
is produced.
5.3.4.2 PLOT and PUNCH options
There are no plotting or secondary output options in HICLUS.
5.4.
EXAMPLE
RUN NAME
N OF POINTS
INPUT FORMAT
PARAMETERS
READ MATRIX
<data>
COMPUTE
FINISH
BIBLIOGRAPHY
Burt R.S. (1976)
HICLUS TEST DATA
10
(10F4.0)
DATA TYPE(1), METHODS(2)
Positions in Networks, Social Forces, 55,(1), 93-122.
Cermak, G.W. and P.C. Cornillo (1976) Multidimensional analyses of
judgments about traffic noise, Journal of the Accoustical Society, 59,
(6), 1412-20.
Desbarat, J.M. (1976) Semantic structure and perceived environment,
Geographical Analysis, 8, (4), 453-467.
Everitt, B. (1974)
Cluster Analysis, London: Heinemann.
Johnson, S.C. (n.d) A simple clustering statistic, Bell Laboratories,
mimeo.
Johnston, J.N. (1976) Typology formation across socio-economic
indicators, Sociological Economics, 10, (4), 167-171.
Ling, R.F. (1973) A computer generated aid for cluster analysis,
Communications of the ACM 16, 355-61.
Perreault, W.D. and F.A. Russ (1976) Physical distribution service in
industrial purchase decisions, Journal of Marketing, 40, (2), 3-10.
Preece, P.F.W. (1976) Mapping cognitive structure - Comparison of methods,
Journal of Educational Psychology, 68,(1), 1-8.
Seligson, M.A. and J.A. Booth (1976)
Political participation in Latin
119.
America - Agenda for research, Latin American Research, 11, (3), 95-
Shepard, R.N. (1974) Representation of structure in similarities data:
problems and prospects, Psychometrika, 39, 373-421.
Ward, J.H. Jr. (1963) Hierarchical grouping to optimise an objective
function, Journal of the American Statistical Association, 58, 236244.
APPENDIX :
RELATION OF HICLUS TO PROGRAMS NOT IN NewMDSX
For a full range of options regarding hierarchical and other
clustering schemes, users are referred to the CLUSTAN package.
6.
6.1.
INDSCAL-S (INDividual Differences SCALing)
OVERVIEW
Concisely: INDSCAL-S (INDividual Differences SCALing: Symmetric or short
version) provides internal analysis of a three-way data matrix consisting
of a set of (dis)similarity matrices, by a weighted distance model using a
linear transformation of the data.
Following the categorisation developed by Carroll & Arabie (1979)
the program may be described as:
DATA: Three-way, two mode dis/similarities or correlations
TRANSFORMATION: Linear
MODEL Weighted Euclidean Distance or Scalar Products
6.1.1 ORIGIN, VERSIONS AND ACRONYMS
INDSCAL was developed by J.D. Carroll and J.J. Chang of Bell
Telephone Laboratories. The original INDSCAL program performed two types
of analysis: INDIFF, which is the most commonly used part of the program
and often referred to simply as INDSCAL, and CANDECOMP. It is this former
analysis (the INDIFF option) which comprises the present program (INDSCAL-
S). The CANDECOMP option appears as a separate program within NewMDSX.
The present program is specially adapted from the 1972 version of INDSCAL.
A quasi non-metric INDSCAL known as N-INDSCAL exists but is
be unstable.
known to
In what follows we shall follow the convention of referring to the
model as INDSCAL and this program as INDSCAL-S.
6.1.2 INDSCAL IN BRIEF
INDSCAL was originally developed to explain the relationship
between subjects' differential cognition of a set of stimuli. Suppose that
there are N subjects and p stimuli. The program takes as input a set of N
matrices each of which is a square symmetric matrix (of order p) of
(dis)similarity judgments/measures between the p stimuli.
The model explains differences between subjects' cognitions by a variant of
the distance model. The stimuli are thought of as points positioned in a
'group' or 'master' space. This space is perceived differentially by the
subjects in that each of them affords a different salience or weight to
each of the dimensions of the space. In the graphic displays of these
results, note that an additional menu item Vectors enables you optionally
to plot the subjects as vectors, if preferred. The trans-formation which is
assumed to take the data into the solution is a linear one.
6.1.3
RELATION TO OTHER NewMDSX PROGRAMS
INDSCAL is a special case of CANDECOMP where the second and
third 'way' of the data matrix are identical. In the Carroll-Wish
terminology INDSCAL is three way, two mode; CANDECOMP three way, three
mode (actually N-way, N-mode where 3 ≤ N ≤ 7).
INDSCAL can also be thought of as a generalisation (to a third Way) of the
metric distance program MRSCAL.
The INDSCAL model is also analogous to P1 (the dimensionally-weighted
distance model) of the PINDIS hierarchy of models. However, the input data
are quite different, as INDSCAL takes original measures of dis/similarity
and PINDIS takes the co-ordinates of a set of previously scaled solutions)
6.2. DESCRIPTION
6.2.1 DATA
Imagine that a group of subjects is asked to assess the
dissimilarity between a set of objects. It is inevitable that these
judgments will differ. The problem then arises of the relationship
between the sets of judgments. The INDSCAL model assumes that subjects can
be thought of as systematically distorting a shared space in arriving at
their judgments and it seeks to reconstruct both the individual private
(distorted) spaces and the aggregate "group" space.
There is no reason why the judgments of (dis)similarity should
come from "real" individuals. They may be different occasions, methods,
places, groups etc., in which case they are often referred to as 'pseudosubjects'.
The mode of distortion which the INDSCAL model proposes is this.
The basic, shared configuration (known as the Group Space in INDSCAL)
has a given number of fixed dimensions. In making their dissimilarity
estimates different subjects are thought of as attaching different salience
or importance to different dimensions. Thus, for instance, in judging the
differences between two houses an architect might primarily distinguish
between them in terms of style, whereas a prospective buyer might attach
relatively little weight to that aspect but a great deal to the difference
in price.
6.2.1.1 Example
Suppose we were interested in how people perceive the distances
between 6 different areas of a city, and asked them to give their estimates
of the distance between each of the pairs of areas (fifteen in all). These
estimates we collect into three lower-triangle matrices as follows:
3.6
6.7 9.2
7.0 3.1
6.0 4.1
4.1 5.0
5.7
7.3 9.4
7.1 3.3
6.0 4.2
5.7 6.4
7.3
9.0 12.0
9.9 4.3
8.4 5.7
4.2 5.8
Subject 1
3.1
3.0
3.6
3.1
6.7
4
4.3
4.2
4.6
3.3
7.3
4
3.3
3.0
4.1
4.3
9.0
5.6
Subject 2
Subject 3
The fifteen judgments of each subject are collected into the
lower triangle of a square symmetric matrix which would be submitted
to INDSCAL-S as shown in section 4.4.1
6.2.2 MODEL AND ALGORITHM
The INDSCAL model interprets 'individual differences' in terms of
subjects applying individual sets of weights to the dimension of a common
'group' or 'master' space. Hence the main output of an INDSCAL analysis is
a 'Group Space' in which the stimuli (in our example, the area locations)
are located as points. The configuration of stimuli in this Group Space is
in effect a compromise between different individuals' configurations, and
it may conceivably describe the configuration of no single individual (i.e.
one that weights the dimensions equally).
Complementing the Group Space is a 'Subject Space'. This space has
the same dimensions as the Group Space but in it each individual (or datasource)is represented as a vector, whose end-point is located by the set of
co-ordinates which are the values of the numerical 'weights' which he
assigns to each dimension. These individual weights or saliences are solved
for by the program and
are its next most important output.
Thus the subject whose individual cognition corresponds exactly
with the "group space configuration" - if that subject exists - would
be situated in a two-space on a line at 45 between the axes, whereas
someone who paid no attention to one of the axes would be situated at
zero on that axis.
Having obtained the 'Group Space' and an individual's set of weights,
it is often useful to take the Group Space Configuration of stimuli points
and transform it into that individual's 'Private Space'. A Private Space
is simply the Group Space with its dimensions stretched or contracted by
the square-root of the weights which that subject has assigned to them.
6.2.2.1.1
Some properties of the INDSCAL model
It should be noted that INDSCAL produces a unique orientation of the
axes of the Group Space, in the sense that any rotation will destroy the
optimality of the solution and will change the values of the subject
weights. Moreover, the distances in the Group Space are weighted
Euclidean, whereas those in the private spaces are simple Euclidean.
Because of this, it is not legitimate to rotate the axes of a Group Space
to a more 'meaningful' orientation, as is commonly done both in factor
analysis and in the basic multidimensional scaling model. It has generally
been found that the recovered dimensions yield readily to interpretation.
Secondly, each point in the Subject Space should be interpreted
as a vector drawn from the origin. The length of this vector is
roughly interpretable as the proportion of the variance in that
subject's data accounted for by the INDSCAL solution. All subjects
whose weights are in the same ratio will have vectors oriented
in the same direction. Consequently, the appropriate measure for
comparing subjects' weights is the angle of separation between
their vectors and not the simple distance between them. For this reason,
clustering procedures which depend on distance should not be used to
analyse the Subject Space.
6.2.2.2 The Algorithm
1.
The program begins by converting each subject's dissimilarities
into estimates of Euclidean distances by estimating the additive
constant (see Torgerson 1958; Kruskal 1972).
2.
These distance estimates are then double-centred to form a
scalar-product matrix.
3.
These scalar-products may be considered as the product of three
numbers. The first of these will come to be considered as the
subject weight. The other two give at this stage two distinct
estimates of the value of the stimulus co-ordinates.
4.
An initial configuration is input by the user or generated by
the program (see 6.2.3.3).
5.
The scalar-products between the points in this configuration are
calculated and serve as an initial estimate of the solution
parameters.
6.
For each scalar-product at each iteration a pair of these three
numbers is held constant in turn and the value of the other is
estimated.
7.
When maximum conformity to the data is reached by this iterative
process, the two estimates of the stimulus coordinates are set
equal and one more iteration is performed.
8.
The matrices are normalised and output as solution.
6.2.3
FURTHER OPTIONS
6.2.3.1 Data
Consider again the example given above (section 6.2.1.1). In it we had
three subjects judging six stimuli. Thus each subject generates a lower
triangle matrix of five rows if the diagonals are omitted. These are input
to the program after the READ MATRIX command sequentially, i.e. the matrix
of subject I is followed by that of subject II which is followed by that of
subject III, without break, fifteen lines in all.
The program will also analyse other types of data including
correlation or covariance matrices. In this case the 'stimuli' will
be the variables which are correlated and the 'subjects' perhaps
replicative studies.
At the beginning of an INDSCAL analysis each input matrix of
similarities, dissimilarities, or distances is converted into a matrix of
scalar products. To equalize each subject's influence on the analysis
these data are normalized by scaling each scalar products matrix so that
its sum of squares equals one. Data input as covariances or correlations
are not converted to scalar products and are not normalized in this way,
thus it is essential to signal this type of input by means of the DATA TYPE
parameter (see Section 6.3).
6.2.3.2 Number of dimensions
Some experimentation is generally needed to determine how many
dimensions are appropriate for a given set of data. This involves
analysing the data in spaces of different dimensionality. For each space
of r dimensions the program uses as a starting configuration the solution
in (r + 1) dimensions less the dimension accounting for the least variance.
Usually between two and four dimensional solutions will be adequate for any
reasonable data set.
6.2.3.3
Starting configuration
The analysis begins with an initial configuration of stimulus
points. This may be supplied by the user and read under a READ CONFIG
command. This configuration should contain stimuli coordinates in the
maximum dimensionality required.
Alternatively the program can generate a configuration either by
a method similar to that used in IDIOSCAL or by picking pseudo-random
numbers from a rectangular distribution. If the value of the
parameter RANDOM is 0 then the IDIOSCAL procedure is used otherwise the
value is used as a seed to generate the random numbers. Since sub-optimal
solutions are not uncommon with this method users are strongly recommended
to make several runs with different starting configurations. A series of
similar (or identical) solutions may be taken to indicate that a true
'global' solution has been found.
Alternatively, the user may wish to overcome this particular
difficulty by submitting, as an initial configuration one obtained from,
say, a MINISSA run in which the averaged judgements have been analysed.
This method will also reduce the amount of machine time taken to reach a
solution.
6.2.3.4
External analysis
On occasion a user may wish to determine only subject weights for some
previously determined stimulus configuration, such as a previous INDSCAL
solution, or, some known configuration (as in our notional example the
actual geographical location of the city areas).
This option requires
that an input configuration be supplied under the READ CONFIG command. The
full set of data should be read in under the READ MATRIX command but FIX
POINTS should be set to 1 in the PARAMETERS command and the program will
then solve only for the subject weights.
6.2.3.4.1
Large data sets
The FIX POINTS option is particularly useful when the user has more
data than the program is capable of handling (see 3.2). The user can use
the configuration obtained either from a MINISSA analysis of averaged
judgments or from an INDSCAL analysis of some random or judiciously
selected subset of subjects and fit to it any number of subjects' weights.
6.2.3.5
The SOLUTIONS parameters
The axes of the solution correspond to the major direction of
variation in the subjects' data. They will not usually correspond to
the principal axes of the configuration, in which, the coordinates on
the axes are uncorrelated. In the INDSCAL solutions, by contrast,
the coordinates will usually be correlated and these correlations are
output as the scalar-products matrix for the stimulus configuration.
A similar scalar-products matrix is output for the subject space. In
this however, it is a dispersion matrix whose diagonal entries are
variances, representing the degree to which subject variation is
concentrated in that dimension, and whose off-diagonal entries represent
the co-variation between dimensions in the subject weights.
If the user wishes to constrain the solution as closely as possible to
orthogonality (i.e. in the sense that the correlation between the
coordinates is zero) then the parameter SOLUTIONS should be set to 1 in the
PARAMETERS command. Users are warned that this will necessarily produce a
suboptimal solution.
6.2.3.6
Negative weights in INDSCAL solutions
There is no interpretation of a negative subject weight in an
INDSCAL solution. Nevertheless, from time to time negative values do
occur in the subject matrix. If these are close to zero, then the
occurrence is likely to be due to rounding error and should be regarded as
zero in interpreting the solutions. Large negative values on the other
hand suggest a more substantial error or that the model is not appropriate
to the data.
6.2.3.7
Individual correlations as a measure of goodness-of-fit
Being a 'metric' procedure the index of goodness-of-fit of model
to data is the correlation between the scalar products formed from the
subject's data and those implied by the model. The program outputs a
correlation coefficient for each subject and also the average correlation
for all subjects and a root-mean-square coefficient which indicates the
proportion of variance explained.
6.2.3.8
The stopping criterion
At step 7 of the algorithm the improvement in correlation is
computed. If this is less than the value specified on the CRITERION
parameter in the PARAMETERS command, then the iterations are ended. Users
should make this value larger if they wish to essay a number of
exploratory analyses or to test a number of starting configurations.
6.3.
INPUT COMMANDS
Keyword
N OF STIMULI
n
N OF SUBJECTS
m
DIMENSIONS
[number]
Function
Number of stimuli for
analysis
Number of subjects for
which data are to be input
[number list]
[number] TO [number]
LABELS
followed by a series
of labels (<= 65 characters),
each on a separate line
READ CONFIG
n x max.dimensions
Matrix
READ MATRIX
m x n matrix
COMPUTE
FINISH
6.3.1
Dimensions for analysis
Optionally identify
the stimuli in the
output
Read optional initial
configuration
Read the data according
to the DATA TYPE
Start computation
Last statement in run
LIST OF PARAMETERS
The following values may be specified following the keyword PARAMETERS
Keyword
SOLUTIONS
Default Value
0
FIX POINTS
0
RANDOM
0
DATA TYPE
1
CRITERION
0.005
MATFORM
0
Function
Compute all dimensions
simultaneously
1: Compute separate one
dimensional solutions.
0: Iterate and solve for all
matrices.
1: Solve for subject weights
only
Random number seed for
generating the initial
configuration. (Used when the
user does not provide the initial
configuration by use of READ CONFIG)
0: IDIOSCAL starting
configuration
0:
1:
Lower half similarity
matrix (without diagonals)
2: Lower half dissimilarity
matrix (without diagonals)
3: Lower half Euclidean
distances (without
diagonals)
4: Lower half correlation
(without diagonals).
5: Lower half covariance
matrix
(without diagonals).
6: Full symmetric similarity
matrix
(diagonals ignored).
7: Full symmetric
dissimilarity matrix
(diagonals ignored).
Sets criterion value for
termination of iterations.
0:
1:
Input configuration saved
Stimuli(rows) by dimensions
(columns).
Input configuration saved
dimensions (rows) by stimuli
(columns).
Only valid with READ CONFIG.
6.3.2 NOTES
1. Program limits
Maximum number of dimensions
=
5
Maximum number of stimuli
=
30
Maximum number of subjects
=
60
N OF SUBJECTS x (N OF STIMULI)
= 18000
max (N OF SUBJECTS, N OF STIMULI)
x maximum no. of dimensions x 3
=
2500
2. Labels should contain text characters only, without punctuation.
3. The program expects input in the form of real (F-type numbers),
and an INPUT FORMAT, if it is necessary to use one should allow for
this. The INPUT FORMAT specification, if used, should read the longest
line of the input matrices.
6.3.3 PRINT, PLOT AND PUNCH OPTIONS
The general format for PRINTing, PLOTting and PUNCHing output
is described in the Overview. In the case of INDSCAL, the available
options are as follows:
6.3.3.1.
PRINT options
Option
INITIAL
(to main output file)
Form
N x r
p x r
p x r
FINAL
N x r
p x r
N
r x r
HISTORY
SUMMARY
Description
Three matrices are listed:
1. the initial estimates of the
subject weights
2. & 3. separate estimates of the
stimulus configuration.
Two matrices are listed being the
matrix of subject weights and the
coordinates of the group space.
These are followed by the
correlation
between each subject's data and
solution and the matrix of crossproducts between the dimensions.
An iteration by iteration history
of the overall correlation.
(The final (3) matrices at
convergence are also listed)
Summary of results produced at end
of each analysis.
By default only the solution matrices and the final overall
correlation are listed.
6.3.3.2
Option
INITIAL
PLOT options
CORRELATIONS
GROUP
SUBJECTS
(to main output file)
Description
The initial configuration may be
plotted only if one is input by the
user.
The correlations at each iteration are
plotted.
Up to r(r-1)/2 plots of the p stimulus
points.
Up to r(r-1)/2 plots of the Subject
Space
By default the Subject and Group Spaces will be plotted.
6.3.3.3
PUNCH options (to secondary output file)
Option
FINAL
CORRELATIONS
SCALAR PRODUCTS
Description
Outputs the final configuration
and the subject correlations in
the following order:
- each subject is followed by the
coordinates of its weight on
each dimension;
- each stimulus point is followed
by its coordinates on each
dimension.
The overall correlation at each
iteration is output in a fixed
format.
the scalar product matrix is output.
By default, no secondary output is produced.
6.4. EXAMPLE
RUN NAME
TASK NAME
N OF SUBJECTS
N OF STIMULI
DIMENSIONS
PARAMETERS
COMMENT
INPUT FORMAT
READ MATRIX
36
23 92
70 31 31
60 41 30 31
41 50 36 67 40
57
73 94
71 33 43
60 42 42 33
57 64 46 73 40
73
90120
99 43 33
84 57 30 43
42 58 41 90 56
PRINT
PLOT
COMPUTE
FINISH
INDSCAL TEST DATA
...FROM EXAMPLE IN 2.1.1
3
6
2
CORRELATIONS(1),RANDOM(34551)
THIS IS THE SET-UP FOR THE EXAMPLE
GIVEN.
NOTICE THE USE OF THE SHORTENED
PARAMETER
DESIGNATION AS IN 'DATA(2)'
(5F3.0)
FINAL, HISTORY
ALL
BIBLIOGRAPHY
Kroonenberg, P.M. (1992). Three-mode component models. Statistica
Applicata, 4, 619- 634. (See also his extensive current bibliograpy at:
http://www.leidenuniv.nl/fsw/three-mode/index.html.)
Bloxom, B. (1965) Individual differences in multidimensional scaling,
Princeton University Educational Testing Service Research Bulletin, 68-45.
Carmone, F.J., P.E. Green and P.J. Robinson (1968) TRICON: an IBM
360/65 program for the triangularisation of conjoint data,
Journal of Marketing Research, 5, 219-20.
Carroll, J.D. and P. Arabie (1979) Multidimensional scaling, in
M.R. Rozenzweig and L.W. Porter (eds.) 1980 Annual Review of
Psychology, pp 607-649, Palo Alto Ca., Annual Reviews.
Carroll, J.D. and J.J. Chang (1970) Analysis of individual differences in
multidimensional scaling via an N-way generalization of 'Eckart-Young'
decomposition, Psychometrika, 35, 283-319.
Carroll, J.D. and M. Wish (1974) Multidimensional perceptual models and
measurement methods, in E.C. Carterette and M.P. Friedman Handbook of
Perception, Vol.2, New York: Academic Press (Ch.5 Individual differences in
perception).
---- (1975) Models and methods for three way multidimensional scaling,in
R.C. Atkinson, D,H. Krantz, R.D. Luce and P. Suppes (eds.), Contemporary
Methods in Mathematical Psychology, San Francisco: Freeman.
Coxon, A.P.M. and C.L. Jones (1974) Applications of multidimensional
scaling techniques in the analysis of survey data, in C.J. Payne and
C.O'Muircheartaigh, Survey Analysis, London: Wiley.
Horan, C.B. (1969) Multidimensional scaling: combining observations when
individuals have different perceptual structure, Psychometrika, 34, 2,
pt.1, 139-165.
Jackson, D.N. and S.J. Messick (1963) Individual differences in social
perception, British Journal of Social Clinical Psychology, 2, 1-10.
Torgerson, W.S. (1958)
Theory and methods of scaling, New York: Wiley.
Tucker, L.R. (1960) Intra-individual and inter-individual multidimensionality, in H. Gulliksen and S. Messick (eds.), Psychological
scaling: Theory and applications, New York: Wiley.
Wish, M. and J.D. Carroll (1974) Applications of individual differences
scaling to studies of human perception and judgment, in Carterette and
Friedman (1974): see Carroll and Wish 1974 above.
Wold, H. (1966) Estimation of principal components and related models by
iterative least squares, in P. Krishnaiah (ed.), International Symposium on
multivariate analysis, New York: Academic Press.
7.
MDPREF (MultiDimensional PREFerence Scaling)
7.1.
OVERVIEW
Concisely: MDPREF (MultiDimensional PREFerence Scaling) provides
internal analysis of two-way data of either a set of paired comparisons
matrices or a rectangular, row-conditional matrix by means of a vector
model, using a linear transformation of the data.
DATA: 2-way 2-mode dis/similarity or preference data (alternatively, a set
of (0,1) dominance matrices of [pairwise preference)
TRANSFORMATION: Linear
MODEL: Scalar Products or Vector
In the terminology developed by Carroll and Arabie (1979) MDPREF
may be described as:
Data:
7.1.1
Two mode
Two- or three-way
Interval level
Row-conditional
Complete or incomplete
Model:
Scalar-product
Two sets of "points"
One space
Internal
ORIGINS, VERSIONS AND ACRONYMS
MDPREF is based on a model developed at Bell Laboratories by
J.D. Carroll and J.J. Chang (see Carroll , 1973). In this paper they
develop two types of solution, one iterative and the other analytical,
making use of the Eckart-Young decomposition theorem (1936). The
MDPREF program implements this latter type, since the solutions obtained
were virtually identical. A quasi-non-metric version (N-MDPREF) has
been developed, but is not currently available. The NewMDSX version of
MDPREF additionally includes the option for the User to divide the subjects
into groups,and perform an analysis of variance of the subject vectors (as
directional statistics). This was programmed by Charles Jones.
7.1.2
FURTHER SPECIFICATION
The MDPREF program provides internal analysis of preference data.
This involves a set of subjects making preference or any similar sort of
judgment about a set of stimuli (objects). From the data the program
positions the stimuli as points in a Euclidean space, and represents each
subject by a vector or line directed towards the region where that
subject's highest preference lies. In the case of perfect fit, the
projections of the stimuli on this line correlate perfectly with the
subject's preference scores.
7.1.3 RELATION OF MDPREF TO OTHER PROCEDURES IN NewMDSX
MDPREF analyses 'preference' data by means of a point vector
or "ideal vector" model. Each subject or judge is represented in the
space as a vector directed (which indicates the direction of increasing
preference. The stimuli are represented as points in the same space, so
that the projections of the stimuli onto a given subject's vector
maximally reproduce his(her) preferences.
The same point vector model is implemented both in phase IV of
PREFMAP and in PROFIT, although in these cases the scaling is 'external'
in the sense that the configuration of stimulus points is known beforehand
and the subjects are fitted into this space as vectors. In MDPREF
by contrast both subject vectors and stimulus points are positioned
simultaneously from the information in the data, a so-called 'internal'
analysis. (Note however that PREFMAP phase IV does allow a quasi
internal analysis q.v.)
CORRESP also uses a direct singular value decomposition of pretransformed data to produce canonical scores for rows and columns which can
be plotted as points in the same space. CORRESP examines only interactive
factors by explicitly removing the magnitude effect prior to decomposition,
but so can MDPREF when treating data as row-conditional. The difference
between the two lies in the transformations applied to the data before
processing, so that the results, while similar in appearance, are not the
same.
The same data as used in MDPREF may also be internally scaled
by the non-metric distance model ('unfolding analysis') implemented in
NewMDSX as MINIRSA. In this case, both subjects and stimuli are
represented as points in the same space.
7.2.
DESCRIPTION
7.2.1
INPUT DATA
MDPREF accepts input data in either of two main forms:
as a set of pair-comparisons matrices (see David (1963), Ross (1934))
or as a set of rankings or ratings forming a rectangular, so-called
"first-score" matrix. Options within the program differ with different
data input and the type of input is chosen by the DATA TYPE parameter
in the PARAMETERS command. In the following the "first-score" input is
dealt with in sections 7.2.1.1 and 7.2.1.1.1 and the method of paircomparisons and its associated options in sections 7.2.1.2 to 7.2.1.2.1.1.
Further options are discussed in section 7.2.3.
7.2.1.1 The first-score matrix (DATA TYPE 1-4)
Suppose a set of N subjects is asked to rank in order of, say,
preference, or give a rating to the set of p stimuli. The resultant data
forms a rectangular 'row-conditional' matrix with N rows (subjects) and p
columns (stimuli), called the "first score matrix" in the program.
Each row of the matrix represents the preference rank or score assigned
by that subject to the stimuli.
Such a matrix can also be obtained by taking the pair comparison
matrix for a given subject and summing each row. The resultant column of
scores gives that subject's rank order of preference for the stimuli and
these may be collected to form the "first-score matrix".
7.2.1.1.1 Ranks or Scores ?
Preference judgments may be represented for MDPREF (as in MINIRSA
and other procedures) in four distinct ways. The major distinction is that
between a rank and a score. If a subject is asked to write down in his
order of preference for five stimuli, he might respond with:
ACDEB
*The program in fact converts pair-comparison input into "first-score"
form in this way before proceeding with the analysis.
If these letters (or stimulus names) are given numeric values this
becomes:
13452
This is the rank-ordering method (analogous to Coombs's I-scales) and
means that stimulus 1 is preferred to 3 which is preferred to 4 etc.
Data may be input to MDPREF in this form by specifying DATA TYPE(1).
In various data-collection techniques it may be that the ordering
obtained begins with the least-preferred stimulus so that the previous
example would in this case be written as: BEDCA, signifying that B
is least preferred, followed by E, and so forth. If this is the case
then the data should be specified as: DATA TYPE(2).
A different way of representing such data is by the 'score'
method. In this method each column represents a particular stimulus
and the entry in that column gives the score or rating of that stimulus
(for that subject) in his 'scale of preference'. Thus, in our original
example the I-scale ACDEB (where A is preferred to C, which is preferred
to D etc.) would in this method be represented as follows:
subject
i
A B C D E
1 5 2 3 4
In this instance, the lowest number ('1') is used to denote the most
preferred stimulus and the highest ('5') to represent the least preferred.
This option is chosen by: DATA TYPE(3). Alternatively, the highest
number might have been used to represent the most preferred stimulus
and if this is so, DATA TYPE(4) should be specified.
(Although in illustrating the score method we have used the number
1 to 5, the data might equally well have been numerical ratings).
For an example see 5.2.1.2.1.1
Figure 1 provides a simple means of identifying the appropriate
DATA TYPE value.
Figure 1.
Are the data
----- Yes ----- DATA TYPE(O)
pair comparisons ?
│
No
│
Are the data
ranks or scores?
/
\
ranks
scores
/
\
Is the first
Does the highest
stimulus the
value mean most
most preferred?
preferred?
/
\
/
\
yes
no
yes
no
DATA TYPE (1)
DATA TYPE(2)
DATA TYPE(3)
DATA TYPE(4)
7.2.1.2 The pair-comparisons matrices (DATA TYPE(0))
Suppose a subject is asked to consider all possible pairs of p
stimuli and for each pair to indicate which stimulus (s)he prefers (or
which stimulus possesses more of a given attribute). (S)he is asked
to make p (p-1)/2 judgments of preference. (Since this increases
approximately as p-squared, with a large number of stimuli this number of
pairs becomes prohibitively large. Consequently, strategies
exist to reduce the number of judgments (see 5.2.3.1)). The data thus
obtained may be collected into a square, asymmetric matrix whose
rows and columns each represent the p stimulus points, whose entries
aij take the value 1 if the subject prefers stimulus i to stimulus j,
and aji will normally be 0, meaning that the subject does not
prefer stimulus j to stimulus i (but see 5.2.3.1). The subject may be
allowed to express indifference between the stimuli, or leave blank a
particular pair comparison. Allowance is made for these options in the
program, and the relevant coding conventions are described in section
5.2.3.
If there are N subjects performing this test of preference, then
there will be N such matrices. These are input to MDPREF by specifying
in the PARAMETERS command the value DATA TYPE(0), which is the default
value.
7.2.1.2.1 Coding of paired comparisons matrices
In the example above the entry '1' was taken to stand for preference
by the particular subject for the row-stimulus over the column stimulus,
and the value ' ' for its converse. Further values are required to
represent indifference between stimuli and missing data. Since coding
conventions vary, the program allows the users to specify their own.
This is done by means of the command READ CODES (which has no operand
field and if required may have associated with it its own INPUT FORMAT
specification). READ CODES instructs the program to read in four values
for the codes, the first of which will represent preference, the second its
opposite ("anti-preference"), the third indifference and the fourth a
missing data value.
7.2.1.2.1
Example
.
INPUT FORMAT
READ CODES
1 0 8 9
.
.
(4I2)
It will be noted that the codes must be specified as integer
(I-type) variables. Thus our example has the program read
1
0
8
9
as
as
as
as
the
the
the
the
code
code
code
code
for
for
for
for
preference
"anti-preference"
indifference
a missing datum
Note also that even if, in a particular analysis, fewer than four codes
are used, four values should nevertheless be specified and read under
READ CODES.
The N paired-comparisons matrices are read by the READ MATRIX command,
according to an optional INPUT FORMAT, if the data are not in free format.
If used, this should specify the format of one row of the input matrices,
and the individual matrices should follow each other without separation.
(For example, see 5.5.1). Also note that if there are missing data then
MISSING(1) should be specified in the PARAMETERS command.
7.2.1.3
Example of data types
When eliciting judgments by means of pair comparisons we need
three things: (i) a set of subjects who will evaluate (ii) a set of
stimuli (iii) on a given criterion.
Each subject vector will then represent the direction in which that subject
sees the criterion increasing over the configuration of stimulus points.
Suppose we were interested in the 'user-friendliness' of the accompanying
documentation of various computer packages.
advisers to fill in the following:
We might ask Computing Centre
... Taking each pair in turn please indicate by ticking in
the box provided, which of each pair of packages is more
"user friendly" ...
SPSS
[ ]3
GENSTAT
[ ]1
GENSTAT
[ ]1
CLUSTAN
[ ]4
NewMDS(X)
[ ]2
SPSS
[ ]3
SAS
[ ]5
NewMDS(X) [ ]5
....
....
And we would go on to list (probably in random order) all twenty pairs
of these five programs. For each adviser we would then construct a matrix
similar to this:
Subject 32
GENSTAT
NewMDSX
SPSS
CLUSTAN
GLIM
G
N
C
E
e
L
N
w
U
S
M
S
S
G
T
D
P
T
L
A
S
S
A
I
T
X
S
N
M
----------------------------|
1
1
1
1
| 0
9
1
1
| 0
9
1
8
| 0
0
0
1
| 0
0
8
0
This subject believes that GENSTAT is more 'user-friendly' than all
the other packages, NewMDSX than CLUSTAN and GLIM, and CLUSTAN than
GLIM. Furthermore,(s)he left the pair SPSS/NewMDSX blank (hence code 9)
and decided that there was No difference between BMDP and CLUSTAN (code 8).
7.2.1.3.1 Data for 'First-score'
In the example above, five stimuli were presented in pairs,
twenty in all. If we were concerned with more than that number of
stimuli we might feel that the number of pairs was too large for the
subject to manage without boredom, error or bloody mindedness taking
its toll. We might then decide to abandon the pair comparison method
(which is, of course, sensitive to intransitivities in a subject's data)
and use instead a method of ranking or rating. For instance, we might ask:
Please place the letters corresponding to the
packages listed in the box provided so that the first
letter represents the program which you feel to be most
'user-friendly' and the last the one you feel to be
least 'user-friendly'.
A:
B:
C:
D:
E:
F:
G:
GENSTAT
NewMDSX
SPSS
CLUSTAN
GLIM
(Most)
[
][
User-friendly
][
][
][
][
(Least)
][
]
This method is obviously less time-consuming but less sensitive than
the method of pair comparison. In this case we simply take each subject's
list of letters (I-Scale) and collect them into instruction lines with the
subject numbers:
.
.
S023
S024
S025
.
.
ABCDEFG
GFEDCBA
ACEGBDF
Here we would specify DATA TYPE(1) to MDPREF to denote the fact
that our data are ranked (I-Scales) with the highest 'preference' first.
7.2.2 THE MODEL
The MDPREF model represents the preferences of a subject for a
group of stimuli as a vector through the configuration of stimulus points.
This vector indicates the direction in which his (her) preference
increases over the space. Substantively this makes strong assumption
about the nature of preference, in that the model implies an "ideal"
point - i.e. a point of maximum preference - at infinity (which is
similar to the classic econometric assumption of insatiability. In MDPREF,
where the point of maximum preference is at infinity, the contours are
perpendicular to the vector). There is no reason to cavil, for instance
at the idea of seriousness (Coxon 1980) or, as in our earlier example,
"user friendliness" increasing uniformly over the space.
MDPREF is a linear (or metric) procedure and the measure of goodnessof-fit of the model to the data is a product-moment correlation. Consider
one subject vector passing through a configuration of stimulus points
with the projections (perpendicular lines drawn from the points onto the
vector). It is the values given to the points at which these perpendicular
lines meet the vector which are maximally correlated with that subject's
data. (This is guaranteed by the Eckart-Young decomposition).
The subject vectors are normalised (for convenience only) to
the same length, i.e. so that their ends lie at a common distance from
the origin of the space, forming a circle, sphere or hypersphere depending
on the dimensionality chosen for analysis. Thus when a solution of more
than 3 dimensions is represented as a set of 2-dimensional plots, some of
the vectors will not, in fact, lie on the boundary circle since they will
have been projected down from the higher dimensions. The length of the
vector in the sub-space is related to the amount of variation in that
subject's data explained by those two dimensions of the solution space.
In the graphic displays of these results, an additional menu item Vectors
enables you to plot or suppress the subject vectors if these are becoming
too cluttered.
7.2.2.1 Description of the Algorithm
1.
If the input is in the form of pair comparisons matrices, these
are converted into a "first-score" matrix. Optionally, these may be
centred and/or normalised.
2.
The major and minor product-moment matrices are formed.
3.
The inter-subject and inter-stimuli correlations are calculated.
4.
The p-m matrices are factored by the Eckart-Young procedure to
provide coordinates of the stimulus space and of the subject
vector ends.
5.
The first r columns of the relevant factor matrices are taken.
These form the two configurations output as solution.
7.2.3
FURTHER OPTI0NS
7.2.3.1 Dimensionality
The program lists the latent roots of the matrices. The number
of positive roots will be not greater than the number of stimuli or the
number of subjects, whichever is the smaller. The magnitude of the roots
gives an indication of the amount of variation in the data accounted for by
that dimension. The largest root will always be first and the others will
follow in decreasing order. Some may be zero. An appropriate dimensionality may be chosen by means of the familiar scree-test.
7.2.3.2. Normalising and Centring
With the data in the form of a first score matrix the user may
choose how the matrix is to be centred and normalised using the
parameters CENTRE and NORMALISE. The default for these parameters is
0 and means no action.
Other options allow various courses. CENT(1) instructs the program
simply to subtract the row means. This will, in a rating exercise,
remove any effect due to differences in the actual values used by
particular subjects. NORM(1) allows the program not only to subtract
the row means but also to take out any effect due to differences in the
range or spread of scores involved by normalising each row by dividing it
by its standard deviation.
CENT(2) and NORM(2) perform the same operation on the column elements,
i.e. subtracting column means and column normalising respectively. This
latter option has the effect of taking out the unanimity effect in
subjects judgements and leaving only the significant differences in
judgements (see Forgas (1979)).
CENT(3) instructs the program to double
centre the matrix by subtracting both row and column means.
NORM(3) does
this, and normalises the entire matrix.
7.2.3.3
Weighting of pair comparison matrices
Since pair-wise judgements are often difficult to make, the user may
sometimes wish to accord to each judgement a 'weight'.
This might
represent the degree of confidence which the subject attaches to his
judgement, or perhaps the reliability which the researcher ascribes to
each judgement.
If weights are input then there must be one weights matrix per
subject. The weights matrix immediately follows its associated pair
comparisons matrix. This may optionally be read according to a WEIGHTS
FORMAT statement, which should be suitable for real (F-type) numbers.(For
an example see Section 4.2.) If there is no WEIGHTS FORMAT provided, free
format input is assumed.
7.2.3.3.1 The SAME PATTERN parameter
If, as often happens, there is more than one identical weights
matrix, then the number of such matrices should be specified as the
SAME PATTERN parameter. In this case, the weights matrix follows
the first pair comparisons matrix and is read according to an optional
WEIGHTS FORMAT statement, if it is not in free format. Those pair
comparisons matrices having the same pattern of weights then follow each
other without separation.
7.2.3.4 Blocking of pair-comparisons data
If the number of pair-comparisons judgements has been thought too
great then the researcher may resort to the use of incomplete data, i.e.
certain element-pairs may not be presented to the subjects (see Burton &
Nerlove, 1971). The resulting data-matrix will have 'blocks' missing.
If one of these strategies is used and the data are arranged in blocks
then BLOCK(1) must be specified in the PARAMETERS command so that allowance
can be made in the calculation of row- and column-sums.
7.2.3.5 Interpretation of the solution
The MDPREF program positions the N subject vectors and the p stimulus
points in a space of user-specified dimensionality. Interpretation of
the stimulus configuration should proceed as for any MDS configuration,
although it should be borne in mind that since this is an interval
scaling model, the stimulus points have been positioned to secure maximum
agreement with the subject's vectors. Consequently, interpretation of
the position of stimulus points should be made with regard to the principal
direction(s) and spread of the subject vector ends.
The identification of 'outliers' amongst the subjects by visual
inspection is straightforward.
7.2.3.5.1 ANOVA of Subject Vectors.
Often the subjects belong to a range of groups, and the User is interested
in whether they differ from each other in terms of their subject vectors.
If this is so, the user mustprovide a group-number identification AFTER the
last value in each subject’s line. (These numbers need to be sequential and
start with 1) and signify this by the presence of GROUPS(m) in the
Parameter list (where m is the number of groups). Certain one-, two- and
multi-sample
tests for mean direction are available and give
directional analogues to the analysis of variance. Appendix 2 gives
a brief summary of statistics available in MDPREF and fuller description
may be found in Pearson and Hartley (1972) and Mardia (1972). (See also
Stephens (1962; 1969)).
7.3.
INPUT PARAMETERS
MDPREF allows data to be input in two forms:
1.
A "first-score" matrix in which case an N x p matrix is input.
2.
A set of pair comparisons matrices in which case there will
be N matrices, each p x p.
Options available with each type of option differ.
is chosen by the parameter:
DATA TYPE
Default
0:
1:
2:
3:
4:
The type of input
Data are in a pair-comparisons
matrix.
Data are ranks (I-scales) of column
indices in decreasing order of
preference.
As 1 but in increasing order of
preference.
Data are scores in order of column
indices - high score means low
preference.
As 3 but high scores mean
high preference.
7.3.1 OPTIONS WITH THE FIRST SCORE MATRIX
Keyword
Default
Function
MATFORM
0
GROUPS
0
CENTRE
0
NORMALISE
0
0:
The matrix is saved subjects
(rows) by stimuli (columns).
1: The matrix is saved stimuli
(rows) by subjects (columns).
The number of groups present in an
analysis of variance should be
specified (See Appendix 2).
0: The data are not centred.
1: Row-means only are subtracted.
2: Column means only are subtracted.
3: Matrix is double centred.
0: Matrix is not normalised.
1: Rows are centred and normalised.
2: Columns are centred and normalised.
3: Both rows and columns are centred
and normalised.
7.3.2 OPTIONS WITH PAIRED COMPARISONS MATRICES
Keyword
Default
Function
SAME PATTERN
0
Sets the number of subjects whose
pattern of missing data or weights
matrices are the same.
WEIGHTS
0
0: No weights are input
1: Weights are input
BLOCK
0
0: The data are not arranged in blocks
1: The non-empty cells are arranged
in blocks or are to be treated as
such.
(NOTE: Weights cannot be used with
this option).
MISSING
0
0: There are no missing data
1: There are missing data in the
matrix.
7.3.3 NOTES
1.
READ CONFIG is not valid with MDPREF.
2.
Note that even if only two or three codes are used in the paired
comparisons matrices, the READ CODES command must specify four
codes, which must be in the order specified.
7.3.4 PROGRAM LIMITS
Maximum number of
Maximum number of
Maximum number of
Maximum number of
stimuli
subjects
dimensions
groups
60
100
8
15
7.3.5 PRINT, PLOT AND PUNCH OPTIONS
The general format for PRINTing, PLOTting and PUNCHing output
is described in the Overview. In the case of MDPREF, the options are as
follows.
7.5.1 PRINT options
Option
Form
FINAL
p x r
N x r
FIRST
N x p
Description
The stimulus matrix followed by
the subject matrix.
The first-score matrix. (This is the
input matrix after being modified
i.e. centred/normalised).
Means & standard deviations of
subjects are listed.
CROSS-PRODUCTS
Four matrices are listed:
1. the cross-product matrix
(subjects)
2. "
"
"
"
(stimuli)
3. the correlation(PPM) matrix(subjects)
4. "
"
" (stimuli)
N x N
p x p
N x N
p x p
SECOND
ROOTS
RESIDUALS
N x p
CORRELATIONS
N
The second-score matrix.
The latent roots.
The first-score matrix less the
second-score.
The correlation for each subject
Between the data and the stimulus
projections is listed.
N x p
The default option allows for only the final configuration to
be listed.
7.5.2 PLOT options
Option
SUBJECTS
Description
The n(n-1)/2 plots of the subject
vectors in chosen dimensionalities.
The n(n-1)/2 plots of the stimulus
points in the chosen dimensionalities.
Both of the above.
In this case simply the first-score
plotted against the second-score.
A scree diagram.
Histogram of residual values
A plot showing the average vector of
STIMULI
JOINT
SHEPARD
ROOTS
RESIDUALS
GROUPS
the groups
(if chosen).
The default options allow for the first two dimensions of the joint
space in each dimensionality only to be plotted.
7.3.5.3 PUNCH options
Option
SUBJECT SPACE
STIMULUS SPACE
Description
The final configuration of subjects is saved.
The final configuration of stimuli is saved.
By default, no secondary output is produced.
7.4.
EXAMPLES
7.4.1
EXAMPLE OF A SIMPLE RUN
RUN NAME
TASK NAME
N OF SUBJECTS
N OF STIMULI
DIMENSIONS
PARAMETERS
COMMENT
TEST RUN OF MDPREF
FIRST SCORE OPTION
20
16
2,3
DATA TYPE(1), NORMALIZE(1)
*****
THE PARAMETERS STATEMENT SPECIFIES FIRST SCORE
MATRIX AS INPUT. THIS MATRIX IS TO BE
NORMALISED BY ROW
*****
READ MATRIX
<the 20x16 first score matrix follows here in free format>
PRINT
CROSS-PRODUCTS(2), SECOND(2,3)
COMPUTE
TASK NAME
N OF SUBJECTS
N OF STIMULI
DIMENSIONS
READ CODES
1 0 8 9
COMMENT
PAIRED COMPARISONS OPTION
20
10
2
... WHEREAS THIS ONE REFERS TO THE INPUT MATRICES
NO PARAMETERS STATEMENT IS INSERTED AS
ALL DEFAULT OPTIONS ARE ASSUMED
SHEPARD, RESIDUALS
PLOT
READ MATRIX
<20 square matrices, each of order 10 follow here>
COMPUTE
FINISH
7.4.2
EXAMPLE OF A RUN WITH WEIGHTS ADDED
RUN NAME
TASK NAME
N OF SUBJECTS
N OF STIMULI
DIMENSIONS
PARAMETERS
COMMENT
READ CODES
1 0 8 9
WEIGHTS FORMAT
COMMENT
MORE MDPREF TEST DATA
... THIS TIME WITH WEIGHTS
10
5
2,3
WEIGHTS (1)
default DATA TYPE(0)
(5F2.0)
*****
WE NOW INPUT FOR EACH OF THE 10
SUBJECTS A P-C MATRIX AND A WEIGHTS
MATRIX WITHOUT SEPARATION. NOTE THE
USE OF AN OPTIONAL WEIGHTS FORMAT.IN
THIS CASE IT COULD EQUALLY WELL HAVE
BEEN OMITTED.
*****
READ MATRIX
9 1 1 1 1
0 9 1 1 1
0 0 9 1 1
PAIRED COMPARISONS
0 0 0 9 1
0 0 0 0 9
0 2 1 9 4
3 0 3 6 2
8 5 0 3 1
WEIGHTS
4 8 2 0 9
3 4 5 8 0
<here, without break, follow 9 other such pairs of matrices>
PLOT
SHEPARD (2)
COMPUTE
FINISH
BIBLIOGRAPHY
Bradley, R.A. (1954; 1955) The rank analysis of incomplete block
designs I and II, Biometrika, 41, 502-537 and 42, 450-470.
Burton, M.L. and S.B. Nerlove (1976) Balanced designs for triads
tests: two examples from English, Soc.Sci.Res., 5, 247-67.
Carroll, J.D. (1964) Non-parametric multidimensional analysis of
paired comparisons data, Bell Telephone Labs.
Carroll, J.D. and P. Arabie (1979) Multidimensional scaling in
M.R. Rosenzweig and L.W. Porter (eds.) (1980) Annual Review
of Psychology, Palo Alto Ca. Annual Reviews.
Carroll, J.D. and J.J. Chang (1973) Models and algorithms for
multidimensional scaling, conjoint measurement and related
techniques, Bell Telephone Labs, mimeo (1968) How to Use MDPREF.
David, H.A. (1963)
(Chapter 5).
The method of paired-comparisons, London: Griffin,
Eckart, C. and G. Young (1936) Approximation of one matrix by another
of lower rank, Psychometrika, 1, 211-218.
Forgas, J.P. (1980) Multidimensional scaling: a discovery method in
social psychology, in G.P. Ginsburg, Emergent techniques in social
psychological research, London: Wiley.
Mardia, K. (1972)
Statistics of directional data, London: Academic Press.
Pearson, E.S. and H.D. Hartley (eds.) (1972)
statisticians, vol.II, C.U.P.
Biometrika tables for
Ross, R.T. (1934) Optimum orders for the presentation of pairs in the
method of paired comparisons, J.Educ.Psychol., 25, 375-382.
Slater, P. (1960)
13, 119-135.
The analysis of personal preferences, B.J.Stat.Psych.,
Stephens, M. (1969) Multi-sample tests for the Fisher distribution for
directions, Biometrika, 56, 169-81.
Tagg, S.K. (1980) The analysis of repertory grids using MDS(X),
in Coxon and Davies (eds.) Working papers in multidimensional
scaling, MDS(X) project, Cardiff.
Takane Y., F.W. Young and J. de Leeuw (1977) Nonmetric individual
differences multidimensional scaling. An alternating least
squares method with optimal scaling features, Psychometrika,42,
(1), pp 7-67.
Tucker, L.R. (1955) Description of paired comparisons preference
judgments by a multidimensional vector model, Princeton N.J:
ETS, RM 55-7.
Tucker, L.R. (1960)
Dimensions of preference, Princeton N.J: ETS, RM 60-7.
APPENDIX 1 : THE RELATION OF MDPREF TO PROGRAMS NOT IN NewMDSX
MDPREF is analogous to the INGRID program widely used in the
analysis of repertory grids (Slater, 1960). The use of various MDS(X)
programs in this type of analysis is described in detail by Tagg (1980);
see also Forgas (1979). A similar model is used by Tucker; see Tucker
(1955; 1960). A MDPREF-like model is not included in either ALSCAL
or the G-L series but an approximation is implemented by the Takane-Youngde Leeuw program PRINCIPALS (see Takane et al, 1975).
APPENDIX 2: STATISTICS FOR DIRECTIONAL DATA
A2.1 Definitions
We shall be concerned with differences and similarities between
subjects' preferences, i.e. between the vectors. A sample of vectors
may be thought of as drawn from a population whose overall direction is
the polar vector. The average direction for the sample set of vectors
is called the modal vector. The vector sum of a set of vectors is a
resultant vector and its sum of squares its length (R).
A2.2
Measures of distribution
It is clear that the greater the length of the resultant vector,
the more agreement exists in the sample.
The probability density of distribution of vectors around the polar
vector is given by kappa, high values of which imply a concentrated
symmetrical distribution of vectors around the polar, while a zero value
gives a uniform distribution around the circle or sphere.
Kappa may be estimated from sample data by
K =
N-1 / N-R
where N is the total number of vectors (and also, obviously, the sum of the
lengths of N unit vectors) and R the length of the resultant. Note,
however, that this approximation is only accurate when R/N > 0.7 (i.e.
kappa > 3.3).
A2.3
Tests of significance
A directional analogy to one-way analysis of variance is an
approximate test for comparison of polar vectors from two or more samples.
The parameter 2K(N-R) is distributed approximately as chi-square with
2(N-1) degrees of freedom.
It is possible, arguing from the analogy with analysis of variance,
to partition the chi-square for the concentration of vectors from two
independent samples about a common estimated mean vector. The overall
X<s2>s is the sum of the components from (a) the concentration of vectors
in each sample about their mean vectors, and (b) the concentration of the
two estimated mean vectors.
An approximation to the F-test compares 'between-group' and 'within
group' components. With S samples an F-distribution is approximated by
( ∑ R - R)
i i
−⎯−⎯⎯⎯⎯⎯⎯⎯⎯⎯⎯
(S-1) (N - ∑ R )
i
(N-S)
U
=
In the three-dimensional (spherical) case this statistic has (2S-2)
and (2N-25) degrees of freedom in the numerator and denominator
respectively. In the circular (two-dimensional) case these values are
respectively (S-1) and (N-S).
The statistical theory which would allow us to proceed to a two-way
analysis of variance has not been developed.
A2.4
Input parameters for statistics
statistics are only available with the 'first-score' option. If the
user wishes to use the program to perform the one way analysis (s)he should
specify the number of groups on the GROUPS parameter in the PARAMETERS
statement. Each row of the matrix (i.e. each subject) should then be
assigned to a group. This is done by appending to each row the number of
the group to which that subject is assigned. With free-format input, the
group number is simply added to the end of the corresponding row of the
matrix, separated by a space. The INPUT FORMAT specification, if used,
should be amended to read this number as an integer (I-type) value.
8.
MDSORT (Multidimensional Scaling for SORTing data)
8.1
OVERVIEW
MDSORT expects as input a matrix consisting of a set of N row vectors, one
for each respondent i, arrayed so that each column refers to a given object
j and where the entry f(i,j) consists of the category/group number in which
the object is located by respondent i. The only restriction is that each
stimulus/object must be assigned to one and only one category. The model
implemented in MDSORT is designed specifically for the direct analysis of
free-sorting data, and was developed to generate a joint representation of
objects and subjects' categories, which simultaneously scales and
represents the sorting data.
DATA: 2-way 2-mode data matrix of subjects’ stimulus allocation to own
category („pile-sort“)
TRANSFORMATION: Linear
MODEL: Scalar Product
8.2
DESCRIPTION
See Coxon (1999) for a full description of the Sorting method and its
applications.The basic operation of sorting consists of subjects allocating
a set of objects into categories of their own choosing. The researcher
usually defines a common set of "objects" (stimuli, statements, names,
artefacts, pictures) and then asks typically asks each of the n subjects to
sort the p objects into a subject-chosen number (c) of groups/categories.
The mathematical representation of the sorting is:
the partition of a set of
p
elements into a number ( c ) of cells.
The most important characteristic of a partition is that the categories of
a subject's sorting must be mutually exclusive and exhaustive, i.e. each
object must be sorted into one, and only one, category. This allows an
object to be put into a category by itself, but it explicitly disallows
overlapping categories. Sorting data are therefore, at least initially, at
the nominal level of measurement.
Takane's (1980) model takes the data as a matrix F consisting of a set of N
row vectors, one for each respondent i, arrayed so that each column refers
to a given object/stimulus j, and the entry f(i,j) consists of the
category/group number in which the object is located by subject i. The
categories are in a sequential (but arbitrary) numbering, and respondents
may employ differing numbers of categories in sorting the set of stimuli.
That is:
F = [fij],
(i = 1,...,N;
j = 1,...,p)
where the value of cell fij is the category number, say k, in which object
j occurs in i’s sorting.
The F data matrix is then expanded into a set of individual matrices Gk
each of which is of size p rows and q categories, where q may differ from
subject to subject in free-sorting :
Gk
Where
=
[ gjqk ]
( i = 1,...,N; j = 1,...,p; q = #ci )
gjqk
= 1, 0:
1
0
if object j occurs in subject i's qth category;
otherwise.
Takane (1980) proceeds directly to a joint scaling by decomposing the data
matrix. The major feature of the model is that a decomposition is sought
which simultaneously seeks to locate both the object point locations and
the category centroids for each subject - this being the degree of
individual difference allowed in this model, which thus allows the subjects
to be represented by a series of category centroids, rather than by a
single ideal point.
The intention is to obtain a configuration of stimulus/object points in
such a way that the sum of squared inter-category distances (averaged over
subjects) is maximized under suitable normalization restrictions. MDSORT
determines a matrix X of coordinates of the n objects in a minimal, userchosen dimensionality, r. The squared distances between category centroids
are related by definition to the trace of the product-moment of X, which is
determined so that tr(X'BX)} is maximized, where B is the mean of the sums
of the subject-specific similarity matrices:
N
B = 1 3 Π Gk
N k=1
The subject-specific matrix Π Gk, thus plays an important role in
understanding this process, and is related to the data matrix Gk as
follows:
Π Gk
= Gk(Gk’Gk)-1 Gk’
The (k,j) element of ( GkGk’)is 1 when objects j and k are sorted into the
same group and is 0 otherwise. The(Gk’Gk)-1 matrix scales nonzero elements of
GkGk’ by the size of categories, so that the similarity between two objects
sorted into the same group is inversely related to the size of the
category. The values output for the matrix B are therefore also related to
the sizes of the sorted categories, corresponding to the assumption of
Burton’s (1975) weighted similarity measure G. The raw co-occurrences may
also be output, and may be submitted for comparison to other scaling
routines within NewMDSX.
With the addition of the restriction for the multidimensional case that
X'X = I, the required maximum of tr(X'BX) is the matrix of normalized
eigenvectors of B corresponding to its r dominant eigenvalues and
satisfying the centering requirement by excluding the constant eigenvector.
Once X has been obtained in this way, category centroids for each subject
can be derived from it, in combination with and based on its relationship
to the original input data matrix.
Takane himself points out that however desirable it may be to link the
scaling and representation of the data (e.g. by seeking to reproduce
aspects of subjects’ behaviour in making a sorting), this is not actually
achieved in the model (nor, it should be added, in any similar model). The
MDSORT model maximizes the average sum of squared distances – a useful
technical requirement – but it is hardly likely that subjects themselves
form their categories so that the sum of the intercategory distances is a
maximum.
8.3.1
INPUT COMMANDS
DIMENSIONS
n Integer
This restricts the output to the first n
principal components, in diminishing order
of significance.
N OF STIMULI
n Integer
The number of objects/stimuli sorted,
corresponding to the number of columns in
the input data matrix.
N OF SUBJECTS
n Integer
The number of subjects for which sortings are
Available, corresponding to the number of
rows in the input matrix.
READ DATA
precedes the input data matrix. By default
input is assumed to be in free format. If an
INPUT FORMAT command is used, it must be
specified to read a line of integer values
corresponding to the N OF STIMULI.
LABELS
optionally identify the stimuli in the
output. Labels should contain text characters
only, without punctuation.
followed by a
series of labels
(<= 65 characters),
each on a separate
line
8.3.2
OUTPUT
8.3.2.1 PRINT options (to main output file)
Option
Description
SIMILARITIES
Outputs the matrix B of similarities between
the stimuli derived from the input data.
CLUSTERS
Outputs the set of individual cluster centroids
corresponding to these overall similarities.
CO-OCCURRENCES
Outputs the matrix of raw co-occurrences in categories
of the stimuli.
8.3.2.2
Option
STIMULI
PLOT options
CLUSTERS
(to main output file)
Description
Plots the stimulus configuration, representing the
number of normalized principal components
specified by the DIMENSIONS statement.
Plots the set of cluster centroid configurations
For the individual subjects. If the N OF SUBJECTS is
more than a small number, this option may produce a
rather large output file.
NOTES
1.
READ DATA, N OF STIMULI and N OF SUBJECTS are obligatory in MDSORT.
2.
No secondary output file is produced.
3.
No PARAMETERS are used by MDSORT.
4.
Program limits: STIMULI - 200
DIMENSIONS – 8
8.4 EXAMPLE
RUN NAME
COMPARISONS OF A SERIES OF COMPOSERS
N OF STIMULI 16
N OF SUBJECTS 19
DIMENSIONS
2
PLOT STIMULI
PRINT SIMILARITIES
READ DATA
1 1 2 3 4 4 2 5 6
1 1 2 2 2 3 2 4 4
1 1 2 3 3 2 6 4 4
1 1 2 3 3 4 2 5 5
1 1 2 3 2 3 5 6 5
1 1 2 3 4 4 2 5 5
1 1 1 3 3 3 1 2 2
1 1 2 3 4 4 2 5 5
1 1 2 2 2 2 2 3 3
3 1 2 4 4 4 1 5 1
1 1 2 3 4 4 2 3 5
3 3 4 5 4 4 1 6 6
4 4 5 6 3 6 3 2 1
3 3 4 4 4 5 4 1 2
3 3 4 5 5 4 6 1 2
3 3 4 4 4 5 4 6 6
3 3 4 5 6 7 1 1 1
3 3 4 5 4 6 4 1 1
3 3 4 5 5 5 6 7 7
COMPUTE
FINISH
CLUSTERS
7
5
5
1
6
6
3
6
1
6
6
2
5
5
4
7
7
6
8
7
5
5
6
6
6
3
6
2
6
6
2
6
5
4
7
7
6
8
7
5
1
7
4
1
2
3
2
3
7
2
6
3
6
1
7
3
8
6
4
4
5
6
5
2
5
3
5
5
6
1
2
2
6
1
1
1
6
4
4
5
6
5
2
5
3
3
5
6
2
2
1
1
1
1
1
8
3
7
7
4
7
2
7
3
7
4
2
6
2
5
2
2
2
2
8
3
4
5
4
7
2
7
3
5
4
6
2
5
1
1
1
1
2
OUTPUT
........
SIMILARITY MATRIX DERIVED FROM THE DATA
1
2
1
9
2
10
3
11
4
12
5
13
6
14
7
15
8
16
0.425
0.000
0.408
0.018
0.408
0.035
0.425
0.035
0.013
0.000
0.013
0.000
0.000
0.088
0.000
0.070
0.000
0.000
0.000
0.000
0.000
0.018
0.000
0.000
0.013
0.000
0.031
0.000
0.000
0.000
0.000
0.000
0.000
0.013
0.000
0.013
0.000
0.043
0.013
0.085
0.044
0.120
0.009
0.170
0.120
0.304
........
16
0.000
0.067
EIGENVALUES, CHI SQUARES AND THE CORRESPONDING D.F.
1
2
3
4
5
6
7
8
9
10
11
12
0.847
0.639
0.566
0.503
0.401
0.378
0.343
0.328
0.248
0.216
0.201
0.176
-109.682
-59.682
-48.871
-40.910
-29.964
-27.771
-24.602
-23.245
-16.654
-14.224
-13.108
-11.339
113
111
109
107
105
103
101
99
97
95
93
91
13
14
15
16
0.142
0.125
0.097
0.000
-8.982
-7.834
-5.961
-0.000
STIMULUS COORDINATES
1
2
0.162
0.123
0.622
0.620
-0.065
-0.145
-0.151
-0.129
-0.029
-0.174
-0.145
0.050
-0.010
0.148
-0.168
-0.140
-0.131
-0.152
-0.200
-0.195
0.172
-0.072
-0.068
0.030
0.224
-0.264
-0.217
0.471
0.509
0.301
-0.248
-0.229
-0.051
-0.163
CONTRIBUTION
1
2
3
4
5
6
7
8
9
10
11
12
13
14
15
16
(1)
(2)
(3)
(4)
(5)
(6)
(7)
(8)
(9)
(A)
(B)
(C)
(D)
(E)
(F)
(G)
.......
CLUSTER CENTROIDS FOR EACH SUBJECT
SUBJECT=
1
2
3
4
5
6
7
8
(1)
(2)
(3)
(4)
(5)
(6)
(7)
(8)
SUBJECT=
1
2
3
4
5
1
0.621
-0.047
-0.145
-0.140
-0.174
-0.151
0.063
-0.142
-0.197
0.198
-0.072
-0.019
-0.264
-0.231
0.427
-0.107
0.621
-0.097
-0.137
-0.157
0.063
-0.197
0.064
-0.062
-0.239
0.427
-0.154
-0.142
0.621
-0.065
-0.141
-0.029
-0.160
-0.238
-0.107
-0.197
0.172
-0.037
0.224
-0.240
2
(1)
(2)
(3)
(4)
(5)
.......
SUBJECT= 19
1
2
3
4
5
6
7
(1)
(2)
(3)
(4)
(5)
(6)
(7)
89
87
85
83
8 (8)
0.063
0.427
.......
References
Burton, M.L. “Dissimilarity measures for unconstrained sorting data”,
Multivariate Behavioral Research, 10, (1975) pp. 409-424.
Coxon, A.P.M. (1999) Sorting Data – Collection and Analysis, Quantitative
Applications in the Social Sciences No. 127, SAGE Publications
Takane, Y. “Analysis of categorizing behavior by a quantification method.”
Behaviormetrika, 8, (1980), pp. 75.
Takane, Y. “MDSORT: A special-purpose multidimensional scaling program for
sorting data.” Behavior Research Methods and Instrumentation, 13, (1981),
p.698.
9.
9.1.
MINIRSA (MINI Rectangular Smallest Space Analysis)
OVERVIEW
Concisely: MINIRSA (MINI Rectangular Smallest Space Analysis, or nonmetric Multidimensional Unfolding Analysis)
provides internal analysis of two-way data in a row-conditional
format of a (dis)similarity measure by a Euclidean distance model
using a monotonic transformation of the data.
DATA: 2-way, 2-mode row-conditional preference or dis/similarity data
TRANSFORMATION: monotonic
Following the terminology developed by Carroll and Arabie (1979)
MINIRSA may be described as:
Data:
Two-mode
Two-way
Ordinal
Row conditional
Complete or incomplete
One replication
Model:
Euclidean distance
incorporating
Two sets of points in
One space
The solution is internal
9.1.1 ORIGIN, VERSIONS AND ACRONYMS
The MINIRSA program included in the NewMDSX series is adapted from
Roskam's 1973 release.
9.1.2 BRIEF DESCRIPTION OF MINIRSA
MINIRSA performs a non-metric multidimensional unfolding analysis.
Consider a set of subjects and a set of stimuli where the subjects
indicate their preferences for the stimuli (the judgements need not
be of preference; any asymmetric relation is acceptable). The aim of
the program is to position both stimuli of subjects as points in a
space of minimum dimensionality so that, for each subject, the rank
order of the distances from his or her point of maximum preference in
the space (the "ideal point") to the stimuli matches the subject's
preference ordering as closely as possible.
9.1.3 RELATION OF MINIRSA TO OTHER PROCEDURES IN NewMDSX
MINIRSA analyses preference data by means of an 'ideal point'
or 'point-point' model. That is to say that each subject, or "judge"
is represented in the solution space as a point positioned at his(her)
point of maximum preference. The stimuli are also positioned as
points in the same space so that the nearer a point lies to a given
subject's ideal point the greater is that subject's preference for it.
(By contrast the MDPREF program implements a 'point-vector' model,
where the subjects are represented in the solution space as vectors:
i.e. directions of increasing preference (which is formally equivalent
to having an ideal point at infinity).
MINIRSA is also equivalent to the third phase of PREFMAP except
in so far as MINIRSA provides an internal analysis, that is to say
that both subject and stimulus points are simultaneously positioned
to satisfy the data, whereas in PREFMAP phase 3 the subject points
are inserted into a pre-existing configuration of stimulus points.
(Note, however, that PREFMAP also provides for a quasi-internal
analysis q.v.).
9.2. DESCRIPTION OF THE PROGRAM
9.2.1 DATA
MINIRSA takes data in a 'row-conditional' format. In the simplest
case, a group of N subjects might be asked to rank in order of preference
a set of p stimuli. The judgement may, of course, be a ranking (or rating)
in terms of any suitable criterion of which preference is the intuitively
most obvious example.
The data matrix, then, consists of N rows each of which reflects
a particular subject's order of preference for the stimuli. There are
p columns. The various p ways in which these may be presented are
detailed below (9.2.1.1).
MINIRSA does not accept paired-comparisons data as such but will
take the row sums of such matrices (see MDPREF, Section 7.2.1.2).
9.2.1.1 Ranks or Scores
Preference judgements may be represented for MINIRSA (as in MDPREF
and other procedures) in four distinct ways. The major distinction is that
between a rank and a score. If a subject is asked to write down in his
order of preference for five stimuli, he might respond with:
ACDEB
If these letters (or stimulus names) are given numeric values this
becomes:
13452
This is the rank-ordering method (analogous to Coombs's I-scales) and
means that stimulus 1 is preferred to 3 which is preferred to 4 etc.
Data may be input to MINIRSA in this form by specifying DATA TYPE(1).
In various data-collection techniques it may be that the ordering
obtained begins with the least-preferred stimulus so that the previous
example would in this case be written as: BEDCA, signifying that B
is least preferred, followed by E, and so forth. If this is the case
then the data should be specified as: DATA TYPE(2).
A different way of representing such data is by the 'score' method.
In this method each column represents a particular stimulus and the
entry in that column gives the score or rating of that stimulus
(for that subject) in his 'scale of preference'. Thus, in our original
example the I-scale ACDEB (where A is preferred to C, which is preferred
to D etc.) would in this method be represented as follows:
subject
i
A B C D E
1 5 2 3 4
In this instance, the lowest number ('1') is used to denote the most
preferred stimulus and the highest ('5') to represent the least preferred.
This option is chosen by: DATA TYPE(3). Alternatively, the highest
number might have been used to represent the most preferred stimulus and
if this is so, DATA TYPE(4) should be specified.
(Although in illustrating the score method we have used the number
1 to 5, the data might equally well have been numerical ratings).
Figure 1 provides a simple means of identifying the appropriate
DATA TYPE value.
Figure 1
Are the data
ranks or scores ?
/
ranks
/
Is the first
stimulus the
most preferred ?
/
\
yes
no
|
|
DATA TYPE(0)
DATA TYPE(1)
\
scores
\
Does the highest
value mean most
preferred ?
/
\
yes
no
|
|
DATA TYPE(2)
DATA TYPE(3)
9.2.2 THE MODEL
Coombs (1964) developed the notion of unidimensional unfolding
in which a set of stimuli were so placed along the continuum
(the "J(“joint”)-scale") that a subject might be thought of as being
located at one point (our 'ideal point') in such a way that his or her
preference for the stimuli decreased the further away from the ideal point
a given stimulus is situated. If the J-scale is folded at the ideal point,
this then forms the subject’s I (for “individual”) scale. The point of
Unfolding analysis is to take a set of individual I-scales and unfold them
into a joint scale. In this simple 1-space the fact that the distance from
the subject's ideal point to stimulus a was greater than the distance from
the ideal point to stimulus b implied that the subject preferred stimulus b
to stimulus a. (For a more detailed overview see Appendix 3). The
generalisation to spaces of higher dimensionality is intuitively obvious
though computationally complex. MINIRSA is the program which performs nonmetric multidimensional unfolding in the NewMDSX library.
MINIRSA takes data of the form described and seeks to position
both sets of objects - subjects and stimuli - as points in a space of
minimum dimensionality. The subjects are positioned at their points
of maximum preference: their 'ideal points'. For each subject the
distances to the stimuli will reflect the order of preference as
revealed by the data: the most preferred stimulus will be the nearest
stimulus point to a subject's ideal point, the least-preferred, the
farthest away.
Strictly speaking, this will hold only if the data are 'perfect'
(i.e. fit the given dimensionality) and for all but minimal STRESS
values, some inversions will occur.
It is instructive to consider the contours enclosing areas of
equal preference. In MINIRSA these will describe circles around each
of the subject points (as contrasted, for instance, with PREFMAP phases
I, II, where the contours are ellipses and MDPREF and PREFMAP IV where
the "contours" are straight lines perpendicular to the subject's vector).
9.2.2.1 The Algorithm
1.
If the user does not provide one, the program generates an
initial stimulus configuration (see Appendix 2.5) in which
the subjects are initially placed between their two most
preferred stimuli.
2.
The configuration is normalised.
3.
The distances in the configuration (between each subject and
the stimuli) are calculated.
4.
The fitting values are next calculated following Kruskal's
method of monotone regression.
5.
6.
STRESS2 is calculated (n.b. NOT STRESS1; see below)
If STRESS2 has reached zero or an acceptable minimum then the
configuration is output as solution. If not, then
7.
For each point on each dimension both the direction in which it
should move so that STRESS2 is minimized and the optimal size of
that move (the 'step-size') are calculated.
8.
The configuration is moved in accordance with (7) and the
program returns to step 2.
9.
The solution is rotated to principal axes.
of the origin is also allowed).
(A translation
9.2.2.1.1 MINIRSA and MINISSA
The MINIRSA algorithm differs from the basic MINISSA algorithm
on two major counts.
9.2.2.1.1.1 The monotonicity requirement
Since at step 5 Kruskal's method of calculating the fitting
values is used, the program only enforces the requirement of weak
monotonicity on the fitting value. Specifically, this means that
different data values may be fit by the same fitting values.
9.2.2.1.1.2 STRESS
The input data to MINIRSA is considered to be 'row-conditional'
(i.e. no comparability is assumed between subjects' rankings). Thus
it is inappropriate to calculate STRESS according to the simple STRESS1
formula, but rather a form of STRESS2 is calculated. For each
distinct ranking ("I-scale"), the STRESS2 value is first calculated:
(STRESS2 is used in preference to STRESS1 in order to prevent the
occurrence of degenerate solutions, with fitting values all having the
same value). The overall STRESS2 value is then defined as a weighted
average of the individual STRESS values.
9.2.3
FURTHER FEATURES
9.2.3.1 Missing Data
MINIRSA allows for missing data. The value to be regarded as
indicating a missing value should be specified in the PARAMETERS statement
by means of the MISSING parameter: e.g. if 9 is the code for a missing
datum then MISSING(9) is appropriate.
9.3.
INPUT PARAMETERS
9.3.1 LIST OF PARAMETERS
Keyword
Default Value
DATA TYPE
1
1:
2:
3:
Data are ranks (I-scales) of column
indices in decreasing order of
preference.
As 1 but in increasing order of
preference.
Data are scores in order of column
4:
MINIMUM ITERATIONS
6
MISSING DATA
0
MATFORM
0
9.3.2
(
1. (
(
(
2. (
(
3.
indices - high score means low preference
As 3 but high scores mean high preference
Sets the minimum number of iterations to be
to be performed before convergence test.
Sets the data value which is to be regarded
as missing data.
NOTE: only relevant when 'READ CONFIG' is
used.
0: The input configuration is saved
subjects and stimuli (rows) by dimensions
(columns). Subjects are saved before
stimuli.
1: The input configuration is saved
dimensions (rows) by subjects and
stimuli (columns).
NOTES
# )
N ) OF SUBJECTS may be replaced by
No )
# )
N ) OF STIMULI may be replaced by
No )
(
(
(
(
(
(
#
N
No
#
N
No
)
) OF ROWS.
)
}
) OF COLUMNS
)
See section 6.2.3.2 for details of frequency counts.
9.3.3 PROGRAM LIMITATIONS
Maximum number of subjects
Maximum number of stimuli
Maximum number of dimensions
=
=
=
100
60
5
9.3.4 PRINT, PLOT AND PUNCH OPTIONS
The general format for PRINTing, PLOTting and PUNCHing output is
described in the Overview. In the case of MINIRSA the particular options
are as follows.
9.3.4.1
Keyword
INITIAL
PRINT options
Form
N x r
p x r
FINAL
DISTANCES
FITTING
RESIDUALS
HISTORY
N
p
N
p
N
x
x
x
x
x
r
r
N
p
p
N x p
N x p
(to the main output file)
Description
Two matrices are produced being the
coordinates of the subject points and the
stimulus points in the required dimensions.
Similarly, two solution matrices are listed.
Three matrices are listed:
1.The distances between the subject points.
2.The distances between the stimulus points.
3.The distances between the subjects and the
stimuli.
The matrix of disparities (DHAT's).
The matrix of residuals is listed.
This keyword generates an extremely detailed
history of the iterative process. Users are
warned that this option generates a large
amount of output.
By default only the final configurations and the final STRESS value
are listed.
9.3.4.2 PLOT options
Keyword
SUBJECTS
(to the main output file)
Description
A plot of the subject points only
is produced.
A plot of the stimulus points only
is produced.
The configuration of subject and stimulus
points is plotted.
The Shepard diagram is produced
A histogram of STRESS values at each
iteration is produced.
The contribution of each subject to the
overall STRESS value is plotted.
A histogram of residual values is produced.
STIMULI
JOINT
SHEPARD
STRESS
POINT
RESIDUALS
By default a Shepard diagram and the joint space only are plotted.
9.3.4.2
PUNCH options (to a secondary output file)
Keyword
SPSS
Description
A file suitable for input to SPSS is produced.
The following values appear:
I
: the subject index no.
IFR
: no. of repeat orderings.
0
: the stimulus index no.
INPUT : the datum corresponding to I,J.
FITTING: the corresponding DHAT value.
DIST
: the solution distance between I & J.
RESID : the corresponding residual value.
The format of the file is (4I4,3F10.4)???.
The STRESS values at each iteration are
output in a fixed format.
A file of the final configuration
is produced.
STRESS
FINAL
9.4.
EXAMPLE
RUN NAME
ITERATIONS
DIMENSIONS
N OF SUBJECTS
N OF STIMULI
PRINT
PLOT
READ MATRIX
<data follow here>
COMPUTE
FINISH
MINIRSA TEST DATA
46 I-SCALES FROM 5 CONVEX STIMULI
80
2
46
5
DISTANCES, RESIDUALS
POINT
BIBLIOGRAPHY
Carroll, J.D. and P. Arabie (1979) Multidimensional scaling, in
M.R. Rozenweig and L.W. Porter (eds.) Annual Review of Psychology,
Palo Alto, Ca., Annual Reviews.
Coombs, C.H. (1969)
A Theory of Data, New York: Wiley.
Coxon, A.P.M. (1974) The mapping of family-composition preferences:
a scaling analysis, Social Science Research, 3, 191-210.
Davidson, J.A. (1972) A geometric analysis of the unfolding model:
nondegenerate solutions, Psychometrika, 3, 193-216.
Delbeke, L. (1968) Construction of preference spaces, Louvain:
Publications of the University of Louvain.
Gleason, T.C. (1969) Multidimensional scaling of sociometric data,
Ph.D. thesis, University of Michigan, Ann Arbor, Michigan.
Goldberg, D. and G.H. Coombs (1964) Some applications of unfolding
theory to fertility analysis, in Emerging Techniques in Population
Research, Proceedings of the 1962 Annual Conference of the Milbank
Memorial Fund, New York.
Green, P.E. and F.J. Carmone (1969) Multidimensional scaling: an
introduction and comparison of nonmetric unfolding techniques,
Journal of Marketing Research, 6, 330-341.
Green, P.E. and V.R. Rao (1972) Applied multidimensional scaling,
New York: Holt, Rinehart and Winston.
Niemöller, B. and C. Sprenger (1974) Program MINIRSA: unfolding of
preference data and comparable choice data according to Roskam,
Program Bulletin No.42, Technisch Centrum F.S.W., Universiteitvan Amsterdam.
Roskam, E.E. (1969) Data theory and algorithms for nonmetric scaling,
I,II, (stencil) Psychology Laboratory, Mathematische Psychologie,
University of Nijmegen, Nijmegen, The Netherlands.
------- (1970) Data theorie en metrische analyse, Ned. Tijdschrift Voor
Psychologie, 25, 15-54 and 66-82.
------- (1975) Nonmetric data analysis: general methodology and technique
with brief descriptions of miniprograms. Report No.75-MA-13.
Nijmegen, The Netherlands: Psychology Laboratory, Mathematische
Psychologie, University of Nijmegen.
Singson, R.L. (1973) A multidimensional scaling and unfolding analysis
of store image and shopping behavior, Ph.D. thesis, University of
Washington, Seattle, Washington.
Young, F.W. and R. Lewyckyj (1979) ALSCAL-4 Users' Guide, Carrboro,
N.C.: Data Analysis and Theory Associates.
APPENDIX 1:
RELATION OF MINIRSA T0 OTHER PROGRAMS NOT IN NewMDSX
Internal multidimensional unfolding analysis, implemented by
MINI-RSA, is also implemented by the SSAR-II program in the GuttmanLingoes series and in Young and Lewyckyj's ALSCAL IN SPSS-4 package (with
parameters set so that the measurement level is ordinal and the data
type is rectangular and row-conditional).
More general variants are also possible in these packages. The
Guttman-Lingoes programs permit other types of conditionality (see
Lingoes 1972, pp 57-59) and ALSCAL IN SPSS-4 allows other levels of
measurement (see Young and Lewyckyj 1979, p 23).
10.
MINISSA (Michigan-Israel-Nijmegen Integrated Smallest
Space Analysis)
OVERVIEW
Concisely: MINISSA (Michigan-Israel-Nijmegen Integrated Smallest
Space Analysis) provides internal analysis of a two-way symmetric matrix
of (dis)similarities by means of an Euclidean distance model using a
monotone transformation of the data.
DATA: 2-way, 1-mode dis/similarity measures
TRANSFORMATION: Monotonic
MODEL: Euclidean distance
Following the categorisation developed by Carroll and Arabie (1979)
the program may be fully described as:
Data:
One mode
Two-way
Dyadic
Ordinal
Unconditional
Complete
One replication
Model:
Minkowski metric (restricted)
One set of points
One space
Internal
10.1.1 ORIGIN AND VERSIONS OF MINISSA
NewMDSX for Windows offers MINISSA(N), a fast, efficient version of
the basic Guttman-Lingoes MINI-SSA program with a limited number of user
options. This version emanates from Nijmegen and is part of Roskam's
KUNST library of MDS programs. In particular, MINISSA(N) embodies the
changes and improvements outlined in his classic monograph (Lingoes and
Roskam 1973)integrating the Bell and Michigan traditions of basic nonmetric scaling.
MINISSA(M), based upon the original SSA program in the Michigan
(Guttman-Lingoes) series, contains a large number of user options, and
is less easy to use than MINISSA(N). It was referred to as SSA(M) in the
original MDS(X) series.
10.1.2
BRIEF DESCRIPTION OF MINISSA
MINISSA performs what is known as the basic non-metric model of MDS by
taking (the lower triangle of) a square symmetric matrix whose elements are
to be transformed to give the distances of the solution. This
transformation will preserve the rank order of the input data. The model
is formally equivalent to that developed by Kruskal (1964) although MINISSA
uses a hybrid computational approach to the minimization problem, involving
techniques originated by both Kruskal and Guttman. This approach is
efficient and succeeds better than other programs in avoiding suboptimal
solutions (Lingoes and Roskam 1973).
10.1.3
RELATION TO OTHER PROCEDURES IN NewMDSX
The MINISSA method and algorithm also forms the basis of MRSCAL. In
MRSCAL it is assumed that there is a linear or power relation between the
data and the solution distances output from MINISSA may be used as input
for PINDIS.
10.2. DESCRIPTION OF THE PROGRAM
10.2.1 DATA
MINISSA accepts as input either the lower triangle (without diagonal)
or a full square symmetric data matrix. Each entry of this input matrix is
a measure of (dis)similarity between the row-element and the column
element. Commonly these are pair-wise ratings of similarity, but any
symmetric measure may be used (including correlations, covariances if they
are non-negative) and co-occurrences.
The aim of the algorithm is to position the elements as points
in a space of minimum dimensionality so that a measure of departure
from perfect fit between the (monotonically) rescaled data and the
distances of the solution (STRESS) is minimised. Perfect fit occurs
if a monotone transformation of the data can be found which forms a
set of actual distances.
10.2.1.1 Example
Benjamin(1958) collected data on the social mobility of some 2600
subjects using thirteen occupational categories. Macdonald, used the index
devised by Blau and Duncan (1967, p.43) to measure the dissimilarity in
mobility between occupational groups. (For a fuller description of this
index see section 2.3.3.4 of the Users' Guide). The measure, writes
Macdonald (1972, pp.213-14) may be interpreted as "the percentage of the
sons of (group) A that would have to be reallocated jobwise for the sons of
A to match the sons of B". He assembles the index values into a lower
diagonal matrix, and these are included in the example described in
section 4. The scaling solution is discussed at length in Macdonald's
article.
10.2.2 THE ALGORITHM
1.
An initial configuration is input by the user, or one is
generated by the program (see 7.2.3.2 below).
2.
This configuration is normalised (see 7.2.2.2 below).
3.
The distances between the points are calculated according to
the Minkowski metric chosen (see 7.2.3.3 below).
4.
The disparities or fitting-values are calculated (see 7.2.2.1).
5.
STRESS, the index of badness-of-fit between the disparities
and the distances, is calculated.
6.
A number of tests are performed to determine whether the
iterative process should continue, e.g.
Is STRESS sufficiently low ?
Has the improvement of STRESS over the last few iterations
been so small as to be not worth continuing ?
Has a specified maximum number of iterations been performed ?
If the answer to any of these is YES, then the configuration is
output as solution. If not, then
7.
For each point on each dimension the direction in which it would
have to move for STRESS to be minimized is calculated as is the
optimal size of the move (the 'step-size').
8.
The configuration is moved in accordance with 7 and the program
returns to step 2.
10.2.2.1 Minimization, fitting values
In MINISSA there are two methods of finding the minimum STRESS
value. These are known in Guttman's (1968) terminology as soft and
hard squeeze methods. The program begins by using the soft squeeze
which minimizes raw STRESS and when this has reached a minimum
switches to the hard squeeze and minimizes STRESS1. By convention
different fitting values (step 4) are used in the different phases.
10.2.2.1.1 Soft squeeze
Soft squeeze derives from a technique of Guttman's (1968). It
is particularly efficient at quickly reducing STRESS. Fitting values
are calculated using a procedure known as rank-image permutation.
These fitting values are known as d* (DSTARS) and have the property of
being strongly monotone with the data. That is to say that unequal
data values must be matched with unequal fitting values (formally if
δij > δkl
then d*ij > d*kl ).
10.2.2.1.2 Hard squeeze
When a minimum has been reached using the soft squeeze the program
switches to the so-called hard squeeze, which is a simpler, more wellbehaved method. Fitting values are now calculated using a procedure
^
known as monotone (or isotonic) regression and are known as d (DHATS).
These have
the property of being weakly monotone with the data in that unequal
data may be matched with equal fitting values if in so doing STRESS
^
is reduced (formally, if
To summarise:
δ
ij
>
δ
kl
SOFT SQUEEZE
(initial method)
then
d
≥
ij
^
d
kl
).
HARD SQUEEZE
(second method)
Minimizes:
Raw Stress
STRESS1
Using:
*
d (DSTAR)
^
d (DHAT)
Relation to
data:
strongly
monotone
weakly
monotone
Users who wish to vary the combination of fitting values with
methods are referred to SSA(M).
10.2.2.2 STRESS and normalization
In the so-called 'soft-squeeze' the program minimizes raw STRESS
(otherwise known as raw phi, or STRESS0 ) which is simply the sum of
the squared differences between the distances in the configuration
and the DSTAR's, i.e. Σij (dij
- d*ij)2. Since this index might be
minimized by successive scaling down of the overall size of the
configuration, the configuration is normalised after each iteration.
In the so-called 'hard-squeeze' however, STRESS1 is calculated
and minimized. STRESS1 is simply a normalized form of raw STRESS,
the normalizing factor being the sum of the squared distances in the
configuration. This removes the dependence of the original index on
the size of the configuration. Values for STRESS of both flavours
are output by the program.
10.2.2.2.1 Step-size and angle factor
At step 7, the algorithm computes the direction in which each
point should be moved in order to reduce STRESS. This is done by
calculating the partial derivation of STRESS with respect to each
point - the negative gradient. It is also important however correctly
to compute the optimal amount of movement in that direction. This
is the so-called 'step-size'. This step-size may be changed at each
iteration. These changes are monitored by the 'angle factor', which
is in effect the cosine of the angle between successive gradients, i.e.
the correlation between them. This ensures that, as the program moves
towards convergence, and the gradient becomes less steep the step-size
will decrease, so as to minimize the possibility of overshooting a
minimum STRESS value. MINISSA prints out at termination the final angle
factor. At this stage the value ought to be very small. If it is large,
then more iterations should be attempted.
10.2.3
FURTHER OPTIONS IN MINISSA
10.2.3.1 Ties in the data
It is possible to treat ties in the data in two ways when calculating
STRESS. These are known as the primary and secondary approaches and are
chosen by the user, by means of TIES on the PARAMETERS command.
10.2.3.1.1 The primary approach (TIES (1))
The primary approach allows that if two data elements are equal
then the assigned fitting values may be unequal The tie is broken if,
in so doing, STRESS is reduced. Substantively this approach regards ties
in the data as relatively unimportant. It is, of course, possible for
the program to capitalise on this approach to produce a 'good', though
degenerate configuration. If data contain a lot of ties and the program
is using the primary approach then long horizontal lines will appear in
the Shepard diagram. A number of such horizontal lines is a sign of
possible degeneracy in the solution.
10.2.3.1.2 The secondary approach (TIES (2))
On the other hand, the secondary approach regards the equality of
data elements as important information and requires that the fitting
values be equal for equal data. This constraint is more stringent than
the primary approach and will normally result in higher STRESS values.
10.2.3.1.3 The parameter EPSILON
A further approach to tied data is given by means of EPSILON on the
PARAMETERS command. Each pair of data values will be compared and, if the
difference between them is less than this value they will be regarded as
tied. This approach is recommended if the user wishes to place little
emphasis on the smaller variations in the data.
For a full description of options regarding ties and the preservation
of order information, see the Users' Guide section 3.2.3. The user wishing
to combine a particular approach to ties with a particular type of fitting
value is referred to the options available in SSA(M) mentioned in the
Appendix below.
10.2.3.2 The initial configuration
The values of a 'good' starting point for the iterative process
include saving on machine time and avoidance of local minima. Two options
exist within MINISSA for the choice of initial configuration:
The user may supply a starting configuration. This may be a guess
at the solution, an a priori configuration or a solution to a previous
metric scaling. The matrix of coordinates is preceded by a READ CONFIG
command, which may if necessary have associated with it an optional INPUT
FORMAT specification to read real (F-type) values. The configuration may
be input either stimuli (rows) by dimensions (columns) or dimensions (rows)
by stimuli (columns). (In this latter case, the parameter MATFORM should
be given the value (1) in the PARAMETERS command).
Alternatively, the program will generate a starting configuration
with desirable numerical properties. This configuration is the usual
one in the Guttman-Lingoes-Roskam MINI programs and uses only the ordinal
properties of the data. It has been found to be particularly useful in
avoiding problems with local minima. Further details justifying this
choice of initial configuration will be found in Lingoes and Roskam
(1973, pp.17-19), and Roskam (1975, pp.37-44).
10.2.3.3
Distances in the configuration
The user may choose how the distances between the points in the
configuration are to be computed by the MINKOWSKI parameter. The
default of 2.0 gives the ordinary Euclidean metric and 1.0 gives a
'city-block' metric but any positive number may be used. It is however
unwise to use large values as there is then a risk of overflow.
10.2.3.4
The final configuration
When the iterative process is terminated, the current configuration
is output as the solution.
If the metric is Euclidean (i.e. MINKOWSKI(2))
then the configuration is rotated to principal axes.
It should be noted
that these axes are arbitrary from the point of view of interpretation,
but have certain desirable geometric properties. In particular the
coordinates of the points on the axes are uncorrelated. Furthermore
it is often helpful in deciding on the 'correct' dimensionality of the
solution to notice how much variation is associated with each axis.
This variation is given in the output by the value SIGMA which is the
standard deviation of the coordinates on each axis.
10.2.3.5 STRESS and dimensionality
The estimation of the appropriate dimensionality of an MDS solution
is central to the analysis. Three methods are commonly used with MINISSA
in addition to that involving SIGMA alluded to above.
The first guideline (attributed to Forrest Young) asserts that the
ratio between the number of data elements and the number of latent
parameters (i.e. coordinates) should be at least two. This compression
ratio should serve as a useful guide when choosing the dimensionalities for
a run of the program.
The second is a heuristic device analogous to the familiar "scree
test" of factor analysis. STRESS should decrease with increasing
dimensionality until in n-2 dimensions a perfect (though trivial) fit
will be achieved. If a graph is drawn of STRESS against dimensionality it
is a common occurrence to find an 'elbow' - a sharp decrease in STRESS
between dimensions occurring at some relatively low dimensionality. At
this value, to add dimensions will not significantly improve the fit of
data to solution so it is reasonable to attempt interpretation of this
solution.
If however 10 and 60 points are being used and the dimensionality is
less than or equal to 5 the program will print a value of STRESS1 based
on an approximation to random data as detailed in Spence (1979).
10.2.3.6 Local minima
For a given set of data each configuration will have an associated
STRESS value. The MINISSA procedure finds the 'best' configuration,
by finding the partial derivatives of STRESS (with respect to the
coordinates). It is possible that a given STRESS value, although locally
the minimum attainable, may not be the real 'global' minimum.
As mentioned earlier both a good initial configuration and a hybrid
algorithm (such as MINISSA) tend to decrease the possibility of local
minima occurring. Relatively high STRESS values may be a sign of local
minima as would a decrease in STRESS in decreasing dimensionality.
If the user suspects local minima, then it is suggested (s)he try a
number of different starting configurations.
10.3. INPUT PARAMETERS
All parameter keywords may be shortened to the first four letters.
All subsequent mis-spellings are ignored.
10.3.1
LIST OF PARAMETERS
Keyword
DATA TYPE
Default Value
0
0:
1:
2:
3:
Function
The data are similarities
(high values mean high similarities
between points) – input is lower
triangle matrix without diagonal
The data are dissimilarities
(high values mean high
dissimilarities between points) –
input is lower triangle without
diagonal
The data are similarities – input
is full symmetric matrix
The data are dissimilarities –
input is full symmetric matrix
MINIMUM ITERATIONS
6
Sets the minimum number of iterations
to be performed before the
convergence test.
EPSILON
0.0
Data are to be considered tied
if difference between them is less
than EPSILON.
MATFORM
0
TIES
1
(Only relevant when 'READ CONFIG'
is used).
0: The input configuration is saved
stimuli (rows) by dimensions
(columns).
1: The input configuration is saved
dimensions (rows) by stimuli
(columns).
1: Primary approach to ties in the
data.
2: Secondary approach to ties in the
data.
1: Distances in the configuration are
measured by 'city-block' metric.
2: Distances are measured by a
Euclidean metric.
Any positive number may be used.
MINKOWSKI
2.0
10.3.2 NOTES
( # )
1. ( N ) OF STIMULI may be replaced by
( NO )
( # )
( N ) OF POINTS
( NO )
2.
( # )
( N ) OF SUBJECTS
( NO )
is not valid.
3.
LABELS followed by a series of labels (<= 65 characters), each on
a separate line, optionally identify the stimuli in the output.
Labels should contain text characters only, without punctuation.
4.
Note that the program expects real (F-type) numbers. The data
should be input as the lower half of a matrix without diagonal.
The INPUT FORMAT statement, if used, should read the longest row of
this matrix (i.e. n-1 values when there are n stimuli).
5.
Note that MINISSA expects (dis)similarities and is not intended to
work with negative values.
6.
Program limits:
Maximum number of stimuli
Maximum number of dimensions
=
=
80
8
10.3.3 PRINT, PLOT AND PUNCH OPTIONS
The general format for PRINTing, PLOTting and PUNCHing output is
described in the Overview. In the case of MINISSA, the available options
are as follows:
10.3.3.1
PRINT options
(to the main output file)
Option
INITIAL
p
FINAL
p x r matrix
DISTANCES
lower triangular,
with diagonal
FITTING
lower triangular,
with diagonal
lower triangular,
with diagonal
RESIDUALS
HISTORY
Form
x r matrix
Description
Initial configuration, either generated
by the program or input by the user
(p = no. of stimuli).
Final configuration, rotated to
principal components.
Solution distances between points,
calculated according to MINKOWSKI
parameter.
Fitting values: the disparities
(DHAT) values.
The difference between the distances
and the disparities.
An iteration by iteration history
of STRESS and values.
By default only the final configuration and the final STRESS values
are listed.
10.3.3.2
Option
INITIAL
FINAL
SHEPARD
STRESS
PLOT options
(to the main output file)
Description
Up to r(r-1)/2 plots of the
initial configuration. (r = no. of
dimensions).
Up to r(r-1)/2 plots of final
configuration (r = no. of dimensions).
The Shepard diagram of distances
plotted against data. Fitting values
are shown by *, actual data/distance
pairs by 0.
Plot of STRESS values by iteration,
with a final plot of stress by the
number of dimensions.
POINT
Histogram of point contributions to
STRESS.
Histogram of residual values.
RESIDUALS
By default, the Shepard diagram and the final configuration will be
plotted. Configuration plots are calibrated both from 0 to 100 and from 0
to the maximum coordinate value.
10.3.3.3 PUNCH options
(secondary output file)
Option
SPSS
Description
Outputs I (Row index), J (Column
index) and corresponding DATA,
DISPARITIES, DISTANCES, RESIDUALS
values in the format:(2I3,4F12.0).
FINAL
Outputs final configuration as
stimuli(row) by dimension(column)
matrix.
Each row is prefaced by the stimulus
number. Format: (I4, rF10.0) where
r is the number of dimensions.
Outputs STRESS value by iteration.
STRESS
By default, no secondary output is produced.
10.4.
EXAMPLE
RUN NAME
TASK NAME
N OF STIMULI
DIMENSIONS
INPUT FORMAT
PARAMETERS
READ MATRIX
<data>
PRINT
PLOT
COMPUTE
FINISH
RUN NAME
TASK NAME
N OF STIMULI
DIMENSIONS
PARAMETERS
INPUT FORMAT
LABELS
8 POINT ZERO STRESS DATA
AS MADE FAMOUS BY USERS GUIDE
8
2
(7F4.0)
TIES(2), DATA(1)
ALL
SHEP(2)
OCCUPATIONAL DISSIMILARITY DATA
AS IN SEC. 2.1.1
13
5 TO 1
DATA(1)
(12F5.0)
FARMERS
AGRICULTURAL WORKERS
HIGHER ADMIN ETC
OTHER ADMIN ETC
SHOPKEEPERS
CLERICAL WORKERS
SHOP ASSISTANTS
PERSONAL SERVICE
FOREMEN
SKILLED WORKERS
SEMI-SKILLED WORKERS
UNSKILLED WORKERS
ARMED FORCES
READ MATRIX
51.1
71.4 75.8
63.0 52.7
58.6 57.7
67.0 55.6
63.4 52.3
54.5 43.3
71.2 47.5
65.2 44.3
65.7 43.0
60.1 34.2
66.7 41.9
PLOT
COMPUTE
FINISH
36.9
40.8
38.6
39.4
55.5
56.5
62.3
68.2
69.4
62.7
32.3
17.7
13.4
29.3
26.2
33.0
39.0
39.8
36.1
38.2
27.8
41.1
41.0
45.1
50.8
51.9
44.6
27.3
35.0
35.6
42.1
47.3
47.2
42.7
23.5
21.1 36.1
27.4 32.0
33.3 36.0
35.5 30.4
29.0 35.9
SHEP(2)
14.7
15.7
23.9
21.2
8.4
21.1
20.7
19.3
18.4
18.9
BIBLIOGRAPHY
Andrews, D. F. (1972) Plots of high-dimensional data,
Biometrics, 28, 125-136.
Bailey, K. D. (1974) Interpreting smallest space analysis,
Sociol. Meth. and Res., 3, 3-29.
Barlow, R. E., D.J. Bartholomew, J. M. Brenner and H. D. Brunk (1972)
Statistical inference under order restrictions, New York: Wiley.
Benjamin, P.
(1957) Intergenerational differences in occupation,
Population Studies, 11, 262-8.
Blau, P.M. and O. D. Duncan (1967)
New York: Wiley.
The American Occupational Structure,
Carroll, J. D. and P. Arabie (1980) Multidimensional scaling, in
M. R. Rozenzweig and L. W. Porter ieds.) Annual review of psychology,
Palo Alto, Ca., Annual Reviews.
Coxon, A. P. M. and P. M. Davies (eds.)(1980)
scaling, London: Macmillan.
Readings in multidimensional
Everitt, B.S. and P. Nicholls (1974) Visual techniques for representing
multivariate data, The Statistician, 24, 37-49.
Guttman, L. (1968) A general technique for finding the smallest coordinate
space for a configuration of points, Psychometrika, 33, 469-506.
Hubert, L. (1974) Some applications of graph theory and related
non-metric techniques to problems of approximate seriation: the
case of symmetric proximity measures, Br. j. Math. and Stat. Psych.,
27, 133-153.
Kendall, D. G. (1971b) Seriation from abundance matrices, in Hodson et al
1971 (op cit), reprinted in Coxon and Davies op. cit.
Kruskal, J. B. (1964) Multidimensional scaling by optimizing goodness of
fit to a nonmetric hypothesis, Psychometrika, 29, 1-27, reprinted in
Coxon and Davies op. cit.
Kruskal, J. B. (1964) Nonmetric multidimensional scaling: a numerical
method, Psychometrika, 29, 115-129, reprinted in Coxon and Davies, op.
cit.
Kruskal, J.B. and J.D. Carroll (1969) Geometric models of
badness-of-fit functions, in P.R. Krishnaiah (ed.)
Multivariate Analysis II, New York: Academic Press.
Lingoes, J.C. (1977) Identifying directions/regions in the space
for interpretation.
Lingoes, J.C. and I. Borg (1979) Identifying spatial manifolds for
interpretation, in J.C. Lingoes et al, 1979.
Lingoes, J.C. and E.E. Roskam (1973) A mathematical and empirical
study of two multidimensional scaling algorithms, Psychometrika, 38,
(supplement), reprinted in Lingoes, Roskam and Borg (eds.) op. cit.
Lingoes, J.C., E.E. Roskam and I. Borg (1979) Geometrical representations
of directional data, Ann Arbor: Mathesis Press.
MacDonald, K.I. (1972) MDSCAL and distances between socio-economic
groups, in K. Hope (ed.), The Analysis of Social Mobility,
Oxford: Clarendon Press.
Rabinowitz, G.B. (1975) An introduction to nonmetric multidimensional
scaling, Am. Journ. Pol. Sci., 19, 343-390.
Roskam, E.E. (1975) Non-metric data analysis: general methodology
and techniques, The Netherlands: University of Nijmegen
Report 75-MA-13.
Shepard, R.N. (1962) The analysis of proximities: multidimensional
scaling with an unknown distance function (parts 1 and 2),
Psychometrika, 27, 125-246.
Spence, I. (1979) A simple approximation for random rankings stress values.
Multivariate Behavioral Research, 14, 355-365, reproduced in In
A.P.M. Coxon and P.M. Davies (Eds.), Key texts in multidimensional
scaling. London: Heinemann.
Wagenaar, W.A. and P. Padmos (1971) Quantitative interpretation of stress
in Kruskal's multidimensional scaling technique, Brit. J. Math.
Statist. Psychol., 24. 101-110, reprinted in Coxon and Davies op. cit.
APPENDIX : RELATION OF MINISSA TO OTHER PROGRAMS
The MINISSA program merges the two main traditions of basic
non metric MDS: the Shepard-Kruskal approach (using monotone regression,
weak monotonicity and minimising STRESS ) and the Guttman-Lingoes
approach (using rank images, strong monotonicity and minimising raw
STRESS). The former was implemented in the original MDSCAL program, and
the latter in the Guttman-Lingoes SSA-1 program. Both of these programs
are now outdated and have been withdrawn.
The basic model is now implemented as the default option by a
number of general purpose programs: KYST (the successor to MDSCAL),
TORSCA (for Torgerson Scaling) and ALSCAL-4 (the successor to POLYCON).
The chief advantages of MINISSA are its small size and speed of
computation and its resistance to suboptimal solutions.
11.
MRSCAL (MetRic SCALing)
11.1.
OVERVIEW
Concisely: MRSCAL (MetRic SCALing) provides internal analysis
of a two-way data matrix by means of a Minkowski distance model
using either a linear or a logarithmic transformation of the data.
DATA: 2-way, 1-mode dissimilarity measure
TRANSFORMATION: Linear or Logarithmic transform
MODEL: Minkowski distance model
Following the categorisation developed by Carroll and Arabie
(1979) MRSCAL may be described as:
Data:
One mode
Two-way
Dyadic
Unconditional
Complete
One replication
Model:
Minkowski metric
One set of points
One space
Internal
11.1.1 ORIGIN AND VERSIONS OF MRSCAL
The MRSCAL program is the basic metric distance scaling program
in Roskam's MINI series. The MRSCAL program in the NewMDSX series is
based upon the 1971 and KUNST (1977) versions.
11.1.2 BRIEF DESCRIPTION OF MRSCAL
The MRSCAL algorithm is a metric counterpart to MINISSA. Its
aim is to position a set of stimulus objects as a set of points in a
space of minimum dimensionality in much the same way as MINISSA, except
that the distances in this space will be a linear (or optionally a
logarithmic) function of the dissimilarities between the stimuli.
In this it has obvious similarities to 'classic' MDS (Richardson 1938,
Young and Householder 1938) and to the linear (metric) scaling procedure
developed by Messick and Abelson (1956) and made more widely known
by Torgerson (1958). The MRSCAL algorithm however, utilises the iterative
procedures which Guttman, Lingoes and Roskam (1971) developed and also
allows the user additional options, both in the manner by which the
distances in the solution space are measured (see Section 2.2.2) and
in the form of the transformation function linking data to distances
in the solution (see Section 2.2.4) which make it both more general
and more robust than the original procedures.
11.1.3 RELATION OF MRSCAL TO OTHER PROCEDURES IN NewMDSX
MRSCAL is an exact metric counterpart to MINISSA, differing from
it in that it restricts the field of possible transformation of the
data to linear (or power) ones.
Output from MRSCAL may be input to PINDIS.
11.2. DESCRIPTION
MRSCAL accepts as input the lower triangle (without diagonal) or
a square symmetric data matrix. Each entry of this matrix will be a
measure of the (dis)similarity between the row-element and the column
element. If the linear transformation option is chosen it should be
borne in mind that product moment correlations and covariances may not be
acceptable in that they are only monotonically (and not
linearly) related to distance.
The aim of the algorithm is to position these elements as points
in a space of minimum dimensionality such that a STRESS-like measure
of departure from perfect fit (Guttman’s coefficient of alienation) between
the (linearly) rescaled data and the distances in the solution is
minimised. A perfect fit occurs if a linear (or logarithmic)
transformation of the data is found which is a set of actual distances.
11.2.1.1 Example
Benjamin (1958) collected data on the social mobility of some 2600
subjects using thirteen occupational categories. Macdonald, who
investigated the notion of social distance, uses the Dissimilarity Index
devised by Blau and Duncan (1967, p.43) to measure the dissimilarity in
mobility between occupational groups. (For a fuller description of this
index see section 2.3.3.4 of the Users' Guide). The measure, writes
Macdonald (1972, pp. 213-14) may be interpreted as "the percentage of
the sons of (group) A that would have to be reallocated jobwise for
the sons of A to match the sons of B". He assembles the index values
into a lower diagonal matrix, and these are included in the examples
described in section 4. The scaling solution is discussed at length
in Macdonald's article.
11.2.2 THE ALGORITHM
The program proceeds as follows.
1.
An initial configuration is input (or one may be generated by
the program (see 2.2.1 below)).
2.
The configuration is normalised.
3.
The inter-point distances are calculated according to the
Minkowski metric chosen by the user (see 2.2.2 below).
4.
A set of fitting quantities are computed that are
i)
a linear (or power) transformation of the data;
ii)
a least-squares best-fit to the distances.
and
5.
The coefficient of alienation between the fitting-quantities
and the distances is computed.
6.
A number of tests is performed to determine whether the iterative
process should continue; e.g. Is STRESS sufficiently low?
Has the improvement in STRESS over the last few iterations been
great enough to warrant continuing ? Has a specified maximum
number of iterations been performed ?
If not, then the gradient is computed. This gives for each
point on each dimension the direction in which that point
should be moved on that dimension in order that STRESS be
minimized.
7.
8.
If the gradient is zero then the configuration is output as
solution.
9.
If not, then the points are moved in accordance with (7) and
the program returns to step 2.
11.2.2.1 Initial configuration
The user may provide a starting configuration by means of the
Command READ CONFIG, with an associated INPUT FORMAT specification if
the data are not in free format. In this case a coordinate for each point
on each dimension is input. This may be done either by stimuli (rows) by
dimensions (columns) or dimensions(rows) by stimuli (columns).
In this latter case the parameter MATFORM should be given the value 1
in the PARAMETERS command.
If this is not done, however, then the program constructs an
initial configuration from the original data by the Lingoes-Roskam
procedure which, as has often been shown, is a good initial approximation
of a solution and also has certain desirable geometrical properties.
11.2.2.2 Distances in the configuration
The user may choose the way in which the distance between the
points in the configuration is measured by means of the MINKOWSKI
parameter. The default value 2 provides for the ordinary Euclidean
metric where the distances between two points will be the length of
the line joining them. The user may specify any value for the parameter.
Commonly used values, however, include 1, the so-called 'city-block'
or 'taxi-cab' metric where the distance between the two points is the
sum of the differences between their co-ordinates on the axes of the
space, and infinity (in MRSCAL approximated by a large number (>25))
the so-called 'dominance' metric when the largest difference on any
one axis will eventually come to dominate all others. (Users are
warned that high values of MINKOWSKI are liable to produce program
failure due to overflow).
11.2.2.3 STRESS and the coefficient of alienation
The family of STRESS formulae for the MINI series is based on
the sum of the squared differences between the fitting-values and the
distances. In MRSCAL, since the fitting-values are at interval level,
a product-moment form is applicable, represented by MU which is the
correlation between the distances and the fitting-values, and is hence
a measure of goodness of fit. In addition, a related badness of fit
measure very similar to STRESS is calculated, known as the coefficient
of alienation, K. The two measures used in MRSCAL are related by:
K
=
(1-MU2 )
11.2.2.3.1 Angle factor and step-size
At step 7, the algorithm computes the direction in which each
point should be moved in order to reduce STRESS. This is done by
calculating the partial derivative of STRESS with respect to each
point - the negative gradient. It is also important, however correctly,
to compute the optimal amount of movement in that direction. This is
the so-called 'step-size'. This step-size may be changed at each
iteration. These changes are monitored by the 'angle factor', which
is in effect the cosine of the angle between successive gradients,
i.e. the correlation between them. This ensures that, as the program
moves towards convergence, and the gradient becomes less steep the
step-size will decrease, so as to minimize the possibility of
overshooting a minimum STRESS value. MRSCAL prints out at termination
the final angle factor. At this stage the value ought to be very small
if it is large, then more iterations should be attempted.
11.2.2.4
Linear and logarithmic transformations
The most common use of MRSCAL is to find a linear transformation
of the data which best fits a configuration of points in the chosen
dimensionality. The program will also, however, perform an analysis
using logarithmic transformations of the data values. In this case
the Shepard diagram will show a smooth exponential curve. The user must
specify which transformation is required. If no PARAMETERS statement is
read and/or no specification of the transformation made, then no
analysis will be performed.
11.2.3
FURTHER FEATURES
11.2.3.1 The CRITERION parameter
In step 6 of the algorithm a number of stopping tests are
performed. One of these involves calculating the improvement in
fit between the present and the previous iteration. If the improvement is
less than the value given by CRITERION in the PARAMETERS statement, then
the process is terminated and the current configuration is output as
solution. A large value for CRITERION will have the effect of stopping the
iterative process earlier than would otherwise be the case. This allows
the user to make more “cheaply” a number of exploratory analyses.
11.2.3.2 The final configuration
When the iterative process is terminated, the current configuration
is output as the solution. If the metric is Euclidean (i.e. MINKOWSKI (2))
then the configuration is rotated to principal axes. It should be noted
that these axes are arbitrary from the point of view of interpretation,
but have certain desirable geometric properties. In particular the
coordinates of the points on the axes are uncorrelated. Furthermore
it is often helpful in deciding on the 'correct' dimensionality of the
solution to notice how much variation is associated with each axis.
This variation is given in the output by the value SIGMA which is the
standard deviation of the coordinates on each axis.
11.2.3.3 Dimensionality
As a general rule solutions should be computed in a number of
dimensionalities. Since a perfect fit will be obtained in n-2 dimensions
the trial dimensionalities should always be in dimensionalities less
the n-3. As a guide to the choice of trial dimensionalities it is
recommended that the product of stimuli x dimensions should be less than
half the number of data elements (Young’s index of data compression).
A further method is one superficially similar to the 'scree' test of
factor analysis. This involves examining the plot of stress by
dimensionality. Since MU is a measure of goodness of fit the plot will show
an ascending function and the elbow test for appropriate dimensionality may
be performed.
The 'appropriate' dimensionality, i.e. one of which
interpretation may be attempted, is that at which the graph shows an
'elbow', i.e. where the addition of extra dimensions is otiose.
11.3.
INPUT PARAMETERS
11.3.1 LIST OF PARAMETERS
Keyword
Default Value
DATA TYPE
0
0:
1:
2:
3:
LINEAR TRANSFORMATION
0
0:
LOG TRANSFORMATION
0
1:
0:
Function
The data are similarities
(high values mean high similarities
between points) – input is lower
triangle matrix without diagonal
The data are dissimilarities
(high values mean high
dissimilarities between points) –
input is lower triangle without
diagonal
The data are similarities – input
is full symmetric matrix
The data are dissimilarities –
input is full symmetric matrix
Linear transformation is not
performed
Linear transformation is performed.
Logarithmic transformation is not
performed
1:
CRITERION
0.00001
MINKOWSKI
2
MATFORM
0
N.B.
11.3.2
( #
1. ( N
( NO
Either LINEAR TRANSFORMATION or LOG TRANSFORMATION
must be specified
NOTES
)
) OF SUBJECTS is not valid with MRSCAL.
)
( # )
2. ( N )
( NO )
3.
Logarithmic transformation is
performed.
Sets the criterion value for terminating
the iterations.
Sets the Minkowski metric for the
analysis.
(RELEVANT ONLY WHEN 'READ CONFIG' IS USED)
0: The input configuration is saved:
stimuli(rows) by dimensions(columns)
1: The input configuration is saved:
dimensions(rows) by stimuli(columns)
( # )
OF STIMULI may be replaced by ( N ) OF POINTS
( NO )
LABELS followed by a series of labels (<= 65 characters), each on
a separate line, optionally identify the stimuli in the output.
Labels should contain text characters only, without punctuation.
4.
a) The program expects input to be in the form of the lower
triangle of a matrix of real (F-type) numbers, or a full square
matrix, with diagonal.
b) The INPUT FORMAT, if used, should read the longest,
i.e. last, row of this matrix.
5.
Maximum no. of stimuli
Maximum no. of dimensions
11.3.3
=
=
80
8
PRINT, PLOT AND PUNCH OPTIONS
The general format for PRINTing, PLOTting and PUNCHing output is
described in the Overview. In the case of MRSCAL, the available options
are as follows:
11.3.3.1
PRINT options
(to the main output file)
Option
INITIAL
Form
p x r matrix
FINAL
p x r matrix
DISTANCES
lower triangular,
with diagonal
FITTING
lower triangular,
with diagonal
Description
Initial configuration, either generated
by the program or listed by the user
(p = no. of stimuli, r = no. of
dimensions).
Final configuration, rotated to
Principal components.
Solution distances between points,
calculated according to MINKOWSKI
parameter.
Fitting values: the disparities
(DHAT) values.
RESIDUALS
lower triangular,
with diagonal
The difference between the distances
and the disparities.
By default only the final configuration and the final STRESS values
are listed.
11.3.3.2
PLOT options
Option
INITIAL
(to the main output file)
Description
Up to r(r-1)/2 plots of the initial
configuration. (r = no. of dimensions).
Up to r(r-1)/2 plots of final
configuration (r = no. of dimensions).
The Shepard diagram of distances plotted
against data. Fitting values are shown
by *, actual data/distance pairs by 0.
Plot of STRESS by iteration.
Histogram of point contributions to
STRESS.
Histogram of residual values (logged).
FINAL
SHEPARD
STRESS
POINT
RESIDUALS
By default, only the Shepard diagram and the final configuration
will be plotted. Configuration plots are calibrated both from 0 to 100
and from 0 to the maximum coordinate value.
11.3.3.3
PUNCH options (to secondary output file)
Option
SPSS
Description
Outputs I (Row index), J (Column index)
and corresponding DATA, DISPARITIES,
DISTANCES, RESIDUALS values in the
format: (2I4, 4F10.0).
Outputs final configuration as stimulus
(row) by dimension (column) matrix.
Each row is prefaced y the stimulus
number. Format: (I4,rF9.6) where r
is the number of dimensions.
Outputs STRESS value by iteration.
FINAL
STRESS
By default, none of these options is produced.
11.4.
EXAMPLE
RUN NAME
TASK NAME
N OF STIMULI
DIMENSIONS
INPUT FORMAT
PARAMETERS
READ MATRIX
<data>
PRINT
PLOT
COMPUTE
FINISH
8 POINT ZERO STRESS DATA
AS MADE FAMOUS BY USERS' GUIDE
8
2
(7F4.0)
LINE(1), DATA(1)
ALL
SHEP (2)
APPENDIX :
RELATION OF MRSCAL TO SIMILAR PROGRAMS OUTSIDE NewMDSX
The earliest work in MDS assumed that the data dissimilarities
were direct estimates of Euclidean distances, and solved for the
coordinates of the space that generated them. This so-called "classic
MDS" thus assumes the distances are at the ratio level of measurement.
Later developments (Messick and Abelson, 1956) assumed that the data were
"relative" distances - i.e. a linear function of the solution distances,
thus implying interval level of measurement - and therefore had to solve
additionally for the "additive constant" necessary to turn the data
into distance estimates. A surprisingly robust procedure for implementing
such "linear" or metric scaling is described in detail in Torgerson (1958).
Similar procedures to those provided by MRSCAL are implemented
in the following package and programs:
(1)
KYST (the successor to the original general purpose
package known as MDSCAL) provides options for
specifying linear and power transformations
relating data to the solution distances, and thus
implement linear and logarithmic scaling respectively.
(2)
ALSCAL-4 (the successor to POLYCON and TORSCA) also
allows the user to specify ratio or interval levels
of measurement, which also implement classical and
linear scaling respectively. There is an additional
facility for the user to specify a polynomial
in degree 1 to 4 as the nearest equivalent to a
logarithmic transformation.
12.
PARAMAP (PARAmetric MAPping)
12.1.
OVERVIEW
Concisely: PARAMAP (PARAmetric MAPping) provides internal
analysis of either a matrix (of co-ordinates or profiles) or a square
symmetric matrix of (dis)similarity coefficients by means of a
distance model which maximises continuity or local monotonicity.
DATA: either 2-way, 1-mode dissimilarities, or 2-way 2-mode data (profiles
or co-ordinates)
TRANSFORMATION: Continuity (local monotonicity) or smoothness (kappa
coefficient)
MODEL: Euclidean distance
(n.b. only one set of points – usually the row elements) is represented.
Alternatively, using the categorisation developed by Carroll and
Arabie (1979) PARAMAP may be described as:
Data:
One-mode (possibly two-mode)
Two-way
Interval or ratio
Model:
Distance
One set of points
One space
12.1.1 ORIGIN, VERSIONS AND ACRONYMS
The PARAMAP procedure was developed by Shepard and Carroll and
is documented in Shepard and Carroll (1966). The present program is
based on the original program.
12.1.2 PARAMAP IN BRIEF
PARAMAP takes as input either a rectangular matrix of profile data,
or a symmetric matrix of distances or covariances/correlations. The
program derives distances from the various inputs which are considered
as ratio quantities and as existing in a space of high dimensionality.
These data the program seeks to represent in a space of lower (userspecified) dimensionality so that the function relating the two sets
of distances is as smooth (continuous) as possible. It can be shown
that the criterion used to maximise smoothness also accurately represents
small distances, and hence preserves 'local' information in the data
and may be regarded as implementing local monotonicity.
12.1.3 RELATION OF PARAMAP TO OTHER NewMDSX PROCEDURES
PARAMAP will take as data the distance matrix output from other
scaling procedures, such as MINISSA, MRSCAL etc. It may also be used
to analyse data of the same form as input to PREFMAP or MDPREF except
that, since the data are used to compute a matrix of distances the data
must be at least at the interval level of measurement. In the case of
rectangular data input, only the 'stimulus' points are represented in
the space by this program.
12.2.
DESCRIPTION
12.2.1 DATA
Data may be input to PARAMAP in two basic forms
1. as a matrix of distances
or
2. as a matrix of coordinates (or 'profile' data).
The type of data input is described by DATA TYPE in the PARAMETERS command.
12.2.1.1 Data on the form of distances
The PARAMAP model actually operates on squared distances so data
may be input to the program either as a matrix of distances between
points or as a matrix of squared distances between points. Since the
program simply squares the original distances and then proceeds
there is no particular advantage in using one form rather than another.
If distances are input then DATA TYPE (4) is appropriate, for squared
distances DATA TYPE (2). The data are read by the READ MATRIX command,
according to its associated INPUT FORMAT specification, if the data are not
in free format, and consist of a lower-triangular matrix without diagonal.
Distance matrices output by such procedures as MINISSA, MRSCAL, MVNDS,
HICLUS, TRISOSCAL are suitable for analysis by PARAMAP, but INDSCAL
solutions are not amenable to PARAMAP analysis.
12.2.1.1.1 Covariance/correlation data
Data in the form of a covariance matrix may also be input to the
program by specifying DATA TYPE (1). These are considered as being
the scalar products between vectors in a space. The implied (squared)
distances are calculated directly from these scalar-products by means
of the cosine rule. Since the operation of this rule requires that the
length of the vectors must be known, the diagonal of the matrix must
also be input (the diagonal elements, the variances, consist of the
squared vector lengths).
This is not the case with a correlation matrix since the vectors
are normalised to unit length, thus it is important to distinguish
between input of correlation and covariance matrices. A correlation
matrix may be input by specifying DATA TYPE (3), in which case the
diagonal elements of the matrix should not be input.
12.2.1.2 Matrices of coordinates
The default option DATA TYPE (0) allows the user to input a
matrix of coordinates for p points in r dimensions. This is again
converted by the program to a set of (squared) distances before
proceeding. The input matrix might be an actual matrix of coordinates
or profile data for N subjects on p variables. If this is the case,
since these are treated as coordinates, there should be good grounds
for regarding the data as being at least interval level. It is for
this reason that 'preference data' are not normally analysed by this
model.
12.2.2 THE MODEL
As has been noted, the PARAMAP program operates on a matrix of
(squared) distances in a high-dimensional space. The basic model seeks
a representation of this information in a space of lower dimensionality
(user-specified) with as much of the 'local' information as possible
in the data preserved. This is intuitively similar to the technique
common in geography of representing information about distances on
the sphere of the globe as a flat, two-dimensional conformal map.
On the map, the local distances are 'true' reflections of the spherical
distances but as the distances involve increase, so does the amount of
distortion.
This is achieved by defining an index of continuity (Carroll and
Chang, 1964; Shepard and Carroll, 1966) as a measure of departure from
perfect representation. This measure K (KAPPA) in effect assigns a
heavy weighting factor to the small distances in the configuration.
This factor is increased as iterations continue so that even small
discrepancies in the small distances are progressively more heavily
penalised.
PARAMAP thus makes use of a criterion of local monotonicity,
producing a configuration in which the smaller distances are faithfully
represented and large distances distorted - quite unlike the case of
say, a MINISSA solution in which the global structure is highly reliable
and the local structure relatively unreliable. The ability to project down
relatively high-dimensional configurations into much lower dimensionality
(at the cost of sacrificing the faithful reproduction of high distances) is
one of the main advantages of PARAMAP, and can often be used for precisely
this reason.
The KAPPA index is minimized when the function relating the data
to solution is as smooth as possible. Thus the Shepard diagram in
PARAMAP is at least as important as the solution configuration, and
will normally have a characteristically "fan-like" shape: small input
distances are represented by small output distances, but as input
distances become longer the corresponding output distances will take
on an increasingly wide range of values. (Alterations in the exponent
values of KAPPA will affect this shape considerably).
12.2.2.1 The Algorithm
1.
The data are normalised if appropriate and the matrix of
squared inter-point distances is computed.
2.
If one is not input by the user the program generates an
initial configuration.
3.
The index of continuity between data-derived distances (Step 1)
and the solution distances is computed.
A number of tests is performed to determine whether the
degree of fit is acceptable or whether a minimum has been
reached. If so, then the configuration is output as solution.
If fit is unsatisfactory then the direction of movement
for each point on each dimension is calculated as is
the optimum amount of such movement.
4.
5.
6.
The configuration is moved in accordance with (5) and
the program returns to Step 3.
12.2.3
FURTHER FEATURES
12.2.3.1 The weighting factors
The generalised index of continuity, κ* (KAPPA STAR) contains
three factors A, B and C which control the weighting assigned to various
elements in the formula. The basis of the index of continuity is the
sum of the ratios of the data distances to the solution distances.
This sum is normalised by the sum of the solution distances. Each of
these elements is weighted by being raised to a specific power.
These powers are the values A, B and C. A is the exponent associated
with the data distances, B with the solution distances and C with the
normalising factor. There are two constraints on the possible values
of A, B and C. The first is that C must be negative, and the second
that B + C - A should equal zero if similarity transformations are
required, as will normally be the case. The default options allow
for the values A(1), B(2), C(-1) as recommended by Shepard and Carroll
(1966), which reduces the general index κ* to the index κ (as used
in PROFIT q.v.). Users may wish to vary these values. The crucial
consideration would seem to be the ratio between the weights assigned
to the data values and to the solution values (A and B respectively).
In general, B should be greater than or equal to A.
12.2.3.2 The CRITERION parameter
At step 4 of the algorithm PARAMAP performs a number of tests
to determine whether the iterative process should proceed. One of these
is to decide whether the index of continuity has reached a minimum value.
This value is set by the user by means of the CRITERION parameter.
The default value CRITERION (0) asks the program to try for a perfectly
smooth functional relationship between data and solution. It is, of
course, likely that the process will terminate before KAPPA reaches
zero if a minimum is found. The user may specify non-negative values
of CRITERION, reasonably between 0.05 and 0.1 in order to make
exploratory analyses of a data set.
12.2.3.3 Normalisation
If a rectangular matrix is input, the user may choose to normalise
the matrix before the distances are computed. There are three options.
If the distances are to be calculated from the matrix without normalisation
then NORMALISE(0), the default option is appropriate. If the rows of the
matrix are to be normalised, then NORMALISE(1) should be specified in the
PARAMETERS command. Alternatively, the column effects may be removed by
specification of NORMALISE(2).
Normalisation has the effect of removing the influence of both
the spread and absolute magnitude of the data scores on the resulting
distances.
12.2.3.4 The initial configuration
The user may choose to input an initial configuration of points
which represent a guess at the possible solution configuration. In this
case a configuration containing the stimulus points in the required
dimensionalities are input. Two points should be noted. First, a
configuration must be input with stimuli as rows and dimensions as columns.
Secondly, if solutions are to be obtained in more than one dimensionality
then a configuration for each dimensionality should be input. These
should be read under the READ CONFIG command. The configurations should
follow each other without break. The lowest dimensionality should come
first and an INPUT FORMAT specification, if the data are not in free
format, should be suitable for reading one row of the longest matrix (i e.
the highest dimensionality). Such a course may decrease the amount of time
taken to reach a solution.
Otherwise (at step 2 of the algorithm) the program will generate
a random configuration of points to provide the starting configuration.
Different starting configurations should be tried if relatively high
values of KAPPA occur. This is done by specifying in the PARAMETERS
command different values for RANDOM, since the process is random only
insofar as the values generated are taken from a rectangular distribution.
Each "seed" will, however, generate the same configuration.
12.3.
PARAMETERS
12.3.1 LIST OF PARAMETERS
Keyword
Default Value
DATA TYPE
0
0:
1:
2:
3:
4:
MATFORM
0
0:
1:
Function
Input matrix is a rectangular matrix
of stimulus coordinates.
Input matrix is lower-triangle
covariance matrix with diagonal.
Input matrix is a lower triangle
matrix of squared inter-point
distances without diagonal.
Input matrix is lower triangle matrix
of correlation coefficients without
diagonal.
Input matrix is lower triangle matrix
of inter-point distances without
diagonal.
Relevant only when DATA TYPE(0) is
specified.
The input matrix is saved stimuli
(rows) by dimensions (columns).
The input matrix is saved
dimensions(rows) by stimuli(columns).
NORMALISE
1
RANDOM
12345
A
B
C
CRITERION
1
2
-1
0
0:
1:
No normalisation
The X matrix is normalised on the
last iteration.
Enter any odd five digit integer.
Sets the random number generator seed
value.
Small 'a' of the KAPPA formula.
Small 'b' of the KAPPA formula.
Small 'c' of the KAPPA formula.
Sets the criterion value for the
terminating value for KAPPA.
12.3.2 NOTES
1.
What we refer to as stimuli in the list of parameters are the
entities actually represented in the configuration, and it is
the number of these entities which is given by N OF STIMULI.
2.
The number of dimensions on which the stimuli are measured is
given to the program by the N OF SUBJECTS command.
3.
Program Limits
Maximum number of stimuli
Maximum number of subjects (data dimensions)
Maximum number of dimensions (solution dimensions)
= 100
= 60
=
5
12.3.3 PRINT, PLOT AND PUNCH OPTIONS
The general format for PRINTing, PLOTting and PUNCHing output
is described in the Overview. In the case of PARAMAP the particular
options are as follows.
12.3.3.1
Option
PRINT options
Form
INITIAL
p x r
FINAL
p x r
DISTANCES
lower triangle
HISTORY
Description
The coordinates at the initial
configuration are listed.
The coordinates of the stimuli in
the solution configuration are listed.
The squared distances in the solution
are listed.
An iteration-by-iteration history of
the algorithm is listed.
By default the initial and final configurations and the final value of
KAPPA are listed.
12.3.3.2
Option
INITIAL
FINAL
FUNCTIONS
SHEPARD
PLOT options
Description
The initial configuration is
plotted. r(r-1)/2 two-way plots are
produced.
The solution configuration in the
form of r(r-1)/2 plots is produced.
r2 plots of the functions
required to translate the r
dimensions at x into the r
dimensions of Y.
A plot of the initial distances against
the fitted values is produced.
KAPPA
A histogram showing the value of KAPPA
at each iteration is produced.
By default only the FINAL configuration is plotted.
12.3.3.3
Option
SPSS
FINAL
KAPPA
PUNCH options (to a secondary output file)
Description
The following are output in a fixed
format
I = stimulus index
J = subject index
DATA = corresponding (squared) data
distance
DISTANCE = corresponding (squared)
solution distance
RESIDUAL = corresponding residual value
The coordinates of the stimuli in the
final configuration are output in a fixed
format.
The values for KAPPA at each iteration
are output.
By default, no secondary output is produced.
12.4.
EXAMPLE
RUN NAME
TASK NAME
N OF SUBJECTS
N OF STIMULI
DIMENSIONS
PARAMETERS
INPUT FORMAT
READ MATRIX
<data>
COMPUTE
FINISH
UNBENDING THE HORSESHOE
FROM USERS' GUIDE AND COXON & JONES 1980
2
16
1
MATF(0)
(4X, 2F8.5)
BIBLIOGRAPHY
Carroll, J.D. and P. Arabie (1979) Multidimensional scaling, in
M.R. Rozenweig and L.W. Porter (eds) (1980) Annual Review of
Psychology, Palo Alto, Ca: Annual Reviews.
Carroll, J.D. and J-J. Chang (1964) A general index of nonlinear
correlations and its application to the problem of relating
physical and psychological dimensions, unpublished paper,
Bell Laboratories, Murray Hill, New Jersey.
Chang, J-J. (1962)
mimeo.
How to use PARAMAP, Bell Telephone Laboratories,
Coxon, A.P.M. and C.L. Jones (1979)
Macmillan.
Class and hierarchy, London:
Johnson, S.C. (1967) A simple cluster statistic, unpublished paper,
Bell Laboratories, Murray Hill, New Jersey.
Johnson, S.C. (1967)
3, 241-254.
Hierarchical clustering schemes, Psychometrika, 32,
Kruskal, J.B. and J.D. Carroll (1968) Geometric models and badness-of-fit
functions, in P.R. Krishnaiah (ed.) Multivariate analysis (vol.2),
New York: Academic Press.
Shepard R.N. and J.D. Carroll (1966) Parametric representation of
nonlinear data structures, in P.R. Krishnaiah (ed.) op.cit.
APPENDIX :
PARAMAP is the only program in the scaling area to perform such
scaling, although it is formally equivalent to conformal mapping
procedures used in geography etc.
13.
PINDIS (Procrustean INdividual DIfferences Scaling)
13.1.
OVERVIEW
Concisely: PINDIS (Procrustean INdividual DIfferences Scaling)
Is a hierarchy of six models which provides an internal analysis of a set
of configurations by a Procrustean fitting model which uses a similarity
transformation of the data.
DATA: 2-way 2mode data (configurations of p stimuli in r dimensions)
TRANSFORMATION: depends on model number. P0 (basic model) performs
similarity transforms to put configurations into maximum conformity. Other
models employ “impermissible” transforms, which do not preserve original
relative distance information.
MODEL: P1 and P2 are weighted distance models (P2 with idiosyncratic
rotation) akin to INDSCAL and IDIOSCAL;
P3 and P4 are vector models (with idiosyncratic origins)
P5 is a hybrid distance-vector model. (see below)
Alternatively, following the categorisation suggested by Carroll
and Arabie (1979) the program may be described as follows:
Data: A set of configurations:
Three-way
Three-mode
Non-symmetric
Dyadic
Ratio level of measurement
Matrix conditional
Incomplete (missing dimensional
co-ordinates)
One replication
13.1.1 ORIGIN, VERSIONS AND
PINDIS was developed by
Michigan. A number of early
program was adapted from the
(1977).
Model:
P0: Similarity
P1: Dimensional weighting
P2: Dimensional weighting
and rotation
P3: Perspective (vector)
P4: Perspective and translation
P5: Double weighted
Two spaces
Internal/External
ACRONYMS
Lingoes and Borg at the University of
versions of the program exist. The present
1975 version which is documented in Borg
13.1.2 PINDIS IN BRIEF
PINDIS provides means of dealing with the question of individual
differences. It takes as input a set of configurations obtained from
previous scaling analyses. From these it derives a 'centroid
configuration' which is an optimal fit to the input configurations by means
of “permissible” (relative-distance preserving) operations on the input
configurations. These operations are: differential rotation, reflection and
re-scaling. .
13.1.3 THE RELATION OF PINDIS TO OTHER PROCEDURES IN NewMDSX
PINDIS differs from all other procedures in the NewMDSX library in
accepting configurations as data. However, most of the models have
affinities with other programs:
P0
Procrustean rotation is not related to any other
NewMDSX program.
P1 and P2 are distance models.
P1
(Dimension weighting) is very similar to INDSCAL in
permitting individual weighting of fixed dimensions.
The parallels are discussed in Borg and Lingoes (1978).
P2
(Rotated and weighted distance) is very similar to
the Carroll and Chang's IDIOSCAL model in permitting
individual rotation of the dimensions followed by
differential weighting of the dimensions.
P3 and P4 are weighted vector models.
P5
is a double weighting (dimensional and vector weighting)
model.
P3 to P5 do not have a
13.2.
parallel in any other program in NewMDSX.
DESCRIPTION
13.2.1 DATA
The PINDIS program takes as its input data a number of configurations.
These will normally be the result of some previous scaling analysis,
although any technique giving dimensional output is suitable. The number
of points in each of the configurations should be the same although the
dimensionalities of the spaces may differ.
The intuitively most apparent form of the data might be a three-way
analysis where each configuration results from the scaling of a given
individual's judgements of a set of stimuli.
The maximum number of dimensions in any one configuration is given
in the DIMENSIONS statement, the number of configurations by N OF SUBJECTS.
The number of points in the configuration is given on by N OF STIMULI and
the data are read by the READ CONFIGS command. These may be input either
stimuli (rows) by dimensions (columns) or vice versa (in which case
MATFORM(1) should be specified in the PARAMETERS command). If the data are
not in free format, an INPUT FORMAT specification should be provided to
read the longest row of the configurations.
13.2.2 THE MODEL
PINDIS stands for Procrustean INdividual DIfferences Scaling,
and consists of a set of six models for dealing with the question of how
different configurations are to be related to each other. In psychological
terms, the general assumption is that each subject is systematically
distorting a common, shared structure. The configuration obtained from
a given individual is thought of as being a systematic distortion of a
"master" configuration, the 'group space', and the program seeks both to
derive this 'group space' and to relate the given configuration to it.
The program contains six models which define different modes of
(successively more complex) distortions. It will be seen that it is quite
possible that different subjects will be best fit by different models. The
first main output of PINDIS is an estimate of this shared aggregate group
space or centroid configuration as it is known in the program. This is
normally generated by the program from the input configurations in the
manner described below but it is possible to input a fixed reference
configuration and then use PINDIS for an external analysis (see 13.2.3.1).
13.2.2.1 The basic model (P0): Similarity transformation (Unit weighting)
The basic "model" of the PINDIS is simple Procrustean fitting and
depends on the fact that MDS solutions are unique up to translation,
rotation and reflection and uniform stretching or shrinking rescaling
of axes. This is simply to say that in a configuration from, say,
MINISSA, the significant information is contained in the relative
distances between the stimulus and, in particular:
1.
that the position of the origin is arbitrary and
may be moved (translated) without destroying any
of the significant information in the solution. (This
is not the case for factor analytic solutions (see 13.2.3)).
2.
that the axes of the configuration are in an arbitrary,
though possibly convenient, position and may be (rigidly)
rotated without destroying the salient information in
the solution.
3.
4.
that a configuration may be reflected without loss of
information. Intuitively this means that a configuration
may come out of an analysis "back-to-front". Geometrically
reflection is merely a special case of rotation.
that the actual numbers assigned to the distances
are not significant information but may be made
uniformly bigger or smaller at will. Intuitively,
this means that the actual configuration may be
enlarged or reduced so long as this process is uniform.
These operations, translation, rotation (with which we include
reflection) and rescaling (uniform stretching etc.) comprise a similarity
transformation and are known in the model as the "permissible
transformations" in that changing a configuration by any (or all) of
them gives a configuration which contains neither more nor less
information than the original in terms of relative distances.
The program's first step is to take each pair of configurations
in turn and, by applying the permissible similarity transformations,
move them into maximum conformity with each other. Having done this,
the program has effectively eliminated any differences in the
configurations due to the conventions of the program producing them and has
left the substantive differences - the differences due to random error and
differential cognition. The centroid configuration is formed simply
by taking the average position of each point over all the configurations.
The model at this stage implies that in reporting their perceptions,
subjects make no systematic distortions to the group space (the centroid).
The communality of each configuration to the centroid is then
calculated. This may be regarded as the proportion of variance (r2 )
in that particular configuration which is explained by the centroid.
The higher order models allow that subjects may systematically
distort this centroid configuration. It is the mode of distortion which
differs in these models.
13.2.2.2
In dimensional weighting the mode of distortion is analogous to
that of the INDSCAL model in that subjects, in arriving at their perceptual
spaces, are thought of as applying differential weights to the dimensions
of the group space (the centroid). Substantively this amounts to saying
that subjects will attach greater salience to certain (fixed) aspects of
the difference between stimuli than to others, or that they will be prone
to make finer distinctions on some criteria over others.
The user may choose whether these differential weights are to be
applied to the centroid obtained at P0 or whether this configuration is
to be rotated to some optimal position before the weights are applied.
The default option allows for this latter course and may be expected to
result in substantively more interpretable solutions. If, however, the
user wishes to fix the centroid after P0, or has input a hypothesis
configuration with 'meaningful' axes, then ROTATE(0) should be specified
in the PARAMETERS statement.
The communality of the centroid to each of the input matrices is
then calculated. This and the similar values obtained from higher
models should be compared to the value from P0 which is treated as the
baseline from which the more complex models are assessed. Final choice
of the preferred explanatory model is made on the basis of the increase
in the fitting value (r2) which takes into account the fact that at each
stage the number of free parameters increases dramatically.
13.2.2.3 Dimensional salience with idiosyncratic orientation (P2)
In this model each subject is thought of as distorting the centroid
by first rotating the axes of the configuration to his/her own preferred
orientation and then applying differential weights to these new axes.
(It should be noted that if ROTATE(0) has been specified then this
solution will be identical to P1).
The substantive interpretation of the model is that subjects
are not only affording differential salience to the same criteria but
also using different criteria.
In models P1 and P2 the mode of distortion which took the centroid
into the subject configurations was essentially a dimensional weighting.
In models P3 and P4 the distortions are applied directly to the actual
stimulus points, which are considered as vectors from the origin of the
space.
13.2.2.4 Perspective model with fixed origin (vector weighting) (P3)
Let us remind ourselves that the aim of the PINDIS procedure is to
get the points of the centroid configuration (the group space) as close
as possible to each of the individual input configurations in turn.
This model seeks to do this by differentially stretching or shrinking
each stimulus vector drawn from the origin of the space. What does this
mean? Essentially the process may be conceived of in this way. Take
a subject configuration and plot it on top of the centroid so that the
origin and axes coincide. Now draw a line to connect the origin with
a particular stimulus point in the centroid configuration and produce it
beyond both the point and the origin. The point on this line which is
nearest to the corresponding point in the subject configuration is the
point we are looking for.
The substantive justification for this model relies on the axes and
origin of the space being interpretable/meaningful and asserts that
the significant information in the configuration is the balance (actually
the ratio) between the coordinates on the constituent axes. It is
sometimes called the "unscrambling" model since a weight applied to a
stimulus vector moves the position of that stimulus in the space.
13.2.2.5 The perspective model with idiosyncratic origin (P4)
Although the actual orientations of the axes of the configuration do
not affect the direction of the stimulus vector, the position of the origin
is crucial. The idiosyncratic vector model additionally allows the
subjects to move the origin of the centroid space to an idiosyncratic
position before the vector weighting operations are performed.
If the centroid configuration has a rational origin and it does not
make sense to shift it about in this manner, then the user should specify
TRANSLATE(0) in the PARAMETERS command (see also 13.2.3).
13.2.2.6 The double weighted (dimension and vector weighting) model (P5)
This model allows both dimensional and vector weighting
simultaneously. Although the number of free parameters in this model is
large, it has been found that the goodness-of-fit of this particular model
is often surprisingly low. This may indicate that the geometrical
processes which define it have little psychological rationale (it is
largely within the psychological field that it has been tried) though other
substantive applications may find one.
The double weighting solution may be suppressed by specifying
SUPPRESS(1) in the PARAMETERS command.
13.2.2.7 Some general points
For each of the models the program calculates the communality
between the centroid (or alternatively hypothesis configuration if one has
been supplied) and each of the subject configurations. Choice of a
particular model should be made by comparing this value for each subject
for each model against the communality at PO. Some improvement should
manifest itself as the number of free parameters increases. If a higher
level model has virtually the same communality (for a given subject) as a
lower one then obviously parsimony suggests that the lower one be
preferred.
The number of parameters estimated in each model in finding a
given subject configuration is a function of the dimensionality of the
configuration (r) and the number of stimulus points (p).
P0 = 0
P1 = r
P2 = r r (r(r-1)/2)
(simply permissible transformations)
(dimension weights)
(dimension weights and pair-wise
rotation certificate)
(stimulus vector weights)
(stimulus vector weights and r-dimensional
origin)
(dimension weights, stimulus vector weights
and origin).
P3 = p
P4 = p + r
P5 = p + (p + r)
The models thus form a semi-lattice:
(distance)
P2
P5
(vector)
P4
P1
P3
P0
(similarity)
13.2.3
FURTHER FEATURES
13.2.3.1 External analysis
The user may wish to use the PINDIS program to effect an external
analysis by inputting, as well as the subject configurations, a fixed
hypothesis configuration, which may be an a priori arrangement of points
or the result of a previous MDS or other dimensional analysis. This
configuration is input to the program by means of the READ HYPOTHESIS
command which is peculiar to PINDIS, if necessary with its own associated
INPUT FORMAT specification. This configuration will form the centroid at PO
and will be rotated, weighted, etc., in the other models and users are
urged to pay particular attention to the values given to the ROTATE
(see 13.2.2.2 and 13.2.2.3) TRANSLATE (see 13.2.2.5) and ORIGIN (see below)
parameters to ensure that they do not violate the logic of the
configuration.
13.2.3.2 The use of the ORIGIN parameter
We note at 13.2.2.4 the importance of the position of the origin of
the space in the weighted vector models. One way of making substantive
sense of vector weighting is by moving the origin to a substantively
meaningful position rather than at an arbitrary centroid and considering
each of the other points as directions of distinction from that point.
Consider this hypothetical example. Suppose we were interested in the
perceptions of political parties. We might take the configurations
belonging to members of a particular party and place the origin of the
space at the point representing that party. The distance to the other
party points (the length of the stimulus vectors) is then proportional
to the perceived difference between the party of affiliation and the
others but the direction will also have significance in representing
the mode of difference (say right vs. left, populist vs. elitist).
It may very well be the case that there is virtual consensus over the
modes of difference, i.e. the ways in which the parties differ but
disagreement over how different they are. Some right wing Conservatives
may, for instance, be very anxious to dissociate themselves from the
UK Independence Party and while acknowledging the fact that the U.K.I.P. is
more right-wing, will insist on the difference between the Front and the
Tories being made as large as between, say, the Tories and the Labour
party. Other members of the Conservative party, of a more moderate bent,
might be less neurotic about admitting the similarity between the two. In
this case, the weighted vector model provides a feasible model of the
differences between the two groups. The user may use this option by
specifying the number of the point to be regarded as the origin as the
argument to the ORIGIN parameter.
TESTS OF SIGNIFICANCE
Langeheine (1980) has provided Tables of Significance for the PINDIS fit
measures, based upon extensive simulation studies.
13.3.
PARAMETERS
13.3.1 LIST OF PARAMETERS
Keyword
Default
SUPPRESS
1
ROTATE
1
TRANSLATE
0
ORIGIN
0
MATFORM
0
13.3.2
Description
Double-weighted solution (P5) is
performed.
1: Double-weighted solution (P5) is
suppressed.
0: Idiosyncratic rotations of the
centroid are not allowed, i.e. P2
is not performed.
1: Idiosyncratic rotations are allowed.
0: No translation of the origin allowed
i.e. P4 is not performed.
1: Translation of origin to an
idiosyncratic position is allowed.
0: The origin is situated at the
centroid of the space
<any positive integer> gives the
number of the point to be regarded
as the origin.
0: The input configurations are input
stimuli(rows) by dimensions(columns)
1: The input configurations are input
dimensions(rows) by stimuli(columns)
0:
NOTES
1.
READ CONFIGS is obligatory in PINDIS.
2.
READ MATRIX is not valid with PINDIS.
3.
LABELS followed by a series of labels (<= 65 characters), each on
a separate line, optionally identify the stimuli in the output.
Labels should contain text characters only, without punctuation.
4.
Maximum number of dimensions
=
Maximum number of stimuli
=
Maximum number of configurations =
6
50
50
13.3.3 PRINT PLOT AND PUNCH OPTIONS
The general format for PRINTing, PLOTting and PUNCHing output is
described in the Overview. The particular options for PINDIS are as
follows:
13.3.3.1
Option
CENTROID
SUBJECTS
PRINT options
Form
p x r
N(p x r)
Description
The centroid configuration is listed
at each phase.
The subject matrices are listed at
each phase.
Both of these are produced by default.
13.3.3.2 PLOT options
Option
Description
CENTROID
The centroid configuration is plotted
at each phase.
SUBJECTS
The subject configurations at each
phase
are plotted.
Both configurations are plotted by default.
13.3.3.3
Option
CENTROID
PUNCH options
Description
The coordinates of the centroid
configuration are output.
By default, no secondary output file is produced.
13.4.
EXAMPLE
RUN NAME
PRINT DATA
NO OF SUBJECTS
NO OF STIMULI
DIMENSIONS
COMMENT
RUN OF TEST DATA FOR PINDIS
YES
5
16
3
FIVE CONFIGURATIONS ARE TO BE INPUT.
EACH HAS SIXTEEN POINTS IN THREE DIMENSIONS
ALL
ALL PARAMETERS WILL ASSUME DEFAULT VALUES
PLOT
COMMENT
READ HYPOTHESIS
<the hypothesis (target) matrix follows here>
READ CONFIGS
-0.283
-0.899
-0.049
-0.348
-0.827
0.099
.....
.....
.....
-0.930
0.400
0.020
-0.870
0.500
0.190
COMPUTE
FINISH
BIBLIOGRAPHY
Borg, I. (1977) Representation of individual differences, in
J.C. Lingoes (ed.) Geometric representations of relational data,
Mathesis Press, Ann Arbor, Michigan.
Borg, I. and J.C. Lingoes (1977) A direct transformational approach
to multidimensional analysis of three-way data matrices, Zeit. F.
S-Psych., 8, 98-114.
Commandeur ??????
Gower, J.C. (1975) Generalized procrustes analysis, Psychometrika, 40,
33-51.
Gower, J.C. and G. Dijksterhuis (2004) Procrustes Analysis, New York:
Open University Press
Langeheine, R (1980) Approximate norms and significance tests for the
LINGOES-BORG Pocrustes individual differences scaling (PINDIS), Kiel:
Institut fuer die Paedagogik der Naturwissenschaften
Lingoes, J.C. and I. Borg (1976) Procrustean individual difference
scaling, J. Market.Research, 13, 406-407.
Lingoes, J.C. and I. Borg (1977) Optimal solutions for dimension and
vector weights in PINDIS, Zeit. F.S-Psych., 8.
Lingoes, J.C. and I. Borg (1978) A direct approach to individual
differences scaling using increasingly complex transformations,
Psychometrika, 43.
Lingoes, J.C. and P.H. Schonemann (1974) Alternative measures of fit
for the Schonemann-Carroll matrix fitting algorithm, Psychometrika,
39, 423-427.
RELATION OF PINDIS TO OTHER PROGRAMS
Within NewMDSX, P1 is akin to INDSCAL.
MATCHALS (Commandeur 19XX) is similar to the PINDIS hierarchy.
15. PRINCOMP
15.1
(Principal Components)
OVERVIEW
PRINCOMP expects as input a matrix of correlations or covariances. It is
included here to allow comparison with the dimensions identified by nonmetric MDS procedures for the same data. For convenience, input matrices
may be in any of the formats used elsewhere in NewMDSX. An error is
reported if the input matrix is not one of correlations or covariances,
i.e. if, for any i, j, ( xij ) 2 > ( xii . xjj ).
15.2
DESCRIPTION
DATA: 2-way, 1-mode matrix of scalar products (covariances, correlations)
TRANSFORMATION: Linear
MODEL: Scalar-products
Principal components is a mathematical technique, with no underlying
statistical model, which is frequently used to identify a limited number of
orthogonal linear combinations of the original p variables
yi
=
ai1 x1
+
ai2 x2
+
....
+
aiq
Xq,
q ≤ p
that can be used to summarise the data, while losing as little information
as possible. Technically, it simply produces an orthogonal rotation of the
input matrix to its principal axes, or eigenvectors, arranged in
diminishing order of size.
By default, PRINCOMP will list all n eigenvalues (latent roots) and
principal components (eigenvectors) of a matrix of n variables, in
descending order of their contribution to the total variance of the
original matrix. The first principal component is therefore the linear
combination which accounts for the largest possible proportion of the
overall variance, often interpeted as a kind of general factor providing
the greatest discrimination between the individual observed data values.
This however is not always the one that is of greatest interest to the
investigator, it is the second or subsequent components that give an
indication of the structure of relationships between the variables.
Components are reported with the vectors normalized to their corresponding
eigenvalues, rather than unity, so that they are analogous to factor
loadings. When they arise from a correlation matrix, they may be
interpreted as correlations between the components and the original
variables.
In many sets of multivariate data the variables will be measured in
different units and are standardised before analysis. This is equivalent to
extracting the principal components as eigenvectors of the matrix of
correlations, rather than of the covariance matrix. Note that the
eigenvalues and principal components of these matrices are not generally
the same, and that choosing to analyse a matrix of correlations is
equivalent to deciding to consider all of the variables to be equally
important.
The number of principal components to be listed may be restricted to the
number given in in the DIMENSIONS statement. The size of the input matrix
is given by N OF STIMULI and the matrix is read by the READ MATRIX
command. The format of the input matrix is given by the parameter DATA
TYPE in the PARAMETERS command. If an INPUT FORMAT specification is used,
it should read the longest row of the type of matrix to be input. By
default, however, free format input is assumed.
15.3
INPUT PARAMETERS
15.3.1 PARAMETERS
Keyword
Default
DATA TYPE
1
1:
2:
3:
4:
5:
Description
Lower triangular matrix
Lower triangular matrix
Upper triangular matrix
Upper triangular matrix
Full symmetric matrix.
without diagonal
with diagonal
without diagonal
with diagonal
15.3.2 PLOT options (to main output file)
Option
Description
COMPONENTS
Plots the principal components.
If a parameter is added, this specifies the number
of normalized principal components to be plotted.
(Plotting all components is liable to generate a
rather large output file.)
ROOTS
Produces a 'scree plot' of the latent roots
against the principal components.
NOTES
1.
The READ MATRIX command is obligatory in PRINCOMP.
2.
LABELS followed by a series of labels (<= 65 characters), each on
a separate line, optionally identify the stimuli in the output.
Labels should contain text characters only, without punctuation.
3.
There are no PRINT options as such in PRINCOMP.
By default, the eigenvalues (or latent roots) of the input matrix are
listed in descending order, together with the corresponding
eigenvectors, or principal components, and the proportions of the
total variance accounted for by each.
4.
No secondary output file is produced by PRINCOMP.
5.
Program limit – 80 stimuli
15.4 EXAMPLE
RUN NAME
A CORRELATION MATRIX TO DEMONSTRATE PRINCOMP
N OF STIMULI
6
DIMENSIONS
6
PARAMETERS DATA TYPE(1)
READ MATRIX
0.54
0.34 0.65
0.37 0.65 0.84
0.36 0.59 0.67 0.80
0.62 0.49 0.43 0.42 0.55
PLOT COMPONENTS(2) ROOTS
COMPUTE
FINISH
OUTPUT
.........
A CORRELATION MATRIX TO DEMONSTRATE PRINCOMP
EIGENVALUES
1
3.80526
2
0.99117
3
0.49642
4
0.30970
PRINCIPAL COMPONENTS NORMALIZED TO EIGENVALUES
1
2
3
4
1
-0.6434
0.6552
-0.2264
0.2943
2
-0.8256
0.0364
-0.4114
-0.3824
3
-0.8439
-0.3519
-0.0913
0.1493
4
-0.8774
-0.3691
0.0008
0.1723
5
-0.8478
-0.2221
0.3217
-0.0528
6
-0.7134
0.5011
0.4050
-0.1486
% TOTAL VARIANCE
63.4210
16.5194
8.2737
5.1617
5
0.28669
6
0.11076
5
-0.1311
-0.0371
0.3306
-0.0528
-0.3262
0.2228
6
0.0411
-0.0133
0.1554
-0.2479
0.1383
-0.0649
4.7782
1.8460
........
References
Everitt, B.S. & G. Dunn
Kendall, M.G
Advanced Methods of Data Exploration and
Modelling, London, Heinemann, 1983
Multivariate Analysis, London, Griffin, 1975
16.
16.1
PROFIT (PROperty FITting)
OVERVIEW
Concisely: PROFIT (PROperty FITting) provides external analysis
of a configuration by a set of properties (ratings or rankings in rowconditional format) by a scalar products (vector) model using either
a linear or “smoothness” transformation of the data.
DATA: external mapping of 2-way 2-mode matrix of “properties” into userprovided configuration of the same points
TRANSFORMATION: Linear and/or continuity (kappa)
MODEL: Scalar-products or vector
According to the categories developed by Carroll and Arabie
(1979) PROFIT may be described as:
Data:
Two-mode
Two-way
Asymmetric
Dyadic
Ordinal or Interval/Ratio
Row-conditional
Complete
Model:
Scalar-product
Two set of points
One space
External
16.1.1 ORIGINS, VERSIONS AND ACRONYMS
PROFIT was developed by J.D. Carroll and J.J. Chang at Bell
Laboratories and originally documented in Chang and Carroll (1968).
16.1.2 PROFIT IN BRIEF
PROFIT takes as input both a configuration of stimulus points
and a set of rankings or ratings of the same set of stimuli. These
rankings and ratings are usually estimates of different properties of
the stimuli. The program locates each property as a vector through
the configuration of points, so that it indicates the direction over
the space in which the property is increasing. The fitting is
accomplished by maximising the correlation between the original
property values and the projection of the stimuli onto the vector.
This correlation may be either linear or non-linear (continuity).
16.1.3
RELATION OF PROFIT TO OTHER PROCEDURES IN THE NewMDSX SERIES
1.
PROFIT using the linear option is formally identical to
Phase 4 (vector model) of the preference mapping program
PREFMAP, also using the linear option. (Note that PREFMAP
phase IV may also be used with a quasi-non-metric option,
providing a form of ordinal property fitting).
2.
An internal form of the point-vector model (i.e. where the
input configuration is not fixed but is generated from the
data) is available in MDPREF.
3.
An option within PARAMAP allows a rectangular or row-conditional
(two-way, two mode) array of data to be input for internal
analysis using a continuity (kappa) transformation between the
data and the solution. But only the stimuli are represented
in the solution.
16.2.
DESCRIPTION OF THE PROGRAM
16.2.1 DATA
There are two parts to the input data for PROFIT.
16.2.1.1 The configuration
The configuration consists of the coordinates for a set of
objects (stimuli) on a number of dimensions. This may be an a priori
configuration (Coxon, 1974 ) or one resulting from another multidimensional scaling analysis, or, indeed, from a factor analysis. The
configuration is input to the program by means of the READ CONFIG Command,
with its associated INPUT FORMAT specification, if used, and may be
presented either stimuli (rows) by dimensions (columns) or dimensions
(rows) by stimuli (columns). In this latter case the parameter MATFORM
should be given the value 1. Since the configuration is not substantially
altered by the PROFIT algorithm, analysis can only take place in a given
dimensionality and attempts to specify more than one value in the
DIMENSIONS command will cause an error.
16.2.1.2 The properties
Each of the "properties" which PROFIT will seek to represent as
vectors in the configuration, is a set of values which distinguish
the stimuli on a particular criterion. These may be physical values
(as in the following example) or subjective evaluations of the stimuli
on criteria other than that or those used to generate the original
configuration. For instance, a simple use of the program might be
to map into a MINISSA representation of the perceived similarities
between a set of stimuli, information about the subjects' preferences
of the same stimuli.
16.2.1.2.1 Input of properties
Each property consists of a set of values, one for each stimulus in
the configuration. All properties must be in the same format and unless
the data can be read in free format this is given by the INPUT FORMAT
specification which precedes the READ MATRIX command which reads the
properties. Each property is preceded, however, by a separate input
statement containing a label, which is listed in the output.
16.2.1.3 Example
To illustrate the use of the PROFIT program we take the configuration
reported by Wish (Wish et al, 1972). In their study individuals
(subjects) gave ratings on a scale of the degree of similarity between
pairs of nations (stimuli). The averaged ratings were used to obtain
a four-dimensional MDS solution where a larger distance between a pair
of points in this space indicates a greater dissimilarity between the
nations concerned. After visual inspection of the plots the authors
interpreted the dimensions as shown in figure la and lb.
We may wish to concentrate on the following properties of
the nations concerned:
1)
2)
3)
4)
5)
6)
Gross National Product per Capita, 1965
Total Population, 1965
Population Growth Rate, Total Time Span (1950-1965)
Ethno-linguistic Fractionalization
Soviet Aid per Capita, 1954/5 - 1965
Total U.S. Economic and Military Aid per Capita (1958-1965)
These aggregate data were obtained under the direction of Taylor
(Taylor et al, 1973) and the list could be expanded to contain as many
of the 300 and more variables which they report for each country.
The set up for two properties of this example is given in section 16.4.
16.2.2 THE MODEL
PROFIT seeks to represent the properties as vectors over the
configuration of points. The analysis is external in as much as the
configuration is regarded as being fixed: the stimulus points cannot be
moved to make the fit of the vectors better (other than to centre the space
round its centroid).
A fitted vector is regarded as indicating the direction in which the
given property is increasing. This implies theoretically that preference
increases continually, never reaching a maximum (corresponding to the
economic concept of insatiability).
The property values are then correlated with the projections
of the stimuli onto the vector in the following way. The vector is
drawn through the origin of the space. (This is for convenience only.
In fact, any vector parallel to this will give an identical result,
since it is only the projections which are significant.) The perpendicular
projections from the origin to the bases of the projections calculated.
It is this final set of measurements (the distances from the origin to
the projections) which is correlated with the original property values
and it is this correlation which is the index of goodness-of-fit between
data and solution. Two options are available to the user in calculating
this correlation. The program will either calculate and maximise the
(linear) product-moment correlation between data and solution or a (nonlinear) "smoothness" or "continuity" measure (or, indeed, both). These
are chosen by means of the REGRESSION parameter.
Despite its name, the non-linear procedure does not fit curves
rather than straight lines into the space. Rather, the function which
links the data (property values) to the solution (point projections)
is not constrained to being linear and may instead be drawn from the
wider class of non-linear functions. In PROFIT, the particular index
of non-linear badness-of-fit is KAPPA, which ensures local monotonicity.
This means that in the Shepard diagram the function plot might be
upwardly monotone in the lower range and downwardly monotone in the
upper range, since it is the variations between data values adjacent
(or close) to each other which are crucial in calculating the index:
Kappa maintains only the smoothness or continuity of the function
between adjacent values (hence "local" monotonicity). In the algorithm
this is done by giving adjacent (or close) data values a heavy weight.
The user is given the option of varying this weight to give varying
importance to different aspects of the data (see below).
16.2.2.1 The Algorithm
Since the linear and non-linear procedures differ from each other
quite considerably, we discuss them here separately.
16.2.2.1.1
The linear procedure
1.
The columns of the configuration are normalised.
2.
The XMAT matrix is computed.
For each property in turn:
3.
The direction cosines of the vectors are computed.
4.
The projections of the points onto the vectors are
computed.
5.
The correlation between the projections and the property
values is computed.
6.
The cosines corresponding to the angles between each pair
of vectors are computed.
7.
The configuration and vector-ends are plotted using both
normalised and original coordinates.
16.2.2.1.2
1.
The non-linear procedure
The configuration is normalised.
For each property:
2.
KAPPA and ZSQ measures of alienation and correlation
respectively are computed.
3.
The cosines of the angles between the vectors and the original
axes are calculated.
4.
The projections of the points onto the vectors are calculated.
When all properties have been thus treated:
5.
The cosine of the angle between each pair of vectors is
calculated.
6.
The configuration of points and vectors is plotted in
original and normalised co-ordinates.
16.2.3
FURTHER OPTIONS
16.2.3.1 Linear vs. non-linear regression
Because the results of non-linear analysis are more difficult
to evaluate, it is often tempting to start with the more familiar
linear regression. The linear procedure is however merely a special
case of the non-linear and, since usually we do not possess prior
information on the form of the relation expected between property
values and stimulus projections, the more general non-linear analysis
may be preferred as an exploratory technique.
The PROFIT program always reports the product-moment correlation
coefficient. It is quite possible that a relatively low value for
the non-linear continuity measure KAPPA, and a high value for the
(linear) correlation coefficient will be found. This would indicate
that the relation is indeed linear and PROFIT should then be run with
the linear option in order to test this assumption and provide the
information on the (linearly) best fitting property vector.
16.2.3.2 Non-linear measures of goodness-of-fit
In the case of linear property fitting, the product moment
correlation is a suitable measure of goodness-of-fit between the data
and the solution. In the non-linear case no such familiar index is
available. Rather, an index KAPPA (κ), which is a badness-of-fit measure,
is minimized. Intuitively this measure is minimized whenever the form
of the function relating the data to the solution becomes smoother or
more continuous locally, whatever its actual overall shape may be.
Thus it may be considered as an index of 'local' monotonicity.
16.2.3.2.1
The use of the weight parameter
Carroll defined the general index of non-linear correlation Kappa (κ)
between an independent variable p and a dependent x as:
к
=
_1_
S2
∑
i≠j
wij ( xi - xj )2
Where
wij =
and
and
f
f (|pi – pj|)
is a monotone decreasing function,
_
S2 = _1_ ∑ ( xi - x )2
N i
In PROFIT the independent p corresponds to one property and the
dependent x to the projections of the points on to the vector. PROFIT
seeks to minimize к.
The weighting function plays a crucial role in the definition
of Kappa. This function can take on three different values and each
value defines a different "flavour" of к. The choice of flavour
depends crucially on the characteristics of the property values.
16.2.3.2.1.1 When WEIGHT (0)
This is the general definition of non-linear correlation and
no restrictions are placed on the data. Therefore, this index can
always be applied to examine the extent to which the property values
(data) and the projections of the stimulus points (solution) are
related by a smooth or continuous function.
16.2.3.2.1.2 When WEIGHT (1)
In this case, it is assumed that the property values are equally
spaced. So the level of measurement of the properties is in effect
taken to be ordinal if the order is specified with equal intervals. To
do this any equally spaced values may be chosen, such as 1, 2, 3,...N
or 5, 10, 15,...5N.
There is no restriction on the characteristics of the stimulus
configuration when using this option. This option limits the calculation
of Kappa to adjacent points. In this case, κ becomes equivalent to
Von Neumann's η (Eta, the ratio of the mean square successive difference)
as defined in Von Neumann (1941). See below (16.2.3.2.2.2) for the
use of BCO in conjunction with this option.
16.2.3.2.1.3 When WEIGHT (2)
If the property values tend to be highly clustered into two or
more groups of values, then the PROFIT program can be used to determine
whether this is also the case for the projections of the stimuli on
the fitted vector. To do this we must choose the property values in
such a way that it becomes possible to discriminate the clusters.
Ordinal level of measurement is sufficient, provided the property
values are equally spaced. By defining the maximum distance between
two points which are to be taken as falling in the same grouping,
the program then selects the clusters. This maximum distance is set
using the BCO parameter (see 2.3.2.2.3 below).
The weight factor will now have the effect of restricting
attention to property distances which are close to each other (in
effect, in the same grouping) and ignoring values outside the BCO
value. In this case, κ can be shown to be the equivalent of the
"correlation ratio" (Carroll 1964, see also Nie et al, 1975).
16.2.3.2.2 The use of the BCO parameter
This parameter has a different use and meaning when used in
conjunction with different WEIGHT options:
16.2.3.2.2.1 When WEIGHT = 0
In the general case a value of 0 for BCO (the default) will make
the weighting function be undefined for equal property values. If there
are equal property values and BCO(0) the program will terminate. Thus
this option in effect assumes that there are no ties between the property
values. If ties do occur among your property values then a small value of
BCO (say .001) should be used. This will allow calculation of the weight
factor even when the property values are equal. A large value for BCO
has the effect of allowing Kappa to decrease indefinitely and is not
recommended.
16.2.3.2.2.2 When WEIGHT (1)
When Von Neumann's η is approximated, then the value of the BCO
parameter has a more simple explanation than in the previous case. Now
BCO simply gives the size of the equal intervals. Note that if WEIGHT(1),
which is the default value, then BCO(0) has no meaning and some other value
must be specified.
16.2.3.2.2.3 When WEIGHT (2)
In this case the BCO parameter gives the maximum distance allowed
between points in the hypothetical clusters described above in 2.3.2.1.3.
Again in this case, the default value BCO (0) has no meaning, and must
be over-ridden by some other value.
16.3.
INPUT PARAMETERS
16.3.1 LIST OF PARAMETERS
Keyword
Default Value
REGRESSION
1
MATFORM
0
WEIGHT
0
BCO
0
16.3.2
Function
Linear regression only will be
performed.
2: Non-linear regression.
3: Both regressions will be performed
(independently).
0: The input configuration is
saved stimuli (rows) by
dimensions (columns).
1: The input configuration is saved
dimensions (rows) by stimuli
(columns).
(See Section 16.2.3.2).
0: Carroll's index of continuity.
1: Von Neumann's ratio of the mean
square successive difference.
2: the "correlation ratio".
(See Section 16.2.3.2).
1:
NOTES
1.
# OF PROPERTIES may be used in PROFIT in place of
# OF SUBJECTS.
2.
READ CONFIG is obligatory.
3.
LABELS followed by a series of labels (<= 65 characters), each on
a separate line, optionally identify the stimuli in the output.
Labels should contain text characters only, without punctuation.
4.
Since the non-linear option involves calculation of large powers
of the data values, exponent overflow may occur. In this case
the data values should be made smaller. This might be done by
changing the format statement so as to divide the values by, say,
100.
5.
PROGRAM
Maximum
Maximum
Maximum
16.3.3
LIMITS
dimensionality:
10
number of points:
60
number of properties: 20
PRINT, PLOT AND PUNCH OPTIONS
The general format for PRINTing, PLOTting and PUNCHing output
is described in the Overview. In the case of PROFIT, the available
options are as follows:
16.3.4.1 PRINT options
The PRINT DATA command will echo both the input stimulus
configuration and the property values.
Keyword
INITIAL
Form
p x r
approaches.
CORRELATIONS
(Default)
Description
The matrix of stimulus points as
normalised by the program. This will
differ in linear and non-linear
1 x N
The following are listed:
1(a) the correlations for each property
(linear regression).
(b) the eigenroots associated with each
vector (non-linear regression).
The following are listed:
1.
The direction cosines between each
of the fitted vectors and each dimension
in the normalised space.
2.
The direction cosines between each
vector and each dimension of the original
space.
3.
The cosines of the angles between
the vectors.
A table of residuals is listed
i.e. obtained distances original distances.
PROPERTIES
N x r
N x r
N x N
RESIDUALS
'
16.3.4.2
INITIAL
PLOT OPTIONS
FINAL
SHEPARD
RESIDUALS
The stimulus configuration plotted in pairs of
dimensions with both original and normalised
co-ordinates marked (up to r(r-) 2 plots).
Both stimulus points and property vectors
plotted together original and normalised
co-ordinates (up to r(r-1)2 plots).
N plots of original property values against
projections on fitted vectors giving the
shape of the linking function.
Histogram of residual values.
By default only the first two dimensions of the joint space are
plotted.
16.3.4.3
Option
SPSS
PUNCH options
Description
This command produces a file containing the
following variables:
I
property
j
DATA
stimulus
original value on property i of
stimulus j
FITTED projection on fitted vector
RESID
difference between original and fitted
values.
Two matrices are saved:
i) the matrix of stimulus points as
normalised, and
ii) the matrix of direction cosines for the
fitted vectors.
SOLUTION
16.4.
EXAMPLE
RUN NAME
N OF STIMULI
N OF PROPERTIES
DIMENSIONS
PARAMETERS
COMMENT
INPUT FORMAT
COMMENT
PROFIT TEST DATA
21
2
4
REGRESSION(3), BCO(.OOl)
* * * *
NOTICE THAT BOTH LINEAR AND NON-LINEAR OPTIONS
ARE TO BE USED AND THAT THE SMALL VALUE IS
GIVEN TO BCO BECAUSE THERE ARE TIES IN THE DATA
(SEE SECTION 2.3.2.2.1)
* * * *
(4F4.3)
* * * *
THE ABOVE FORMAT STATEMENT REFERS TO THE
CONFIGURATION TO FOLLOW ...
* * * *
READ CONFIG
<here follows the configuration in four dimensions>
INPUT FORMAT
(11F5.0)
COMMENT
* * * *
... WHILE THE ABOVE FORMAT REFERS TO
THE PROPERTIES
* * * *
READ MATRIX
POPULATION GROWTH RATE 1950-1965
1.60 0.50 1.10 1.10 4.70 1.10 2.40 0.80 0.80 3.10 3.40
1.70 2.00 2.10 1.40 2.50 1.50 2.20 1.20 1.60 1.60
ETHNO-LINGUISTIC FRACTIONALISATION
505 325 026 261 199 015 877 099 436 071 305
694 886 764 657 044 118 038 754 028 666
PLOT
SHEPARD
COMPUTE
FINISH
BIBLIOGRAPHY
Carroll, J.D. and P. Arabie (1979) Multidimensional scaling, in
(1980) Annual Review of Psychology, Palo Alto, Ca,: Annual Reviews.
Carroll, J.D. and J.J. Chang (1964) A general index of non-linear
correlation and its application to the problem of relating
physical and psychological dimensions, unpublished paper,
Bell Telephone Laboratories.
Chang, J.J. and J.D. Carroll (1968) How to use PROFIT, a computer
program for property fitting by optimizing non-linear or
linear correlation, unpublished paper, Bell Telephone Laboratories.
Coxon, A.P.M. (1974) The mapping of family composition preferences:
a scaling analysis, Soc.Sci.Res., 3, pp 191-210.
Miller, J.E., R.N. Shepard and J.J. Chang (1964) An analytic approach
to the interpretation of multidimensional scaling solution.
Paper presented at A.P.A. 1964. Abstract in Am.Psych., 19, pp 579-80.
Neumann, J. von, et al (1941) The mean square successive difference,
Am.Math.Stat., 12, pp 153-62.
Taylor, C.L. et al (1973) World handbook of political and social
indicators, (2nd edition), Ann Arbor, Michigan.
Wish, M. (1972) Differences in the perceived similarity on nations,
in A.K. Romney, R. Shepard and S.B. Nerlove (eds.) Multidimensional
Scaling: Theory and Applications, New York, Seminar.
APPENDIX : RELATION OF PROFIT TO OTHER PROGRAMS OUTSIDE THE NewMDSX SERIES
No programs outside the NewMDSX series (and the corresponding Bell
Laboratories versions) implement a continuity or "smoothness" scaling
transformation, and therefore no parallel programs exist for the
non-linear version of PROFIT.
The linear version of PROFIT can be thought of as a linear multiple
regression program: predicting property values from a linear combination
of dimensional co-ordinates of the stimuli involved. Strictly speaking,
any multiple regression program can therefore be used to implement
linear PROFIT.
A number of MDS programs outside the NewMDSX series have the
capability of external scaling with linear (metric) or ordinal (non-metric)
transformation functions. (Guttman-Lingoes SSA-1; KYST; ALSCAL in SPSS)
- but only for an ideal point (distance) model. However, none of these
allow the possibility of using a vector (scalar products) model.
Currently the only accessible equivalent of linear PROFIT occurs in the
PRINCIPALS model in the Young - de Leeuw - Takane ALSCAL series.
17.
TRISOSCAL (TRIadic Similarities Ordinal SCALing)
17.1. OVERVIEW
Concisely:
TRISOSCAL (TRIadic Similarities Ordinal SCALing)
provides internal analysis of:
DATA: a set of triadic (dis)similarity measures
TRANSFORMATION: using a local or global monotonicity transform
MODEL: Minkowski distance model
Alternatively, following the categorisation developed by Carroll
and Arabie (1979) TRISOSCAL may be described as follows:
Data:
One-mode
Polyadic (triadic)
Ordinal
Triad-conditional
Incomplete
Replications allowed
Model:
Minkowski distance
One set of points
One space
Internal
17.1.1 ORIGIN, VERSIONS AND ACRONYMS
The present program is a revised version of the TRISOSCAL program
developed by M.J. Prentice at the University of Edinburgh, which was in
turn developed as a generalisation of MINITRI, a program in E.E. Roskam's
(University of Nijmegen) MINI series. The original Roskam MINITRI
approach is included in the present version as an option (see below).
17.1.2 TRISOSCAL IN BRIEF
In a triadic comparison exercise, subjects are presented with sets
of 3 objects drawn from a larger collection and asked to judge the
relative (dis)similarity of the objects involved. Two alternative methods
of triadic data collection are catered for in this program (which is unique
to the NewMDSX series). Given a triad of objects (A,B,C), the subject may
be asked:
1. which pair is the most dis/similar
2. which pair is the most dis/similar, and which pair is the least
dis/similar.
The TRISOSCAL program
seeks to represent these dissimilarities as distances between the objects,
considered as points in a space of minimum dimensionality. The data are
considered to be at the ordinal level.
17.2.
DESCRIPTION
17.2.1 DATA
The fourth quadrant of Coombs's (1964) fourfold typology of data
concerns distance information on pairs of pairs. The most obvious method
of obtaining directly such data is the so-called method of tetrads in which
the subject is presented with all possible combinations of four objects and
asked: "which is the most similar/dissimilar pair ?" This method has the
disadvantage of requiring a very large number of judgements even on fairly
small sets of stimuli. The method of triads while eliciting information on
pairs of objects in systematic relation to other objects in the set reduces
considerably the number of judgements required of a subject.
17.2.1.1
The
possible
possible
to state
The method of triads
method of triads consists in presenting the subject with all
triads (but see 2.3.3). (S)He is asked to consider the three
pairs formed by the triad ABC, namely (A,B), (B,C) and (A,C) and
either
or
"which is the most similar pair of these three ?"
"which is the most similar pair and which the
least similar pair of these three ?"
The first method yields only a partial ordering on each triad in
that we know only that, for any triad A, B, C, that (A,B) is more similar
than (B,C) and than (A,C). The latter case, by contrast, produces a strict
ordering since if the subject chooses (A,B) as the most similar and (B,C)
as the least similar, then the order of the three pairs in terms of
similarity is necessarily (A,B) (A,C) (B,C).
If the first method has been used in obtaining the data then the
user should specify ORDER(0)in the PARAMETERS command. If the method
producing a strict ordering has been used then ORDER(1) should be
specified.
13.2.1.1.1 Presentation of the data
The number of objects to be positioned as points in the space is
specified in the N OF STIMULI command, the number of actual triads is
presented to the program in the N OF TRIADS specification.
Each object is labelled by a number and thus each triad consists
of three numbers, say (5, 2, 4) which are interpreted in the following
way.
17.2.1.1.1.1 When ORDER (0)
The pair which is chosen as the most similar is designated by the
first pair of numbers of the three. Thus in our example the pair (5,2)
is that chosen.
If the subject has been asked which pair is the most dissimilar
then the pair chosen should again be the pair defined by the first two
numbers, but in this case the parameter DATA TYPE should be given the
value 1 in the PARAMETERS command.
17.2.1.1.1.2 When ORDER (1)
When the subject has been asked to choose both the most similar and
the least similar pair, then the triad is interpreted in the following
way.
The first pair of numbers defines the pair chosen as the most
similar. The pair consisting of the first and last number is that chosen
as the least similar. The pair consisting of the second and third numbers
is thus the "middle" pair. Thus for the triad 5,2,4 the pair (5,2) is
the most similar, the pair (2,4) the next most similar and the pair (5,4)
the least similar.
By specifying DATA TYPE (1) in the PARAMETERS command the data are
interpreted as dissimilarities rather than similarities. The default
DATA TYPE (0) regards the data as similarities as described above.
17.2.2 THE MODEL
Roskam (1970) has shown that the common procedure of aggregating
triadic data by a simple vote-count procedure (counting the number of times
that pair jk is judged more similar than pair lm) not only obscures but can
positively distort the order information in the data, especially when not
all triads are presented. Rather than the simple vote-count, he suggests
that each point j be assigned a sub-matrix, whose row- and column-elements
correspond to pairs in which j occurs. Within these it is possible to
use the vote-count method. Each of these matrices is represented as a
row of a new rectangular asymmetric matrix whose row-elements correspond
to the objects and whose column-elements, although labelled as objects,
refer to the pair formed by the column-element with the particular
row-element.
This matrix forms the basis of the analysis but is treated in
two different ways by two differing STRESS approaches (v.i.). The "local"
approach treats the matrix as row-conditional while the "global" approach
does not enforce this conditionality.
17.2.2.1 The Algorithm
1.
An initial configuration is generated or one is supplied by
the user (see 17.2.3.2).
2.
The distances in the configuration are calculated according
to the Minkowski metric chosen (see 17.2.3.1).
3.
The fitting values are calculated (see 17.2.2.2).
4.
STRESS is calculated according to the option chosen
(see 17.2.2.2).
A number of tests are performed: e.g.
Has STRESS reached an acceptable minimum ?
Has a specified number of iterations been performed ?
Has the improvement in STRESS over the last few
iterations been too small to warrant continuing ?
If the answer to any of these is YES then the current
configuration is output as solution. If not, then:-
5.
6.
The direction in which each point should move in order that
STRESS should decrease as well as the estimated optimum size of
that movement are calculated.
7.
The configuration is moved in accordance with 6 and the program
returns to stage 2 above.
17.2.2.2 Fitting-values and STRESS
At each iteration a set of fitting values is calculated which are
constrained to being in the same order as the dissimilarities implied
in the data. These fitting values are used to calculate the value of
STRESS which is an index of how well the particular configuration matches
the data. Two methods are available within TRISOSCAL for making this
calculation - Roskam's "local" approach and Prentice's "global" approach.
17.2.2.2.1 The "Local" approach
This is the approach used exclusively in the original Roskam
MINITRI program. Fitting values are assigned to pairs of points (stimuli)
so that the order of the fitting-values matches the order of
dissimilarities within each triad.
Each inversion of that order will
lead to an increase in the value of STRESS. In this method no account is
taken of inversions of order occurring between triads. Consequently, the
same datum (pair) can be fitted by different fitting values in different
triads.
17.2.2.2.2 The "Global" approach
Consider the following two triads: (ABC) and (BCD). In the "local"
approach the program is free to assign to the one pair (B,C) which occurs
in both triads two distinct fitting values without affecting the value of
STRESS. The "global" approach forces the program to assign the same
fitting value. This has the effect of requiring that the order of fitting
values be kept across the whole set of stimuli. This is the option of
choice when the data refer to one individual’s set of triadic data. This
option is chosen by specifying STRESS(1) in the PARAMETERS command.
Since the "global" approach obviously imposes far greater
constraints on the solution than the "local" approach, the values of STRESS
obtained will be considerably higher. The "local" procedure ignores
transitivity between triads and thus it is often advisable to use this
option if the data have been collected from a large number of subjects.
Examples of the use of both options are found in Coxon & Jones (1979), and
where data from single individuals are scaled separately, it is often
useful to use PINDIS (P0, P1) to combine the configurations
17.2.3
FURTHER FEATURES
17.2.3.1 Distances in the configuration
The user may choose the way in which the distance between the
points in the configuration is measured by means of the MINKOWSKI
parameter. The default value 2 provides for the ordinary Euclidean
metric where the distances between two points will be the length of
the line joining them. The user may specify any value for the parameter.
Commonly used values, however, include 1, the so-called 'city-block'
or 'taxi-cab' metric where the distance between the two points is the
sum of the differences between their co-ordinates on the axes of the
space, and infinity (in TRISOSCAL approximated by a large number (>25))
the so-called 'dominance' metric when the largest difference on any
one axis will eventually come to dominate all others. (Users are
warned that high MINKOWSKI values are liable to produce program
failure due to numerical overflow).
17.2.3.2 The initial configuration
It is not possible to generate an initial configuration directly
from the triadic data. However, as a vote count matrix is formed
(section 17.2.2) this is used to generate an initial configuration in
the same way as the Guttman-Lingoes-Roskam MINI programs. This configuration uses only the ordinal properties of the vote count matrix and
has certain desirable properties such as avoiding local minima.
If the user wishes to supply an initial configuration then this is
input via the READ CONFIG command and, if the data are not in free format,
an associated INPUT FORMAT specification. The configuration must be in the
maximum dimensionality to be used in the solution. The parameter MATFORM is
used to specify how the input configuration is entered and is detailed in
section 17.3.1.
17.2.3.3 Balanced incomplete block designs
Even with the method of triads the number of judgements required
of subjects, increasing with the cube of the number of stimuli, rapidly
becomes unmanageable.
Balanced incomplete block designs are designs which
reduce this number, while ensuring that certain desirable conditions (such
as ensuring that every possible triad is presented at least once) are met.
These are described in Burton and Nerlove (1976).
17.3.
INPUT PARAMETERS
17.3.1 LIST OF PARAMETERS
Keyword
Default Value
DATA TYPE
0
MINKOWSKI
2.0
Function
0: Input data are similarities
1: Input data are dissimilarities.
(Any positive number) sets the Minkowski
parameter for determination of
distances in the configuration.
ORDER
0
0:
1:
STRESS
0
0:
1:
17.3.2
Partial order is input
Pull order is input (section
17.2.1)
STRESS calculated using "local"
approach.
STRESS calculated using "global"
approach (see 17.2.2.2).
NOTES
1.
The N OF TRIADS statement, having the same form as N OF STIMULI,
is mandatory in TRISOSCAL.
2.
N OF TRIADS may be replaced by N OF SUBJECTS.
3.
Program Limits:
Maximum number
by the program
Maximum number
by the program
Maximum number
of stimuli allowed
is
of triads allowed
is
of dimensions =
50
3333
8
17.3.3 PRINT, PLOT AND PUNCH OPTIONS
The general format for PRINTing, PLOTting and PUNCHing output is
described in the Overview. In the case of TRISOSCAL, the available options
are as follows:
17.3.3.1
Option
INITIAL
FINAL
DISTANCES
FITTING
RESIDUALS
HISTORY
COUNT
GRADIENT
PRINT options
Form
p x r
p x r
p x
(lower
only)
p x
(lower
only)
p x
(lower
only)
p
triangle
Description
The co-ordinates of the points in the
initial configuration are listed.
The solution matrix, the co-ordinates
of the stimulus points in the final
configuration are listed.
The matrix of inter-point distances in
the final configuration is listed.
p
triangle
The matrix of fitting values is listed.
p
triangle
The matrix of residuals (distancesfitting values) is listed.
p x p
(lower triangle
only)
p x r
A detailed history of the iterative
process is listed.
The vote-count matrix as derived from
the triadic comparisons is listed.
The matrix at gradients as applied
to the final configuration is
listed.
By default only the final configuration is listed.
17.3.3.2
Option
INITIAL
FINAL
SHEPARD
PLOT options
Description
The initial configuration is plotted
as r(r-1)/2 two-way plots.
The solution is plotted as r(r-1)/2
two-way plots.
The Shepard diagram of data against
distances is plotted.
POINT
A histogram of the contribution to
STRESS of each point is plotted.
A histogram of residual values is
produced.
A histogram of the STRESS values at
each iteration is produced.
RESIDUALS
STRESS
By default only the Shepard diagram and the FINAL configuration
are plotted.
17.3.3.3
Option
FINAL
SPSS
STRESS
17.4.
PUNCH options (to an optional secondary data file)
Description
The solution configuration is output,
indexed in a fixed format.
The following are output in a fixed format:
I = row index
J = column index
VOTE = entry in vote-count matrix
Corresponding to I,J
DIST = the corresponding distance
FITTING = the corresponding fitting value
RESID = the corresponding residual value
An iteration by iteration history of
STRESS values is saved in a fixed format.
EXAMPLE
RUN NAME
SOME DATA FOR TRISOSCAL
N OF STIMULI
10
N OF TRIADS
120
DIMENSIONS
2 TO 3
PARAMETERS
MINKOW(1), ORDER(1), STRESS(1)
READ MATRIX
<data follow here>
PRINT
COUNT
PLOT
SHEPARD, POINT(3)
COMPUTE
FINISH
BIBLIOGRAPHY
Burton M.L. and S.B. Nerlove (1976) Balanced designs for triads
tests: two examples from English, Soc.Sci.Res., 5, 247-67.
Carroll, J.D. and P. Arabie (1979) Multidimensional scaling, in
M.R. Rozenweig and L.W. Porter (eds) (1980) Annual Review of
Psychology, Palo Alto, Ca: Annual Reviews.
Coombs, C.H. (1964)
A theory of data, New York: Wiley.
Coxon, A.P.M and C.L. Jones (1979) The Images of Occupational Prestige,
London: Macmillan
Prentice, M.J. (1973) On Roskam's nonmetric multidimensional scaling
algorithm for triads, Edinburgh, MDSX Project Report no. 3
mimeo.
Roskam, E.E. (1969) Data theory and algorithms for non-metric scaling,
Department of Psychology, University of Nijmegen, mimeo.
Roskam, E.E. (1970) The method of triads for nonmetric multidimensional
scaling, Nederlands Tijdschrift voor de Psychologie, 25, 404-7.
Roskam, E.E. (1975) Non-metric data analysis, Department of Psychology,
University of Nijmegen, Report 75-MA-13.
APPENDIX :
There are no other programs widely available for the analysis
of triadic data.
18. WOMBATS: Work Out Measures Before Attempting to Scale
18.1
Overview
Concisely: WOMBATS (Work Out Measures Before Attempting To Scale), does
just what its acronym says and computes from a rectangular data matrix one
or more (dis)similarity measures suitable for input to other NewMDSX
procedures.
18.1.1
WOMBATS in brief
The WOMBATS program is in effect a utility which takes as input a
rectangular matrix either of raw data, and computes a measure of
(dis)similarity between each pair of variables in the matrix. These
measures are output in a format suitable for input either to other NewMDSX
procedures or to other programs. This output format is chosen by the user.
18.2. DESCRIPTION OF THE PROGRAM
The following section describes briefly those aspects of the program
pertinent to its use. The measures calculated in WOMBATS are those
detailed in chapter 2 of `The User's Guide' (Coxon 1982). For a fuller
discussion, see that reference.
Section 2.1 describes the type of data suitable for input, and its
presentation to the program and section 2.2 the range of measures
available. Section 2.3 describes further options including those for
outputting the results.
18.2.1
Data
The basic form of input data for the WOMBATS program is a rectangular
matrix in which the rows represent cases (or subjects) and the columns,
variables (or stimuli). This may be a matrix of ‘raw’ data as collected by
the user or exported from EXCEL, SPSS or a similar program.
The number of rows in the matrix is specified by the user in the N OF CASES
command or, (alternatively, in N OF SUBJECTS). The number of columns
fields is given by either N OF VARIABLES or N OF STIMULI. (In these
commands ‘N’ may of course be replaced by either ‘NO’ or ‘#’.) The data are
read by the program when it encounters a READ MATRIX command, and the INPUT
FORMAT specification, if used, should describe one row of the data matrix.
Otherwise, data values are be entered in free format, separated by spaces.
If the data to be input are for some reason in a matrix where the rows
represent variables and the columns cases, then the user should specify
MATFORM(O) in the PARAMETERS command.
The chosen measures are calculated between the entities designated as
variables (so-called R-analysis). This will be the case whatever value
is taken by the parameter MATFORM. If the user wishes measures to be
calculated between cases rather than between variables (Q-analysis),
see section 2.3.1 below.
N.B.
The program expects data to be input as real numbers. The INPUT
FORMAT statement, if used, must therefore be specified to read F type numbers, even if the numbers do not contain a decimal point.
18.2.1.1
Levels of Measurement
The user must specify, for each of the variables in the analysis, the level
of measurement at which it is assumed to be. Five levels are recognised by
the program. The recognised levels are ratio, interval, ordinal, nominal
and dichotomous. If a particular variable is not explicitly assigned to a
particular level by the user, then the program assigns it by default to the
ordinal level of measurement.
Each of the measures in the program assumes that the variables on which it
is operating have the properties of a particular level of measurement. If
an attempt is made to compute a measure which assumes a level of
measurement higher than that at which the variables have been declared to
lie, the program will fail with an error message. No restriction is
placed, obviously, on the attempt to calculate measures which assume levels
lower than those declared.
The user signals the measurement level of the variables to the program by
means of the LEVELS command, peculiar to the WOMBATS program. This
consists of the command LEVELS, and one or more of the keywords RATIO,
INTERVAL, NOMINAL, DICHOTOMOUS or ORDINAL. (Obviously, since the program
defaults to ordinal, there is no need actually to specify variables
associated with this last keyword). In parentheses following each keyword
used are listed the variables which are to be assumed to be at that level
of measurement. In these parentheses, ALL and TO are recognized. The
following are valid examples of a LEVELS declaration.
LEVELS
LEVELS
LEVELS
INTERVAL (1, 2, 5, 7,), NOMINAL (3, 4, 6, 8)
RATIO (ALL)
NOMINAL (1 TO 4), INTERVAL (7 TO 11)
In the last example, variables 5 and 6 are presumed by default to be at the
ordinal level.
18.2.1.2
Missing Data
Variables that include missing data are a problem. The user may specify,
for each variable in which there are missing data, one code which the
program will read as specifying a missing datum. Users will note however
that an attempt to calculate certain measures between variables will fail
if missing data are present. The measures for which this is the case are
indicated in the discussion of the available measures in section 18.2.2.1.
The user signals the occurrence of missing data by means of the MISSING
statement. This consists of the command MISSING followed by the value(s)
to be regarded as signifying missing data. In parentheses following each
missing data value is a list of the variables for which that value
represents a missing datum. In these parentheses the forms ALL and TO are
recognised. The following are valid examples of a MISSING declaration.
MISSING
MISSING
MISSING
-9.(1, 2, 7, 9), 99.(3, 4, 6, 8)
0. (ALL)
.1(1 TO 7), -.1(8 TO 16)
18.2.2
ANALYSIS
The aim of the WOMBATS program is to calculate for each pair of variables
in the analysis a measure of the (dis)similarity between them. Having
described the data to the program, the user must then choose the measure to
be calculated. WOMBATS currently offers 26 different measures.
The required measures are chosen by means of the MEASURES command. This
contains the keyword MEASURES followed by one only of the keywords
referring to the available measures described below. Only one measure is
computed in each TASK of the run. If more than one measure is required on
the same set of data, then a separate TASK NAME is necessary.
18.2.2.1
Available measures
It is convenient to consider the available measures in WOMBATS under their
respective assumed levels of measurement.
18.2.2.1.1 Dichotomous measures
Sixteen measures of agreement between dichotomous variables are included in
WOMBATS. These correspond to those described in `The User's Guide to MDS'
pp.24-27. Missing data are allowed in all these measures.
In this section, the following notation will be crucial. Consider two
dichotomous variables which we will assume to measure whether the objects
under consideration do or do not possess a particular attribute. The cooccurrence(or frequency) matrix of these two variables looks as follows.
Variable 1
Variable 2
1/Yes
0/No
1/Yes
a
b
0/No
c
d
The cell `a' is the number of times that the attributes 1 and 2 co-occur,
`b', the number of times attribute 2 is present when attribute 1 is not,
`c' is the number of times attribute 1 is present and 2 is not and `d' is
the number of objects possessing neither attribute 1 nor attribute 2. All
the measures of agreement to be considered in this section result from the
combination of these quantities in some way.
The measures available for the comparison of dichotomous variables are
denoted by the `keywords' D1, D2, ..., D16 and it is these `keywords' that
appear in the MEASURES command
For example, the command
MEASURES
D15
will select Yule's Q as the measure to be calculated
Before choosing a dichotomous measure, users should consider:
•
•
whether they wish “co-absences” (cell d) to feature in the assessment of
similarity, and
whether they wish the measure to have Euclidean properties. Gower and
Legendre(1986) prove that if a similarity measure has non-negative
values and the self-similarity sii is 1, then the dissimilarity matrix
______
with entries δij = √(1-sij) is Euclidean.
Note that any similarity measure can be converted into a dissimilarity
measure by a related transformation:
δij = (1-sij) if the similarity measure takes values between 0 and 1,
or
δij = (max-sij) where max is the value of the greatest similarity.
D1 and D2 are undoubtedly the simplest and most commonly-used of these
measures.
Each dichotomous measure is now considered:
Command
Type
Range
MEASURES
D1
Similarity measure
low = 0, high = 1
Name
Jaccard's coefficient
Formula
a
(a + b + c)
Description
Excludes `d'. Represents the probability of a pair
of objects exhibiting both of a pair of attributes
when only those objects exhibiting one or other are
considered. It is possible that a division by zero
may occur in the calculation of this measure.
Command
Type
Range
Formula
MEASURES
D2
Similarity measure
low = 0, high = 1
a
(a + b + c + d)
Name
Russell and Rao's measure
Description:
Represents the probability of a pair of objects in
a pre-selected set exhibiting both of a pair of
attributes.
Command
Type
Range
Name
MEASURES
D3
Similarity measure
low = 0, high = 1
Sokal's measure
(a + d)
(a + b + c = d)
Formula
Description
Includes `d' in numerator and denominator.
Represents the probability of a matching of
two attributes.
Command
Type
Range
Formula
MEASURES
D4
Similarity measure
low = 0, high = 1
2a
(2a + b + c)
Name
Description
Dice's measure
Gives the positive matches `a' twice as much
importance as anything else. Excludes entirely the
mismatches. It is thus possible that a division by
zero may occur in the calculation of this measure.
Command
Type
Range
Formula
MEASURES
D5
Similarity measure
low = 0, high = 1
2(a + d)
(2(a + d) + b + c)
Name
Description
no name
Includes `d' in both numerator and denominator.
The matches (a and d) are given twice as much
weight as the mismatches.
Command
Type
Range
Formula
MEASURES
D6
Similarity measure
low = 0, high = 1
a
(a + 2(b + c)
Name
Description
no name
Excludes `d' entirely. The matches (b and c) are
accorded twice as much weight as the matches. It
is possible that a division by zero may occur in
the calculation of this measure.
Command
Type
Range
Name
MEASURES
D7
Similarity measure
low = 0, high = 1
Rogers and Tanimoto's measure
(a + d)
(a + d + 2(b + c)
Formula
Description
Includes `d' in numerator and denominator. The
mismatches (b and c) are accorded twice as much
weight as the matches.
Command
Type
Range
Name
MEASURES
D8
Similarity measure
low = 0, high = a + b + c + c + d - 1
Kulczynski's measure
a
b+c
Formula
Description
Excludes `d' entirely. This measure is the simple
ratio of the positive matches (a) to the mismatches
(cf. D9). it is possible that a division by zero
could occur in the calculation of this measure and
an undefined statistic occur. The maximum value
otherwise is as stated.
Command
Type
Range
Formula
MEASURES
D9
Similarity measure (Sokal & Sneath)
low = 0, high = a + b + c + d – 1
(a + d)
(b + c)
Name
Description
no name
This measure is the simple ratio of all matches
(positive and negative) to the mismatches (cf D8).
The statistic may be undefined, due to a zero
divisor. The maximum finite value is as stated.
Command
Type
Range
Name
MEASURES
D10
Similarity measure
low = 0, high = 1
Kulczynski's measure
a
1 a
)
+
(
2 a+c a+b
Formula
Description
Command
Type
Range
Formula
Excludes `d' entirely. This measure is a weighted
average of the matches to one or other of the
mismatches. This statistic may be undefined.
MEASURES
D11
Similarity measure
low = 0, high = 1
d
d
a
1 a
)
+
+
+
(
4 a+c a+b b+ d c+d
Name
Description
no name
Includes `d' in numerator and denominator. This is
the analogue of D10 with mismatches included.
Command
Type
Range
Formula
MEASURES
D12
Similarity measure
low = 0, high = 1
a
〈 (a + c)(a + b)〉
Name
Description
Ochiai's measure
Excludes `d' from numerator. It uses the geometric
mean of the marginals as a denominator. This
statistic may have a zero divisor.
Command
Type
Range
Formula
MEASURES
D13
Similarity measure
low = 0, high = 1
ad
〈 (a + c)(a + b)(b + d)(c + d)〉
Name
Description
no name
Includes `d' in numerator and denominator. It uses
the geometric mean of the marginals as a
denominator and will return a value of 0 iff either
a or d is empty.
Command
Type
Range
Formula
MEASURES
D14
Similarity measure
low = -1, high = +1
(a + d) - (b + c)
(a + b + c + d)
Name
Description
Hamann's coefficient
Simply the difference between the matches and the
mismatches as a proportion of the total number of
entries. A value of 0 indicates an equal number of
matches to mismatches. Some thought should be
given to the interpretation of any negative
coefficients before scaling the results.
Command
Type
Range
Formula
MEASURES
D15
Similarity measure
low = -1, high = +1
(ad) - (bc)
(ad + bc)
Name
Description
Yule's Q
This is the original measure of dichotomous
agreement, designed to be analogous to the productmoment correlation. A value of 0 indicates
statistical independence. Some thought should be
given to the interpretation of any negative
coefficients before scaling the results. This
statistic may be undefined.
Command
Type
Range
Formula
MEASURES
D16
Similarity measure
low = -1, high = +1
(ad - bc)
〈 (a + c)(a + b)(b + d)(c + d)〉
Name
Pearson's Phi
Description
A value of 0 indicates statistical independence.
Some thought should be given to the interpretation
of any negative coefficients before scaling the
results. The statistic may be undefined if any one
cell is empty.
18.2.2.1.2 Nominal measures
Five measures are available in WOMBATS for the measurement of nominal
agreement between variables. Four of these are based on the familiar chisquare statistic. The other is the Index of Dissimilarity.
18.2.2.1.2.1
Chi-square based measures
The following procedure is used to evaluate the chi-square statistic that
forms the basis of four of the available measures.
Consider two variables x and y. We form the table whose row elements are
the values taken by (or the categories of) the variable x and whose column
elements are the values (categories) taken by variable y. (Obviously,
since this is a nominal measure, these values have no numerical
significance). The entries of this table are the number of cases which
take on particular combinations of values of x and y i.e. the number of
cases that fall into the particular combinations of categories.
The value of the chi-square statistic is calculated by comparing the actual
distribution of these values in the cells of the table to that
distribution which would be expected by chance (statistical independence
occurs when p(i,j) = p(i) x p(j)) . Thus, the higher the value of the
statistic, the more the actual distribution diverges from the chance or
expected one (0).
In the case of there being missing data in the original matrix, then the
whole row or column corresponding to that value is deleted. Caution should
be exercised if there are many missing data and particularly if these are
unequally distributed around the variables since the value of the statistic
is dependent on the number of values it considers and strictly speaking
chi-square measures based on largely different numbers of cases are not
comparable.
The other measures in this section seek to overcome the dependence of chisquare on the number of cases by norming it. The norming factor differs
for each statistic.
The following notation will be used in discussing nominal measures:
N
will indicate the number of cases
r
will stand for the number of rows in the matrix i.e. the number
of categories (values) taken by variable x and
c
will stand for the number of columns i.e. the number of
categories in variable y.
Name
Command
Type
Range
Comment
Chi - square
MEASURES
CHISQUARE
Similarity measure
low = 0, high = N x min(r,c)
A value of 0 indicates statistical independence.
maximum value is dependent on the value of N.
Name
Command
Type
Range
Comment
Phi
MEASURES
PHI
similarity measure
low = 0, high = ≤(min(r,c)-1)
The phi coefficient is chi-square normed to be
independent of N. Reaches a maximum for 2 x 2 tables in
which case it reduces to the product-moment correlation.
The
It may, however, exceed 1 when the minimum of r and c is
greater than 2.
Name
Command
Type
Range
Comment
Cramer's V
MEASURES
CRAMER
similarity measure
low = 0, high = 1
Cramer's coefficient is chi-square normed to be
independent of N and of the number of r and c. Reaches a
maximum for non-square tables.
Name
Command
Type
Range
Comment
Pearson's Contingency coefficient C
MEASURES
PEARSON
similarity measure
low = 0, high = 1
Pearson's coefficient is chi-square normed to be
independent of N, originally developed as a measure for
contingency tables. Cannot reach its maximum of 1 for
non-square tables.
18.2.2.1.2.2
The index of dissimilarity
The remaining statistic in this section is the index of dissimilarity. In
the case of the chi-square measures, the implicit comparison is between the
actual (bi-variate) distribution and the expected (chance) one. In the
case of the index it is two (univariate) distributions that are compared.
Consider again the table that is formed by cross-tabulating the values of
variable x and those of variable y. If the two variables had identical
distributions then all the off-diagonal cells would be empty. The index of
dissimilarity is simply the proportion of cases that appear in these offdiagonal cells and may be thought of as the proportion of changes needed to
change the one distribution into the other. The index does not require
equal numbers of values in the variables.
Name
Command
Type
Range
Index of dissimilarity
MEASURES
ID
dissimilarity
low = 0, high = 100
18.2.2.1.2 Ordinal level measures
At present, there are three measures of ordinal agreement in WOMBATS, all
related to the basic tau (τ) measure of Kendall (19..). τb, τc and Goodman
and Kruskal's gamma (γ). There are two important distinctions in
considering these measures. First, we need to know if they measure weak or
strong monotonic agreement between the variables and secondly how they
treat tied values in them. This second distinction can be crucial since
much ordinal level data, being composed of a relatively small number of
categories, will contain a large proportion of tied data values.
Consider a two-way table between ordinal variables x and y. For any pair of
individuals i,j , one of the following five conditions will hold:
a)
Concordant (C): where X and Y order the individuals in the same
way (if i is higher(lower) on X, the j is higher(lower) on Y)
b)
c)
d)
e)
Discordant (D): where X and Y order the individuals in opposite
ways
Tied on X (Tx)
Tied on Y (Ty)
Tied on both X and Y (Txy)
The numerator of all the ordinal measures here considered is the difference
between numbers of concordant and discordant pairs. They differ in the form
the denominator takes.
Name
Command
Type
Range
Formula
Goodman and Kruskal's gamma (γ)
MEASURES
GAMMA
similarity measure
low = -1, high = +1
γ = (C-D)/(C+D)
Comment
Name
Command
Type
Formula
Measures the weak monotonic agreement between the
variables, taking the ratio of the difference between
concordant and discordant pairs to their sum. It thus
ignores the ties completely. For this reason it is
possible that the value be undefined (i.e. there may be
no cases). If there are no ties then the index reduces
to Yule's Q (D15). Some thought should be given to the
interpretation of the negative values before the results
are scaled.
Kendall's tau-b (τb)
MEASURES
TAUB
similarity measure
τb = (C-D) / {√(C+D+Ty).√(C+D+Tx)}
Range
low = -1, high = +1
Comment
Measures strong monotonic agreement in the variables,
relating the difference between concordant and discordant
pairs of the geometric mean of the quantities arrived at
by adding in the ties to the denominator. This should be
used only for square tables.
Name
Command
Type
Formula
Kendall's tau-c (τc)
MEASURES
TAUC
similarity measure
(corrects for non-square tables)
Range
low = -1, high = +1
Comment
In the formula, m stands for the lesser of the number of
rows and columns in the original matrix. The statistic
may be used for non-square tables and reduces, in the
case of square ones to tau-b.
18.2.2.1.4 Interval level measures
The interval level measures currently available in WOMBATS are productmoment measures (covariance and the product-moment correlation) and
Euclidean distance.
Consider the conventional scatter-plot of, a number of cases measured on
two variables. These cases may be represented as points in a space, the
two dimensions of which are the variables concerned. (The statement holds
for more than two variables, of course.) The Euclidean distance between
the cases is the straight line distance between the points which represent
them. The correlation between each pair of points is simply the cosine of
the angle between the two vectors drawn from the origin to the points
concerned and the covariance is that same cosine multiplied by the length
of the vectors.
Command
Type
Range
Comments
MEASURES
DISTANCE
dissimilarity
low = 0, high = maximum variance in the variables
If the ranges of the variables involved are markedly
different, then some attempt at rescaling (i.e.
normalisation) should be made so that differences in a
highly valued variable do not swamp out differences in
one of humbler dimensions.
Does not take into account the extent to which the
variables are correlated. (A measure which does so is
Mahalanobis 1936, qv.)
Command
Type
Range
Comments
MEASURES
COVARIANCE
similarity
low = 0, high = highest variance
The interpretation given to the negative values should be
carefully thought out before scaling.
Command
Type
Range
Comments
MEASURES
CORRELATION
similarity
low = 0, high = 1
The negative values may need to be given some thought
before the results of this calculation are scaled.
18.2.3
FURTHER OPTIONS
18.2.3.1
Measures between cases
It may be that the user wishes to have the measures calculated between the
cases (subjects, individuals) in the analysis rather than the variables.
This is accomplished simply by specifying in the PARAMETERS command, the
keyword ANALYSIS, followed in brackets by the figure 1.
This command has the effect of calculating the measures between the
entities designated as cases and is independent of the MATFORM parameter.
18.2.3.2
Multiple analyses
Only one measure may be calculated at each TASK NAME. In order to
calculate more than one measure on the same data at one time, more than one
TASK NAME should be contained in one RUN.
The TASK NAME command also
resets PARAMETERS values to their original (default) values and it is
necessary to reset these on subsequent runs, as required.
18.3. OUTPUT OPTIONS
The measures are output by default as a lower triangular matrix suitable
for input to other procedures in the NewMDSX library. There is no need to
signal this output with a command. Other options are available which match
different conventions in other programs (see below) and in this case it is
necessary to specify the output format for the measures.
18.3.1 Secondary output
If an OUTPUT FORMAT statement is included, specifying a valid FORTRAN format
in brackets, this will be used to save the matrix in an optional secondary
output file. By default, there is no secondary output.
18.3.2
Alternative output forms
By request, measures may be output as an upper triangular or as full
(symmetric) matrix. This is accomplished by use of the keyword OUTPUT in
the PARAMETERS command:
• The default specification OUTPUT(1) gives a lower triangle without
diagonal, and
• OUTPUT(2) a lower triangle with digonal, and
• OUTPUT(3) a full matrix.
This parameter does not affect the operation of the OUTPUT FORMAT command,
if used.
18.3
Examples
RUN NAME
TASK NAME
NO OF STIMULI
NO OF SUBJECTS
LEVELS
OUTPUT FORMAT
MISSING
PARAMETERS
MEASURE
READ MATRIX
1. 1. 3. 4.
1. 2. 3. 3.
2. 4. 3. 3.
4. 3. 3. 4.
3. 2. 3. 2.
4. 3. 3. 4.
3. 3. 2. 1.
1. 1. 4. 3.
3. 4. 3. 1.
3. 4. 2. 1.
1. 2. 1. 1.
3. 3. 4. 2.
4. 3. 2. 1.
1. 2. 1. 2.
2. 3. 4. 1.
COMPUTE
TASK NAME
NO OF STIMULI
WOMBATS TEST PROG
CORRELATION TEST
4
15
INTERVAL (1 TO 4)
(1X,3F13.7)
2.(2 , 3) 3.( 4)
OUTPUT (1)
CORREL
CUBE
8
NO OF SUBJECTS
3
LEVELS
INTERVAL (1 TO 8)
MEASURE
DISTANCE
READ MATRIX
0. 0. 0. 0. 1. 1. 1. 1.
1. 1. 0. 0. 1. 1. 0. 0.
1. 0. 1. 0. 1. 0. 1. 0.
COMPUTE
TASK NAME
TAU AND SIMILAR
NO OF STIMULI
4
NO OF SUBJECTS
15
LEVELS
INTERVAL (1 TO 4)
MISSING
2.(2 , 3) 3.( 4)
PARAMETERS
OUTPUT(1)
INPUT FORMAT
(8F3.0)
MEASURE
GAMMA
READ MATRIX
1. 1. 3. 4.
1. 2. 3. 3.
2. 4. 3. 3.
4. 3. 3. 4.
3. 2. 3. 2.
4. 3. 3. 4.
3. 3. 2. 1.
1. 1. 4. 3.
3. 4. 3. 1.
3. 4. 2. 1.
1. 2. 1. 1.
3. 3. 4. 2.
4. 3. 2. 1.
1. 2. 1. 2.
2. 3. 4. 1.
COMPUTE
TASK NAME
INDEX OF DISSIMILARITY TEST
NO OF CASES
4
NO OF VARS
4
PARAMETERS
OUTPUT(5)
INPUT FORMAT
(4F3.0)
MEASURE
ID
READ MATRIX
58 22 41 19
30 38 14 23
25 44 19 22
07 51 12 51
COMPUTE
TASK NAME
PHI
NO OF STIMULI
4
NO OF SUBJECTS
15
LEVELS
INTERVAL (1 TO 4)
MISSING
2.(1 , 3) 3.( 4)
PARAMETERS
OUTPUT(3)
INPUT FORMAT
(8F3.0)
MEASURE
PHI
READ MATRIX
1. 1. 3. 4.
1. 2. 3. 3.
2. 4. 3. 3.
4. 3. 3. 4.
3. 2. 3. 2.
4. 3. 3. 4.
3. 3. 2. 1.
1. 1. 4. 3.
3. 4. 3. 1.
3. 4. 2.
1. 2. 1.
3. 3. 4.
4. 3. 2.
1. 2. 1.
2. 3. 4.
COMPUTE
FINISH
1.
1.
2.
1.
2.
1.
REFERENCES
Coxon, A.P.M. (1982) The User’s Guide to Multidimensional Scaling, London,
Heinemann
Everitt, B.S. and Rabe-Hesketh, S (1966) The Analysis of Proximity Data,
London, Arnold
Gower, J.C. (1971) Statistical methods for comparing different
multivariate analyses pf the same data, in C.R.Hodson, D.G.Kendall and
P.Tăutu eds. Mathematics in the Historical and Archaeological Sciences,
Edinburgh University Press, pp. 138-149.
Gower, J.C. amd Legendre, P. (1986) Metric and Euclidean properties of
dissimilarity coefficients, Journal of Classification, 5, 5-48
Sokal, R.R. and Sneath, P.H. (1963) Principles of Numerical Taxonomy,
London, Freeman