1
IAEA-TECDOC-1011
Intercomparison of
gamma ray analysis
software packages
INTERNATIONAL ATOMIC ENERGY AGENCY
p
UZr-\
April 1998
The IAEA does not normally maintain stocks of reports in this series.
However, microfiche copies of these reports can be obtained from
IN IS Clearinghouse
International Atomic Energy Agency
Wagramerstrasse 5
P.O. Box 100
A-1400 Vienna, Austria
Orders should be accompanied by prepayment of Austrian Schillings 100,
in the form of a cheque or in the form of IAEA microfiche service coupons
which may be ordered separately from the IIMIS Clearinghouse.
The originating Section of this publication in the IAEA was
Physics Section
International Atomic Energy Agency
Wagramer Strasse 5
P.O. Box 100
A-1400 Vienna, Austria
INTERCOMPARISON OF GAMMA RAY
ANALYSIS SOFTWARE PACKAGES
IAEA, VIENNA, 1998
IAEA-TECDOC-1011
ISSN 1011^289
©IAEA, 1998
Printed by the IAEA in Austria
April 1998
FOREWORD
With the advances in personal computers, software packages started to play a key role m the control,
acquisition and validation of the data in nuclear experiments In particular, because of the wide
range of applications of gamma ray spectrometry, gamma ray spectrum analysis software packages
are among the most used software in any nuclear laboratory They are being used in such important
applications as environmental studies, low level monitoring, neutron activation analysis, accelerator
based nuclear analytical techniques, and a number of medical applications On the other hand such
software packages are expensive Therefore, it would be of general common interest to have precise
and specific information available on the present status and performance of advanced gamma ray
spectrum analysis software
The IAEA undertook an intercompanson exercise to review available software This TECDOC
describes the methods used in the intercompanson exercise, characterizes the software packages
reviewed and presents the results obtained Only direct results are given without any
recommendation for a particular software or method for gamma ray spectrum analysis
Since this report covers a wide selection of commercially and non-commercially available software
and reports their performance under different circumstances, it reflects to some extent the present
state of the art in the field of gamma ray spectrometry analysis software
This TECDOC will be useful to a wide range of persons, including university students, technical
staff doing gamma ray spectrometry, software programmers, scientists interested m technical aspects
of data analysis m gamma ray spectrometry, software operators and executive directors or project
managers who might be involved in setting up a project m this field or involved in the process of
purchasing equipment and software.
The IAEA is grateful to M Blaauw for his work on the drafting and editing of the manuscnpt
S Fazmic and V Osono of the Division of Physical and Chemical Sciences were the IAEA officers
responsible for this publication
EDITORIAL NOTE
In preparing this publication for press, staff of the IAEA have made up the pages from the
original manuscript(s). The views expressed do not necessarily reflect those of the IAEA, the
governments of the nominating Member States or the nominating organizations.
Throughout the text names of Member States are retained as they were when the text was
compiled.
The use of particular designations of countries or territories does not imply any judgement by
the publisher, the IAEA, as to the legal status of such countries or territories, of their authorities and
institutions or of the delimitation of their boundaries.
The mention of names of specific companies or products (whether or not indicated as registered)
does not imply any intention to infringe proprietary rights, nor should it be construed as an
endorsement or recommendation on the part of the IAEA.
CONTENTS
CHAPTER 1: INTRODUCTION ...................................................................................
1
CHAPTER 2: THE TASK ..............................................................................................
2
2.1. Procedure for testing the spectrometry programs .........................................
2
CHAPTER 3: THE TEST SPECTRA ............................................................................
4
3.1. Definition of the task ......................................................................................
4
3.2.The measuring set-up ......................................................................................
6
3.3. The measured spectra .....................................................................................
8
3.4. Observed properties of the measured spectra .................................................
10
3.5. Manipulations of the measured spectra ..........................................................
11
3.6. Determination of the reference peak positions and areas ...............................
12
CHAPTER 4: THE METHOD .......................................................................................
13
4.1. Data handling .................................................................................................
13
4.2. Peak area re-normalization .............................................................................
15
4.3. Computation of standardized residuals and reduced sums of squares ............
15
CHAPTER 5: WHAT DO THE NUMBERS MEAN? ..................................................
16
CHAPTER 6: THE CANDIDATES ..............................................................................
20
6.1. ActAn, version 2.5 .........................................................................................
20
6.2. GammaTrack, version 1.3 Release 2 ..............................................................
23
6.3. Gamma Plus, version 1.02.0 ..........................................................................
25
6.4. Gamma Vision, version 2.3 ............................................................................
26
6.5. Gamma-W, version 17.08 ..............................................................................
28
6.6. Ganaas, version 3.3 ........................................................................................
29
6.7. GeniePC, version 2.2 .....................................................................................
32
6.8. Hypermet-PC, version 4.00 ............................................................................
36
6.9. OSQ/Professional, version 6.3 release 1 ........................................................
38
6.10. Sampo 90, version 3.6 ..................................................................................
40
6.11. Span, version 5.1 ..........................................................................................
43
6.12. InterWinner/WinnerGarnma, version 3.42 ...................................................
44
CHAPTER 7: OVERVIEW ...........................................................................................
47
CHAPTER 8: RESULTS AND DISCUSSIONS ...........................................................
61
8.1. Peak detection ability .....................................................................................
61
8.2. Peak shape model dependency of absolute peak determination ....................
62
8.3. Interpretation of the 5C -values ......................................................................
"^
8.4. Singlet peak area and uncertainty determination .........................................
64
8.5. Doublet peak area and uncertainty determination .........................................
66
CHAPTER 9: CONCLUSIONS .....................................................................................
70
REFERENCES..............................................................................................................
71
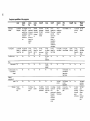
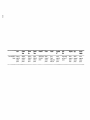
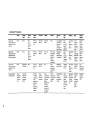
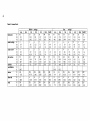
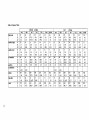
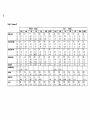
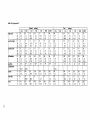
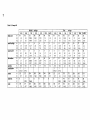
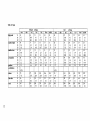
APPENDIX I: TABLES OF RESULTS .......................................................................
73
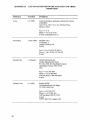
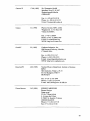
APPENDIX II: LIST OF TESTED SOFTWARE PACKAGES AND THEIR
PRODUCERS........................................................................................
86
CONTRIBUTORS TO DRAFTING AND REVIEW ..............................................
89
Symbols used
In this document a number of symbols are adopted in order to catch the attention and provide a fast
guide to the reader. They are as follows
ft
Advantages issues
^
Disadvantages
®
Improper performance or error encountered during the operation of the software. This is more
known as a Bug in the program
O
Tips or Hints on a certain issue
I «" For Notes
The two first are purely based on the subjective opinion of the participants and authors of this report.
A companion diskette with the set of test spectra and the programs for processing the test results is
attached.
CHAPTER 1: INTRODUCTION
With the advent of powerful computers and structured programming languages, the software has
reached an important level as the "logical controller" at different stages; from a single instrument to
an entire computer-controlled experiment. That is also the case for software packages in nuclear
instruments and experiments.
Today, software in nuclear techniques and experiments controls the instrument's operation, performs
the data acquisition, storage and their validation and analysis.
In particular, because of the wide range of applications of gamma ray spectrometry, software
packages in this field are among the most used. There is a vast selection of commercial and opendomain software packages that has been designed for the efficient and correct analysis of highresolution gamma ray spectra. It is the aim of this intercomparison to test and describe the abilities
of 12 such software packages.
In the past, similar intercomparisons have been made and reported in the literature[1-6]. They all
deal, in one way or the other, with topics like:
•
precision of the programs finding peaks (large, small ones in low baseline, small ones on the
Compton edge, etc.),
•
precision finding multiplets,
•
accuracy and correctness performing energy, FWHM and efficiency calibration,
and many others.
They all rely on different sets of test spectra [2, 3], which in many cases did not represent real
measured spectra and lacked statistical correctness. On the other hand, the ANSI standard 42.12,
section 8 [7], specifies methods to verify the performance of such software packages. The basic
concepts of this standard were applied to selected programs by Koskelo [8-10].
After an Advisory Group meeting (AGM) organised by the IAEA it was recommended to perform
an intercomparison of gamma ray spectrum analysis software based on a new set of test spectra [11].
This time, the main objective of the proposed intercomparison was to focus on aspects such as:
•
the ability of the programs to determine the peak areas and the peak area uncertainties,
•
the peak positions and the peak position uncertainties,
•
and the statistical control and stability of reported results.
The idea is: "It is not so important how successful the program is in finding (or not) a small peak (in
different situations), as much as how the found peak is reported and how stable is that finding."
Meaning, if a program finds a small peak on a large baseline, it is very difficult to judge its
existence, in this case it is more important to have it reported with corresponding large uncertainty.
A program that missed such a small peak should not be "penalised" as much as in the previous
intercomparisons; because such a peak is "doubtful" and the amount of information that it might
carry can be poorly extracted.
The above-mentioned phrase also means that it is important that results are correctly reported in
statistical meaning and that a program should operate and give stable results.
These were the syllabus and objectives of our task.
In this report, the task, methods and results of the intercomparison are presented in order to assist the
potential users of such software and to stimulate the development of even belter y ray spectrum
analysis software.
A companion diskette is attached to this TECDOC. It contains the set of test spectra and the software
for processing the test results.
CHAPTER 2: THE TASK
2.1. Procedure for testing the spectrometry programs
The first stage of the intercompanson is the preparation of the test spectra. This is described in detail
m the next chapter. However a short description of the spectra is relevant in this part of the report.
The list of test spectra is as follows:
CALffiASC
calibration spectrum containing Co-57, Cs-137, Na-22,
Mn-54 and Co-60.
STRAIGHT.ASC
Ra-226 + progeny spectrum, counted for 2000 s.
DISTORT ASC
same as above, but counted in the presence of a Am-241
source to induce high-energy tailing.
ADD IN 1 ASC
Sum of two Ra-226 spectra, one of them shifted by 3
channels to the right.
ADD3N1 ASC
Sum of two Ra-226 spectra, one counted for 2000 s, one
for 667 s, the second shifted to the right by 3 channels.
ADD1N3 ASC
Sum of two Ra-226 spectra, one counted for 2000 s, one
for 667 s, the second shifted to the left by 3 channels.
ADD10N1.ASC
Sum of two Ra-226 spectra, one counted for 2000 s, one
for 200 s, the second shifted to the right by 3 channels.
ADD1N100.ASC
Sum of two Ra-226 spectra, one counted for 2000 s, one
for 20 s, the second shifted to the left by 3 channels.
The participants m the workshop' had the responsibility of testing either one or two programs each
from the 12 programs that were available for the test2 All the participants were considered
expenenced y ray spectrometnsts. They also represented a wide-range of users: from developed
laboratones to spectrometnsts from developing countries. Among the participants there were also
expenenced programmers and persons with expenence in statistical analysis of data
All the programs were tested as received on onginal diskettes as provided by the manufacturers,
together with protection keys (if there was any) and the full documentation as it is distributed on
commercial basis or the documentation "as received" from the manufacturei for the participation in
the intercompanson No "special made" software was accepted for the intercompanson.
Each participant was asked to spend at least 4 hours familiansing himself with the manuals before
attempting to install the corresponding software in his assigned computer. The computer capabilities
and configuration were also carefully done in order to match or exceed the requirements of the
manufacturers
As a separate exercise, programs were tested in different hardware configurations or
drivers: e.g. double-space drivers (like Stacker®) , running with many TSR programs in
RAM, SCSI drivers, etc. This was done only with the purpose to test the stability of the
operation of the programs.
1
See Contributors to Drafting and Review for complete list of participants.
' See Appendix II for complete list of tested software packages and their providers
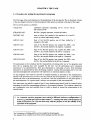
After the programs were installed in the respective computers, first energy and shape calibration was
performed using the spectrum CALIB and a reference list of peaks, as followsChannel
Energy (keV)
301
122.06
1281
511.00
1661
661.66
2097
834 84
2951
117324
3207
1274 54
3353
133250
The reference lists specify peak positions in terms of energy. To separate the problem of peak
position determination from the simpler problem of energy calibration, the conversion from channel
to energy was performed by a program that applied the same energy calibration to the output of all
programs, allowing for different methods of numbering of channels: some programs start counting at
channel # 1, others at # 0 Also, it was found that, for the added spectra, a slightly different energy
calibration is optimal than for the "straight" and "distort" spectra For both groups, a quadratic
energy calibration was applied. For the added spectra, the relation between peak position p and
energy E used is given by
E = 2.78 + 0.396952p - 4 OxlCT 8 p 2
and for the "straight" and "distort" spectra
E = 2.78 + 0.396952p - 7.0x10 8p2
The same conversion program yielded output in a standard format similar to the format of the
reference lists, containing peak positions in terms of energy and peak areas, both with their absolute
1 standard deviation uncertainties. This step was not entirely trivial, because only a few programs
did report uncertainties in the peak positions, i.e. Gamma-W, Hypermet-PC and Sampo90 For all
the other programs, which reported energies with two or more digits after the dot, implying
uncertainties of less that 0.01 keV, these uncertainties were set to 0.01 keV Also, not all programs
reported 1 standard deviation uncertainties The reported uncertainties were converted to one
standard deviation absolute uncertainties according to the definitions given in the documentation of
the programs
The second stage of the comparison was to analyse the STRAIGHT and multiplet (ADD*) spectra in
what we called the Automatic Mode, using the calibration above-mentioned This means a noninteractive analysis based on the default parameters for spectrum analysis provided by the producer
of each program or in the absence of default parameters the values suggested in the documentation
of each program in the "Getting Started" or equivalent chapter. The idea was to run each of the
programs in the same way that an inexperienced end-user or beginner would be expected to do so
The results were saved as ASCII files and processed by the comparison program (described latter in
this chapter)
The third stage was to analyse the same spectra again in non-interactive mode but this time using the
best possible set of parameters3 for analysis. The only restriction being that energy and shape
calibration data should come from the test spectrum. This part of the test tries to emulate as much as
possible the results that an expert user would get from a large set of spectra when an interactive
analysis would not be possible The STRAIGHT spectrum was used to optimise the different
analysis parameters by experimenting with different values and checking the results The same
parameters were applied to the ADD* spectra. To chose the best possible set of parameters the
documentation provided was, of course, heavily referred
3
Up to the judgement of the experimenter or user
Finally, a fiilly interactive analysis was performed for the STRAIGHT spectrum, using as initial
values of the parameters the optimum values found in the third step. During the interactive analysis
all the possibilities for improving the results in each region of interest were used This depends
very much on the program being tested as some programs allow to change many items (add or delete
peaks, change the fitting regions, background models, etc ) while other programs allow only to add
or delete peaks Certainly, the quality of the results in this test are more subjective than others and
also will depend on the flexibility of the program and the accuracy with which each program
interprets the operator commands'1
A last test was devised and applied to some of the programs. In this test the STRAIGHT spectrum
was used and a list of all the peaks of a ^Ra spectrum was provided to the operator This time the
participants were asked to use the interactive features of the programs in order to reproduce the list
of references as accurately as possible Due to the problems described above this last test was not
considered successful as no significant improvement in the results could be achieved for the tested
programs.
All the results for each type of test were correspondingly coded. The analysis and processing of the
results were done only after all tests were performed.
CHAPTER 3: THE TEST SPECTRA
The so called "Test Spectra" are a set of gamma ray spectra that served as bases and common
spectra analysed with the different software packages during the mtercompanson.
They were acquired experimentally, following most of the recommendations made by an Advisory
Group Meeting (AGM) held in Vienna, December 1994 at IAEA HQ, and reported in its Final
Report [11] During this AGM the need for new reference spectra was emphasised, to be used for the
mtercompanson of different y ray spectrum analysis software packages and for quality assurance
and quality control purposes. It was stated that these new test or reference spectra should be real
and measured spectra which should therefore contain no model dependent peculiarities nor any
unphysical characteristics. A subsequent meeting would then have the task to generate such spectra
to be used for a software mtercompanson in another action
3.1. Definition of the task
It was agreed that the reference set of spectra are to be measured with a high-purity germanium
detector which contains a p-type crystal The detector shall have a relative efficiency of not more
than 20% in order to supply test spectra which do not significantly deviate from the spectra
measured in many of the nuclear analytical and research laboratones. The resolution (FWHM at
1332 5 keV) of the detector should be good (around 1.8 to 2.0 keV) and the crystal should exhibit no
major defects which might show up as peak shape distortions in the measured spectra
The measurements of spectra should be performed m a temperature-stabilised environment where
major vanations of electronic properties due to vanations of the ambient temperature can be
excluded The electronic components used should be commercially available units which are neither
specially configured nor modified in any way The setting of the amplifier and ADC should be such
that the energy range going up to ca 3000 keV is measured in an 8k (8192 channels) spectrum In
' Some tested software proved to be extremely reluctant to perform the fitting, the way the operator wanted
contrast to the recommendation of the former AGM the experts in this meeting have decided to
measure 8k spectra rather than 16k spectra. The reason for this deviation from former proposals is
that the commercial market mostly supplies ADCs with a conversion gain of 8k and only new units
allow to digitise onto 14-bit numbers. In addition, many existing MCA units do not support 16k
spectra. Displaying an energy range of ca. 30 keV to ca. 3000 keV on 8k channels, the resolution
function (FWHM vs channel number) is expected to span the range from FWHM=2 channels at the
low energy end to FWHM=6 channels at high energies. This would allow to test also the ability of
codes to treat very narrow peaks in a correct way.
The following basic rules pertinent to this task are defined:
•
Spectra must contain only real, measured data without any synthetic or model-dependent
modifications.
•
Peaks in the spectra must have peak areas which span the range from >50000 counts (very large)
to below the detection limit.
•
Manipulations of spectra must not modify the correct statistical nature of the counts per channel
distribution, i.e.:
Spectra must not be scaled,
Spectra must not be subtracted,
Spectra may be added.
•
Manipulations of spectra must not modify intrinsic dependencies of the detector used, such as
e g the resolution function or the Peak to Compton ratio (P/C) as a function of the peak energy
•
Numbers to be quantified must be obtained in such a way that no system- or model-dependent
properties will influence them.
For the generation of multiplet peaks with known ratios of the peak-areas, however, one has to
violate some of the above restrictions. It was decided that multiplets should be generated through the
adding of two spectra which were measured under absolutely identical conditions but with different
real counting times Thus, the ratio of the areas of the same peak is well known through the ratio of
the counting times The multiplet nature should be generated in such a way that one spectrum is
shifted by a small number of channels before making the adding procedure. In this way, well
characterised multiplets can be generated preserving at the same time the exact nature of the
resolution function Most, if not all spectrum analysis programs, however, make a similar
assumption that the variance of closely neighboring peak-shape functions is the same, i.e
overlapping or closely neighboring peaks are analysed using the same FWHM value for the
functions. This violation of the above restrictions is considered permissible as long as the shifts are
small with respect to the FWHM of peaks at low energies in the spectrum It was decided to restrict
these shifts to less than twice the FWHM values at low energy which is less than 4 channels. This
will lead to peak separations of ca. 1.5*FWHM at low energies and ca. 0.5*FWHM for peaks above
2 MeV It should be noted that the adding of a shifted spectrum will lead to unphysical distortions in
the first and last channels of the resulting spectrum. These channels may not be used for any kind of
determinations or quantification.
It was decided that several series of spectra should be measured out of which the reference spectra
for the mtercompanson are generated. The radioactive source or sources to be used should emit a
complex photon spectrum which is measured as a gamma ray spectrum with many peaks It is
desirable that the spectrum a priori contains clearly separated singlet peaks as well as multiplets
Radioactive sources available for the measurement were
•
40 kBq of 243Am which generates a spectrum with lines up to 334 keV,
•
70 kBq of 227Ac which generates a spectrum with lines up to 1109 keV,
•
160 kBq of 22 ^Ra (and progeny) which generates a spectrum with lines up to 2448 keV
All sources are sealed sources which have passed the prescribed wipe tests The 22^Ra source was
also tested for the emanation of radon and no significant outgassmg has been found.
It is finally agreed that the test spectra should be measured from the 226Ra source at a large distance
between the source and the detector endcap
The spectrum measurement scheme was set up in the following way
•
20 spectra were measured for 2000 seconds real time each, from which was determined the
stability of the measuring set-up The sum spectrum of these 20 was used to generate the set of
known peak positions and relative peak-areas
•
A "calibration" spectrum from commercially available radioactive standards sources was
acquired which have a simple photon emission pattern This spectrum can be used for any kind
of calibration purpose required from the analysis programs. The calibration spectrum was
decided not cover the whole range of energies as found in the test spectra, to force the testing of
the physical meamngfulness of any calibration curves determined and used by the analysis
programs
•
A set of spectra was measured for 2000 seconds real time each, which was used later to perform
the summing of multiplets No spectrum was used twice in the summing procedure
•
Several spectra for known real times of 667 seconds, 200 seconds, and 20 seconds were
acquired, which were added with a 3 channel shift to one of the above 2000-seconds spectra
This generated multiplets with known peak-area ratios of 3 1, 10:1 and 100 1 with respect to the
peaks in the 2000-seconds spectrum
•
A spectrum where the peak-shape is distorted through random coincidences with photons
coming from another highly active 24lAm source has been measured as well This source
completely distorted the spectrum in the low-energy regime but the only significant influence at
higher energies was through random coincidences alone, resulting in high energy tailing of all
peaks
3.2. The measuring set-up
The measurements were performed in room no. B09ZK92/1 in the B-building of the IAEA
headquarters The room is situated in the centre of the building, it has no windows and the aircondition keeps its environment conditions very stable The following units were used for the test
Semiconductor Detector
p-type coaxial, one open end, closed end facing the window
Canberra model number GC1318-7500
High voltage +5000 Volts
Relative efficiency 12 6%
Resolution at 1332 5 keV = 1 72 keV
Resolution at 122 keV = 700 eV
P/C = 47 3
30 litres dewar with vertical dipstick
Preamplifier
Canberra model 2001C
High Voltage BIAS
Canberra model 3125, operated at +4500 Volts
Linear Amplifier
Tennelec TC244 with the following settings
Coarse gain *20
Fine gain *1 000
Peaking time 8 microseconds
Pulse shape Gaussian
BLR manually set, symmetric, using an oscilloscope for control
Input polarity negative
Output unipolar
Pileup rejector off
ADC:
Canberra model 8077 with the following settings:
Range and Gain 8K
Offset 0
Peak detect AUTO
PHA mode
No coincidence condition
MCA:
Canberra S-100 plug-in card in PC with an Intel 25 MHz 80486 CPU
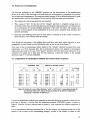
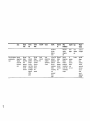
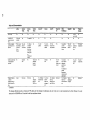
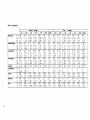
Resulting in a set of spectra as follows:
Table 1 Set of measured spectra and their specifications
Spectrum
name
Real time
in
seconds
Remarks
SDOOOO.MCA
through
SD0019.MCA
2000
Automated counting with Canberra SI00 software
SD0020.MCA
2000
For comparison, if needed. This spectrum was measured 6 hours
after termination of the above automatic task
SD0021.MCA
667
SD0022.MCA
200
SD0023.MCA
20
SD0024.MCA
2000
SD0025.MCA
through
SD0029.MCA
2000
Another automatic task
SD0030.MCA
2000
Same set-up as before but 37 kBq of additional ^Co on the endcap
SD0031.MCA
2000
Same as before but with several additional sources present
SD0032.MCA
6000
A set of 37 kBq each calibration sources measured at 169 mm
distance from the endcap
SD0033.MCA
40000
The 226Ra source at 178 mm distance from the endcap. High
voltage turned down to +2500 Volts
SD0034.MCA
2000
The
Ra SOurce at 178 mm distance from the endcap. High
voltage at +4500 Volts. An additional 241 Am source with ca. 10
mCi at ca. 280 mm from the endcap.
The detector head was situated inside a small castle with 50 mm average lead thickness. The inside
of the castle was covered completely with 0.5 mm of copper. The ^Ra source was placed in an
acrylic sample holder at 178 mm distance from the detector endcap. The set-up was closed with the
50 mm thick lead cover and no modifications to the system were allowed during all measurements
with the ^Ra source. Before starting the first measurement the components were set to reach
thermal equilibrium for one hour with all voltages applied.
The spectra shown in the Table 1 were measured under the above conditions in the course of the
following four days.
3.3.
The measured spectra
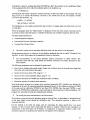
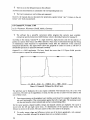
The relevant characteristics of the measured spectra are displayed in the following figures.
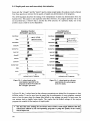
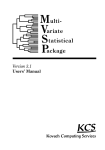
Figure 1. First half of spectrum SDOOOO.MCA.
sec;:
Figure 2. Second half of spectrum SDOOOO.
It is seen from Figs 1-4 that the spectrum contains a large number of peaks, most of which are
clearly separated singlets and only a few small doublet peaks. The very closely situated peaks
around channels number 3500 (see Figure 4) as well as other, smaller doublets are well suited to
create complex quadruplets through adding of spectra after shifting them by a few channels.
SDOCO
10
M
3C
Figure 3. A detailed section of spectrum SDOOOO containing singlet peaks.
: o e z t"j
T SDOOOO
350
325
MI-
Details
3 7'
11 a n
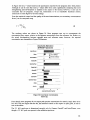
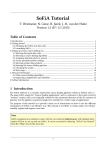
Figure 4. A detailed section of spectrum SDOOOO containing a doublet peak.
All test spectra were generated from this same type of 226Ra spectra as shown in Figure 1 to 4
through adding after shifting (see below). The only spectrum with different characteristics of the
peaks is spectrum SD0034.MCA where a very strong source of 241Am was added in order to
deteriorate the peak-shapes of the 226Ra peaks through random pileup. In Figure 5 the same section
as in Figure 4 is shown from the distorted peak-shape spectrum SD0034.MCA for comparison.
325C
30CC
Figure 5. A detailed section of spectrum SD034 in which peak shapes are distorted
due to random coincidences with low-energy photons.
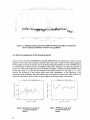
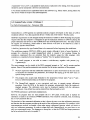
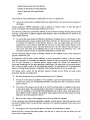
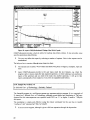
3.4. Observed properties of the measured spectra
The first series of spectra (SDOOOO.MCA through SD0019.MCA) was measured in order to test the
stability of the system and to generate reference data which may be used for later intercomparison.
Several peaks out of the 20 spectra were evaluated and the peak positions as well as FWHM values
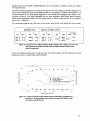
were determined in order to test for the stability of the system. In Figure 6 we show the positions of
a peak (ca. 1900 counts peak-area) in the 20 spectra, and Figure 7 displays the fitted FWHM values
for the same peak. It is seen that the variation of the peak position is on the order of ± 0.1 keV
whereas the resolution of this (small) peak varies quite considerably in the beginning of the
experiment. Both quantities, the peak-position and the resolution become more stable towards the
end of the experiment, which is about 16 hours after the measuring system was powered
S t a b i l i t y of ceakpositions
S t a b i l i t y of seak FWHM
ll
5
10
15
Soectrun nunOer
Figure 6. Positions of a peak in 20
successively measured
spectra.
10
5
10
15
S p e c t r u m nunQer
Figure 7. FWHM of a peak in 20
successively measured
spectra.
3.5. Manipulations of the measured spectra
After considering the negligible instability of the measuring set-up as observed in the first spectra it
was decided to sum up these 20 spectra m order to create a master spectrum which is used to extract
reference data for the peak positions and peak areas. The position values were used in the
mtercompanson exercise for automatic analysis routines as absolute reference values The FWHM
values are not recommended for use in any mtercompanson because the values are dependent on the
model used in the fitting process. The stability of the FWHM values, however, should not be
dependent on the model and it can be used to determine the stability of the system Both the position
and the FWHM values for the peaks are given in terms of channels which is a spectrometnc quantity
and does not require any secondary calibration. It is known that different computer programs define
channels numbers differently, starting to count either from zero or one
For the generation of spectra with multiplets the following spectra were used
SD0024 MCA until SD0029.MCA 6 spectra measured for 2000 sec each
SD0021 MCA One spectrum measured for 667 sec
SD0022.MCA One spectrum measured for 200 sec
SD0023MCA One spectrum measured for 20 sec
Doublet spectra were generated through shifting a spectrum by either +3 channels or -3 channels and
adding it to another spectrum channel by channel. The following added spectra were generated
Table 2: Generated spectra
SD0021MCA added to SD0027.MCA
vf& -3 channels shift
ADD1N3.ASC
SD6022JVICA added to SD0028JWECA
wift +3 «faaaneis shift
ADD10N1.ASC
The newly generated spectra were recorded in an ASCII format as one channel content per line The
first channel of each spectrum contains a counting time which is the sum of live counting times of
the two individual spectra which were summed together, the second channel contains the rfial time
It should be noted that this counting time has limited spectrometnc significance.
The final set of test spectra was conformed as follows"
CALIB ASC:
a calibration spectrum taken from weak point sources (ca. 37 kBq) of
"Co, ^a, 137Cs, MMn and ^Co Small contnbutions from other
natural radionuchdes are also detected m this spectrum, (ongmally
measured as SD0031.MCA).
STRAIGHT ASC
a plain 22*>Ra spectrum measured for 2000 sec real time This
spectrum may be used for any kind of calibration needed by the
software as well as for quantification purposes (ongmally measured
as SD0020.MCA)
PISTQRT.ASC.
a 226Ra spectrum measured for 2000 sec real time, distorted by the
presence of the 24lAm source. The resulting peak shape distortion can
be used to test the stability of analysis programs in circumstances
where calibration and measurement do not agree (ongmally
measured as SD0034.MCA)
ADD1N1 ASC
a multiplet generated spectrum where the peak-area ratios are
11
expected to be 1.1 within statistics
ADD1N3.ASC
a multiplet generated spectrum where the peak-area ratios are
expected to be 1:3 within statistics
ADD3N1 ASC:
a multiplet generated spectrum where the peak-area ratios are
expected to be 3:1 within statistics
ADD10N1 ASC
a multiplet generated spectrum where the peak-area ratios are
expected to be 10.1 within statistics
ADD 1N100 .ASC:
a multiplet generated spectrum where the peak-area ratios are
expected to be 1:100 within statistics
Due to the shift of either +3 or -3 channels the added spectra will exhibit a good separation of peaks
at low energy (ca. 1.5*FWHM) whereas the separation at high energies is very poor (ca
0 5*FWHM) and many of the high-energy doublets may be indiscernible as such. The wide range of
peak separations and peak-area ratios obtained allows for thorough tests of the ability of analysis
programs to separate doublets automatically, with some user interference, or with methods of
definition, whichever is possible or necessary.
3.6. Determination of reference peak positions and areas
As a result of the methods used to obtain the test spectra, no independent (and unbiased) method of
sufficient precision and accuracy is available to determine the peak areas and positions in the test
spectra It was decided that careful analysis of the summed spectrum, with a total counting time of
40,000 sec, by two experts, using two analysis programs in as interactive mode as possible, yields
both positions and energies with the required precision and accuracy to compute good values for the
expected positions and areas in the test spectra. The spectra measured at 40,000 sec have much
worse statistics than the one measured at 2,000 sec and the proposed method is therefore valid. It
was decided to use the programs GAMMA-W [13] and SAMPO 90 [14], because of previous
expertise on them of the staff performing the task.
During analysis, logs were kept on each decision taken. In both programs, the shape and energy
calibrations were made using the spectrum to be analysed itself and the gamma ray catalogue of
Westmeier [15] The peaks used for this purpose were at 74 8 keV, 77.1 keV, 186 0 keV, 295 2 keV,
351 9 keV, 609 3 keV and 1120.3 keV. Second order energy calibration was used. GAMMA-W uses
also second order fitting of the FWHM-channel dependency, SAMPO uses the linear relation
between the square root of the peak width and the channel number. Knowledge of the gamma ray
spectrum of 226Ra and progeny were used in the determination of the peak areas and positions
With each analysis, a list was made of "difficult" peaks For GAMMA-W, these peaks are located at
energies 275 keV, 280 keV, 295 keV, 352 keV, 511 keV, 543 keV, 703 keV, 741 keV, 786 keV,
1253 keV, 1694 keV and 1937 keV For SAMPO, these peaks are at channels 737, 785, 880, 1220,
1280,1528,1864, 1975, and 2074.
After these analysis runs, the lists of results were compared and matched. The results obtained for
the clearly visible peaks, even the ones labeled as "difficult", were in good agreement within
statistics, except for the doublet at 295 keV that is resolved differently by the two programs. This
peak is therefore integrated for total area and labeled as unresolvable in the reference list. For all
peaks where the agreement is good, the unweighted averages of the areas and positions reported by
the two programs were taken as the reference values. As uncertainty of the reference values, the
larger of the 1 standard deviation uncertainties reported by the two programs were taken Many
noisy peaks were found by one program but not by the other. If these peaks have an uncertainty
exceeding 20 %, they will be certainly be invisible in the test spectra with only 2000 seconds
counting time and were therefore removed from the reference list In the cases where the uncertainty
is less than 20 %, the spectrum was inspected visually for the presence of the peaks In all these
12
cases, the peak was observed visually and thus, not removed from the list. The area and uncertainty
reported by the program that did detect the peak were taken as reference values
The last problem is the 511 keV peak: Its area was decided to be determined by integration
The resulting reference list was subsequently used to produce the corresponding reference lists for
the test spectra by applying the identical shifts and dividing both areas and their absolute
uncertainties by the ratio between the counting times of the test spectra and the reference spectrum
CHAPTER 4: THE METHOD
To evaluate the performance of the tested software and to represent the results within the scope of
the objectives (explained in Chapter 1: Introduction) a method for processing of the results was
adopted Here, it is explained m detail.
The aim of the tests for each program were.
•
the quality of the peak area determination,
•
the quality of the estimation of the uncertainty,
•
the same for the peak position determination,
•
the ability of the program to detect peaks and to properly weight them,
•
and the ability to resolve multiplets.
All above for different type of gamma ray spectra.
4.1. Data handling
The overall intercompanson of the results was based on the statistical qualifier z-scores or
standardized residuals This is, the differences of the magnitude reported against the one referred
divided by their own uncertainties
~ Valueref
(1)
V Vrep + ° ref
In such a way, "fair" scores will characterized the different tests, giving proper weight to misses,
false hits, incorrectly quoted uncertainties, etc.
Therefore, for our specific case, the z-scores is the differences between reported values and
reference values divided by their own uncertainties In those cases where both a reported area and a
reference area were available ("hits"), two such z-scores could be computed:
1
A z-score related to the quality of area determination based on the uncertainties in the reference
files, as
2
Z
-
ref -
04,
2
and a z-score related to the statistical control of the analysis program based on both the
reference uncertainty and the uncertainty reported by the analysis program
13
where A«f and A,^ are the reference and reported peak area, and anf and o^ their uncertainties,
respectively Since, 20 is the ratio of the counting times of the reference spectrum and the test
spectra (see Chapter 3), V20a ref was considered the optimum uncertainty to be reported by the
analysis programs Such z-scores are expected to be normally distributed with a zero mean and a
unity standard deviation, i e z-scores higher than 2 or lower than -2 indicates that something is
wrong at the a = 0 05 level
In each comparison run
•
the reference and reported5 list of peaks were matched to begin with For each peak in the list of
reference values, a partner in the list of reported values was looked for
The decision that a match' had been found was taken if the peak positions agreed to
within their quadratically summed uncertainties, or if the distance between the peaks
was less than 0.5 FWHM. The values for this refereed FWHM were taken from the
commonly established calibration curve (see Chapter 2) as determined for the 40,000
seconds counting time spectrum
•
If no match was found in the reference list, the reported peak was considered to be a "false hit"
and only the second z-score (3) could be computed, using zero both as the reference area and as
its uncertainty
•
If the reported area was missing, it was considered a "miss" and only the first z-score (2) could
be computed
With such a method implemented, missing a noisy peak or reporting a false hit with a high
uncertainty in the area do not result in high z-scores and grants a fear punctuation for the program
The same tests were designed for multrplets The added reference spectra contain doublets with
separations varying from 0 4 to 1 2 x FWHM and with different area ratios
•
For this test, if two peaks in the reference list matched one peak in the analysis program output,
i e if both reference peaks were located within 0 5 x FWHM of the analysis result, the two
reference peaks were merged before the computation of z-scores In such a way it is possible to
test analysis programs determining the total area of doublets with small separation
•
For test of peak positions, the same was also done if such two reference peaks were located
within the position uncertainty reported by the analysis program
•
Finally all the computed z-scores were squared, added and the total divided by the number of
peaks m order to obtain reduced sums of squares as the final test results
For the implementation of above-described method a program "CMPSPEC" was written to perform
these tasks As input, this program read two files: The file containing the reference data and the file
containing the tested program's output To obtain the latter, the original output results of the
different programs had to be converted to a uniform format, containing for each peak detected the
peak position and absolute, one standard deviation uncertainty, the peak area and its absolute, one
standard deviation uncertainty
s
By the program
In this report we are going to refer as a hit to an event when a reported value matched (within the expected
deviation) a reference value A miss will be the opposite A false hit when a reported value is not in
coincidence with the reference value
6
14
4.2. Peak area re-normalization
The first task performed by the CMPSPEC program was the determination of the normalization
factors to be used for the correction of all peak areas for each program to compensate for possible
bias in peak areas determination. This step was needed because of the of different methods for peak
area determination, used by the programs. For this task the following steps were performed:
•
The reference list and the measured list were matched.
•
Then, using all "hits" for the case of the "straight" spectrum, a weighted average and its
uncertainty of the ratios of reference peak areas and program output peak areas were determined.
As its uncertainty, the internal standard uncertainty of the mean was taken. The weights used
were the mversed squares of the uncertainties in the area ratios, computed from reference and
reported uncertainty.
•
Peak area ratios differing from unity by more than 0.1, assumed to be the results of incorrect
deconvolutions, were excluded from the average.
Even though this uncertainty is the smallest that could have been taken within the rules of error
propagation, the ratios found were all statistically unity, as can be seen in the Figure 27.
Since none of the re-normalization factors found for the "straight" spectrum deviated from unity
significantly, as will be discussed later, the re-normalization factors were applied to the program
output peak areas only in the case of the "distort" spectrum where the peak areas themselves were
expected to be biased due to dead time. For this spectrum, a dead time relative to the straight
spectrum of app. 9 % was thus established.
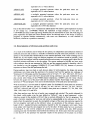
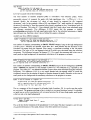
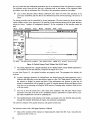
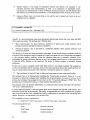
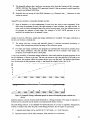
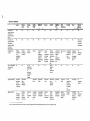
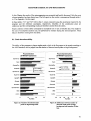
4.3. Computation of standardized residuals and reduced sums of squares
ANALYSIS PROGRAM OUTPUT
REFERENCE DATA
A
E
val
unc
val
E
val
unc
2112.5
0.1
40
2
2120.0
2121.2
2194.1
0.1
0.1
0.1
2195.3
2205.6
2206.8
2207.3
0.1
0.1
0.1
0.2
593
593
16
16
2384
2384
0
6
6
2
2
11
11
0
2112.5
2120.1
2121.5
2194.1
2195.3
2205.8
2206.5
2207.3
A
unc
0.1
0.3
0.2
0.1
0.1
0.2
0.1
0.2
val
0
488
662
0
0
1286
2688
824
unc
z-scores
rep
ref
10
-3.8
37
-2.8 -3.8
44
1.5
2.5
8
-1.7
8
-1.7
51 -20.8 -20.1
64
4.7
5.6
43 | 19.1
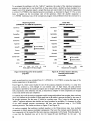
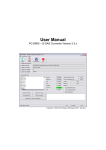
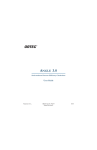
Figure 8. Section of z-score table, showing a "miss" at 2112.5 keV, a reasonable doublet fit
at 2120.0 and 2121.2 keV, and an erroneous doublet fit at 2205.6 en 2206.8 keV,
resulting in a "false hit" at 2207.3 keV.
Z-scores or standardized residuals were computed as described above for each peak in each test (for
each type of spectra). A section from the comparison program (CMPSPEC) output is shown in
Figure 8. From the Z-scores, reduced sums of squares % were computed for different categories of
peaks.
If no re-normahzation had been performed, the £ for any category was computed as the sum of the
squares of the z-scores in the corresponding category, divided by the number of peaks in that
15
category If re-normalization had been applied, the number of peaks in the category minus one was
used m the division for the "hit" categories The categories and their definitions were:
1
Annihilation peak: Any peak closer than 3 keV to 511 keV.
2
High peaks, non-annihilation hits for which the ratio of reference peak area and reference peak
uncertainty is larger than 10, i.e. (\cf I (\/20 cr ref )) > 10
3
Small peaks on high continuum and small peaks on low continuum: Hits for which the peak area
was less or more than 0.5b, respectively, where b is the area of the continuum under the peak.
Knowing that the reference uncertainties were determined from a spectrum with a counting time
20 times longer than the reference spectra, b was estimated from the reference peak area A«f and
its uncertainty aref using
,
20c'-Aref
b = ——&——•—
(4)
•
Any match: All peaks belonging to the previous three categories, i.e high peaks, small peaks on
high and small peaks on low continuum.
•
Misses: Peaks, in the reference list not matched m the reported list of the programs for any of
above categories.
•
False hits: Peaks, in the reported list of the programs not matched in the reference list.
•
Total All previous categories except for the annihilation peak.
A separate yj was computed for a peak position from the differences between reference peak
position and program output peak position and their uncertainties in terms of energy, analogous to
the yj for peak areas.
CHAPTER 5: WHAT DO THE NUMBERS MEAN?
Now that all the methodology has been explained and the tasks to be done were described, probably
you got confused on the ocean of areas, uncertainties, z-scores and reduced x2-
So lets have a look to all of these using examples and some data.
Before anything, keep in mind the formulas described in the previous Chapter This are formulas (2)
and (3) mainly. Take a piece of paper and write them and have them in front of you.
So, after processing the different test spectra we obtained a set of output files from the tested
program. This set is processed by the program CMPSPEC, which gives an ASCII file illustrated in
Figure 8 This output table contents:
•
Energy and uncertainty for Reference as well as for reported processed spectrum.
•
Net Peak Area and uncertainty for Reference as well as for reported processed spectrum.
•
Z-scores calculated with Reference and Reported uncertainties
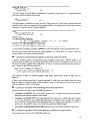
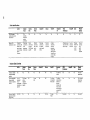
Let's take a look at some of the cases that may happen, just to explain the meaning of our results7Here,
a
table
of
the
CMPSPEC
program's
output
is
presented
7
Here uncertainties in the energy column were omitted in order to simplify our discussion
16
Reported (measured) data
Reference data
Case
En
No
val
val
unc
val
val
unc
1
106.7
101
24
1067
0
109
2
1862
18035
36
186 1
17786
182
-1.3
3
230 6
0
0
230.6
236
85
2.4
4
609.2
0
0
609.2
34921
339
103.
5
609 3
73073
437
609 6
37566
335
-644
Area
En
Area
Z-score
Z-score
rep
ref
-09
-1 5
-177
Case No. 1: The Area reported by the program is 0. That means, this peak at 106 7 keV was not
detected by the program In this case the Z-score is calculated from the reference spectrum value
alone (Zref) If the peak m the reference spectrum has a large uncertainty, therefore the contribution
to the (Zref) will be small, as in this case. Meaning, this peak is not so important m terms of
information that might be extracted from it. So "penalisation" for missing it should not be large In
the opposite case, the program is substantially penalized with a high Zref value, because a significant
peak has been missed And the case is counted for the missed peaks category
Case No. 2: Both areas are different from zero. In this case, the program found a true peak at 186 2
keV This category was classified as Matches. The Z-score is calculated using both the reported
uncertainty (Zrep) and the uncertainty from the reference spectrum (Zref). The fact that values for Zscores are nonzero means that the reported and reference areas are not the same. As long as the
difference between the reported area and the reference one are in statistical control, the calculated Zscores should be low (average value 0, standard deviation 1). Otherwise, the program is penalised
because of an erroneous peak area calculation.
Case No. 3 The area for this peak in the reference spectrum is 0 That means at 230.6 keV was
considered not to be any peak in the reference spectrum This category was classified as False Hits
If the reported uncertainty of the program for that false hit peak is large, then the contribution to the
Zrep will remain low. Illustrating one of the main ideas of the mtercompanson (see Introduction
Chapter), that is, "it is not as bad whether the programs detects or not a peak as much as it detects it
with its corresponding uncertainties" That is telling to the user- "look there might be or not a peak,
it is up to you to decide, and be careful extracting any information from it".
In the opposite case, the program that finds a "doubtful" peak and reports it with great conviction
(small uncertainties) should be heavily penalised, because of such bad habit.
This case gives no contribution to the Z^ value.
Cases No. 4 and 5' This is an interesting example where a false hit and bad area calculation are
present It arises from wrong deconvolution of a very significant peak at 609 3 keV. In this case that
peak has been wrongly sphtted in two peaks: 609.2 and 609 3 keV Therefore the program was
penalized twice, once for making a FALSE HIT at 609.2 keV and second because a wrong reported
value for the area of highly significant peak at 609.3 has been calculated. In this case a significant
contribution is made to both Z-scores.
The CMPSPEC program also reported the following statements after every table of analysis of the
results'
17
TRUE MATCHES
Number of matches for high peaks: 46
related chisqr for areas and reported uncertainty:
and for reported areas with reference uncertainty:
0.8 *
1.2
Let's have a quick look at their meanings
The total number of matches (reported peaks in coincidence with reference peaks, within
permissible interval of variance) for peaks with high significance (A^ / (V20a r e f )) > 10 is
reported Ideally, the chi-square (x2) value8 of unity should be expected for the "reported
uncertainty" case. In this example a value of 0.8 was obtained. The * mark notifies of a significant
deviation of calculated x2 from the expected value (unity), according to the %2 distribution with 46
degrees of freedom The value of 1.2 was obtained when the Z-score values were calculated using
the reference uncertainty. This difference (1.2-0.8) means that the program is slightly
overestimating uncertainties for high significance peaks, that is- the calculated uncertainty is higher
than reference one, therefore a lower value of related chi-square is obtained.
Another case for a different category:
Number of matches for small peaks on high continuum: 7
related chisqr for areas and reported uncertainty: 2.7 *
and for reported areas with reference uncertainty: 2.4
The number of matches corresponding to SMALL PEAKS category lying on the high background
(3 0*Net_Area < GROSS) are reported Again here, the * mark denotes that the deviation of the
calculated chi-square from the expected value (unity) is significant according to the chi-square
distribution The value of 2.4 was obtained when the Z-values were calculated using the reference
uncertainty The difference between Chi-Squares (2.7-2 4) is small, thus meaning that in this case of
small peaks on high background, the uncertainty calculation of the program is accurate.
Number of matches for small peaks on low continuum: 6
related chisqr for areas and reported uncertainty: 2.2
and for reported areas with reference uncertainty: 2.1
The number of matches corresponding to SMALL PEAKS lying on the low background (3.0*Net
Area > GROSS) are reported In this example a value of 2.2 was obtained for x2 reported by the
program The value of 2 1 was obtained when the Z-score values were calculated using the reference
uncertainty. The difference (2.2-2.1) is very small. Besides both chi-squared values he inside the
confidence interval for the number of degrees of freedom obtained (6 peaks) Therefore in the case of
small peaks on low background the uncertainty calculation m the program is accurate
Number of non-511 matches all
together: 59
related chisqr for areas and reported uncertainty:
1.2
and for reported areas with reference uncertainty:
1.4
and the chisqr for their positions:
15.0 *
This is a summary of the chi-squares for all peaks (total of matches. 59) As can be seen the results
are very good. The program resulting in this is certainly m very good statistical control. It calculates
net peak area as well as uncertainties with very good accuracy for all cases (high peaks, small peaks
in the low and in the high background)
FITTING THE 511 keV PEAK
~~
Number of peaks found there: 2
related chisqr:
160.3 *
This is the test for the treatment of the annihilation 511 keV peak. The above example is not the case
of a good determination of this peak, because it has been sphtted into two peaks
' This is the average of the squares of the Z-scores values in a category
18
MISSES AND FALSE HITS
Number of misses: 110
related chisqr:
9.9
The total number of missed peaks is evaluated for a program. A high value of x2 is reporting the fact
that some significant peaks were missed.
Number of false hits: 1
related chisqr:
99.1 *
The total number of false hits is given, as well. A high value of x2 in this case is telling that some
significant false peak was reported by the program. Usually this situation arises from the erroneous
splitting of a significant peak during the analysis.
TOTALS
Number of regarded peaks: 172
related chisqr for areas:
9.2 *
CONSTANTS USED:
• Threshold energy: 100.00 keV.
• Criteria for energy matching:
El - E2 < 2 * sqrt(sqr(dE1) + sqr(dE2)>, or E1 - E2
< 0.5 * FWHM(E1).
• Criterion for high significance: A/ref_err > 10.
• Criterion for high continuum: 3.0 * net < gross.
• Criterion for anmhilaton peak: |E - 511) < 3.0.
As shown here, the analysis program CMPSPEC is also reporting the criteria and parameters used
Now lets gives some Hints and Tips for which qualifiers you should look at in order to find your
golden gamma ray spectrum analysis program.
O
Looking for a general purpose gamma ray spectrum analysis program
A general purpose gamma ray spectrum analysis program should detect "normal" peaks in all
possible types of gamma ray spectra and report them with the correct uncertainty Then in our test
we should look for a program that would gives a %2 values in statistical control (meaning without an
ugly * mark) for the following categories:
Number of non-511 matches all together: 59
related chisqr for areas and reported uncertainty:
1.2
and for reported areas with reference uncertainty:
1.4
This category includes all matches together: high peaks, small peaks, small on high and low
baseline
If there is any problem (you find a * near the reported %2 value), then you should check for which
type of category of peaks the code is given incorrect values. If this will not be your case, you can
have that program in the list of favontes.
O
Looking for a program with outstanding peak search capabilities
Check the following values m the STRAIGHT spectra test
•
Chi-squares of MISSES This value should be near to one. A high value means that significant
peaks from the reference spectrum were missed.
•
Chi-squares of FALSE HITS: This value should be also near to one. A high value of chi-square
in this case means that some significant false peak was reported. Since, usually this situation
arises from the wrong splitting of the significant peak, you should look carefully at it. If this is
not the case, this qualifier can give you a hint for a good peak finder program
•
O
The number of HIGH PEAKS MATCHES should be equal to 48 (8K STRAIGHT spectrum).
Looking for a program with accurate peak area calculation in simple spectra
Look to following values in the STRAIGHT spectra test •
19
•
The number of HIGH PEAKS MATCHES should be equal to 48 (8K STRAIGHT spectrum),
but with a value of chi-square for reference uncertainties near to one to be in statistical control
A high value of chi-square for reference uncertainties in this case, would mean that area
calculation of the singlet peaks is incorrect
O
Looking for a program with outstanding accuracy in uncertainties calculation for simple
spectra
Check the followmgs in the STRAIGHT spectra test:
•
The chi-square of the HIGH PEAKS MATCHES for STRAIGHT spectra using reported and
reference uncertainties should be approximately equal. If it is not the case then two cases are
possible:
1 Overestimation of the reported errors by the program: x2 rep < X2 rer
2. Underestimation of the reported errors by the program: x2 rep > X2 «f
O
Looking for a program with high multiplet resolving power
You should use ADD1N1, ADD1N3, ADD3N1 and ADD10N1 spectra for the test:
The complexity of spectra is growing from the ADD IN 1 to ADD10N1 spectra, therefore you can
trace the behavior of the program, as intensity ratios of the rnultiplet peaks are increasing
In this case a good performing program will result in a chi-square using reported uncertainty
around 10 in the HIGH PEAKS MATCHES category . This value is obtained, because usually
some doublets are not deconvoluted therefore a larger value of chi-square for MISSED PEAKS is
obtained. The SMALL PEAKS chi-square value usually is in statistical control for these spectra.
O
Test of my program for different capabilities on relatively simple spectra
Always use the STRAIGHT spectra test.
Many other examples can be brought, but the ones already given are sufficient for you to assemble
the test of your choice. Now that everything has been explained, let us introduce our candidates.
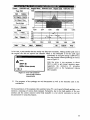
CHAPTER 6: THE CANDIDATES
In this Chapter a short description of each program is given. For certain aspects of the operation of
the programs more detail information is provided complementing the overview description
presented in the Chapter 7. Advantages and inconveniences are also pointed out, whenever possible
Faulty operations encountered during the intercompanson are reported as well For each program a
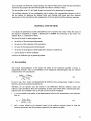
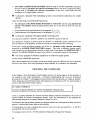
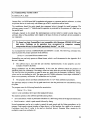
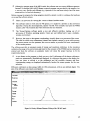
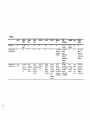
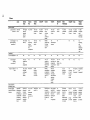
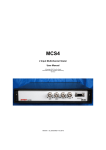
picture of the fitted 186 keV peak is shown.
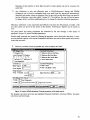
6.1. ActAn, version 2.5
by Centre of Applied Studies for Nuclear Development, Havana Cuba.
ActAn is a gamma spectrum and neutron activation analysis software developed at the Centre of
Applied Studies for Nuclear Development, Havana, Cuba. The development of this program has
been partially financed by an Agency Research Contract No. 5014.
The functions are high resolution gamma ray spectrum analysis and instrumental neutron activation
analysis. A nuclear data library editor is also available.
The design goal was to have a program that could do a fair job on slow and small PC's, i e 286 PC's
running DOS with no extra memory.
The package consists of one 3.25" HD installation floppy and a 20 page User's Manual.
20
Installation is done by running the batch file ENSTALL.BAT that resides on the installation floppy
with as argument the drive where the software needs to be installed, e.g.
A:>INSTALL C:
The batch file will create a directory \ACTAN and copy all files that make up the package. The next
thing to do is to include the directory \ACTAN in the PATH and set the environment variable
ACTAN to that directory, e.g.
PATN=...;C:\ACTAN
SETACTAN=C: \ACTAN
The installation is very simple and primitive (do not allow to change target sub-directories, etc.) but
it works fine.
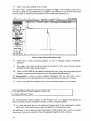
When the program starts the "Main Screen" is displayed. From this main screen, functions can be
accessed via menu's and sub-menu's. A number of functions are available trough the function keys.
The three main functions are:
•
Gamma Spectrum Analysis,
•
Instrumental Neutron Activation Analysis,
•
Nuclear Data Library Editor.
D"
The menu system can be used quite efficiently both with the mouse or the keyboard.
During spectrum analysis, or whenever ActAn displays graphical data, the so-called "Graphical User
Interface" is used, which again can be operated by mouse or keyboard.
Q
The documentation on the actual spectrum analysis procedures is rather limited. The
parameters that affect the peak search and doublet resolution are briefly discussed in the
user's manual.
The following parameters can be adjusted for peak search:
•
Error limit to display peak search results. Peaks with a relative error in the peak area larger than
this value will not be listed in the report
•
Sensitivity for peak search, HW, range 2.7 - 7,
•
Sensitivity for closed multiplets, Rmax, range 0-10,
•
Maximum deviation of FWHM from calibration (DEV_FWHM),
•
Maximum number of residual search iterations.
Initial peak search is based on a square wave correlator (parameter HW). Doublets are detected by
comparing the fit with the measured spectrum (parameter Rmax). If the difference between FWHM
of the peak and the calibration FWHM is less than DEV_FWHM, then the peak FWHM is used
otherwise the FWHM from calibration is used, allowing for deconvolution of closed multiplets. The
program can only add one peak per residual search iteration.
•0-
The actual peak area determination is not documented.
The baseline is removed from the spectrum using an iterative filter. A peak shape is calculated based
on the peak shapes stored during the calibration step. This numerical function is fitted to the
measured spectrum.
For this method to be valid, the peaks used for calculating the shape should have very good
statistics, at least 10 times more counts than the spectra to analyse; otherwise the calculation of
uncertainties in the fitted data will be biased. A consequence of using this method is that if the
calibration spectrum is analysed, zero values for Chi-squares will be obtained.
21
Figure 9. ActAn. Fitting of the 186 keV peak.
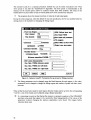
For each spectrum analysed a file with the same name and extension ".SRC" is created containing
all information that can be displayed or listed. An ASCII file with extension ".SRP" contains the
analysis results in a readable form. A typical example is shown below
ActAn v2.5 Peak Search and Area Calculation Report
Spectrum:
Energy calibration:
Peak shape calibration:
C : \ACTAN\IAEA\STRAIGHT . DAT
C : \ACTAN\IAEA\CALIB1. CEN
C : \ACTAN\IAEA\CALIB2 . SHP
Date of processing:12/11/95, 09:16:59
True time:
33.333m
Area error < 99.0 %
Live time:
33.333m
Background Iteration Cycles: 15
Sensitivity for peak search: 2.8
Sensitivity for closed multiplet search: 8
Maximum Deviation of FWHM from calibration: 20 %
Maximum iteration number for peak search in residuals:
Analysing from channel 256 to channel 8095
Crit.Level = Net Area/sqrt(2*Background)
Peak classification:
Normal(-), Small(S), Residual(R), Badfitted(F)
Centroid
[Ch.]
No
1
2
3
4
5
ft
F
S
S
F
F
462.6
499.4
574.5
593.8
603.3
E?
[keV]
186.45
201.01
230.81
238.46
242.25
Net Area
[counts]
18168±
378±
352±
270±
28303±
Background
[counts]
245( 1.3%)
175(46.3%)
157(44.5%)
154(56.9%)
259( 0.9%)
24532
15102
12102
11653
18394
FWHM
[keV]
Chi2
0.83
0.84
0.87
0.87
0.88
14.42
1.09
1.12
8.48
8.48
Crit.
Level
82.0
2.2
2.3
1.8
147.6
The program properly keeps records of the job by listing all the files that were used for
energy and shape calibration and all the parameters that were set for peak search.
For each peak quite complete information is given: the peak position in channels and keV, the net
peak area and the standard deviation (also in percentage), the number of counts in the continuum
under the peak, the FWHM and the x2 value. A qualification, "Normal", "Small", "Residual" or "Bad
fitted" is given to each peak. "Residual" clearly indicates that peak was found during residual search.
Q The definitions of "Small", "Normal" or "Bad" are not given.
22
A parameter "Cnt. Level" is calculated for each peak as explained in the listing, how this parameter
should be used or interpreted is however not mentioned.
It was found usefull and nice capabilities built-in this software (e.g. library editor, among others) but
they are not within the scope of this intercomparison.
6.2. GammaTrack, version 1.3 Release 2
by Oxford Instruments Inc., Tennessee USA
GammaTrack is a DOS gamma ray spectrum analysis program developed on the basis of a MCA
emulation software. As a data acquisition device it works only with Oxford - Nucleus cards.
Hardware requirements are not stringent except for memory available to DOS. Running this program
requires then that the computer is configured to get the maximum memory to DOS by placing the
proper statements and devices m the CONFIG.SYS and AUTOEXEC.BAT files. On many systems
the support for networking, sound cards or extra devices will have to be removed in order to
successfully operate GammaTrack.
A hard-key (protection key type Sentinel) has to be connected before beginning the installation.
The installation program (INSTALL.EXE) is quite simple, although it lacks of some flexibility It
prompts for a directory to install GammaTrack which is created if not existing. During the
installation compressed files are extracted from the diskette using the LHA program. After
installation is completed a browser displays a "readme" file, for updated information.
•0-
The install program is not able to create a sub-directory together with parents (e.g.
c:\gamtests\gt).
The main program, can be started at the DOS command prompt as "gt", and it accepts pipeline
options. Some of the pipeline parameters are essential for the proper operation of the program.
•0-
We have experience that this method for initialization is quite inconvenient as the user needs
to remember the command line parameters, for example that typing gt K will allow erase of
spectra during acquisition.
"0-
The program only accepts data formatted in the proprietary format types *.spt or *.spm .
Even no ASCII formatted data can be read by the program.
ft
The GammaTrack supports a very convenient and easy to operate energy calibration
procedure. From the ROIs in the spectra the program automatically finds the tentatively
standard energies. The calibration curve may be displayed together with the calibration
coefficients. User-defied lines can be entered from the keyboard as well.
The FWHM calibration is performed simultaneously.
However, the program does not treat properly the 511 keV peak. If this peak is marked for
calibration it results in an erroneous FWHM calibration. This could be corrected, only, by deleting
the 511 keV peak from the list.
The drawback of this automated calibration is that it forces the user to use the calibration parameters
and function that the program provides as the result of the calibration procedure. For instance, in this
intercompanson exercise we needed a first order energy calibration function which will result in
only two calibration parameters. In order to obtain that with GammaTrack, we were force to use
only two experimental points. The dangerous in doing this, is that the FWHM and shape parameters
had to be extracted from only two peaks !!!.
23
We have found out that calibration parameters can not be transferred from one spectrum to another.
The problem arises from the fact that any calibration data in the header of the spectrum takes
precedence over data in calibration files. The order of this precedence cannot be overridden.
®
Also a menu function called "Merge calibration data" does not work if the spectrum is not
previously calibrated, and also fails if the calibration has been saved (reporting a division by 0
error).
The fitting procedure can be controlled by several parameters. The main sensitivity factor (and here
higher numbers mean lower sensitivity), the number of peak insertion passes and the peak insertion
sensitivity factor, "number of background channels" for the evaluation of the baseline under the
peak.
Help
File
Analyze
Calc
Setup
Options
Mode
1
Id: Straight SpectruM
Dec 12, 1995
4:59:16 pn
Area roi:
2
17762
Scale:
16K
Peak centre id
E
186.331
Net peak area
17762
±
1.8x
Display'- 64
Chn: 462
keU: 186.47
Cts: 9843
Fl-help
08:83:08 197 Thu Jan 01
+
+
+
*•-!• +
+3
Normalised
Residuals
1 peak
Quit
+ .I.
•
chisqR: 2.43
*
-3
InsXFS-insert pealcCs)
Del-rewowe peak
SPftCE-filJ
on/off
Esc-finish
Figure 10. Oxford Gamma Track. Fitting of the 186 keV peak.
ft
The fitting operation for a simple spectrum in the "default mode" (using default parameters)
was found to be fast and effective, except for the region of 511 keV.
As seen from Figure 10 the splitted windows are properly used. The programs also display the
residuals.
®
Another improper operation of GammaTrack was found during the intercomparison, and is
related to the difficulty to save the analysis results in a file. The "Peak Search" menu has only
the options to display on screen and print. If the unfortunate user chooses to print but no
printer is connected he will be caught in a catch-22 situation between Retry and Ignore whose
only door out is rebooting or killing the DOS session (if running under windows) with the loss
of all the results.
•0- The way to save the results into a file creates some confusion. The file name where results
should be saved has to be set in the "Automatic analysis" parameters as report device, also
the report template has to be set as "peakonly.tpl".
ft
The implementation of the reports of the results, was found to be very flexible and powerful,
through the template definitions of reports, but sometimes complicated.
The software complies with quality assurance and quality control rules.
The software comes with a 266-page Operation's Manual.
•0- Most of the contents of the manual are duplicating the online help file. And it describes the
operation of the version 1.2.
24
6.3. Gamma Plus, version 1.02.0
by Silena S.P.A., Italy
Gamma Plus is a DOS-based MCA emulation and gamma ray spectrum analysis software. As a data
acquisition device it works only with Silena type of MCA acquisition add-on cards.
The installation should be quite simple (see comments below), through the install program. The
software comes in one 3.5 " diskette and its operation is protected by the presence of a hard key in
the parallel port.
Although, claimed to be simple the intercomparison exercise failed to install several times this
software. Most of the problems were related to the type of drivers or hardware devices installed in
our computers.
We found out that GammaPlus is not compatible with Quantum LPS540S SCSI hard
disk drive. Problems on its operation were encountered in computers running
compression drivers for hard disk, particularly Stacker® ver .4.00
An incompatibility between GAMMAPLUS and EMM386 is noted. The following command line,
must be present for proper operation of the software:
DEVICE=C: \DOS\EMM386.EXE FRAME=NONE
GammaPlus can read only spectra in Silena format, which is well documented in the Appendix B of
the user's Manual.
ft
The software has a nice and fast user interface implementation. It also properly uses the
multiples windows facilities.
Energy calibration can be done automatically. In this case the software search the presence of
standards peaks for calibration. The energy values are taken from the provided isotope data library.
The user has also the possibility to enter or erase any peak from the automatic calibration. Energy
values can be user-defined as well. The same goes for FWHM calibration. Peak shape calibration is
done as an asymmetry calibration. All calibrations can be plotted.
ft
The program detects and skips automatically the 511 keV from calibration procedures.
The spectrum analysis is done, first by peak search and then the peak areas are calculated by fitting
the peaks.
The program uses the following formula for uncertainties:
%Error = Z a / Area
where Z is the confidence level and a the standard deviation.
The analysis options in the software provides among others:
•
Area Calculation: which is peak area calculation in a ROI using classical background subtraction
•
Peak Location: which is peak search followed by fitting
Several parameters can be set in order to control the peak search and the fitting procedures, as for
instance: Peak search criteria (number of times above a of the baseline, for a peak to be accepted),
Confidence level (the Z value to be used as described above), Gaussian filter, sensitivity for
multiplets, search on residuals, etc.
25
D" The utility "Info-Peak", was found useful. It can be called from the main menu and performs
a peak search around the current cursor position and then fits the peak(s) found and reports
the position (or energy),the fitting region, the FWHM and the net peak area.
Figure 11. Silena GammaPlus. Fitting of the 186 keV peak. Overview of the graphical user
interface.
The fit is shown graphically in a small window on a linear scale however without the possibility to
change the y-axis
•0' No uncertainties in any of the obtained values or any fit quality criteria such as chi-square, is
reported The parameters that control the fit are the same as those used for the analysis
function.
•0- It is not possible to add or remove individual peaks.
The GammaPlus can perform some spectrum manipulation like: stripping, smoothing and
normalization to factor
The user's manual contains quite a number of mistakes and misprints.
6.4. Gamma Vision, version 2.3
byEG&GOrtec, Oak Ridge, USA
The software GammaVision is an MCA emulation software together with a built-in environment for
high-resolution gamma ray spectrum analysis software. It comes in a set of installation diskettes and
two user's manuals. It has also a protection key through the parallel port.
This program operates under MS Windows 3.1 or later versions and had been designed under a
powerful and "easy-to use" graphical user interface.
ft
The software can be operated from a network.
ft
The graphical capabilities and the powerful user interface provide extremely user-fhendly
and convenient way of operation, particularly for fitting and viewing the results and the
residuals of the fits.
ft
Calibrations are easy and efficiently implemented. It also includes an automatic peak
detection for calibrations. In principle, only one data point is needed.
26
The efficiency calibration has built-in several mathematical functions for two intervals.
•
above "the knee" point as interpolation, linear quadratic or polynomials of several user-defined
degrees,
•
bellow "the knee"- interpolation, linear and quadratic functions
Polynomials are at most expressed in log(E).
The baseline function is calculated differently depending of the type of the peak. For singlets one of
he following options can be chosen: automatic, average over five points, three points value or
minimum For multiplets a choice between stepped or parabolic-type baseline functions
Gaussian peak shapes are used for fitting multiplets, while peak numerical integration is used for
singlets
Figure 12. GammaVision. Fitting of the 186 keV peak.
It should be realized that the way GammaVision performs the spectrum analysis is unique and somehow different to the usual methods GammaVision will deconvolute multiplets when distinct
centroids are determined either by the peak search or by the library In the case of overlapping
peaks (multiplets), in which the peak routine cannot locate centroids in the spectral data, this
reduces to using only constituent peaks that are in the gamma ray LIBRARY as deconvolution tools
In other words, GammaVision deconvolution operates in the following way:
Any peak region which has more one library entry or actual detected spectral peaks which would
overlap is deconvoluted. If certain criteria are not met, the deconvolution may be aborted
Any peak envelope, for which no deconvolution is done, but which has a FWHM or FH25M which
is in excess of 1 2 times the calibrated value, is flagged with a warning symbol
Obviously this method, has some advantages but also a number of disadvantages, and it is evident
that such methodology requires a provision of good nuclear data libraries and relies on an accurate
peak position routine
For creation of the specific libraries the GammaVision comes with a separate software package
called- "Nuclide Navigator" a type of Visual Nuclear Data Base representing the chart of the
nuchdes and their most prominent characteristics Out of this software the user can make his own
specific application nuclear data library It also can be edited through a provided library editor
There is full compatibility between the gamma ray analysis software (nuclear data library manager
and editor) and the application "Nuclide Navigator"
Detection limits are calculated, and can be chosen from 10 different types of formulas, some with
doubtful physical meaning.
27
•0- There is no on-line help provision in the software.
Activities and concentrations are calculated if all corresponding data exist.
ft
The User's manuals are well written and organized.
However, the manual does not document the proprietary spectra format ".spc". Contrary to the old
format ".chn" (fully documented).
6.5. Gamma-W, Version 17.08
by Dr. Westmeier, Westmeier GmbH, Molln, Germany
ft
The software has a powerful conversion utility program that converts most available
commercial spectra format into ASCII format, which is the default format for Gamma-W.
According to the manual, Gamma-W is a high sensitivity, high precision code for the analysis of
gamma ray spectra from Ge(Li) and HPGe detectors. Peak areas are determined through the fitting
of mathematical shape functions to experimental counts after the subtraction of the analytical
background distribution. The figure below shows the graphical fit control on screen at 186 keV of
STRAIGHT spectrum (in optimised automatic method).
Gamma-W is a DOS application. We have found that more than 512 Kbytes RAM provides
sufficient space to operate the software properly.
458
E-
186.3*
.8 keU
ft-
17538.9: 8.9 x
FHHM-
.88 keU
Figure 13. GammaW. Fitting of the 186 keV peak.
The spectrum can be displayed, the x-axis region controlled with functions keys, the y-axis with
cursor keys. The latter can be logarithmic or linear, but the user has no control over the offset in the
case of linear y-axis.
Q
Some inconveniences in the graphical user interface were found. For example: the graph does
not scroll horizontally if the cursor pushes against the left or right edge. The zooming in and
out does not keep the cursor centered and can have a disorienting effect.
For the cursor position, channel number, energy and channel contents are displayed. The cursor is
moved with the left and right cursor keys. As identification of the spectrum under study, the
filename is shown on the screen. The user cannot set the colors used by the program.
ft
28
Fit results, energy, shape and efficiency curves can all be shown graphically, with optional
display of residuals, although the program does not use multiple windows.
Peak area determination is performed by first performing a peak search, then subtracting the
background from the regions to fit and finally fitting the peaks.
One peak fitting function is available: A Gaussian with a low-energy tail
D"
Three background functions can be used: Linear, linear with an error function under the peak
and Bremmsstrahlung.
The error function is determined in the process of subtracting the background from the region to fit
from the rest of the spectrum on the high-energy side of the spectrum. The fitting of the peak is done
by a non-linear least-squares algorithm described by Slavic [16].
•0-
No exception is made for the 511 keV peak
The spectrum can be analysed in automated mode of the user's definition, using macros and/or batch
mode. In interactive mode, the user can suggest peak positions and set the region to fit, but m the
fitting process peaks may be dropped again by the program
The fitted peaks are reported with positions, energies, fitted areas and uncertainties There are two
kinds of reports: The first is land of log file that will contain everything computed in a session, the
second a file containing only peak energies, areas and their uncertainties. The user has some control
over the log-file output format. The log-file can be directed to a printer directly, or to a file All
output files are plain ASCII.
The peak width calibration function is a second order polynomial, just like the energy calibration
function
ft
The program offers a vast selection of mathematical functions for efficiency calibration
Among the most effective is a log-log polynomial with any number of parameters up to 10, or
the Jaeckel & Westmeier curve as published in the literature [17].
"0"
The program can manipulate spectra and can run automatic analysis in a batch mode
The program can identify radionuchdes and report the activities, once the efficiency calibration is
performed. Activities are computed from each identified peak Also, concentrations can be
computed from the activities for INAA, based on thermal and epithermal flux along with irradiation
times.
6.6. GANAAS, Version 3.3
by Physics Section, IAEA. Vienna
The gamma ray and neutron activation analysis software (GANAAS) package has been developed
by IAEA, Physics Section under auspices of its Technical Cooperation (TC) programme with the
main objective to assist TC projects and nuclear analytical laboratories starting services based on
nuclear analytical techniques, as well as to provide a common based and comprehensive software for
several IAEA training courses and other training activities. The GANAAS software package is
oriented towards the analysis of high-resolution gamma ray spectra, activities and element
concentration calculations for Neutron Activation Analysis (NAA')
' Both, Thermal and Fast Neutron Activation Analysis
29
The Ganaas software is flexible and easily manageable. The program allows intensive dialogue with
the operators. This is more applicable while doing calibrations.
ft
The installation is quite simple and effective It is completely driven by a specialized
installation program. This program allows to install the main software (called "essential
module") and gives the user the opportunity to install only those modules that he will use If
necessary it creates new sub-directories and file structure The installation package also offers
a set of examples programs.
Although it works fine, the installation procedure lacks of some flexibility, e.g the name of the
target sub-directory is fixed to "Ganaas" and can not be changed.
•&
Although very simple to operate, the installation program is not documented. Only a bnef
explanation is provided in a text file included in the first installation diskette.
Ganaas is a DOS operated software It has an strong requirement on RAM available for proper
operation. We have found that more than 600 Kbytes RAM provides sufficient space to operate
properly the software.
•0-
This strong requirement on memory implies some limitations to DOS users, since many
drivers and TSR programs have to be disabled from RAM, while working with Ganaas.
Ganaas is easy operated by its graphical user interface The software has been designed m a modular
way It consists of the following modules:
•
Set-up module- Organizes the different programs, their locations and sub-directories It also setup the graphics and communication facilities.
•
Parameter Setup- This program set and stores the parameters for the spectrum analysis It
includes different calibration procedures and results in a file (*.PAR), which is called later for
the fitting procedure
•
Analysis Program- It allows the selection of the input parameter files, spectrum files and
performs the spectral analysis and displays the results
•
Activity Analysis- Calculates measured activities of the radioactive isotopes (* ACR)
•
Concentration Determination- this module is used for NAA calculations. It can be done using
fundamental parameters calculation or by the comparison method against samples corrections. It
also includes a module for Fast Neutron activation analysis calculations with a solving routine
for peak and reaction interference. Correction factors can be also taken into all above-mentioned
stages
•
Utilities Modules- include two libraries and the library manager and editor
•
P-SPED AC is a module used for reformatting the spectra from different formats to the required
input format of the Ganaas program.
Ganaas needs about 3 Mbytes hard disk space for the installation of all the programs
After installation, the path has to be set to include the sub-directory C'\GANAAS\BIN
Spectral data from a source format is converted by the program P-SPEDAC to a target format,
required as the input of the spectrum analysis program, in the following logical sequences
Select format of spectrum to be converted from - source,
Select format of spectrum to convert to - target,
Select directory of filenames of all source spectra,
Select directory of target spectra.
Once the source is selected , in the next stage the following sequences are executed
30
Read the spectrum in the source format,
Display the spectrum for visual inspection,
Save the spectrum in the target format,
STOP.
This procedure can be performed in a batch mode, for up to 12 spectra files.
"fr
Almost all commercially available formats are implemented in the file conversion module of
the Ganaas.
Energy calibration, FWHM calibration is easy to perform in Ganaas. After it is done the table of
points or the graphs with corresponding residuals can be seen.
The efficiency calibration is powerful in Ganaas. It can be done by entering the data points and then
selecting a polynomial of different degrees (user-defined). Most of polynomials are based on the
log(E)-log(E) functions.
ft
As well as the usual method for efficiency calibration in Ganaas, there is a new feature in this
package that make it unique compare to the others software. It is the provision of a possibility
to calculate the efficiency of the detector based on only one experimental point and the
characteristics of the detector itself (that the user has to enter before hand). Results of the
efficiency calculated in such a way have been proven to be very effective and convenient in
some cases were there is not sufficient data or time to measure the efficiency curve. The
calculation method is based on information published by Gunnink [19].
The main spectrum analysis routine of Ganaas is based on a PC-adapted version of the well-known
program GAMANAL [20].
In comparison with the other similar software, its most characteristic feature is the way Ganaas
treats the continuum in the gamma ray spectrum. Instead of using a polynomial function together
with the peak functions in a relatively narrow energy region, the Ganaas first determine the
continuum background for the entire spectrum, identifying at the same time the non-peak regions.
Then, when each peak is dealt with, the continuum beneath it is interpolated with a smoothed steep
function. The peak shape function is a Gaussian with a tailing function on its low-energy side.
The Ganaas offers control for the spectrum analysis through several fitting and peak search
parameters, that the user might select.
•0-
But these parameters are not well documented in the User's Manual.
ft
The report of the spectrum analysis is very complete, it gives the peak positions in terms of
channels and energy, the corresponding FWHM, calculated area and its uncertainty and the
quality of the fit.
ft
The results of the analysis can be seen in an ASCII scrolling table or visualized in the entire
or individuals peaks. The spectrum data are presented in a histogram form in white. The fitted
curves are displayed in red and the fitted backgrounds are in green colors. Each peak can be
seen together with the residuals. The residual values appear below the fitted peaks providing
impression about the goodness of the fit.
•0-
However color scheme of the program can not be user-defined or changed.
All the operational and calibration parameters, together with the spectral data and spectrum results
are stored in different files. It would be more convenient, for tracebility purposes to have them all in
one single file.
Q
The program does not provide the option of manual insertion/deletion of peaks.
Ganaas provides a nuclear data library editor, with the use of which the user can extract his own
library from the master library.
31
ft
Ganaas suports a wide range of calculation modules and options. For example, it can
calculate activities and concentrations as well, in an interactive or automated mode.
Calculation of concentrations in terms of Neutron Activation Analysis, for both thermal and
fast neutrons is provided. Peak interference is also implemented while working in this mode.
•0-
Ganaas software does not provide help on line and the user's manual was found to be not
complete and not updated.
6.7. GeniePC, version 2.2
by Canberra Industries Inc., Menden USA
GeniePC is a networking data acquisition and gamma spectroscopy system that runs under the IBM
OS/2 operating system. The package has 2 different parts
•
"Basic spectroscopy" for data collection, calibration of spectra and simple analysis which
includes automatic peak deconvolution (3 diskettes).
•
"Advanced options", this is provided in 2 additional diskettes titled "gamma analysis" and
"interactive peak fit".
This design, in 2 parts has some drawbacks, particularly all the gamma analysis modules (with the
exception of the interactive peak fit operate in a highly non-interactive way. Results are not updated
in the spectrum display windows, unless the spectrum (data set) is manually reloaded. Even
performing the energy calibration requires to run a new program which however, in this case allows
to take the ROIs selected in the spectrum. No access to library energies is available during
calibration
For the test we used a computer where OS/2 Warp version 3 was already installed. The installation
of OS/2 will therefore not be discussed, however previous experience shows that installing OS/2 can
be quite complicated, particularly if the computer is intended to operate in a network
ft
The installation of Geme-PC and its additional components is quite simple and flexible.
The computer has to be rebooted after installing the "Spectroscopy Assistant". However it is not
necessary to reboot the computer after installing the advanced options. In order to run any of the
utilities that compose this package the user must run the "Virtual Data Manager (VDM)" first. This
program stays resident and works as a virtual machine that performs I/O.
The program stores the spectral information in a proprietary binary format that takes the extension
"cnf' and is called datasource.
A utility called FILECNVT converts spectra from various formats into GeniePC data-sources, also
referred as CAM files in the manuals. This utility is implemented as a OS/2 command line program
(has to be run from the OS/2 command box) and is cumbersome to use alone as for converting each
spectra However it is convenient to use in batch files
The command to convert a spectrum is:
C > FILECNVT <INPUT FILE NAME> <OUTPUTFILENAME>
The allowed qualifiers are:
32
/S100
Canberra S100 cards
/SPECTRAN
Canberra Spectran AT
/GAMMA
Canberra Gamma At
/QUALIFIER
/TOOLKIT
Canberra Series 35 Toolkit
/SAMPO
Micro Sampo 90
/ORTEC
Ortec file type (chn or spe)
/ND6S
Nuclear Data 6 series MCAs
/NUCLEUS
Nucleus cards
/INTERTECH
Intertechmque (now Eunsys Meas) type format
/HELP
Provides a short help text
Unfortunately FILECNVT does not indicate plain ASCII which actually corresponds to the
TOOLKIT option so the conversion of the test spectra to an intermediate format was performed
Finally a program to convert the spectra from ASCII format to *.cnf format was prepared using the
OS/2 REXX batch language which provides a convenient way of transferring the data as file names
can be selected from directory lists.
In summary, Geme-PC provides facilities to read other file formats but this facility is not
conveniently implemented in the package.
D"
The energy calibration procedure was found to be quite straight forward, effective and
powerful Display capabilities and multiples windows are properly used, for the convenience
of the user. It is also possible to load an already existing calibration parameters.
The "Markers" button loads the centroid of a peak between two markers. If the data set has been
previously calibrated, it is possible to load the old data using the "Populate" button.
ft
The Automatic mode of calibration was found to be quite convenient and efficient for simple
and fast calibrations.
"0"
The user can select the degree of the polynomials.
The shape calibration is done in a similar way parallel to the energy calibration.
An additional parameter as " low Tail" is given and plotted, which illustrate the shape of the peaks
in the whole range of spectrum energy
•0-
Note that the equations and data points are reported, but uncertainties in peak positions are
shown only in graphical way. No uncertainty of the coefficients is reported. If the calibration
report is produced (using the report utility together with the appropnate template and section)
then the uncertainty in the channel position is reported but again not the uncertainty in
coefficients or in calculated energies.
The analysis of a spectrum in GeniePC consist of various methods which run in a predefined order
These methods can be selected by the user and are classified in groups like "Peak Search", "Area /
Fit" and "Report" Other groups as "Acquisition", "Calibrate", "Area Correction" (baseline
subtraction), "Nuclide Identification", etc. are also provided. All the procedures necessary for
analysis can be set into an "Analysis Sequence" which may be prepared with the Analysis Sequence
option of the "Edit" menu
The software provides full control of the analysis by setting several parameters, as shown in Figure
14 All settings of the parameters are well documented and logically accessible through screens and
menu-options
ff"
GeniePC provides a flexible type of reports for the results The contains of the reports can be
user-defined The type of the report can be chosen with the help of templates Although the
report using the standard template is quite complete
ft
GeniePC provides the possibility of an interactive peak fitting
33
The interactive peak fit is a separate procedure method that can be either associated to the "Peak
Area" group or run after the "Sum/Peak Fit" algorithm The first option is recommended in the
manual, but the second option allows to combine results from both methods The setup of this
method allows to place filters so that not all the peaks have to be interactively analysed
ft
The programs allows the manual insertion or removal of individual peaks
During the mtercompanson, when the default fit was not satisfactory, the fit was modified either by
adding peaks to the multrplets or changing the fitting region
Sum / Hem-Linear LSQ Fit Setup
rPeak
Area
Start channel:
1150
Stop channel:
18000
r$m& t»tical te»el test
^ysefbeedFWM
J
gj Use fixed tail parameter
4
4j Channels
Continuum:
ROIs Jn MCA View
[^Reject zero
Continuum itunction:
jstep
Minimum separation (FWHM): 11
-ROI Limits DeterminationMax. Hum. FWHMs between peaks:
Max. tfeim, m»is <or lell Iftnte
Max. Him, FWHMs lor nghtlimit
14
Cancel
Figure 14. Canberra GeniePC. Parameters Set-up screen for fitting procedure.
D"
The fitting parameters can be changed using the Peak function for each region A few other
parameters can be changed to change the fitting region and number of peaks with their initial
positions
When all the fits have been made for each region, then the results can be saved to the corresponding
* cnf file A list of the results can be obtained using a Report procedure
®
34
It is interesting to point out that during the manual or interactive analysis of the STRAIGHT
spectrum some peaks that appear to be incorrectly fitted independently of the values of the
parameters (without changing the analysis algorithms) were found The images bellow
illustrates these cases
Interactive Peak Fit: C:\GEHlEPC\eAMFILES\STRAIGHT,CHF
CarseK
tagf
PeaStBtti
i
1286
Setup
""""•"•'
Fit,, ? Filter...;
'»—r —— ——
2.8
...........
.^........
——— —————————— )
n
® a
\
'
.___...._,,„
i———&
sr-'*»nHhK
*3f^ ' " ' ""••"""
Ptet ti
r5 •"'•BS
«f ———— ——
i
12&2
Undo
Prev
tfext ; Markers
129S;
.,,.,.,......,
OK
-j
~^
1E85 1290
* ©aned '
In this case, a peak smaller than the reality was fitted (see residuals). Adding another peak next to
the original one did not improve the situation. When it was attempted to fit this peak again
individually by using the energy (1280 keV) as
i Qf Error!
filter the program refused producing an error as
seen in Figure 15.
Error.,,
Source: 2H
Class: ?H
Number:
(364Z6J
After this errors
OS/2 m order to
Apparently the
remained active
OS/2 unstable.
it was necessary to reboot
get normal operation again
interactive fit procedure
in the background making
Figure 15: error code produced
when trying to insert a
manual peak.
The programs of this package are well documented as well as the formulas used in the
calculations.
The documentation of the programs that constitute Genie-PC is quite good although perhaps is too
extensive, consisting of vanous thick manuals. Fortunately, due to the high quality of the user
interface and the context sensitive online help available it is not strictly necessary to read the
documentation for using the program.
35
6.8. Hypermet-PC , version 4.00
by Institute of Isotopes, Budapest Hungary
Hypermet-PC v4.0 is the PC version of the original HYPERMET code[18] developed by Philips &
Marlow in 1976 at Naval Research Laboratory, Washington DC, USA; for automatic and efficient
analysis of the complex gamma spectra
The current version has a short preliminary User's manual (29 pages), which is represents the
minimum survival guide for operating the code in automatic mode. It includes the following
chapters:
•
Introduction,
•
Starting HYPERMET,
•
Initialisation of the Hypermet-PC parameters,
•
Reading files, changing the display appearance,
•
Fitting spectra and managing fit results,
•
Additional options,
•
The Nuclide ID option.
Q
The User's Manual is really very preliminary and does not cover/explain all the possibilities
of the software. For instance, there was found a very poor (almost none) explanation of fitting
options (EXPERT MENU), which is extremely important for the orientation of the user.
Installation went smoothly, but it is "manually done". The user should copy himself the program
files from floppy disks into the hard-disk, after creating the needed directories.
No peak shape calibration is needed. Shape parameters for peaks and background are found by a
non-linear fit for each separate region in the spectrum using an initial first trial value for the peak
width. Dynamic variations of the parameters throughout the spectrum are automatically adjusted.
"fr
As minimum input (using "default" parameters) this code requires only information for two
peaks (approximate FWHM and exact energy). These two peaks should be selected as distant
as possible This information is enough to carry out energy and automatic shape calibration
There is a LOG file for the whole fitting procedure, where all fitting operations and parameters are
recorded and can be seen/analysed at any time. It is possible even to see the whole fitting sequence
for each multiplet, for instance if you are doing three different fits in one region you can see
graphically the results for each fit one after another.
D
The code has very easy and user-friendly way of adding/deleting peaks in any region of the
spectra You can add or delete peaks using channel position or energy.
The program marks the BAD FITTED regions according to x2 criteria.
•O-
Although the HELP option appears in the mam screen menu, no Help is available at all in this
version (it might be implemented in the future).
•0-
The common graphical display of Energy vs. Channel and FWHM vs Channel are not
implemented in the program.
•0-
The screen input for different parameters of fitting and logical operations is ugly and very
inconvenient.
<8> During the intercompanson a problem was found in relation to the capacity of the LOG file. It
was seen that doing fitting for whole spectra which has many peaks, LOG file becomes too
big. Once the file reaches the 64K capacity , the program hangs up.
36
®
During the intercomparison the program gave Floating Point Errors during its operation. It
was found not very stable in operation yet.
There is no automatic recognition of the 511 keV peak, you can do only manual fit using variable
FWHM (it is explicitly recommended in that way in the User's Manual).
There is an incorrect definition of the SIGMAJLIMIT parameter, which affects the criteria of
goodness of fit [x2/(4*SIGMA_LIMIT)].
A linear sum of the Gaussian and a Gaussian with exponential tail on the left side is used as peak
shape function. A step function folded with the Gaussian peak and a similarly folded "tail" function
resembling a sharp Compton edge are added to the usual first or second degree polynomial baseline
function.
Below are show some pictures illustrating some instances and performance of this program.
•*"*,
f
•ddXQn4..«a<;
*t
t
>'
• ddJIDnl. inn
I1CC3 OH HX^
•**
*
1 F^T
,' A
;< } f'A
» * ii -',>
(
v
f
*
.
HJ UHI I
rnv
1 H 1 -1 HM
X^4fe
ilM
: c
I:HXI| : i . vixxi 11
4-53CHA
L3M3T:
X . XX11XY
unyu-*< ^^yj u^
>,
0.77^757
i
•
•
'
"SI—— ""~*
.. '
ft
Figure 16. Perfect deconvolution of the multiple! in the spectrum lOnl. High peak on the
left side of a small peak with ratios 10 to 1).
In the following figure %* is equal to 1.74 but it is not understandable what is the meaning of the
4*SIGMA value.
distort. asc
distort.log
REGION #10
LEFT
: 726 CH
RIGHT: 744 CH
TRY
: JL
CHSQ: 6.11O724
4MSIGMA LIMIT:
2.885618
CHSQ/C4*SIG>
:
JL-
3£t
2»4,»
Figure 17. A bad background shape obtained during the automatic processing of the
distorted spectrum.
37
A
/ V
/ H
/ / \H
1\
./ /
l
/
ft
£.tra ight . asc
straight. log
REGION «4
lltFT
: 727 CH
RIGHT:
747
TRY
2
CHSQ:
:
CH
2.342663
4WSIGMA LIMIT:
2 . 885618
CHSa/<4*SIG>
:
0.811841
' ' ' ' "^~~
~"i^a_\k-^--—----. ' . • - . . . . .
fi
Figure 18. A very nice deconvolution of the closed doublet at 294-295 channels in
the STRAIGHT spectra.
6.9. OSQ/Professional, version 6.3 release 1
by APTEC Engineering Ltd., Canada
OSQ/Professional is a MS Windows based gamma ray spectrum analysis program developed on the
basis of a MCA emulation software. As a data acquisition device it works only with Aptec cards.
It comes in a single 3.5" diskette and six different types of Manuals. Upon request a well-written and
comprehensive Gamma ray Spectroscopy Workbook can be provided as well.
ft
The installation is simple and efficient. It gives the choice of full or custom installation. It
creates sub-directories if needed and it prompts for any replacement of a system or program
files, for the user choice.
The software is eventually not protected, but it will print/save any spectrum analysis only with the
presence of an APTEC MCA card. This might not be a nice option for a user (having purchased the
package) who wants to analyse gamma ray spectra in a computer where an APTEC MCA is not
installed.
"fr
It can import spectrum files from many commercial and non-commercial companies or type
of formats (including VAX format!!!).
®
IAEA spectrum format conversion failed. In addition, IAEA type of format is listed with
default file extension ".DAT" which is wrong.
D"
The OSQ/Professional has an outstanding user interface. It is colorful, convenient and fast.
Mouse operation is easy and most essential operations can be controlled by key-strokes.
Almost a wide spectrum information can be displayed, In addition to the spectrum ID, the preset
time, true time, live time, dead time (as TT-LT/TT in %), gross count, counts/sec, start and stop
times, start and stop dates and user's Id are displayed too.
Although the programs window can be splitted horizontally or vertically, for seeing another
region of the spectra or a zoomed peak; full implementation of multiple windows is absent.
38
Meaning, several spectra or more than two parts of same spectra can not be viewed at the
same time.
ft
Any calibration is easy and efficiently done m OSQ/Professional. Energy and FWHM
calibrations can be done in automated mode were peaks from the spectra are automatically
identified and energy values are extracted from the provided nuclear data library (an specific
one for calibration is provided, called "isotope.lib") Nevertheless, the user still has the option
to change, delete or add any additional point or to change the reported calibration parameters
Efficiency calibration is also convenient and efficient. Functions like Polynomials of Ln(E), (1/E)
and cubic spline are given for the choice of the operator. Polynomial's degrees can be chosen as
well.
The peak search and fitting procedures are controlled by the user through a wide choice of
parameters Figure 19, shows available parameters.
Possible peak centroids are located by filtering the spectrum with a third order derivative. A zerocrossing method together with criteria of statistical confidence are used to detect peaks and precisely
locate peak positions.
However, residuals values are plotted only when multiplets are fitted.
Peak Calculation Setup for CHERN SO
rI r
ROI Bkgnd Line —————
Least Square Fit Degree
<*~\
r-Centroid Calculated
Between Gross Half Max
Straight Line
<~ 2 C 3 r* 4 <~5
FlnlCnts+1] r~ln(Chan+1)
Between Net Half Max
Between Net Tenth Max
Over Whole ROI
r Use Method 2
rCentroid Weighting ———
r Confidence-
r Net'Chan
I MDA Sigma
Error Sigma
f? Net * abs(Net) * Chan
2.
- Peak Search ————
<?AII r Partial Start |0
Max Peak Error 100.
Stop
-ROI
Bkgnd End Points
<? With
End Channels
rwith
Low End Channels |0
High End Channels
JBefaults j Becall User Defaattsj §avc Ose^Defaufts|
Cancel j
Figure 19. Aptec OSQ/Professional. Control parameters of the peak search.
The program can report activities and calculate Minimum Detectable Activities (MDA), for peaks
which have not been found.
39
Preset-T
0.000
Stopped
100k
Troe Time
0.000
186.53
9043
Live Time
0.000
XDead
100.00
10.k
Gross Count
0
Counts/sec
0
keV
1.0iif7186
198.8 Start Time
100k
Stop Time
lO.k
1.0k
User ID
100"
10."
keV
1.03.148
ROIK6 Centrold = 186.38 Gross =46133 Activity = OtO.OOJicps
Ra-226
FWHM =
0.94 Net
= 17713 MDA
=0
3246.
cos
Figure 20. Aptec's OSQ/Professional. Fitting of the 186 keV peak.
OSQ/Professional provides a built-in utility for nuclear data library edition. It also provides some
specific applications data libraries.
fr
The user can define his report by selecting a number of options. Units in the reports can be
standardised.
The help on-line is concise, although some times too short.
D"
The manuals are excellent. Well written and edited with plenty of figures, examples, Tips and
hints.
ft
Aptec OSQ/Professional provide to the user many small but nice features, e.g. when the
program starts it always loads the last analysed spectrum; or when looking at any particular
region of the spectrum and you look (even load) into another spectrum, it will go to that
region automatically (even expand it, if you were at expanded mode before).
6.10.
Sampo 90, version 3.6
by Helsinki Univ. of Technology., Helsinki, Finland
The Sampo90 program is a well known gamma ray spectrum analysis program. It is a copyright of
P. Aarnio et al., Helsinki Univ. of Technology, although several dealers are distributing it. The copy
obtained for this intercomparison was operated under DOS ver. 3.3 or higher. It needs a 7 Mbytes
disk space.
The installation is simple and effective using the restore command, but the user has to modify
"config.sys" and "autoexec.bat" files by himself.
•0-
40
It has no mouse support, although it gives a full user operation through the keystrokes.
D" The Sampo90 software has a built-in a conversion utility from the Canberra SI00, Accuspec,
ORTEC ADCAM, The Nucleus' PCA spectrum formats. It has an extremely useful capability
to import user-defined ASCII files.
<8> Sampo90 does not accept all valid DOS filenames, e.g. filenames with '_' characters in them
cannot be entered.
Sampo90's user interface is reasonably friendly and fast.
•0-
Input of numbers is a little cumbersome if cursor keys are used to select command: Even
after using the program for days, the right moment to enter numbers was often missed. In
some cases the same information has to be entered several times. Also, the different parts of
the program are unaware of each other. For example if a 8192 ASCII spectrum is to be
analyzed, the number has to be entered 3 times.
Graphs of peak fits, efficiency, shape and energy calibration are available. The shape calibration is
the only one without a residual plot.
U
The energy plot has a unique and beautiful feature' It indicates increased uncertainty in
energy when extrapolating outside the range of the calibration points.
ft
For shape and energy calibration, the program can automatically find and fit suitable peaks
for the shape calibration. The user can then modify the list to exclude "odd" peaks. An
exception can be made for the 511 keV peak.
A very nice possibility of automatic shape calibration, where each peak the program proposes to use
for the calibration, is shown to the user. The user can accept or reject the peak and if the peak is too
close to others, the program offers the correct advice not to use the peak. The default significance
level for the peaks in this procedure is only 4 - that should be a higher value, like 10-20.
£2
12
10
86
4
2
5 0 0 0 « >
°0
0©025©
3000
3SOO
___1_ ^__ __ ____2 ___3_____4______ ______5 __ 6 7
1
" 5OO
^0^^^
^
Figure 21. Sampo90. Energy calibration graph. In almost all Sampo90 graphs residuals are
shown.
Spectrum analysis consists of peak search followed by a fitting procedure. The range of channels to
be fitted can be indicated, but the search is not radionuchde-library oriented.
The peak-fitting function is the standard two-tailed Gaussian on a linear or parabolic background,
without a Compton step under the peak. In the fitting procedure, the chi-square is minimized.
D
A separate peak shape can be used for the 511 keV peak, i.e a wider Gaussian
ft
Spectrum analysis can be fully automatic, fully interactive or in between.
41
ft
The significance thresholds for search and fit, as all parameters involved, are clearly defined
in the manual and can be set by the user. Peaks can be inserted (or deleted) by the user even
before fitting, should a peak be missed in the search, as well as during manual fitting.
Peak fit for singlets is linear by default: No uncertainty in peak position is determined. In the case of
multiplets (or singlets if so desired), non-linear fitting is applied: Positions are varied as well as peak
area, all other shape parameters are fixed. The user does not have the option to free the tail or width
parameters.
Peaks are fitted together if separated by 4 or 6 FWHM (manual inconsistency). The fit area is
determined automatically.
With a separate program not included in the standard package, concentrations in NAA can also be
calculated using the comparative method.
5-
3• ,.•"
O-
4
45O
455
460
465
470
475
Figure 22. Sampo90. Fitting of the 186 keV peak, with the corresponding plot of the
residuals.
ft
Interference corrections when interpreting the spectrum are performed using least squares
methods
ft
There is context-sensitive help available in the program. Error messages are clear.
Peak positions, areas and their uncertainties can be reported in the end. The report can be user
defined and can contain any parameter used in the program. It has an ASCII format and can be
printed or written to file. The graphs can be sent to a printer directly. If the user wishes to create a
report suited for it, QA-related information can be printed in the report.
ft
42
The User's Manual (according to the authors not complete) was found to be well organized
with excellent readability, containing tutorial section to start, 'procedures' section for more
advanced operations, 'commands' section as reference. Algorithms are clearly explained and
access to parameters pointed out. It just lacks an Index section to be an excellent manual.
6.11. Span, version 5.1
by Institute of Atomic Energy, Beijing, People's Republic of China
SPAN v5.1 is the multipurpose software package [21] used for gamma ray spectrum analysis and
neutron activation analysis developed at the China Institute of Atomic Energy. The package consists
of one 3.25" HD installation floppy and a 54 page user's manual.
The software was designed to run on a standard PC computer, under the DOS operating system.
•0-
Installation is difficult probably due to the disk protection scheme used by the code.
®
Moreover, automatic change of the "autoexec.bat" and "config.sys" files not always work.
We were not able to install the software in a notebook, COMPAQ 486DX-25 which used
STACKER disk compression software. Installation was repeated three times before we
finally got a working version of the code.
ft
The software can process the spectrum data produced by Nucleus, Ortec, Canberra or Silena
data acquisition systems.
®
During the intercomparison Span program fail to read 8K spectra. It got wrong numbers after
4400 channels. This looks like a memory allocation problem.
•0-
The documentation on the spectrum analysis procedures is rather limited. The parameters that
affect the peak search and doublet resolution are briefly discussed in the user's manual. The
actual peak area determination is not documented.
The baseline is removed from the spectrum before the area calculation is done. A peak shape is
calculated based on the peak shapes stored during the calibration step, after which an experimental
peak shapes table is created; or using the Gaussian function (depending of the user choice).
The fitting procedure can be controlled by several parameters. Among others the following
parameters can be adjusted for peak search:
1 .-Peak Analysis Method: There are two approaches involved in the code the Total Peak Area (TPA)
and Gaussian Function Fitting (OFF) methods. The limit of identification for closed doublet of equal
intensities is about 0.5 times the FWHM of the components. User could select either the TPA
method or GFF method for all peaks (both singlets and multiplets). These two methods can also be
selected by computer automatically using the option AUTO, that means the TPA method is used for
singlets and the GFF method for every multiplet.
2.- Error Limit: The user can limit the reported peaks by entering its error limit, that is, peaks with
an relative error in the peak area larger than this value will not be listed in the report.
3.-Sensitivity factor for peak search: The less this value is, the more sensitive will a peak search.
Only the optimum value of 5 is specified in the manual.
4.-Maximum peak number: This option sets the maximum peak number and allocates memory space
for saving the parameters of the peaks. The maximum peak number should be between 200 and 512.
You can select to subtract the background contribution, calculated from the another spectra, from the
results of the NAA calculation, for instance. This option was not used in this exercise.
The Integral Peak Technique which produces step background line was used. In this way the
baseline can be subtracted from the raw spectral data before the nonlinear fit is done.
®
Residual fit is not shown on the screen, although there is a graphic region dedicated to this
task.
43
•JJ
There is not proper handling of the 511 peak.
The code usually combines Total Peak Area method for singlets with nonlinear squares fit to
calculate net peak area and uncertainties for multiplets. The nonlinear fit can be done using either
Gaussian shape or experimental peak shape previously stored in the calibration run.
STRlIGHT.dat: Tc:2OX2Os GeoNo3 Gn»No7 Dec 11 14:3O:O4 199S
Figure 23. Span. Fitting of the 186 keV peak.
ft
SPAN sports a batch processing capability as well as automatic energy re-calibration
capability.
•0-
The output of the results are always written to the same file in the current directory named
PEAKANAL.PvEP (undocumented feature).
<8> There is no DOS ERROR trap capability build into the code. Every time when printer got out
of paper, or operating system reported an error, the program reported nonsense.
The documentation is concise but gives complete information from the user's point of view.
Detailed description of the used algorithms for area and uncertainties calculations is missing.
ft
6.12.
It has a very helpful flow diagram to show how user should proceed to use the software.
InterWinnerAVinnerGamma, version 3.42
by Eurisys Mesures, France
The Winner/Gamma software package is a MS Windows (ver 3.1 or higher) based gamma ray
spectrum analysis program developed on the basis of a MCA emulation software.
D" As a data acquisition device it can control and operates most of the commercially available
MCA cards. It also has the built-in option for emulation of an acquisition system.
The installation is quite simple and requires the presence of the protection key as well as to operate
the software. It also can be installed in three EU languages: English, French or German.
44
•JJ Although it operates most of the MCA cards, the software can not convert different spectrum
formats. To read the IAEA ASCII format a special program was provided by the supplier, but
it was not very flexible and efficient (e.g spectrum to be read must always have the same
name and be in a fixed sub-directory).
Before running the program the Setup program should be started in order to configure the hardware
m use and the software options
•0-
There is no provision for viewing the x-axis in channel numbers mode
®
The software seems to work only for 4K spectra, or it might be a problem in the conversion
algorithm During the intercompanson, spectra with 8K were normally read until the 4098th
channel, after which random data were stored into the next channels.
ft
The Winner/Gamma software sports a nice and efficient interface, making use of all
provisions of Windows operating system. Colors are user defined and it uses a multiplewindow environment
•0-
However, the cursor in the spectra is misleading. Actually there is no provision of the cursor
The often so-called cursor information (channel and channels content) is given while moving
the mouse pointer over the spectrum, but even no marker is provided for exact visualization
of the current position
The software provides an automatic mode of energy and resolution calibration In the resolution
calibration the range of an interval (mm and max) for the variation of the FWHM can be numerically
entered and them the software on automatic mode will chose the proper function to fit the
experimental points
D"
A nice feature in this program is, while you are in the E-cahbration, all the known calibration
peaks are automatically identified and displayed, by clicking at the points in the display the
user can chose to include it in the calibration and the available elements and their
corresponding energy are displayed automatically besides the mouse pointer for the user
selection.
Efficiency calibration is done using a ln(E) or (1/E) polynomials, with an user-defined degree The
plot of the efficiency also reports uncertainties.
Live tune
Real time
Channel
Energy
[keVJ
Content
Energy
FWHM
Gross
Net
Isotope
Figure 24. Eurisys Winner/Gamma. Fitting of the 186 keV peak.
45
The analysis of the spectra is based first on the peak search and then on the peak fit.
•0-
The peak search and fitting can be controlled by the operator, but is limited to the variation of
the peak sensitivity factor only.
Activities can be also calculated and reported. Standard units can be user pre-defined for reporting
activities.
•0-
Residuals of the fitting procedure are not displayed
The software allows the comparison of several spectra. It has implemented some spectrum
manipulation features like: change of the contents for an specific channel (dangerous), smooth (with
user-defined type of smooth polynom), strip, compress, multiply by a constant, add one or several
spectra, subtract spectrum
The received User's manual was very limited. No information at all on specific issues like peak area
determination and search, peak fitting, etc.
•O'
The software does not have any on-line help.
Routines analysis in batch mode are possible, even with pre-defined set of operational parameters
for each batch.
A separate optional software WinnerScan can be provided, to work in conjunction with
Winner/Gamma for automatic scanning of radioisotope activities (or peak areas) vs time.
46
CHAPTER 7: OVERVIEW
In this Chapter an overview of the possibilities and available options for each program are surnmansed.
They are organised m areas of interest for different end-users. Some comments are given below each table.
More detailed information on the particular aspects of each program is given m the previous Chapter.
47
oo
Hardware
Gamma
Track
Gamma
Plus
Gamma
Vision
GammaW
80286
80286
80386
80386
8088
80286
Yes
Yes
Yes
Not
1 Mbyte
3 Mbytes +
examples
2 33 Mbytes
5 Mbytes
Not, but
recommended
2 Mbytes
Not, but
recommended
3 Mbytes
Operating system
required
DOS version
3 1 or later
DOS version
5 0 or later
DOS 4 0 or
DOS 2 00 or
later
DOS 3 1 or
later
Minimum RAM
590Kb
610Kb
(strong
requirement)
4 Mbytes (8
Mbytes
recommended)
MS Windows
3 1 or later
4096KB
512KB
about 600 KB
ActAn
Minimum CPU
required
t oprocessor
required
Minimum disk
space
later
Ganaas
(strong
Winner/
Hypermet
PC
Professional
80386
80386
80386
80286
80286
80386
Yes
Yes
Yes
Yes
Yes
Variable,
depending on
the options to
be installed
Basic
Installation
500Kb
programs , 300
Kb examples
2 13 Mb without
samples spectra
7 Mbytes
500 Kb for
the software
500 Kb for
examples
Not, but
recommended
2 Mbytes
DOS 3 1 or
Windows 3 1 or
later
DOS 3 3 or
DOS 3 1 or
later
8 Mbytes
recommended if
operating under
Win 95
505Kb
later
600Kb
Windows 3 1
or later
8Mb
(estimation)
recommended
VGA
EGA
EGA
VGA
SVGA Graphics
accelerator
recommended
VGA, SVGA
EGA, VGA,
SVGA
Graphics
GenlePC
app 6 Mbytes
OS/2 2 1 or
later
8 Mbytes
requirement)
16 Mbytes
recommended
CGA
VGA
CGA, EGA,
VGA
Any driver
supported by
OS/2
later
300Kb
OSQ/
Sampo90
Span
Gamma
Graphics cards
Minimum required
EGA
EGA
EGA
Modes that can be
used effectively
CGA, EGA,
EGA, VGA
CGA, EGA,
VGA, SVGA
and SVGA
VGA and LCD
VGA
Color Monitor
Required
Yes
Yes
Not, but
VGA
VGA and
SVGA
Yes
recommended
EGA
EGA, VGA or
better
VGA
VGA, SVGA
VGA, SVGA
accelerator
recommended
Not, but
recommended
Yes
Yes
Not, but
recommended
Not, but
recommended
Yes
recommended
Not, but
recommended
Not, but
Used
Yes
Yes
Yes
Yes
Yes
Yes
Yes
Yes
Yes
Yes
Yes
Yes
Yes
Yes
Yes
Yes
Yes
Yes
Yes
No
Yes
Yes
Yes
Yes
Keyboard operation
only possible
Software protection
Yes
Yes
Yes
Yes
Yes
Partially
No
No
Yes
Yes
Yes
Yes
None
Parallel port
key
Parallel port
None
Parallel port key
None
Parallel Port
Parallel port key
Software will
operate normally
Parallel port
key
Special
format of
Parallel port or
PCMCIA key
Mouse support
key
Key, necessary
only for
network
operation
without any
the
protection but
prints results
distribution
diskette
ActAn
Gamma
Gamma
Gamma
Track
Plus
Vision
GammaW
Ganaas
GeniePC
Hyperroet
OSQ/
PC
Professional
Satnpo90
Span
Winner/
Gamma
only with the
Maximum
presence of an
Aptec MCA
of three
installations
___________________________________________________________________________________card________________allowed_________
Comments
Almost all the software packages do not strictly require a color monitor for their operations, but the fact that areas, fitting results, residuals and many other information
are given in different colors, implies the requirement of color device for best performance and view
In the case of the software based on Windows OS the required amount of RAM is bounded to the requirements of the operating system itself Thus, here the
recommended amount of RAM for a reasonable fast operation of the software is given
Some times the microprocessor requirements for a software are of those of its operating system E g the minimum microprocessor requirement for software packages
running under MS Windows 3 1 are those minimum hardware requirements for the MS Windows itself, in this case microprocessor 386 is the minimum option
Programs running under DOS like GammaTrack and Ganaas have a strong requirement of free RAM available, the failure to meet that requirement will end in a nonoperational software For those programs sometimes, it is compulsory to have DOS RAM free as much as possible, limiting the capabilities of running TSR programs
Graphical capabilities of the programs
ActAn
Zoom Option
Yes, ROI and
available
fitted peaks
Gamma
Track
Gamma
Plus
Gamma
Vision
GammaW
Yes As Expand
facility ROIs,
Yes ROIs,
user defined but
Yes In
expand mode
the lower part
screen shows
limited to 64
entire
Yes (a little
disorienting)
ROI, fitted
peaks and
residuals
channels on X
axis
spectrum, the
peak fits Zoom
Ganaas
upper part the
Yes As
Expand facility
ROIs, and any
part of the
spectra Zoom
can be user
defined It is
expanded
not possible to
region
display fits or
residuals in the
fitted peaks
and residuals
As Expand
too
Yes ROI,
GenlePC
fitted peaks
and residuals
Hypermet
OSQ/
Plus
Sampo90
Span
PC
Yes As
Yes User defined
Yes
Yes It can be
Yes User
defined by
defined
expand option.
controlled by
Winner/
Gamma
the user
the user
mam program
Y-scaling modes
Lin, Auto and
Lm, Log, Auto
Manual No
and Manual No
Sqrt
Log and Sqrt
User-defined colors
Yes
Yes
Lin, Log,
Auto and
Manual No
Sqrt
Lin, Log,
Lin, Log,,
Lin, Log,
Lin, Log,
Lin, Log, Sqrt,
Manual and
Auto No
Sqrt
Manual
Sqrt Manual
Auto, Manual
No Auto and
Sqrt
and Auto
scaling
Manual and
Auto No Sqrt
Yes
Yes
No
No Colors
Lin, Log, Sqrt
Auto and manual
Log and
Auto only
Lin, Log,
Auto and
Manual No
Lin, Log,
Sqrt Manual
Sqrt
and Auto
scaling
Yes
No
Yes
Yes
No
Yes
Yes
Yes
Yes
Yes
Yes
Yes
No
No
Yes But partially
No
No
Yes
Yes
Yes
can be
disable only
Menu
Menu operation
Yes
Yes
Yes
Yes
Yes
Yes, also
command
operation
Can the menu options
No
No
No
Yes
No
No
Choice between
large and short
type of menus
be user defined or
changed
Graphical
representation of
spectra
fitted peaks
Yes
Yes (not
documented
how)
Yes
Yes
Yes
Yes Pressing
"info peak"
option
Yes
Yes,
excellent
Yes
Yes, ditterent
ways Excellent
representation
Yes
Yes Fitted
and spectra
points in diff
colours
Yes
Yes, dotted
Yes, full spectra
and lines
or reduce
representation
Yes Although
requires to be
in the
Yes, dotted
Yes As well as
only Fitted
region
baseline under the
peaks
interactive peak
presented as
fitting mode
Displays fits
filled coloured
and residuals
on a separate
window
Yes, dotted or
joined lines
ROI as bars
Yes
Yes In the
ROI mode
peak fitting
can be seen
against
spectra points
Yes Fitted
peaks
Doublets in
different
colors
Continuum
under the
peaks
ActAn
Residuals
Gamma
Gamma
Ganaas
GeniePC
Plus
Gamma
Vision
GammaW
Track
Yes
No
Yes
Yes
Yes
Yes
Hypermet
PC
OSQ/
Plus
Sampo90
Partially
Yes
Span
Winner/
Gamma
Documented,
No
but does not
work
Residuals plotted
only for
mu.tiplets
hnergy calibration
Yes
Yes
Yes, but
difference in
eVVs
Yes
Yes
Yes
Yes
No
Yes
Yes
Yes
over the
spectrum
Energy
Resolution calibration
No
Yes
Yes
Yes Can be
superimposed
Yes
Yes
Yes
Yes
No
Yes
Yes
Yes
Yes Can be
superimposed
over the
spectrum
Efficiency calibration
Multiple windows
available
Yes
Yes
Yes
Yes
Yes
Yes
Yes
Yes
Yes
Yes
Yes
Yes
No Only split
for zoom
Yes
Yes, but
mainly for
showing diff
parts of sped
Info The
Yes
No
No
Yes
Yes
No Only split for
zoom
Yes
No
Yes Each
individual
window can
be configured
mdependentl
y
windows can
not be
resized
Additional
information displayed
Yes
Yes Almost
full header
Yes, Id, TT,
LT
Yes Headers
TT, LT,
counts,
Yes Spectrum
headers TT,
Yes, very
Yes Almost
Yes, TT, LT, Ids,
Yes, but
ID, II. LI
LT, counts,
complete
all information
dates, gross
very
energy, peak
information of
available in
counts Preset
limited
position
parameters and
the header of
Time, etc
header
the file
energy, peak
position
provided
Yes Almost
all
information
available in
Yes Channel,
Counts/ch
and energy
TT and LT If
the header of
the file
ROI selected.
info on ROI
is displayed
Spectrum cursor
Available
Yes,
acceleration
mode
available
Key and
mouse
controlled
Yes, slow and
Yes,
Yes, slow
Yes, good
Yes, slow
Yes, using
accelerated
movement Key
movement
using arrow
and
accelerated
movement over
and
mouse
and mouse
keys
controlled
Accelerated
movement
provided
movement
Key and
spectra Key
and mouse
controlled
accelerated
movement
Key and
controlled
Keystrokes for
mouse
controlled
fast movement
provided
mouse
controlled as
well
mouse
controlled
Yes
Yes, acceleration
mode available
Key and mouse
Yes
Yes, but can
Partially, a
be moved
kind of cursor
using mouse
only
info is
provided
while moving
the mouse
Gamma
Gamma
Pius
Gamma
Vision
GammaW
channel or
energy and
channel or
channel,
energy and
counts at
position
counts at
energy and
counts at
position
channel, energy
and counts at
position
Track
Which information it
channel or
displays
energy and
counts at
position
position
Ganaas
GenlePC
Hypennet
PC
OSQ/
channel, energy
and counts at
position
channel,
Several
channel,
energy and
counts at
Channel,
energy, counts,
markers, etc
energy and
position
counts at
position
Sampo90
Span
Winner/
Gamma
channel,
energy and
channel
content
channel,
energy and
counts at
position
channel,
Plus
energy and
counts at
position
Calibration Procedures
ActAn
Minimum and
Mm=2
Gamma
Track
Gamma
Gamma
Vision
GammaW
Plus
Mm=2
Mm=l
Max=3
Mm=l not
limited for
Mm=3 and
Maximum number of
parameters used for bcahbration
Minimum and
Maximum number of
parameters used for
Resolution -calibration
Minimum and
Maximum number of
Automatic
mode
provided
Mm=2
Mm=2
Mm=l
Max=3
Automatic
Max=20
Ganaas
Mm=2 and
Max=l 1
Depending on
the function
parameters used for
Mm=l
Mm=l not
limited for
Max
Mm=3 and
Max=20
Mm=2 anil
Max-11
Mm=l not
limited for
Max
Mm=3 and
Max-60
Mm=l
Eff-calib
Functions available
for Eff-calibration
Hypermet
PC
OSQ/
Linear calibration
User defined
Mm=l
Max=5
polynomial Ecalib also
provided but as
especial option
Mm=l Only
one parameter
is used for
shape calib ,
which is
performed
automatically
Resolution-cal
performed
automatic using
two parameters
Mm=2
Maximum
depending of
Depending of
type of function
Several
Polynomial
Log of cubic
polynomials
Divided in
two regions
function of
and inverse
Ln(E)
(1/E)
exponential
function
interpolation,
linear,
quadratic and
polynomial
Bellow
or at
linear and
quadratic
Several
Excellent
choice and
capabilities
Several
Several
Polynomials of
Ln(e)and(l/E)
of different
degrees
Parametnsation
function is
provided for
calculation of
eff using one
exp point
Polynomials of
Ln(e)and(l/E)
of different
degrees
Sampo90
Mm and
Max=3
User defined
Mm=2
Quadratic
Automatic
Depending
mode of
on the
function
function
using three
exp points
as Mm
User defined
order
Depending
on the
function
Three
experimental
peaks as Mm
to perform
FWHM-
Max and
Mm=3 A
kind of
calibration
provided
Depending
of type of
function
Mm=l
calibration
provided
Mm=l
Max=5
Automatic
mode of
calibration
Depending
of type of
function
Ln(E)
polynomials
normalised
of different
polynomials to
degrees
Polynomial
of(l/E)at
diff degrees
Cubic
Spline
the data
Winner/
Gamma
order
provided
Selectable degree
of ortho-
Spun
Pins
available data
points
interpolation,
u>
Mm=l
Max
mode
provided
Mm=2
GenlePC
User defined
order
Depending
on the
function
Interpolation,
diff Types
polynomials,
Ln(E) pol
And SQRT
pol
Automatic
mode of
calibration
provided
automatic
mode
Max-12, but
depending on
the exp data
Selectable
degree of
orthonormalised
polynomials
for three
energy
regions
Polynomial
function of
Ln(E) or of
(1/E)
Spectrum analysis
Gamma
Track
Gamma"
Plus
Gamma
Visit*
•'0ifltma\V
Yes
Yes
Yes
Yes
Yes
Yes
Yes
Yes
Yes
Yes
Yes
Yes
No
Yes
Yes
Yes
No
No
Yes
No
Yes
No
No
Yes, but you
have to buy
ActAD
Is the spectrum
analysis (peak-area
Ganaas
GenitPC
Hflgtrthet
Ǥ;.
OSQ/
SampoPO
-Winner/
jjparhraa .- .
Span .
Professional
«
*At , I'
'
determination)
performed by peak
search1'
Is the spectrum
analysis (peak-area
determination)
the nuclides
possible by specific
library option.
radionuclide
determination?
Fitting functions
Parabolic
available
interpolation
of an
experimental
Are user-defined peak
Gaussian
according to
the manual
Gaussian
with a tail.
Gaussian
Gaussian full
energy
distribution
with a fifth
Gaussian
with an
exponential at
low energy
tail. Not
Gaussian,
when TAIL is
set to none,
and Gaussian
with
peak shape
power low
tables
energy tailing
function
described in
exponential
the manual
No
No
tail on the left
side
No, But
No
No
shape functions
possible'
No. The
asymmetry of
peaks is fitted
as
No
Linear sum of
Gaussian and
Gaussian
with
Gaussian with
tail
Gaussian with
two tailing on
parabolic or
linear
exponential
tail on the left
side
Gaussian or
fitting based
on
experimental
continuous.
peak shape
table
No
information
available
No
No
No
No
No
Non-linear
Fit
Least square
fitting
In case
singlets, linear
Non-linear fit
No
information
available
Total Peak
No
information
available
alternative
fitting
functions are
provided
polynomial,
the degree of
it can be
changed
Algorithm for fitting
Uses stored
peak shapes
from the
calibration to
Non-linear fit
(poss.
Modified
Marquardt)
Least square
fitting
Least square
fitting
Least square
fitting
Non-linear fit
using
fit default
Non-linear fit
Chi-squares
Marquardt
algorithm
fit the peaks
are
Baseline functions
A
combination
of iterative
smoothing
Parameterless step
function
calculated
and a step
from scaled
Not known.
Not
documented
at all
For singlets
automatic 5
or 3-points
average
For
In each region
is calculated
accordingly10
Smoothed
Stepfunction. Not
documented
Various
options
provided
Default is a
Step-function
folded with
the Gaussian
step function
.vherc the number of baseline counts in each channel is analytically determined from the experimental number of peak counts in all higher channels
Linear or
Least square
fit of up to 5
degrees
minimised.
Linear or
parabolic.
Area Method
based on a
Step function
Not well
ActAn
Gamma
Track
Special treatment of
the 511 keVpeak
background
integral of the
peak
No
No
Gamma
Plus
Gamma
Vision
GammaW
Ganaas
multiplets
stepped or
parabolic
functions
No
No
GeniePC
Hypermet
PC
OSQ/
Sampo90
Yes
Yes
Winner/
Gamma
[ mear and no
function
provided as
well
No
Span
Professional
documented
No But, il is
possible to
fit it
No
Yes
No
No
Yes
Yes, very
good
No
Yes
manually
outside the
FWHM
calibration
Automated mode of
analysis with defaults
parameters available
Yes
Threshold for peak
Yes
Yes, with
reasonable
good
performance
for simple
spectra
Yes
Yes
Yes
Yes
Yes
Yes
Yes
Yes
Yes
Yes
Yes
Yes
Yes
User-selected
threshold peak search
Yes but not
so well
Yes and well
documented
Yes and well
documented
Yes,
effectively
Yes
Yes, well
documented
Yes But
input expert
Yes, but not
documented
No
Yes Not
documented
documented
Yes Very
well
documented
Yes Very
well
parameter and well
documented
Yes, but not
well
documented
Force (manual) peak
No
Yes
Yes
Yes
Yes Very
good
performance
at spectrum
of singlets
performance
search
explained
Yes
No
Yes
Yes
No
mode badly
documented
Yes
Yes
insertion mode
implementation
documented
recommended
value
provided
Partially, by
Yes
No
No
Yes
No
No
User-defined
inserting
manually a
ROI
Can a peak be added
No
Yes
No
Yes
No
No
Yes, but extra
software has
lobe
Peak area and
Net area
obtained from
fitting It is
Net peak
area, standard
deviation
reported in
times sigma
Net peak
area, standard
deviation
reported in
sigma (1,2 or
Net peak area
Relative
uncertainty
Net peak
standard deviation
Net peak
area, and
standard
deviation
reported in
sigma in %
( 1 , 2or 3 o in
%)
Yes
No
The are is
Net peak area
Net, Gross,
Net peak area
Net, Gross
area Relative
determine by
and relative
background
Options are
Relative
peak area
uncertainty
fitting or
integration
uncertainty in
% Method of
uncertainty is
peak area
reported
Uncertainty is
relative and m
%
Net, Gross,
background.
uncertainty
How
reported
Uncertainty is
relative and in
%
or removed manually
in a multiple!
9
requested
determination
not
documented
how the other
values are
obtained
3 a in %)
Level of
reported
uncertainty
can be
chosen
not reported
relative or
absolute
uncertainties,
etc
uncertainty is
calculated is
not
documented
Peak identification
ActAn
Does the program
Yes
identification results
Gamma
Vision
Ganaas
GenlePC
Hypennet
PC
OSQ/
Professional
Sampo90
Span
Winner/
Gamma
Yes,
Yes
Yes
Yes
Yes
Yes
Yes
Yes
Yes
Yes
Yes
Printed
Printed or
Printed and
Printed or
and/or saved
saved into a
saved into a
saved into
Printed and saved
into a file ASCII,
Printed or
saved mto
Printed
ONLY No
Printed, or
saved into
into a file
ASCII format
possible
file ASCII,
easy to
file ASCII,
easy to import
ASCII file
Printed or
saved into a
file Both
proprietary
easy to import
ASCII file
save no
ASCII
a file
ASCII
import
format
format
format
supported
Gamma
including
detection of
possible
performs radionuclide
identification 9
Reports of the
Gamma
Pins
GammaW
Track
Printed and
saved into a file
ASCII, not to
easy lo import,
since it contains
interference
Printed only
or saved into
a file
(proprietary
format only)
format (CAM
files) of ASCII
special
characters
format files are
provided Easy
to export
Nuclear Data Libraries
ActAn -
Gamma
iTrack
Gamma
Gamma
Plus
Vision
Yes
Yes
Yes
GammaW
Ganaas
GenlePC
Hypennet
PC
OSQ/
IPfofesiional
Sampo90
Span
Winner/
Gamma
Yes
Yes
Yes
Yes, but very
limited
Yes
Yes
Yes
Yes, but as
Yes But no
inside utility to
perform it is
Yes
Yes
Yes
Yes An useful
library editor
is provided
Yes, several
No
No
Yes, several
Is there any isotope
nuclear data library
available
Can the nuclear data
library modified
(edited) or created by
Yes
way of
Yes Library
editor is
integrated
the user '
entering peak
into the main
provided
information is
provided
program
Yes NAA
No
hditions lo the
library should
be done with an
external ASCII
editor
No
Provision of specific
apphcation-onented
isotope library
Yes An
automated
Yes
Yes, see
notes
Yes
Yes
Yes It has a
very powerful
library editor
No
Yes
Yes
Yes, NAA
Yes, upon
request
optional item
Reports
ActAn
Default report
Can Ihe user define
the analysis report '
Possibilities on the
output of the results
Yes
No
Print or
ASCII
Gamma
Track
Gamma
Plus
Gamma
Vision
GammaW
Yes, many
options
Yes
Yes
Yes
Yes
No
Pnnl or saved
into a file
ASCII formal
is provided as
well
Pnnt or
saving into a
file ASCII
format
possible
Yes
No
Pnnt or
Pnnt or ASCII
ASCII file An
option for MS
Word file
file (easy to
import)
type is also
available
Ganaas
Yes
No
GeniePC
Yes
Yes
Hypermet
PC
Yes
No A Full or an
Abbreviated
type of reports
are offered
Sampo90
Span
Winner/
Gamma
Yes, very
complete
Yes
Yes
Yes
No
Yes, with many
different
Professional
Yes, very
complete
Yes, with many
different
options
(modules) But
options are
predefined and
can not be
changed
options Even
the units to be
reported can be
standardise
Pnnt and/or
Pnnt or
Pnnted
save ASCII and
saved into a
Only No
short report is
ASCII separated
by commas,
file ASCII
format also
very suitable for
importing into
ideally for
importing them
provided
save
mode, no
ASCII
ASCII, Pnnt to
a file or to the
screen only A
creation of a
database is
format
possible as well
any spreadsheet
into spreadsheet
Pnnt and
ASCII files
Several
ASCII files
Pnnted or
saved into a
file Both
propnetary
ASCII or
Sampo90
format The
are kept as
track-keepers
format (CAM
files) of
ASCII
format Easy
to export
OSQ/
00
Others
ActAn
Gamma
Plus
Gamma
Vision
GamraaW
No Program
might be
requested
from the
supplier
Yes, several
Yes, major
commercial
formats
Yes, major
commercial
formats
Yes Smooth
Yes
and strip
Smoothing,
addition
Gamma
Track
Spectrum utilities
spectrum format
conversion
Only from
ASCII
Ganaas
Yes Vast
GenlePC
choice,
Yes, major
commercial
including
formats
Hypermct
OSQ/
PC
Professional
Yes but
Yes, major
limited
Sampo90
Span
commercial
Yes, major
commercia
formats
1 formats
Yes, major
commercial
formats
No
No
major
commercial
Winner/
Gamma
No But it
can operate
major
commercial
MCA cards
formats
Can the program
No
perform spectrum
manipulation9
Yes Sum,
strip and
Yes
smooth
subtraction
and
Partially
Yes
Smooth using
file format
conversion
option
Smoothing and
stripping
No
Yes
Smoothing,
add,
subtract,
multiply by
const Add
multiplication
const
Calculations
Activities calculations
Yes
Can the program
calculate
concentrations
9
Report of detection
No
limits
Yes
Yes
No
Yes
Yes, but a
Yes
No
No
Yes
Yes
Yes
Yes
Yes
Yes
Yes
Yes Two
Yes, but the
report has to be
programmed
Yes The
Yes
Yes
Yes
No
isotope
Not reported,
but
Not reported
Not
documented
documented
template has
to be
modules for
Thermal and
programmed
Fast NAA are
included
library is very
limited
several
Partially,
using the report
language
MDA are
Yes, as
Yes
formulas
concentrations
calculated by
Minimum
according to
provided
are reported as
Detectable
Cum's
formula
including
Cum's one
3*sqr(sd(area))
when it is <
LDL
the library
driven peak
according
to Cum's
Activity
formulae
Yes LLDare
calculated
Not known
search and area
or user
algorithms
defined
using peak
erosion
method
Quality Assurance
and Quality Control
How the program
complies with Quality
Assurance
Operational
parameters are
save into the
file Results are
compared with
a cumulative
are stored
into the file
Results of
analysis are
distribution (T-
statistically
factor)
controlled
Operational
parameters
Yes, to some
extent
Operational
parameters
are stored, not
all
ANSIN1330
andN42 14
N/A
Parameters files
are kept for
reproducibility
of results, but
program do not
use them for
QC
Has a complete
and full QA
and QC system
built-in for
reporting the
results
All parameters
Yes,
Operational
parameters
parameters are
are stored
stored into
into files
extensive
headers
Headers can be
saved included
into reports
Full track
of
operational
parameters
QAand
QC is built
No info
1'ull track of
provided on
operational
peak search,
identificatio
n 1 ittle
track of used
parameters
Almost no
A database
can be
created
QA and QC
parameters
ActAn
Gamma
Track
Gamma
Plus
Gamma
Vision
GammaW
Ganaas
GenlePC
Hypermet
PC
a file and a
database is
created
Menu and
dialogue boxes
Values are
stored in files
Menu and
dialogue
boxes Most
of the
and can be recalled
operational
parameters
are stored
into the file
Some
operational
parameters
Menu and
dialogue
through
menus and
boxes Values
files
are store in
final file or
are stored in
report Menus
and dialogues
can change or
display the
different
options
files and recalled by
software
when
requested
several
parameters files
are kept for
reproducibility
A full set of all
operational
parameters are
stored into a
Menus and
dialogue
boxes
Spectrum
headers are
of results
files and a
parameters
are stored
into results
files
provided and
can be called at
any time They
can be included
in reports
comprehensive
database
corresponding
to the
experimental
set-up is
created
Sampo90
Span
Professional
They can be
viewed or
changed any
time
are stored into
How can all input data
and calculations be
traced
OSQ/
menu and
dialogue boxes
Extensive
Winner/
Gamma
into the
info on
program
calibration
is built into
the program
used
All
parameters
are kept
and can be
reported
on the
user's wish
See above
Menu and
dialogue
boxes
Parameters
values are
stored in file
and results
report (if
chosen
option) A
database can
be created
Help and Documentation
ActAn
Gamma
Track
Gamma
Plus
Gamma
Vision
GatnmaW
Ganaas
GenlePC
On-line help
Yes
Yes
Yes
No
Yes
No
Yes
Availability of
Yes but not
complete
Yes
Yes, partially
No
No
No
Yes
There is some
documentatio
Yes, some
parts are
Yes Manual
Yes
Yes, well
updated
n but not a
User's
inconsistent
Yes User's
Manual Not
updated
Yes Very
extensive and
well presented
context sensitivity
help
Is there an updated
and efficient User's
ManuaP
is complete
and update
Hypermet
OSQ/
PC
Professional
No
Yes
Yes
Yes
Yes, updated
Yes
but not very
well written
Manual
Sampo90
Span
Winner/
Gamma
No
Yes
Yes, but
very limited
No
and well
Yes, well
written and
Yes
Sometimes
Yes Poorly
implemented
presented and
efficient
written
No
not very
clear
Some guides
are
misleading or
Is there any other type
of documentation
provided9
No
Examples
confuse
No
files
Yes, the one
describing
Nuclide
No
Examples
No
files
Navigator
Telephone help-line
or Internet
address(mcludmg a
WWW location) for
help
E-mail
Not known
Not known
Yes
Telephone
help-line,
WWW site
Yes Telephone
help-line and Email
Yes E-mail
and FTP
address for
exchange of
info
Yes Telephone
help-line,
Internet E-mail
and WWW site
Yes The
isotope
Yes, samples
files Different
library is very
limited
application
specific data
libraries
Not known
A workbook on
gamma
spectrometry
can be provided
upon request
Yes Telephone
help line, Email and WWW
site
No
Yes, but
depending of
the dealer
Yes, some
example
files
example files
No
Not known
Yes, some
Comments
The Ganaas software provides an E-mail and FTP address for the exchange of information and user's help, but it is not documented in the User's Manual It is only
mentioned in a README text file included in the first installation diskette.
CHAPTER 8: RESULTS AND DISCUSSIONS
In this Chapter the results of the intercomparison are presented and briefly discussed. Only the most
relevant graphics has been shown here. The full report on the results is summarized through tables 1
to 12 in Appendix I to this report.
In these tables, "XI" and "X2" refer to the x' -values computed using the uncertainty reported by the
program and the reference uncertainty, respectively. Doublets of the annihilation peak are
unphysical and the corresponding results are therefore omitted from the tables.
Empty columns in these tables correspond to incomplete test or lack of reliable data. This might be
the case of incomplete analysis runs, not performed by mistake during the intercomparison. These
data are therefore missing from the tables.
8.1. Peak detection ability
The ability of the programs to detect singlet peaks, which is the first aspect to be tested according to
the ANSI standard, can be judged from the number of detected small peaks on high background
Peak detection
(STRAIGHT spectrum)
Peak discrimination
(STRAIGHT spectrum)
Inter Winner
Inter Winner
Span
Span
GammaRus
GanmaHus
I user settings
SampoQO
SampoQO
user settings
default settings i
GammaTrac
Hypermet
GeniePC
GeniePC
Ganaas
Ganaas
GammaW
GammaW
GammaVision
GammaVision
OSQ
OSQ
ActAn
ActAn
20
#peaks
Figure 25. Numbers of detected small
peaks on high background.
30
I default settings,
GammaTrac
Hypermet
10
>--
-40
-30
-20
-10
0
10
20
#peaks
Figure 26. Difference between number of
detected small peaks on high
background and number of false
hits.
61
listed in the tables. These numbers are shown in Figure 25. The number of misses and the related x~value are also related to this ability, but less discriminating. Most programs allow the user to set a
peak search sensitivity parameter directly influencing the detection ability and the data in this figure
therefore mostly reflect the setting of this parameter.
In an mtercomparison, a more interesting aspect of program performance is the ability to detect
small peaks and not to detect spurious peaks, i.e. to have a small number of false hits. In Figure 26,
the difference between the numbers of detected small peaks on high background and the numbers of
false hits are shown. As we have stated in the "Introduction", a detection of a spurious peak is not
necessarily a disadvantage of the program as long as its peak area is reported with a high uncertainty
as indicated by the Rvalue for the false hits. At the same time it should be pointed out that spurious
peaks can result from unavoidable imperfection of the peak search algorithm as well as from
incorrect multiple! deconvolutions. Taking this into consideration, it is clear form the figures that a
program like Gamma-W is performing better in this respect than e.g. InterWinner (WinnerGamma).
8.2. Peak shape model dependency of absolute peak area determination
As described in Chapter 4 during the intercomparison a re-normalization factor has been calculated
for each program in order to compensate any possible bias in the peak-area determination due to the
different models employed in each program. In Figure 27, the re-normalization factors and their
uncertainties for the peak areas determined by the analysis programs are shown.
^ uuo
———————————————————————————————————————————————————————————————•
•
1 004 -
0
1 002 -
T
r
1
•
1 000 ^
1
ctt
M
CO
i_i
4>
A
0998 T
•
"c3
n.
*
y
0996 -
T
_
*
;
~
0994 -
<L>
5
^^
-
«»
0992 -
(I
I
0 990 -
-
•
{
0988
g
WJ
<a
OO
5
|
.
n
a
O
2
3
°
S
Figure 27. Renormalization factors and uncertainties for the analysis programs.
It has been said that peak areas in y ray spectra can get defined differently when applying different
peak shape models. This would mean that one analysis program could yield other areas than the
next, as long it was self-consistent. The results from any determination would come out the same as
long as the program was used both for calibration and measurement - a bias would cancel out. This
is true as long as coincidence summing does not play a part.
62
A consistent bias in peak area determination would affect the apparent peak efficiency of a detector.
But, where the peak area of a sum peak is given by the product of the photopeak efficiencies for the
contributing photons, it would not be given by the product of the apparent photopeak efficiencies the area determination bias factor would come in only once, not as many times as there are
contributing photons.
As shown in Figure 27, the programs tested yield unbiased peak areas, within the statistics of the test
(the only outliner at a = 0.01 being GammaVision) as well as within a reasonable range of 1 %. No
problems need therefore be expected when corrections for coincidence summing are to be computed
from efficiency curves determined using one of these programs.
To ensure that Gamma Vision was not handicapped by its possible bias, in the
remainder of the intercomparison, some of the statistical comparison runs were
performed after peak area renormalization. It was found that the results only changed
marginally.
8.3. Interpretation of the x2- values
The %'-values computed in this intercomparison can be interpreted as reduced chi-squared values: A
value of unity indicates statistical control, a value less than unity overestimation of uncertainties and
a value larger than unity underestimation of uncertainties.
The z-scores underlying the %' -values, however, are not normally distributed: in those cases where
incorrect deconvolution occurs, very high values can result. Therefore, a high %-' - value can
represent a group of nearly perfectly distributed z-scores, i.e. a mean value of 0 and a mean of
squares of 1, containing such a single high z-score.
At the same time, as described in the Chapter 4, we are using two kinds of yj-values:
• the first, based on z-scores accounting for both the reference and the reported uncertainties (Z^
defined in formulae (3) in Chapter 4),
.
the second on z-scores computed from reference uncertainties only (2^ as defined in formulae
(2), Chapter 4).
This two qualifiers can point out different meanings:
1. the first (y_2rep) indicates the level of statistical control of the program as described above
,
the second (x2ref) indicates how well the peak areas themselves were determined regardless of the
reported uncertainties.
63
8.4. Singlet peak area and uncertainty determination
Since only the "straight" and the "distort" spectra contain singlet peaks, the analysis results obtained
from these spectra are relevant for the quality of singlet area determination of the programs.
The ANSI standard describes the testing of the independence of peak area determination from the
baseline level. This aspect is not explicitly tested here. However, if a program performs well in the
test described here, it follows that it satisfies the ANSI criterion. If it performs badly, one of the
possible causes could be such a dependence.
Area Estimation
(STRAIGHT spectrum)
Statistical Control
(STRAIGHT spectrum)
user settings
:
B
default settings j
user settings
default settings
1
10
reduced sum of squares
Figure 28. y_2 -values based on the
uncertainties reported by the
programs in their two modes for
the "straight" spectrum.
100
10
100
reduced sum of squares
Figure 29. y£ - values based on reference
uncertainties for each program
in its two modes.
In Figure 29, the ^-values based on the reference uncertainties are plotted for the programs in their
different modes. It can be seen from the graph that the performance of most programs remained
more or less the same when the change from default to user settings was made. In most cases, the
user settings lead to slightly better results. This implies that the default settings of the analysis
programs are suitable for the analysis of singlet peaks.
The fact that user settings do not always lead to better result might indicate that the
information offered by the corresponding programs to judge the quality of the results
can be improved.
64
In Figure 28, the x~ -values based on the uncertainties reported by the programs have been plotted.
Although it can be seen that most x~ -values differ from unity significantly (implying that more
strengthening and development is needed in this aspect in the future); however, it also can be
concluded that all programs, except one, demonstrate to be in reasonable statistical control,
influenced to some degree by the user settings.
From the statistical control and the quality of the area determinations, an uncertainty overestimation
factor/can be computed using
(5)
The resulting values are shown in Figure 30. Most programs turn out to overestimate the
uncertainties they report, relative to the optimum uncertainties from the reference list. Relative to
the actual discrepancies between reported areas and reference areas, however, the reported
uncertainties are reasonable as Figure 28 illustrates.
Uncertainty Estimation
(STRAIGHT spectrum)
InterWinner
Span '
GannmaRus i
user settings
default settings
GeniePC t
Ganaas
GarrmaW f
GammaViston
1
2
overestimation factor
3
Figure 30. Uncertainty overestimation
factors (/).
Even though most programs do not report peak position uncertainties but merely imply them to be
0.01 keV with two digits after the dot, the statistical control in this respect is quite good, as can be
seen m the tables.
The 511 keV peak area is determined correctly only by Ganaas, GeniePC and InterWinner, even
though a 511 keV peak was present in the calibration spectrum.
65
The "distort" spectrum was analysed well by GammaPlus, Gamma Vision and Gamma-W. None of
the other programs, apparently more sensitive to the change in peak shape, reported to the user that
such a change had occurred. In principle, this feature could be built in, since high-energy tailing
distorts all peaks in the same way.
8.5. Doublet peak area and uncertainty determination
The programs cannot be expected to determine the peak areas in a spectrum containing only
doublets as well as in the "straight" spectrum. Nevertheless, they should be in statistical control
under all circumstances.
The quality of the area and its uncertainty estimation for the case of the "addlnl" spectrum is shown
m Figure 31 and Figure 32, in the same way as for the "straight" spectrum in Figure 29 and Figure
28.
Area Estimation
(ADD1N1 spectrum)
Statistical Control
(ADD1N1 spectrum)
InterWinner
Span
user settings
Gamma Hus
default settings
SampoQO
GammaTrac
I user settings
Hypermet
I default settings
GeniePC
Ganaas
GammaW
GarrmaVision
OSQ
ActAn
10
100
reduced sum of squares
Figure 31. A2-values based on the
uncertainties reported by the
programs in their two modes
for the "addlnl" spectrum.
1000
10
100
1000
10000
reduced sum of squares
Figure 32. •/£ -values based on the
reference uncertainties for the
programs in their two modes for
the "addlnl" spectrum.
As shown in Figure 31, none of the programs prove to be in statistical control. All programs
underestimate the uncertainties in the peak areas they report. However, some programs are less overconfident than others. Most programs perform better, both with respect to peak area and to
uncertainty, with the user settings. In some cases, the user settings result in a change in x"-values of
more than one order of magnitude. With the default settings, the corresponding programs only
66
integrate peaks (e.g. GeniePC, OSQ/Professional) or do not perform a residual search (e.g. Sampo
90, GammaVision).
The reason that the Gamma Vision results do not improve with user settings is that this program will
deconvolute multiplets if (first) the constituent peaks are in its gamma ray library (see Chapter 6) or
(second) detected by the peak search algorithm. It was decided that supplying this library to the
program would give it an unfair advantage over the other programs. Such library based multiplet
deconvolution potentially could yield very stable results, as shown in the past for X ray spectrum
analysis by v.Espen[22].
The remaining programs that yield more or less equally good results with default and user settings
ANALYSIS PROGRAM OUTPUT
REFERENCE DATA
unc
352.3
352.8
353.5
E
A
E
val
val
0.1
0.0
0.1
unc
val
98593
492
0
0
98593
492
352. 3
352. 8
353. 5
1
A
val
unc
unc
0 2200
199000
563
0 2200
0.1
0.01
0.1
z-scores
rep
ref
-43 .7
353.3
-43 .7
Figure 33. Section of z-score table, showing a doublet mistaken for a singlet, reported with
such a position uncertainty that the reported singlet matches neither of the
doublet components.
always fit and deconvolute peaks, but the user may extert some control over the process by setting
parameters such as a residual peak search threshold.
h 125
100 I- 100
S
75
Number of hits
Number of false hits
X22 of false hits
X of hits, reference uncertainties
10 -
50
- 25
0.2
0.4
06
08
1.0
1 2
Match criterion (FWHM)
Figure 34. x2 based on reference uncertainties and the total number of matches as a
function of the peak position match criterion in terms of FWHM. Lines
were drawn to guide the eye.
67
To investigate the problems with the "addlnl" spectrum, the output of the statistical comparison
program was studied and it was found that, in those cases where a doublet has been mistaken for a
singlet, most of the programs report a singlet that does not match either of the doublet components
to within 0 5 x FWHM or the reported position uncertainty, as illustrated in Figure 33 This is most
likely to happen on the low-energy side of the spectrum, where the doublet separation is
1 2 x FWHM Additional runs of the comparison program were performed where the criterion for a
False Hits
(ADD1N1 spectrum)
Resolving Power
(STRAIGHT and ADD1N1 spectrum)
InterWinner
Span
Gamma Plus
Sanpo90
GammaTrac
Hypermet
user settings
GeniePC
default settings
Ganaas
GammaW
GammaVision
I user settings
I default settings
OSQ
ActAn
0 75
1
1 25
15
1 75
2
# hits addlnl /# hits straight
Figure 35. Resolving power of the analysis
programs.
2 25
01
1
10
100
1000
reduced sum of squares
Figure 36. X2-vaIues related to false hits,
indicating deconvolution
correctness.
match in peak position was extended from 0 2 x FWHM to 1 2 x FWHM, covering the range of the
doublet separations in the spectrum
From Figure 34, where some results for one of the analysis programs are shown, it is clear how
crucial this criterion is, even though it's an extreme case At high values, the peak position
uncertainties reported by the analysis program are no longer relevant, unrecognized doublets match
both components in the reference list and, as described in Chapter 4, these components are merged
so that total doublet areas are compared.
To establish how well the analysis programs could distinguish doublets from singlets, their resolving
power was defined as the number of high peak hits in the addlnl spectrum divided by the same in
the straight spectrum. For this ratio, 2 would be a perfect score The x2-value for false hits in the
"addlnl" spectrum indicates that doublets are being mistaken for multiplets To eliminate the effect
of too small reported position uncertainties, the data were determined using a 1 0 x FWHM
matching criterion The results are shown in Figure 35 and Figure 36
An analysis program that performs residual searches in the fitting process may miss multiplet
components or detect spurious multiplet components The lower the residual search threshold, the
less components will be missed but the more spurious components will be found From the graphs, it
is seen that the threshold was set to low for Sampo 90 and InterWinner by the user - the
68
deconvolution power is very large, but so is the X2-value for false hits. The trade-off between the
two aspects turns out not to be the same for all analysis programs. For example, the trade-off has
turned out less favorable for Gamma-W than for InterWinner.
As shown by Koskelo[10] and implemented earlier at IRI[23,24], an alternative for multiplet
deconvolution is the determination of total area, followed by the determination of the constituent
peak areas in the interpretation stage. This method can only work well if the total areas of the
doublets in this test can be determined correctly by the analysis programs. Also, the programs should
report a peak position uncertainty (maybe "multiplet range" would be a better term) in these cases
that can be used as a search window in the y ray catalogue. Since they don't, search windows of 1
keV or 1 x FWHM are common practice, unnecessarily complicating the interpretation process.
To establish the quality of the total area determination, the results from the 1 x FWHM match
criterion statistical comparison runs were used for Figure 37 and Figure 38, otherwise identical to
Figure 31 and Figure 32.
These figures indicate that the total areas of the doublets mistaken for singlets, as well as constituent
Total Area Estimation
Statistical Control Total Areas
(ADD1N1 spectrum)
(ADD1N1 spectrum)
InterWinner
InterWinner
Span
Span
Gamma Plus
Gamma Plus
Sampo90
SarrpoQO
GammaTrac
GammaTrac
Hypermet
Hyper met
......................... B user settings
user settings
GeniePC
B default settings
GeniePC
Ganaas
Ganaas
GammaW
GammaW
GammaVision
GammaVision
OSQ
OSQ
ActAn
ActAn
1
10
100
reduced sum of squares
1000
0.1
default settings
1
10
100
1000
reduced sum of squares
Figure 37. X2 -values based on the reference
Figure 38. A* -values based on the uncertainties
uncertainties for the programs in their two
reported by the programs in their two
modes for the "addlnl" spectrum,
modes for the "addlnl" spectrum,
determined with a 1 x FWHM match
determined with a 1 x FWHM match
criterion.
criterion.
areas of correctly recognized doublets, are determined well by Ganaas, Hypermet-PC,
GammaVision, GeniePC and Span. These programs also demonstrate to be in reasonable statistical
control in this respect.
69
CHAPTER 9: CONCLUSIONS
First of all, after this intercomparison exercise we can conclude that most of the gamma ray
spectrum analysis programs are designed using advanced and powerful graphical and user interfaces.
Many provide keyboard shortcuts, mouse operation and graphical capabilities, which leads to a more
efficient operation and control of the spectrum analysis. Outstanding user interfaces were found in
GeniePC, GammaVision and OSQ/Professional.
Most of the programs incorporate utility modules (e.g. spectrum format conversion) which extends
their usefulness and applicability.
Some of the programs have built-in scripts, macros, application-oriented libraries and other features
that were found very useful for predefined tasks, routine analyses, etc. Example of this is the batch
analysis script provided by Sampo 90 and GeniePC among others.
Almost all the programs provide "easy-to-use" and powerful methods for energy, peak shape and
efficiency calibration.
It was found that most of the programs integrate into their basic spectrum analysis routines a number
of calculation programs or modules, which leads to more precise and correct calculations for
element's concentration. Examples are: nuclear data libraries and library editors, efficiency
calculations and extrapolations, geometry corrections, peak interference solvers, etc.
All the programs made good use of present capabilities of modern PC's. Spectrum deconvolution
and calculations are done rapidly, and the user can inspect the results over the spectra using
powerful graphical capabilities.
During the intercomparison it was found that all the tested programs reported almost the same peak
areas (within 1%) independently of their used peak shape. The expected peak shape model
dependency was not found in practice.
In the applied tests, singlet peak areas are determined quite well by all programs except
GammaTrack and all programs are in reasonable statistical control with respect to the peak areas,
positions and their uncertainties. Very good results were obtained with Span, GammaPlus,
Hypermet-PC, Ganaas, OSQ/Professional, Sampo90 and Gamma-W (in no particular order).
Doublets at separations below 1.2 x FWHM often are mistaken for a singlet by all programs and
reported with much too small peak position uncertainties, even if the settings of the program allow it
to perform residual searches and add multiplet components in the fitting procedure. With respect to
resolving power as defined in this test and quality of area determination, ActAn, Gamma-W and
Sampo90 yielded the least bad results. Only after the consequences of peak position uncertainty
underestimation were removed by a change in the test procedure, Ganaas, Hypermet-PC,
Gamma Vision, GeniePC and Span proved to determine the constituent peak areas (or the total peak
areas in case of an unrecognized doublet) quite well and also proved to be in statistical control.
The results obtained with user defined settings are usually better than the results obtained with the
default settings. In those instances where this is not the case, the analysis program apparently can be
improved with respect to the information offered to the user to judge the quality of the results, e.g.
plots of residual patterns.
The report of the analysis results has been improved by almost all the programs. Many of them had
implemented the multiple choices or "user-defined" type of reports. Excellent implementations were
found in GeniePC, Sampo90, OSQ/Professional and GammaVision.
Even though some of the programs obviously need more improvement than others, no program
emerges as the best from this intercomparison. The user may select the program that is the most
suitable for the specific y ray spectra to be analyzed, or the most flexible if different kinds of spectra
are to be analyzed.
70
REFERENCES
[I]
[2]
[3]
[4]
[5]
[6]
[7]
[8]
[9]
[10]
[II]
[12]
[13]
[14]
[15]
[16]
[17]
[18]
[19]
[20]
[21]
[22]
[23]
[24]
H. Houtermans, K. Schaerf, F. Rechel, K. Debertin, "Intercomparison of High
Precision Gamma-ray Spectrometry", Internal Report G-2, IAEA, Vienna (1980).
R.M. Parr et. al., "The IAEA intercomparison of methods for processing ge(li)
gamma-ray spectra". Presented at Conference of American Nuclear Society on
Computers in Activation Analysis and Gamma-ray Spectroscopy. Mayaguez,
Puerto Rico, May 1978.
ARCAL n Report on a workshop on gamma-ray analysis software. ARCALII
Internal Report. May 1991. Costa Rica.
C.G. Sanderson, "An Evaluation of Commercial IBM PC Software for the Analysis
of Low Level Environmental Gamma-Ray Spectra, International Committee for
Radionuclide Metrology, Wurenlingen, Switzerland (1987).
L.H. Christensen, K. Heydora, J.Radioanal.Chem. 113 (1987) 19.
K. Heydom, L.H. Christensen, J.Radioanal.Chem. 124 (1988) 467.
Calibration and Use of Germanium Detectors for the Measurement of GammaRay Emission Rates of Radionuclides, N42.14-1991, American National Standards
Institute, New York.
MJ. Koskelo, M.T. Mercier, Nucl.Instr. and Meth. A299 (1990) 318.
M.T. Mercier, M.J. Koskelo, J.Radioanal.Nucl.Chem. 160 (1992) 233.
M.J. Koskelo, M.T. Mercier, J.Radioanal.Nucl.Chem. 193 (1995) 211.
Final Report of the AGM on software for nuclear spectroscopy, December 1994.
Rep. IAEA-PS-AGM95, IAEA, Vienna (Internal Report).
M. Blaauw, V. Osorio Fernandez, W. Westmeier, Submitted to Nucl.Instr.meth
W. Westmeier, "Benutzerhandbuch des Gamma-Spektrenanalyseprogramms
GAMMA-W". Gesellschaft fur Kernspektrometrie mbH, Ebsdorfergrund-Molln,
Germany (1990).
P.A. Aamio et al., Nucl. Instrum. Methods 219 (1984) 173.
U. Reus, W. Westmeier, Atomic Data and Nuclear Data Tables 29 (1983).
I.A. Slavic. Nucl. Instrum. Methods 134 (1976) 285.
B. Jaeckel, W. Westmeier, P. Patzelt. Nucl. Instrum. Methods A261 (1987) 543.
G.W. Phillips, K. W. Marlow, Nucl. Instr. Meth. 137 (1976) 525. See also: NRL
Memorandum Report 3198, Naval Research Laboratory, Washington, DC
(January 1976).
R. Gunnink, Nucl. Instrum. Methods A299 (1990) 372-376.
R. Gunnink, J. Niday, Computerised Quantitative Analysis of Gamma-Ray
Spectrometry, Univ. of California, Rep. UCRL-51061, Voll-3 (1972).
Wang Liyu, Nucl. Elect. Detect. Techn. (China) Vol 6 (1986b) 356-361.
P. v. Espen, H. Nullens, F. Adams, Nucl.Instr. and Meth. 142 (1977) 243-250.
M. Blaauw, Nucl. Instr. Meth. A333 (1993) 548.
M. Blaauw, Nucl. Instr. Meth. A353 (1994) 269.
71
APPENDIX I: TABLES OF RESULTS
73
Table 3: Act An
high peak
small on high
small on low
all matches
position
annihilation
misses
false hits
total
N
XI
X2
N
XI
X2
N
XI
X2
N
XI
X2
X
N
X
N
X
N
X
N
X
stra
47
93.2
10.4
16
2.8
4.7
10
2.3
4.5
73
60.9
8.4
3.6
1
25.2
97
8.1
15
717.5
185
86.4
dist
47
14.1
16.4
12
4.1
18.6
8
4.8
10.0
67
11.0
15.6
17.6
1
29.6
103
7.0
35
144.0
205
31.8
Default
Inl
87
12.2
35.2
12
2.7
2.8
9
6.4
16.9
108
10.7
30.1
7.6
212
10.6
9
26.1
329
11.0
settings
3nl
68
78.5
222.8
17
4.9
14.5
15
5.6
44.7
100
55.1
160.7
11.5
207
8.5
14
82.9
321
26.2
In3
67
52.5
17.7
16
1.4
3.3
15
3.4
15.1
98
36.6
14.9
7.7
228
13.2
11
609.9
337
39.5
lOnl
55
8.8
42.0
18
1.4
18.5
18
15.2
289.7
91
8.6
86.4
Inl 00
46
3.1
5.6
16
1.2
1.7
10
2.1
12.7
77.5
72
2.5
14.7
10.8
206
6.8
11
31.8
308
8.2
178
8.8
15
1162.6
265
72.4
stra
48
6.0
3.7
22
2.9
4.5
14
1.8
4.0
84
4.5
4.0
4.0
1
25.2
86
5.5
21
132.3
191
19.0
dist
47
104.1
41.2
14
3.2
18.5
12
4.7
10.1
73
67.8
31.2
17.6
1
28.1
97
5.9
39
243.4
209
71.9
User
Inl
73
54.0
51.5
17
2.5
9.2
9
6.4
16.6
99
40.8
41.1
7.6
settings
3nl
67
41.8
151.1
17
214
39.0
6
6.4
319
38.9
200
8.0
19
8.0
322
14.6
2.2
10.4
19
5.3
37.5
103
28.5
106.9
11.8
In3
66
6.8
20.8
22
1.6
3.5
16
lOnl
55
9.5
24.2
21
1.9
9.9
19
4.1
18.0
104
12.4
170.3
95
5.3
16.7
7.8
8.4
50.3
12.5
3.5
5.7
19
2.4
3.0
18
3.6
400.3
83
3.3
90.7
12.6
221
15.5
18
199
6.7
10
18.7
304
7.6
167
8.2
28
25.3
278
8.5
12.3
343
12.2
InlOO
46
Table 4: GammaPlus
high peak
small on high
small on low
all matches
position
annihilation
misses
false hits
N
XI
X2
N
XI
X2
N
XI
X2
N
XI
X2
X
N
X
N
X
N
X
total
N
X
stra
48
1.4
1.7
18
1.9
1.4
15
1.1
1.2
81
1.4
1.5
1.9
1
4.6
88
5.6
10
7.0
179
3.8
dist
47
1.4
2.4
15
6.3
16.6
14
1.2
2.2
76
2.3
5.0
18.3
1
0.3
94
5.5
15
1223.7
185
103.5
Default
Inl
50
142.2
265.1
11
8.8
4.5
14
2.4
5.2
75
96.6
178.4
9.3
settings
3nl
51
16.4
13.6
13
2.6
1.4
16
2.1
4.4
80
11.3
9.8
16.0
236
199.1
205
41.8
4
8
16.7
319
170.4
6.2
289
32.9
User
In3
49
24.8
24.0
16
3.8
3.3
12
1.1
2.5
77
16.8
16.4
3.2
lOnl
47
4.3
4.7
16
2.2
9.8
15
2.2
3.3
78
3.5
5.5
12.0
InlOO
47
1.4
1.7
15
2.1
1.4
15
0.9
1.1
251
81.7
9
4.3
337
64.8
209
27.6
5
2.8
292
20.7
172
7.8
7
5.4
256
5.8
77
1.4
1.5
9.4
stra
48
1.3
1.5
20
2.0
1.4
14
0.7
0.9
82
1.4
1.4
1.7
1
1.7
87
5.6
13
6.3
182
3.7
dist
47
1.7
2.7
16
6.9
16.1
14
1.2
2.2
77
2.6
5.2
18.4
1
1.4
93
5.5
20
952.8
190
104.6
Inl
74
42.0
78.3
17
3.1
3.3
14
2.8
5.4
105
30.5
56.5
8.2
211
71.7
12
6.2
328
56.1
settings
3nl
62
41.4
13.0
17
2.2
1.3
17
2.0
4.1
96
27.5
9.3
14.1
In3
65
31.4
12.0
22
3.9
3.3
14
1.2
3.5
101
21.2
9.0
5.5
190
12.7
7
226
23.3
10
4.1
337
22.1
4.5
293
17.4
lOnl
54
InlOO
47
2.9
3.9
19
2.0
7.3
16
2.3
3.6
89
2.6
4.6
11.1
1.4
1.6
18
1.6
1.2
15
0.9
1.0
80
1.4
1.4
9.5
199
8.8
4
2.4
292
6.9
167
7.7
10
5.0
257
5.6
o\
Table 5: GammaTrack
high peak
small on high
small on low
all matches
position
annihilation
misses
false hits
total
N
XI
X2
N
XI
X2
N
XI
X2
N
XI
X2
X
N
X
N
X
N
X
N
X
stra
45
5.0
55.9
3
3.9
5.5
4
0.2
0.8
52
4.6
48.7
2.9
3
254.7
118
11.8
4
48.8
174
10.5
dist
Default
Inl
55
20.2
156.3
5
5.6
19.2
3
6.9
43.6
63
18.4
140.1
8.2
settings
3nl
258
47.9
4
111.0
325
43.0
In3
52
55
8.0
25.5
2
12.1
6.1
3
1.2
3.3
57
7.8
23.7
11.8
13.7
59.7
7
7.3
4.9
1
4.0
21.3
63
12.8
53.0
2.2
254
14.6
4
268
29.9
137.3
315
14.9
3
53.4
334
26.9
lOnl
49
4.8
45.3
2
0.7
1.0
2
1.4
5.6
53
4.5
42.1
8.0
InlOO
251
196
10.8
3
stra
47
4.4
49.1
4
0.7
2.5
7
0.6
2.0
58
3.7
40.2
2.9
3
234.5
111
8.6
4
25.0
256
9.3
47.8
173
7.9
17.5
3
35.3
307
15.5
45
2.9
24.5
7
4.9
11.8
5
1.0
3.1
57
3.0
21.1
6.1
dist
46
75.6
101.9
7
1.1
11.2
5
1.0
9.8
58
59.9
82.3
26.8
3
553.2
111
8.7
13
691.5
182
73.9
User
Inl
58
15.7
219.9
6
1.9
10.2
4
6.6
61.4
68
14.0
192.1
8.3
251
45.6
8
60.4
327
39.4
settings
3nl
57
51.7
64.7
6
5.0
10.5
5
0.5
4.6
68
43.8
55.5
12.4
234
11.2
4
237.6
306
21.4
In3
56
12.3
62.2
9
6.6
7.9
4
2.6
14.7
69
11.0
52.4
2.8
260
29.3
4
38.2
333
25.6
lOnl
InlOO
51
47
4.0
41.5
5
0.3
0.7
7
0.6
4.3
63
3.3
34.1
8.7
3.1
22.0
8
2.7
7.8
5
1.4
6.1
60
2.9
18.8
7.0
235
16.6
192
9.3
3
31.4
3
34.2
301
14.0
255
8.0
Table 6: Gamma Vision
Default
stra
high peak
N
small on high
XI
X2
N
XI
X2
small on low
N
XI
X2
all matches
N
XI
X2
position
annihilation
misses
false hits
total
X
N
X
N
X
N
X
N
X
47
0.8
4.0
10
1.7
8.2
8
0.5
2.4
65
0.9
4.5
2.2
1
65.6
105
9.6
9
4.0
179
6.2
settings
dist
Inl
44
0.9
6.8
14
2.4
40.8
6
0.8
5.8
64
1.2
13.5
17.6
1
42.0
105
10.4
24
185.4
193
29.2
47
473.5
1170.2
6
17.6
55.3
5
2.9
33.5
58
385.8
956.9
45
45.5
58.2
10
2.5
11.4
6
1.8
55.6
61
34.1
50.3
45
149.4
197.4
14
4.3
31.8
5
2.1
21.6
64
106.1
147.5
8.8
17.6
3.5
269
237.5
11
1.2xl04
338
646.5
239
119.0
17
234.8
317
108.9
267
110.8
11
2.2
342
106.5
3nl
In3
lOnl
44
6.8
13.2
10
2.7
138.2
8
3.8
134.6
62
5.7
49.0
11.4
InlOO
235
27.1
11
1.7
308
21.9
188
9.0
15
3.9
267
6.8
46
0.8
4.3
11
1.7
20.3
7
0.2
1.9
64
0.9
6.8
8.3
stra
47
0.8
4.0
11
1.5
7.5
8
0.5
2.4
66
0.9
4.4
2.1
1
65.6
104
9.7
9
4.0
179
6.1
dist
44
0.9
6.8
14
2.4
40.8
6
0.8
5.8
64
1.2
13.5
17.6
1
42.0
105
10.4
24
185.3
193
29.2
User
Inl
47
471.7
1170.2
6
17.6
55.3
5
2.9
33.5
58
384.3
956.9
8.8
269
237.5
11
1.2xl04
338
641.5
settings
3nl
45
45.6
58.2
10
2.5
11.4
6
1.8
55.6
61
34.2
50.3
17.6
239
119.0
18
222.7
318
108.6
In3
45
149.5
197.4
14
4.3
31.8
5
2.1
21.6
64
106.2
147.5
3.5
267
110.8
11
2.2
342
106.5
lOnl
44
6.8
13.2
10
2.7
138.2
8
3.8
134.6
62
5.7
49.0
11.4
InlOO
46
0.8
4.3
11
1.7
20.3
7
235
27.1
12
1.6
309
21.8
188
9.0
15
3.9
267
6.8
0.2
1.9
64
0.9
6.8
8.3
oo
Table 7: Gamma-W
high peak
small on high
small on low
all matches
position
annihilation
misses
false hits
total
N
XI
X2
N
XI
X2
N
XI
X2
N
XI
X2
X
N
X
N
X
N
X
N
X
stra
48
0.7
2.1
18
1.8
2.6
8
1.8
4.5
74
1.1
2.5
0.5
3
158.0
92
6.1
2
49.8
168
4.4
dist
47
1.2
5.1
14
6.7
42.6
7
1.8
6.1
68
2.3
12.3
5.9
3
176.8
101
8.7
28
70.7
197
15.4
Default
Inl
75
50.5
134.7
19
5.8
11.6
6
6.3
23.9
100
39.3
104.6
1.9
settings
3nl
56
17.1
46.2
18
3.2
7.7
14
52.1
6822.7
88
19.9
1116.4
122.3
In3
64
15.2
28.8
18
4.9
7.8
9
1.4
6.0
91
11.8
22.4
1.4
lOnl
51
211
39.7
14
556.7
325
193
35.0
4
533.5
285
37.4
232
20.6
4
402.1
327
22.8
211
14.5
61.9
7.3
22.6
14
2.2
2.9
9
2.0
5.9
74
5.7
16.8
3.3
285
12.2
InlOO
45
0.9
3.1
10
3.3
5.4
10
1.0
4.6
65
1.3
3.7
3.3
185
9.8
1
14.0
251
7.6
stra
48
0.7
1.9
18
1.5
1.7
7
0.9
1.9
73
0.9
1.8
0.5
3
158.0
94
6.5
1
29.6
168
4.2
dist
46
9.2
11.9
14
7.3
33.2
7
1.4
3.6
67
7.8
15.0
5.6
3
176.2
102
9.4
27
220.0
196
38.0
User
Inl
81
37.6
42.4
18
3.4
12.9
6
5.6
25.0
105
29.9
36.4
2.3
settings
3nl
64
7.5
12.8
18
2.2
5.5
12
2.3
9.5
94
5.8
11.0
3.5
210
13.7
13
880.4
328
53.2
196
7.7
2
279.2
292
9.0
In3
67
3.5
8.7
16
3.2
7.1
9
0.9
2.4
92
3.2
7.8
1.9
234
14.3
3
81.9
329
11.8
lOnl
52
2.2
6.2
14
2.0
2.5
9
2.3
12.2
75
2.2
6.3
3.1
InlOO
45
214
8.7
180
9.7
1
87.9
249
7.9
289
7.0
2.1
2.5
13
2.8
2.0
10
0.9
3.0
68
2.1
2.5
3.2
Table 8: Ganaas
high peak
small on high
small on low
all matches
position
annihilation
misses
false hits
total
VO
N
XI
X2
N
XI
X2
N
XI
X2
N
XI
X2
X
N
X
N
X
N
X
N
X
stra
48
0.4
1.5
11
1.4
3.0
9
0.3
1.4
68
0.6
1.7
1.9
1
1.2
101
5.9
0
169
3.8
dist
47
0.5
3.5
10
4.0
19.6
7
1.0
7.6
64
1.1
6.1
18.0
1
0.2
105
6.5
15
584.4
184
52.0
Default
Inl
53
8.6
376.2
10
9.8
17.2
5
1.1
9.1
68
8.3
296.4
16.9
settings
3nl
52
10.7
100.3
10
3.7
13.0
10
0.4
3.8
72
8.3
74.7
5.1
231
88.2
2
8.9
301
69.6
250
67.4
0
322
54.2
In3
52
4.6
60.9
12
5.5
11.2
9
1.7
40.3
73
4.4
50.2
12.1
239
49.9
1
2.9
313
39.1
lOnl
51
2.8
9.6
9
0.7
1.7
7
0.6
3.1
67
2.3
7.8
5.5
InlOO
47
0.6
2.5
13
1.6
4.1
7
0.4
1.4
67
0.8
2.7
9.1
247
26.8
0
184
8.2
2
4.2
253
6.2
314
21.6
stra
48
0.5
1.6
12
1.3
2.8
9
0.3
1.6
69
0.6
1.8
1.8
1
1.2
100
5.9
0
169
3.7
dist
47
0.6
4.5
10
3.6
19.4
7
0.9
8.2
64
1.0
6.8
18.1
1
0.2
105
6.5
15
583.6
184
51.9
User
Inl
53
5.1
338.6
11
6.6
18.9
5
1.0
7.8
69
5.0
263.6
16.9
settings
3nl
52
10.2
100.0
10
3.4
12.2
10
0.4
3.6
72
7.9
74.4
5.2
230
88.9
2
14.2
301
69.2
250
67.4
0
322
54.1
In3
52
4.7
62.7
11
5.4
10.9
8
0.5
4.4
71
4.3
48.1
12.2
241
49.6
2
7.9
314
39.1
lOnl
51
2.8
10.4
9
1.5
5.5
8
0.7
3.9
68
2.4
9.0
5.1
InlOO
47
0.6
2.6
13
1.4
3.9
247
26.8
0
184
8.2
2
3.8
253
6.2
315
21.5
7
0.5
1.7
67
0.8
2.7
9.1
oo
O
Table 9: GeniePC
high peak
small on high
small on low
N
XI
X2
N
XI
X2
N
XI
X2
all matches
position
annihilation
misses
false hits
total
N
XI
X2
X
N
X
N
X
N
X
N
X
stra
45
1.3
5.1
2
4.0
3.9
2
0.8
3.0
49
1.4
4.9
2.6
1
0.2
121
13.0
1
33.7
171
9.8
dist
42
1.6
6.1
1
3.6
47.8
2
3.0
10.2
45
1.6
6.0
18.5
1
0.1
125
14.4
9
1301.9
179
76.3
Default
Inl
35
629.6
1225.1
1
67.2
86.8
1
11.6
55.9
37
597.7
1162.7
9.8
settings
3nl
43
126.0
92.8
2
6.3
11.5
2
2.2
5.0
47
115.6
85.6
19.4
39
183.0
225.0
1
23.2
21.1
1
0.4
1.4
41
174.6
lOnl
45
14.9
16.4
2
3.5
4.3
1
0.2
0.5
48
14.1
214.6
2.8
15.6
15.0
292
187.0
1
1.2xl05
330
610.8
260
52.9
0
292
94.3
0
252
26.5
0
204
12.7
0
307
62.5
333
104.2
300
24.5
252
10.6
In3
InlOO
43
1.3
3.9
3
3.4
3.9
2
4.3
12.2
48
1.5
4.2
8.9
stra
48
4.0
2.1
19
2.9
1.7
14
0.6
1.5
81
47
1.1
3.0
18
8.8
13.2
11
11.1
5.2
76
3.2
1.9
3.3
1
0.6
87
5.7
19
70.9
187
11.2
4.1
5.5
17.5
2
5476.9
93
5.5
40
314.0
209
64.3
dist
User
Inl
65
20.4
134.7
9
7.8
9.9
9
3.5
17.9
83
17.2
108.5
8.1
settings
237
46.4
20
19.4
340
37.7
198
8.0
22
19.5
309
7.4
3nl
59
1.7
6.5
15
11.1
7.5
15
0.7
2.3
89
3.1
6.0
13.1
In3
61
4.4
17.8
21
6.0
6.9
11
3.7
4.9
93
4.7
13.8
4.9
234
22.9
17
6.0
344
17.1
lOnl
56
4.2
179.2
16
2.5
7.4
12
3.1
5.6
84
3.7
121.7
10.0
InlOO
47
0.9
2.0
18
1.9
2.2
12
0.8
2.6
77
1.1
2.2
9.7
208
10.6
15
3.8
307
8.4
174
8.0
24
3.9
275
5.7
Table 10: Hypermet-PC
high peak
N
XI
small on high
small on low
all matches
position
annihilation
misses
false hits
total
oo
X2
N
XI
X2
N
XI
X2
N
XI
X2
X
N
X
N
X
N
X
N
X
stra
47
0.8
1.2
7
3.1
2.8
6
2.2
2.1
60
1.2
1.5
0.8
2
160.3
110
8.9
0
170
6.2
dist
47
1.3
2.6
9
8.4
26.7
5
0.5
0.8
61
2.1
5.6
11.7
2
269.0
109
7.6
15
520.9
185
47.6
Default
Inl
59
28.1
199.9
6
8.8
10.3
4
11.0
36.6
69
25.4
173.9
4.1
settings
3nl
54
2.2
7.8
9
7.4
8.5
6
1.0
1.3
69
2.8
7.3
10.7
257
226
10.5
0
56.9
1
60.8
327
50.3
295
8.7
In3
55
16.5
44.1
8
6.9
6.3
7
3.1
5.8
70
14.1
35.9
2.3
258
33.3
1
34.7
329
29.2
lOnl
52
1.8
4.8
9
4.3
4.5
7
2.3
| 5.4
68
2.2
4.8
7.9
InlOO
46
221
9.5
0
189
8.9
1
13.1
252
7.2
295
7.8
1.0
1.5
8
7.4
5.4
8
1.0
1.3
62
1.8
1.9
6.9
stra
48
0.7
1.1
24
2.3
2.0
15
2.1
1.8
87
1.4
1.5
1.0
2
160.3
80
5.3
13
6.1
180
3.5
dist
User
Inl
69
24.9
188.4
24
4.1
8.5
17
5.5
11.6
110
17.3
121.8
3.1
settings
3nl
55
2.4
8.6
25
3.7
5.3
22
2.8
8.7
102
2.8
7.8
8.1
196
63.3
12
10.0
318
176
9.3
11
4.9
289
6.9
45.4
In3
56
17.1
44.2
23
5.2
7.1
14
3.7
7.1
93
12.2
29.4
2.2
229
35.6
15
6.5
337
27.9
3.6
13
5.2
116.9
89
2.6
20.8
6.7
InlOO
47
1.1
1.7
21
4.1
194.7
16
0.9
2.1
84
1.8
50.0
6.0
195
9.5
11
5.4
295
7.3
163
7.8
15
7.2
262
5.9
lOnl
53
1.8
4.6
23
2.7
oo
K)
Table 11: InterWinnerAVinnerGamma
high peak
small on high
small on low
N
XI
X2
N
XI
X2
N
XI
X2
all matches
position
annihilation
misses
false hits
total
N
XI
X2
X
N
X
N
X
N
X
N
X
stra
36
0.5
3.5
16
1.6
5.5
5
1.4
21.3
57
0.9
5.6
4.6
1
0.9
68
49.5
47
10.1
172
22.7
dist
36
0.6
5.2
13
3.3
219.3
8
1.4
23.3
57
1.2
53.2
12.9
1
0.1
67
10.8
66
54.5
190
23.2
Default
Inl
41
241.5
1175.1
13
9.3
47.1
5
1.0
19.0
59
169.9
828.6
9.8
settings
3nl
38
72.3
135.3
21
1.7
24.0
176
263.2
42
3.9
111
204.1
155
180.0
58
32.3
279
7
1.9
78.4
66
42.4
93.8
14.8
116.7
In3
38
85.2
233.7
16
4.9
32.3
6
1.5
22.8
60
55.4
158.9
6.3
187
133.2
35
1.6
282
100.3
lOnl
37
9.4
23.4
15
2.2
66.2
6
2.0
22.7
58
6.8
34.4
10.9
169
32.7
48
1.5
275
21.8
InlOO
38
1.0
10.6
19
1.2
37.9
8
1.2
161.5
65
1.1
37.1
10.1
129
9.1
44
2.0
238
5.6
stra
36
0.6
3.8
17
1.3
5.1
6
1.2
19.1
59
0.9
5.7
4.3
1
0.9
66
50.6
51
9.4
176
22.0
dist
36
0.6
5.2
13
3.3
219.3
8
1.4
23.3
57
1.2
53.2
12.9
1
0.1
User
Inl
73
20.9
87.6
17
1.7
23.3
5
3.8
66.3
95
16.5
75.0
8.1
10.8
66
54.5
141
9.5
39
67.6
190
23.2
275
20.2
67
settings
3nl
53
3.1
In3
53
25
2.2
33.9
14
1.6
54.3
92
2.6
27.9
10.2
2.7
18.5
22
1.5
13.2
14
1.0
23.0
89
2.2
17.9
7.0
142
11.0
38
2.6
272
7.0
151
10.9
40
6.9
280
7.6
LJ8.1
lOnl
46
1.8
InlOO
38
1.0
15.3
16
1.6
36.7
11
2.2
110.3
73
1.8
34.3
8.2
9.8
17
1.9
23.1
10
1.4
425.8
65
1.3
77.3
9.5
156
9.4
25
2.0
254
65
127
8.9
32
2.1
224
5.7
Table 12: OSQ/Professional
high peak
N
XI
small on high
small on low
all matches
position
annihilation
misses
false hits
total
00
U)
X2
N
XI
X2
N
XI
X2
N
XI
X2
X
N
X
N
X
N
X
N
X
stra
47
1.2
3.2
7
1.5
1.7
6
0.9
1.9
60
1.2
2.9
2.0
1
4.5
110
8.9
0
170
6.2
dist
43
2.1
5.1
4
10.2
14.7
3
0.9
2.1
50
2.4
5.4
20.6
2
1641.9
120
12.9
12
414.8
182
36.7
Default
Inl
43
601.8
1219.9
11
20.1
118.3
5
4.3
12.4
59
442.7
912.2
11.6
settings
3nl
255
343.3
3
5.8xl04
317
906.1
In3
InlOO
46
1.3
3.1
6
60
102.6
82.7
15.8
7
13.0
11.0
6
1.2
2.5
58
109.2
137.8
5.0
lOnl
45
15.9
13.9
5
4.4
3.0
8
2.0
2.8
58
13.0
11.4
12.4
239
74.3
0
272
110.0
0
235
32.2
0
194
10.0
0
299
79.9
330
109.8
293
28.4
251
8.1
47
129.4
103.5
8
8.2
10.8
5
1.5
3.2
45
138.5
175.6
5.3
7.6
5
0.8
1.5
57
1.7
3.5
8.9
stra
48
1.0
1.0
16
2.0
3.0
14
0.5
0.5
78
1.1
1.3
2.0
4
143.7
91
6.1
13
12.3
182
4.4
dist
47
2.7
4.0
12
10.5
40.9
9
2.7
6.8
68
3.9
10.3
19.5
2
381.3
102
7.6
26
82.9
196
16.4
User
Inl
77
6.4
159.3
22
3.3
7.6
8
7.3
9.0
107
5.8
116.9
5.7
settings
3nl
52
209
122.5
3
7.3
319
82.3
208
25.5
11
14.1
301
19.2
3.9
13.9
12
2.9
4.0
18
3.7
20.9
82
3.7
14.0
14.8
In3
61
3.3
35.5
21
3.2
13.2
15
0.8
1.5
97
2.9
25.4
5.0
228
68.9
11
8.3
336
47.9
lOnl
Inl 00
47
1.3
1.6
13
4.3
311.2
15
1.3
28.0
75
1.8
60.5
9.2
172
7.9
5
8.2
252
6.1
Table 13: Sampo 90
Default
high peak
small on high
N
XI
X2
N
XI
X2
small on low
all matches
position
annihilation
misses
false hits
total
N
XI
X2
N
XI
X2
X
N
X
N
X
N
X
N
X
stra
47
1.8
2.3
6
1.4
1.4
4
0.5
0.6
57
1.7
2.0
0.6
1
1074.3
113
9.7
0
dist
46
1.8
3.0
4
12.8
47.9
5
0.9
1.5
55
2.3
5.3
10.1
1
877.4
115
8.1
7
922.5
170
7.0
177
42.7
Inl
38
299.0
364.9
2
22.7
5.0
3
9.8
14.4
43
266.0
323.7
5.3
284
197.9
2
55660
329
544.0
settings
3nl
48
20.2
15.7
4
2.2
1.1
3
0.9
1.2
55
17.8
13.9
9.1
User
In3
46
27.0
22.6
4
4.5
5.0
3
1.6
3.4
53
23.9
20.2
1.7
46
5.3
5.9
5
0.4
0.3
5
1.7
3.2
56
4.5
5.1
6.5
46
1.8
2.1
5
4.3
3.5
5
1.8
1.6
56
2.0
2.2
5.2
280
196
9.5
0
stra
47
1.8
2.3
6
1.4
1.4
4
0.5
0.6
57
1.7
2.0
0.6
1
1074.3
113
9.7
0
252
7.8
170
7.0
lOnl
248
56.0
0
92.8
0
244
30.5
0
303
49.0
333
818
300
25.7
InlOO
dist
46
1.8
3.0
4
12.8
47.9
5
0.9
1.5
55
2.3
5.3
10.1
1
877.4
115
8.1
7
922.5
177
42.7
53.2
20
4.5
4.6
14
9.2
7.6
120
16.2
39.8
3.2
settings
3nl
67
5.4
39.1
25
7.5
16.2
24
6.3
13.8
116
6.0
29.0
4.6
3.5
7.6
117
6.8
19.5
3.1
193
12.3
40
288.9
353
44.9
175
98.8
42
28.7
333
57.7
208
12.9
35
36.5
360
13.2
Inl
86
20.0
In3
69
7.5
23.3
29
7.4
18.5
19
lOnl
56
6.2
379.1
27
4.7
20.6
18
48.3
31.3
101
13.3
221.3
4.8
188
8.1
44
17.1
333
10.9
InlOO
47
10.9
37.5
28
4.1
1.7
18
2.2
2.7
93
7.2
20.0
4.3
154
7.7
40
26.6
287
10.2
Table 14: Span
high peak
small on high
small on low
N
XI
X2
N
XI
X2
N
XI
X2
all matches
position
X
annihilation
N
X
N
X
N
X
N
X
misses
false hits
total
oo
N
XI
X2
stra
41
0.7
1.0
14
2.4
1.8
6
0.6
1.1
61
1.1
1.2
3.3
1
1327.5
70
7.6
16
2.6
147
4.3
dist
Default
Inl
63
10.9
44.3
9
4.3
3.4
3
6.0
21.3
75
9.9
38.5
8.4
settings
3nl
51
4.1
10.2
17
175
27.9
9
14.5
259
22.2
156
12.4
18
3.3
250
9.3
6.5
4.8
8
3.9
18.3
76
4.4
9.9
11.7
In3
lOnl
51
6.7
17.9
15
13.8
10.7
5
2.3
6.5
71
7.9
15.6
5.0
43
3.0
7.1
17
4.0
38.6
8
2.5
14.4
68
3.2
15.8
8.9
InlOO
41
1.9
2.8
11
3.5
3.5
5
1.2
2.4
57
2.1
2.9
9.7
184
166
18.2
25
3.4
259
12.8
146
8.0
25
4.2
228
6.1
23.6
15
5.3
270
18.5
stra
41
1.1
2.0
25
1.9
2.0
11
0.7
2.4
77
1.3
2.1
2.7
1
1327.5
54
5.6
49
3.1
180
3.1
dist
User
Inl
67
10.6
46.2
15
3.5
3.8
5
7.5
30.8
87
9.2
38.0
9.7
settings
3nl
52
4.2
11.5
28
3.6
6.2
12
1.2
11.4
92
3.6
9.9
12.2
In3
53
6.3
20.0
24
8.8
9.4
12
1.4
5.1
89
6.3
15.2
5.4
lOnl
44
2.8
5.9
27
2.3
15.3
11
2.7
33.4
82
2.6
12.7
9.3
InlOO
41
1.4
3.1
23
2.2
1.8
10
1.4
129.9
74
163
26.4
30
5.4
280
18.8
134
12.7
43
2.9
269
8.0
165
22.6
51
3.1
305
14.6
150
17.3
68
3.2
300
10.1
128
7.9
68
3.4
270
5.0
1.6
19.8
9.2
APPENDIX II:
LIST OF TESTED SOFTWARE PACKAGES AND THEIR
PRODUCERS
Software
Version
Producer
ActAn
2.5 (1995)
Centre de Estudios Aplicados al Desarrollo Nuclear
(CEADEN)
Calle 30 No. 502 e/ 5ta y 7ma. Miramar Playa
Havana, CUBA
Fax: (++ 53 7)
Phone: (++53 7) 22 14 22
E-mail: [email protected]
GammaPlus
1.02.0(1995)
SILENA S.P.A
Via Firenze, 3
1-20063 Cernusco s/N
ITALY
Fax: (++ Int. 39) (0) 2 92 106 331
Phone: (++Int. 39) (0) 2 92 106 293
E-mail:
GammaTrack
1.3 release 2
Oxford Instruments Inc.
Nuclear Measurement Group
P.O. Box 2560, 601 Oak Ridge Turnpike
Oak Ridge, Tenessee 37831-2560,
USA
Fax: (++615)483 5891
Phone: (++615)483 8405
Toll free phone: 1-800-769-93673
E-mail:
GammaVision
2.3(1995)
EG&G ORTEC
100 Midland Road, Oak Ridge,
TN 37831-0895 US A
Fax: (++615) 483 2177
Phone: (++615)482 4411
Toll free phone: 800-251-9750
E-mail:
WWW: http://www.egginc.com/
86
Gamma-W
17.08
(1995)
Dr. Westmeier GmbH
Moellner Weg 32, D-3557
Ebsdorfergnmd-Moelln
GERMANY
Fax: (++ 49) 64-24 49 94
Phone: (++ 49) 64-24 43 23
E-mail: [email protected]
Ganaas
3.3(1995)
Physics Section, RIPC, IAEA
Wagramerst. 5, P.O. Box 100
Vienna AUSTRIA
Fax: (++43-1) 20607
Phone: (++43-1) 206021706
E-mail: [email protected]
WWW:
http//www.iaea.or.at
GeniePC
2.2(1995)
Canberra Industries, Inc.
800 Research Parkway, Meriden,
CT 06450 USA
Fax: (++203)235-1347
Phone: (++203)238-2351
E-mail: [email protected]
WWW:
http//www.canberra.com
HypermetPC
4.00 (1995)
Nuclear Physics Department. Institute of Isotopes
KFKI
XH. Konkoloy Thege u. 29-33
H-1525 Budapest, POB 77
HUNGARY
Fax: (++36-1)275 4349
Phone: (++36-1) 275 4349
E-mail: [email protected]
WinnerGamma
3.42 (1995)
EURISYS MESURES
Reseau Eurisys
Siege social
ZA de I'Observatorie
4, Avenue des Frenes
F-78067 St. Quentin Yvelmes
CEDEX FRANCE
Phone: (++1) 30.14.57.78
Fax: (++1)30.14.57.80
87
OSQ/Professional
6.3 releasel
(1995)
APTEC Engineering Ltd.
East-50B Caldari Road
Concord, Ontario
CANADA L4K 4N8
Phone: (++905) 660 5373
Fax: (++905) 660 9693
E-mail:
WWW: http//www.aptec-inc.com:80
Sampo90
3.6
Helsinki University of Technology
Department of Technical Physics
Rakentajanaukio 2
FIN-02 150 Espoo
FINLAND
Fax: (++358-0)4513195
Phone: (++358-0)451 3191
E-mail: [email protected]
Span
5.1
China Institute of Atomic Energy
P.O-Box. 275 (29) Beijing, China 102413
Fax:+86-109357102
Phone:+86-109357102
CONTRIBUTORS TO DRAFTING AND REVIEW
BERNASCONI, G.
Seibersdorf Laboratones,
International Atomic Energy Agency,
Seibersdorf, Austria
BLAAUW, M.
Interfaculty Reactor Institute,
University of Technology, Delft,
Netherlands
CAPOTE Noy, R.
Centre de Estudios Aphcados al Desarrollo Nuclear (CEADEN)
Havana, Cuba
van ESPEN, P.
Micro and Trace Analysis Center (MiTAC),
University of Antwerp,
Antwerp, Belgium
FAZINIC, S.
International Atomic Energy Agency
MANH, D.H.
Nuclear Physics Institute,
Dalat, Viet Nam
MOLLA, N. Islam
Institute of Nuclear Science and Technology,
Bangladesh Atomic Energy Commission,
Dhaka, Bangladesh
OSORIO, V.
International Atomic Energy Agency
WESTMEIER, W.
Dr. Westmeier GmbH,
Gesellschaft fur Kernspektrometne,
Molln, Germany
89