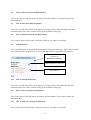
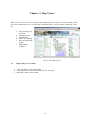
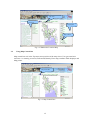
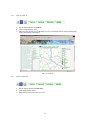
1
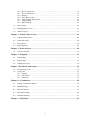
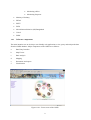
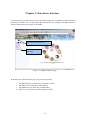
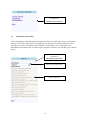
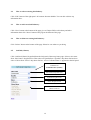
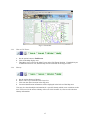
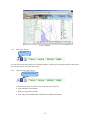
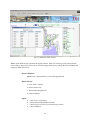
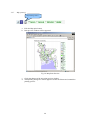
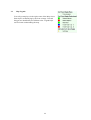
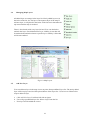
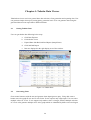
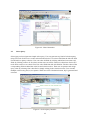
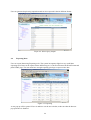
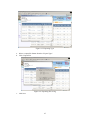
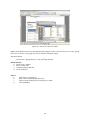
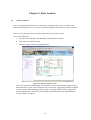
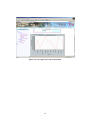
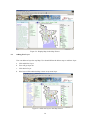
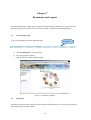
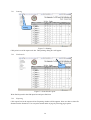
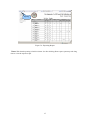
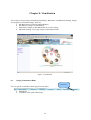
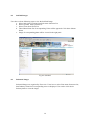
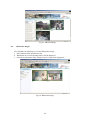
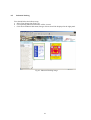
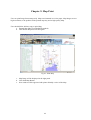
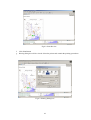
GIS Based Salt Industry Information System
(User Manual)
Table of Contents:
Table of Contents:....................................................................................................................1
Chapter 1 : Intoduction ...........................................................................................................4
1.1
Introduction .............................................................................................................................4
1.2
Software framework design.....................................................................................................4
1.3
Overall architecture of GSIIS ..................................................................................................4
1.4
User Interface ..........................................................................................................................5
1.4.1 Data entry and editing interface ....................................................................................5
1.4.2 Query and Reporting interface......................................................................................5
1.4.3 Mapping interface .........................................................................................................5
1.5
Database ..................................................................................................................................6
1.6
Web Server ..............................................................................................................................6
1.6.1 Map components: SharpMap ........................................................................................6
1.7
Technology used......................................................................................................................6
1.8
Main Input and output from the system...................................................................................7
1.8.1 Input data layers............................................................................................................7
1.8.2 Major Outputs ...............................................................................................................8
1.9
Main user of GSIIS..................................................................................................................8
1.10 Software components ..............................................................................................................9
Chapter 2 : Data Entry Interface .........................................................................................10
2.1
Salt Industry Data Entry ........................................................................................................11
2.2
How to edit an existing Salt Industry ....................................................................................12
2.3
How to add a new Salt Industry: ...........................................................................................12
2.4
How to delete an existing Salt Industry:................................................................................12
2.5
Salt Bed (Ghona): ..................................................................................................................12
2.6
How to edit an existing Salt Bed (Ghona):............................................................................13
2.7
How to add a new Salt Bed (Ghona) .....................................................................................13
2.8
How to delete an Existing Salt Bed (Ghona).........................................................................13
2.9
Salt Wholesaler......................................................................................................................13
2.10 How to add Salt Wholesaler ..................................................................................................13
2.11 How to edit an existing Salt Wholesaler................................................................................13
2.12 How to delete an existing Salt Wholesaler ............................................................................13
Chapter 3 : Map Viewer........................................................................................................14
3.1
Display Map very fist Time...................................................................................................14
3.2
Using Map Control Box ........................................................................................................15
3.2.1 How to Zoom In:.........................................................................................................16
2
3.2.2
3.2.3
3.2.4
3.2.5
3.2.6
3.2.7
3.2.8
How to Zoom Out: ......................................................................................................16
How to Full Extent:.....................................................................................................17
Identity:.......................................................................................................................17
Reset Map Viewer: .....................................................................................................18
Map Attribute table viewer: .......................................................................................18
Map printing: .............................................................................................................20
Map Labeling:.............................................................................................................21
3.3
Map Legend:..........................................................................................................................22
3.4
Managing Map Layers:..........................................................................................................23
3.5
Add New Layer .....................................................................................................................23
Chapter 4 : Tabular Data Viewer.........................................................................................24
4.1
Getting Tabular Data .............................................................................................................24
4.2
Generating Chart ...................................................................................................................24
4.3
Select Query ..........................................................................................................................25
4.4
Exporting Data.......................................................................................................................26
Chapter 5 : Data Analysis .....................................................................................................30
5.1
Advance Analysis..................................................................................................................30
Chapter 6 : Mapping .............................................................................................................33
6.1
Getting Map...........................................................................................................................33
6.2
Display Map ..........................................................................................................................33
6.3
Adding New Layer ................................................................................................................34
Chapter 7 Documents and reports .......................................................................................35
7.1
Get reporting Tools................................................................................................................35
7.2
Using tools.............................................................................................................................35
7.2.1 Printing .......................................................................................................................36
7.2.2 Find/search..................................................................................................................36
7.2.3 Exporting ....................................................................................................................36
Chapter 8 : Visualization.......................................................................................................38
8.1
Getting Visualization Home ..................................................................................................38
8.2
Salt Bed Images.....................................................................................................................39
8.3
Industrial Images ...................................................................................................................39
8.4
Wholesaler Images ................................................................................................................40
8.5
Industrial Packing..................................................................................................................41
Chapter 9 : Map Print ...........................................................................................................42
3
Chapter 1: Intoduction
1.1
Introduction
For effective monitoring of salt iodization process in Bangladesh and for ensuring the proper iodine
level for the general people, a GIS based web enable monitoring system named as GIS Based Salt
Industry Information System (GSIIS) has been developed. The web based system is developed for
monitoring of salt iodization so that all the partners in the process could have access to the system
through internet or intranet based on their access authorization. The system is developed using open
source software development tools to reduce the cost and licensing obligations. The user interfaces,
input/output formats is designed and developed as per requirement and consultation with BSCIC and
MI. To develop this web based inventory and mapping system is followed the following steps
•
System design
•
Database design
•
Interface design
•
System development
1.2
Software framework design
The software framework development task includes conceptualization of software framework and
identification of software elements and users. Series of consultation workshops were also organized
to design the initial framework and elements or modules of the monitoring software. The major
elements of the software were identified are data input, data browsing, query and report generation
and mapping etc. The detail interfaces of the software were described in the following chapter.
Further, the user of software were also identified are, BSCIC, BUET, BITAC, INFS, IPHN, UNICEF
and Micronutrient Initiative (MI) Bangladesh etc.
1.3 Overall architecture of GSIIS
The system is designed and developed using four-tier architecture that will consist following layers:
•
User interface
•
Web Server
•
Map server and Desktop GIS
•
Database
4
Internet Application .Net Technology
User interface
Query and
reporting module
Database
Mapping
module
Web Server
IIS
Web Server
Map Server and
Data Analysis
Data entry
module
Desktop GIS
ArcGIS, ArcView
Map Server
MapMap
Server
Server
Minnesota
Sharp
Database
PostGRE SQL
GIS Data
ESRI shape files
Figure 1.3.1: Overall architecture of GSIIS
1.4 User Interface
The user interface is developed using ASP .NET framework version 2. User-friendly interface of
GSIIS is designed for easy access of data from the database server. The users get online access using
browsing tool (i.e. internet explorer) to the system and database and able to get required information
through different queries. Authorized users can insert and edit data to the system and can also able to
download data in different format.
1.4.1
Data entry and editing interface
Using data entry and editing interface, the user can enter the survey and monitoring data. The partners
including BITAC, BUET will also have online access (with authentication) to the system so that they
can enter monitoring data into the system. There are three level of data are colleted for this system and
user interface is designed to enter, update and delete data.
1.4.2
Query and Reporting interface
The query and reporting interface is designed to facilitate analyzing data based on predefine criteria
and generate reports online. The predefined query is designed and kept in the database user can get
data with by clicking the query name. There is a facility to create a new query and modify an existing
query.
1.4.3
Mapping interface
The mapping interface is developed to design and print maps on salt related data. The mapping
interface is also facilitated data retrieval based on location based query. The mapping interface is
designed based on Map Sharp components.
5
1.5 Database
The data server contains data, views, triggers and stored-procedure. It executes SQL statements,
views, triggers and stored-procedure for data manipulation. The database is designed using open
source Database Management System PostGRESQL. A relational database will be designed to store
all the survey and monitoring data.
The Spatial data will be stored in the server computer that is outside of the database, the map and the
GIS analysis components are accessed the spatial data layers to make spatial operations. The spatial
data layers are organized with the structured file formats and naming convention.
1.6 Web Server
The main component for a web-enabled application is the web server. Web server is a sever program
that handles the requests from web browsers for data and pages and delivers the requested web pages
along with data, maps and other information based on request parameters through internet or intranet.
We have developed GSIIS using .Net platform so the web server using Microsoft technology named
IIS version-6.
1.6.1
Map components: SharpMap
SharpMap is an open source map server and it is an easy-to-use mapping library for use in web and
desktop applications. It provides access to many types of GIS data, enables spatial querying of that
data, and renders beautiful maps. The engine is written in C# and based on the .Net 2.0 framework.
SharpMap is released under GNU Lesser General Public License. The important features are
described below:
•
Completely written in C# .NET 2.0
•
Embed the engine using any .NET language, including C#, VB.NET and J#
•
PostGreSQL/PostGIS support
•
ESRI Shapefile support
•
HttpHandler for ASP.NET applications
•
Support for Points, Linestings, Polygons, MultiPoints, MultiLineStrings and
MultiPolygons, * GeometryCollections etc. according to the OpenGIS Simple Features
Specification.
•
Renders attributes as labels
•
Advanced thematic maps using delegates
•
Easy extensible with additional dataproviders, layertypes and geometry types
1.7 Technology used
The technology used for development of GSIIS is .Net frame work 2 and open GIS technology. The
post GIS technology is very useful for low cost and stable solution. Open GIS is based on open source
software. The following technology is used to develop of GSIIS in different components:
−
Programming Language: C#
−
Frame work: .Net framework 2
6
−
Web components: Asp.Net
−
Data access components: NpgSql (.Net data provider for postgreSQL)
−
Database: PostgreSQL
−
Map service: SharpMap
−
Reports framework: Seagate Crystal reports
−
Chart component : TeechartPro development license version
1.8
Main Input and output from the system
To monitor the salt iodization chain in the above three steps through the intended GIS based
monitoring system the following input data layers will be used:
1.8.1
Input data layers
Primary GIS data layers that will be collected for this project:
1. Gher (Ghona) Location
2. Industry location
3. Wholesale market location
4. BSCIC office location
5. Secondary GIS data
6. Administrative boundary (District/ Thana)
7. River
8. Roads
9. Growth Center
10. From the questionnaire survey the following are input data items:
11. Common salt production:
•
General Information: GPS location, Owner name, Location etc
•
Bed Preparation: process of bed preparation, duration, cost
•
Production: production info
•
Quality Control: if maintain BSIC guideline
•
Transprtation: Salt transport by, bed to factory etc.
12. Salt Industry:
•
General Information: Factory name, Owner name, Location, and working person etc.
•
SIP Information: Opeating condition, SIP type, Machine parts condition, category of
worker etc
•
Production and Processing: capacity, source of salt, salt production, stock position
•
Chemical: crude salt process, Potasium Iodate source, chemical stock position
7
•
Quality control: Any quality control, monitor iodine level, monitor process, SOP
follow etc
•
Packing and distribution: size of packing, brand names, items printed on packets, salt
supplied
13. Wholeseller:
1.8.2
•
General Information: name, Location, responder etc.
•
Distribution: salt type distribution, packing, transport, salt packet, source salt
•
Monitoring/Technical: Iodine monitor after collecting, storing, salt distributed by ,
suggestion etc
Major Outputs
Map based outputs
•
SIP information (functional, non-functional), factory location
•
Iodized salt production map
•
Factory location by salt production (Iodized, non-Iodized, both)
•
Zone wise factory map
•
Location of common salt production, industry and wholesale market with administrative
boundary
Tabuler Output
1.9
•
Factory General Information: Owner name, man power etc.
•
Status of SIP
•
Production and Processing of Salt Industry
•
Chemical: chemical used
•
Quality control
•
Packing and distribution
•
Suggestions and problems
•
Detials status of SIP
•
In Packing items should be printed
•
Production reports monthwise
Main user of GSIIS
The main users of the intended system, GSIIS, are as follows:
Bangladesh Small and Cottage Industries Corporation (BSCIC)
o
CIDD Project
o
BSCIC head office
o
BSCIC district/zone office
8
•
Monitoring officer
•
Monitoring Inspector
Ministry of Industry
BITAC
BUET
INFS
MicroNutirent Initiative (MI) Bangladesh
Unicef
IPHN
1.10
Software components
The main intention was to develop a user-friendly web application to view, query and analyze the data
from the GSIIS database. Major components of the GSIIS are as follows:
a.
Data Entry Interface
b.
Map Viewer
c.
Data Analysis
d.
Mapping
e.
Documents and reports
f.
Visualization
Figure 1.10.1: Front screen of the GSIIS
9
Chapter 2: Data Entry Interface
To open data entry interface home click on “Data Entry Interface” hyperlink from the left panel of
home page of GSIIS. User can also get the data entry interface by clicking “Data Entry Interface”
from top menu bar from any page of the GSIIS.
Data Entry Interface Hyperlinks
Left Panel
Fiqure 2.1: GSIIS Field home page
In the data entry interface home page you get four hyperlinks:
1.
2.
3.
4.
Salt Bed (Ghona): For data entry of salt bed or ghona
Salt Industry: For data entry of salt industry
Salt Wholesaler: For data entry of wholesalers
Back: For: For go back to the home page of GSIIS
10
Left Panel of
Salt Data Entry Interface
2.1
Salt Industry Data Entry
Click “Salt Industry” hyperlink from the left panel of data entry home page. Choose a zone name
from the “Zone name” drop down list of right panel. It generates a list of Salt industries of the
selected zone. Select a salt industry name from the “Factory Name” list of right panel. The
information of selected factory is visible on the right panel. From here you can add, edit or delete a
factory.
Left Panel of
Salt Industry Data Entry
Zone Name Drop down list
Factory Name list
11
2.2
How to edit an existing Salt Industry
Click “Edit” button of the right panel. All contents become editable. You can edit or delete any
information here.
2.3
How to add a new Salt Industry:
Click “New” button at the bottom of the page give an Unique ID for salt industry and other
information then click “Insert” button of the page at the bottom of the page.
2.4
How to delete an existing Salt Industry:
Click “Delete” button at the bottom of the page. Please be sure what are you doing.
2.5
Salt Bed (Ghona):
Click “Salt Bed (Ghona)” hyperlink from the left panel of data entry home page. Select a salt center
from “Salt Center” drop down list. Then select an Upazilla from “Upazilla” drop down list box then
select a Union from “Union” drop down list box. A list of “Ghona Name” is appeared at the left panel.
Left Panel of
Salt Bed/Center (Ghona)
Salt Center Drop down list
Upazilla Drop down list
Union Drop down list
Ghona Name list
12
2.6
How to edit an existing Salt Bed (Ghona):
Click “Edit” button of the right panel. All contents become editable. You can edit or delete any
information here.
2.7
How to add a new Salt Bed (Ghona)
Click “New” button at the bottom of the page give an Unique ID for Salt Bed (Ghona) and other
information then click “Insert” button of the page at the bottom of the page.
2.8
How to delete an Existing Salt Bed (Ghona)
Click “Delete” button at the bottom of the page. Please be sure what are you doing.
2.9
Salt Wholesaler
Click “Salt Wholesaler” hyperlink from the left panel of data entry home page. Select a District Name
from “District Name” drop down list. A list of “Salt Wholesaler” is appeared at the left panel.
Left Panel of
Wholesaler Data Entry
District Name Drop down list
Whole Saler list
2.10
How to add Salt Wholesaler
Click “New” button at the bottom of the page give an Unique ID for Salt Wholesaler and other
information then click “Insert” button of the page at the bottom of the page.
2.11
How to edit an existing Salt Wholesaler
Click “Edit” button of the right panel. All contents become editable. You can edit or delete any
information here.
2.12
How to delete an existing Salt Wholesaler
Click “Delete” button at the bottom of the page. Please be sure what are you doing.
13
Chapter 3: Map Viewer
Map viewer is a nice tool to view, analysis and printing map. The viewer is very user friendly. It has
lots of tools which help user to view the map in different query. The key features of the map viewer
are,
a. Easy Zooming and
Zoom out
b. Identifying tools
c. Map labeling
d. New Layer Adding
e. Well decorated Map
legend
f. Map printing
Template
Fig 3.1: GIS Map Viewer
3.1
Display Map very fist Time
a. Click Salt Maping form Main Menu
b. Click Wholesaler Location from left side Tree navigator.
c. Map Will visible in left contend.
14
Map Tools
Map Layer
Map Legend
Map Contend
Fig 3.2: Wholesaler Location Map
3.2
Using Map Control Box
Map control box exit in the Top most center position of the map viewer. User get some basic
tools here i.e. zooming, zoom out, Full extend, Identity, Erase map, Attribute Table displayer and
Map printer.
Map Control Box
Fig 3.3: Map Control Box
15
3.2.1
How to Zoom In:
a. Set the Option button to zoom in.
b. Click in map Display Area.
c. Then user gets Zoom view of the Map. In every Click map will be zoom until the Map
control box setting Unchanged.
Fig 3.4: Zoom In
3.2.2
How to Zoom Out:
a. Set the Option button to Zoom Out.
b. Click Map Display Area.
c. Map will be Zoom out in the next view.
16
Fig 3.5: Zoom Out
3.2.3
How to Full Extent:
a. Set the option button to Full Extent.
b. Click in the Map display area.
c. Then Map viewer will set the Map Viewer in the Full Extent Position. If multiple layers
in different extent are exit, then the map will be set based on the larger extent.
3.2.4
Identity:
a.
b.
c.
d.
Set the Option button to Identity
Select active Layer form the active layer list.
Click into the desire location in the map area.
Location identification information will be displayed in the below of the Map area.
User may be viewed multiple information for a specific identity which create confusion to the
user. First record is the nearest identity of the user click location. So, first record is the best
identity information.
17
Fig 3.6: Identity
3.2.5
Reset Map Viewer:
Erase Control
User can reset whole map control by clicking this button. All the layer and legend will be erasing and
user will get fresher one of the map viewer.
3.2.6
Map Attribute table viewer:
Attribute Table Viewer
a. Select desire layer as an active layer from the active layer list.
b. Click Attribute viewer button.
c. Then new Pop will be opened.
b. User will get the attribute table information in tabular data format.
18
Fig 3.7: Attributes Table Viewer
Notes: Some Web browse can block the popup window. Then user will not get any popup window.
User will have done some extra work to view the popup. Bestow user will get the way to unblock the
popup for different browser.
Internet Explorer:
Click Tools=>Popup blocker=>Turn off Popup blocker
Mozila Firefox:
a. Click Tools=>Option
b. Select content Tap
c. Unchecked Popup Blocker
d. Click Ok Button
Opera:
a.
b.
c.
d.
Click Tools=>preferences
Select General Tab(Default Selected)
Choose Open All POP-Ups from Pop-Ups Combo.
Click Ok Button
19
3.2.7
Map printing:
Map Printing Control
a. Click the Map print button
b. Print preview window will be appeared.
Fig 3.8: Map Print Preview
c. Click print button of the new print preview window.
d. Then printing dialog box will be appeared. Select the Printer and commit the
printing process.
20
Fig: Map Printing
3.2.8
Map Labeling:
a. Select Active layer. Map will be labeling based on selected active layer.
b. Click Add Label.
c. New Label layer will be generated.
Fig 3.9: Map Labeling
21
3.3
Map Legend:
User will get map layer in the right corner of the Map viewer.
Point layers are identifying by the Icon or image. Line and
Polygon are identified by the different color. Legend helps
user for better understanding the map.
22
3.4
Managing Map Layers:
All added layer are arrange in the layer list. Newly added layer are in
the below of the list. So, last layer is the topmost layer of the map. If
add new layer, it will placed in the below of the list but it determine the
top most when the map is rendered.
There is check mark with every layer left end. User can checked or
uncheck the layer. Check Mark mean Layer visibility is true that will
be rendered and unchecked mean a specific layer visibility is false that
will be not rendered.
Fig 3.10: Map Layers
3.5
Add New Layer
User can add new layer in the map viewer any time from predefined Layer list. The newly added
layer will be top layer and it will be placed below of the layers list. Users have to follow below
steps to add new layer,
a. Click Add New Layer Link from left side navigator.
b. User will get predefined layer list. Select a layer from the list.
c. New layer will be added the viewer.
23
Chapter 4: Tabular Data Viewer
Tabular data viewer used view general data, data selection, Chart generation and exporting data. User
can generate simple select Query usning Query generation tools. User can generate chart using the
generated data and can export data to different format.
4.1
Getting Tabular Data
User can get tabular data following below steps
a. Click Data Explorer
b. Click tabular viewer
c. Expand Data>Salt Bed>Salt Bed Report (Sample Data).
d. Click Salt Bed Report
e. Data are displayed in the right display area of the window.
Fiqure 4.1: Tabular Data
4.2
Generating Chart
Chart control interacts with the user and generate chart depenign user query. Using add, remove
button user select graph X-axis and Y-Axis Value. X-axis requires only single input. User can select
multiple values for Y-axis. Y-axis support only number value i.e interger, double. Multiple selection
of Y-axis value generate multiple series in the graph which are idendified by differe color and legent.
24
Figure 4.2: Chart Generation
4.3
Select Query
Select Quey tool used generate simple select query. User can generate any kind of selection query
using GUI tools. Its have two section selection and criteria. User select field from the left side field
list and add it to Query selection. User can select all fields by clicking Add all and can remove all
fields by Clicking remove all. In criteria section user set criteria. There are collections of nice GUI
tools which can be to set criteria.First User select field from left side field list. The the values of the
corresponding field are added the value list and critera text box. Then user an operator and assign
query value by selecting from value fied or simply writing in the criteria text area. User can add
multiple criteria using and, or, not oprator. When user click Calculation button, Sql is generated and
executed.
Figure 4.3: Select Query Interface
25
User can generate Graph using output data and can also export this data in different format.
Fiqure 4.4: Select Query Output
4.4
Exporting Data
User can export Data using Exporting tools. The system incorporates light but very useful data
exporting tools. Data can be export in three different types i.e. Ms Excel format, Ms Word Format and
plain HTML page. The user must have enough exporting privilege to export secure data.
Figure 4.5: Exporting
A new pop up will be opened. If user is unable to see the new window, make sure that the browser
pop up blocker is disabled.
26
Figure 4.5: Exporting Type
a. Select a output file format from the “Export Type”
b. Click Export File
Figure 4.6: Exporting file saving
c. click Save
27
Figure 4.7: Save File to the Local disk
Notes: Some Web browsers are automatically block popup. In this case user may not view any popup
menu. So in order to view popup User has to unblock automatic popup.
Internet Explorer:
Click Tools=>Popup blocker=>Turn off Popup blocker
Mozila Firefox:
a. Click Tools=>Option
b. Select content Tap
c. Unchecked Popup Blocker
d. Click Ok Button
Opera:
a.
b.
c.
d.
Click Tools=>preferences
Select General Tab(Default Selected)
Choose Open All POP-Ups from Pop-Ups Combo.
Click Ok Button
28
29
Chapter 5: Data Analysis
5.1
Advance Analysis
User can prepared data based on user custom query using this tools. User cans analysis only
tabular data using these tools. User also can generate graph and data of the user query outcome.
We use yearly Salt Bed Report for demonstration the Advance Query Tools.
User should follows be
a. Navigate Data> Salt Bed> Salt Bed Report from Database Explorer.
b. Click Advance Analysis Button
c. Advance Analysis window will be displayed
Figure 4.1: Advance Analysis Tools
This tool is generated standard SQL. Top interface is used to generate SQL Aggregate and
bottom interface is used to developed SQL criteria selection. Aggregation function is applied
to selected value field and make group by based on selected group by fields. Aggregation
function applied only value field, User should be careful about the value field selection to
avoid any kind of exception.
30
Figure 4.2: Aggregate with criteria
User can set any criteria using GUI tools. Fist user has to select a criteria field from the left
field list. Then corresponding field values are populated in Field Value List. User can create
custom expression by clicking provided operation Button. User also can edit the generated
expression.
Figure 4.3: Query Output
31
Figure 4.4: Creating Chart with resulted data
32
Chapter 6: Mapping
GSIIS incorporates some complete Map. GIS Map contains multiple layers. When user clicks on
specific Map GSIIS system laod predefined layer in specific order. Layers and its order of the Map
are predefined, user can only add new layer the Viewer.
6.1
Getting Map
User has to do following steps to get Mapping in the GSIIS
a. Click Mapping in the Main Menu
b. User will get the Mapping Window. Left navigator of the Mapping list.
Fiqure 5.1: Mapping Interface
6.2
Display Map
User has to click any map from the left navigator to display the Map. Map viewer Load multiple
predefined layer at time. User will get comple map combining set of layer with corresponding legents.
33
Fiqure 5.2: Display Map in the Map Viewer
6.3
Adding New Layer
User can add new layer the any Map. User should follow the below steps to add new layer.
a. Click Add New Layer
b. User will get layer list
c. Click desire Layer
d. New layer will be added to Map viewer as top most layer.
Figure 5.3: Add new layer to the Map Viewer
34
Chapter 7
Documents and reports
Documents and reports module generate report on the based on predefined query. System use web
based crystal report tool which is very nice tools to print, exporting, and presenting reports.
7.1
Get reporting Tools
To get get reporting tools do the following steps,
Printed Reports
a. click Printed Report in the main menu
b. user will get report window
c. left side list box content different reports
Figure 7.1: Reporting window
7.2
Using tools
Selecting any report from left side navigator click show reports Button. User will get the generated
report from right side of the window.
35
7.2.1
Printing
Printing
Figure 7.2: Printing
Click print icon of the report tools bar. Then printing dialog box will appear.
7.2.2
Find/search
Find
Figure 7.3: Search in the report
Write find keyword in the find input box and press find icon
7.2.3
Exporting
Click export Icon in the report tool bar. Exporting window will be appears. Now user has to select file
format from the format list. User can print custom nuber of page by selecting pages option.
36
Exporting
Fiquer 7.4: Exporting Report
Notes: Web based reporting is little bit slower. So after clicking Show report system my take long
time to view the report out put.
37
Chapter 8: Visualization
User will get a of lots image of Salt Bed, Salt Industry, Wholesaler, and Industrial Packing. Images
are categories in four Main Groups, these are
a. Salt Bed: Image of Various Salt Bed(Ghear)
b. Salt Industry : Images of Salt Industry
c. Wholesaler: Images of Salt Wholesaler all over the country
d. Industrial Packing: Cover page images of the Industrial Salt
Fig 8.1: Visualization
8.1
Getting Visualization Home
Visualization
User can get the visualization home page from two links,
a. Main Menu
b. Left Minor Links of the Home Page
38
8.2
Salt Bed Images
Users have to done following steps to view the Salt Bed Image.
a. Select Salt Center Location from Salt center Selection List
b. Select Upazilla from Upazilla List
c. Select Union from Union List
d. Then Ghuna Name list of corresponding Union will be appeared. Click desire Ghuna
Name
e. Image of corresponding ghuna will be viewed in the right panel.
Fig 8.2: Salt Bed
8.3
Industrial Images
Industrial Images are organized by Zone wise. Users have to select Zone name form zone list,
then Industry Name list of corresponding zone are displayed. User need to click desire
Industry name to view the images.
39
Fig 8.3: Industrial Image
8.4
Wholesaler Images
User should do the following to view the Wholesaler Images
a. Select District Name from District list
b. Wholesaler list of corresponding district will be displayed
c. Click desire wholesaler name, Images will be viewed in the right panel.
Fig 8.4: Wholesaler Image
40
8.5
Industrial Packing
User should follow the bellows steps,
a. Select Zone Name from Zone List.
b. Corresponding Industrial Salt name will be viewed.
c. Click desire Industrial Salt name, Images of that salt will be displayed in the right panel.
Fig 8.5: Industrial Packing image
41
Chapter 9: Map Print
User can print Image format map easily. Maps are formatted in A4 size paper. Map Images are not
high resolution, so the qualities of the printed map may not be high quality Map.
User should follow bellows steps to print Map,
a. Expand Map Index Tree(Default Expanded)
b. Click Desire Map from Left Navigator
Fig 8.1: Print Map
c. Map Image will be displayed in the right panel.
d. Click Print Map Button
e. New window will be appeared with printer friendly version of the Map
42
Fig 8.2: Print Preview
f. Click Print Button
g. Printing dialog box will be viewed. Select the printer and commit the printing procedures.
Fig 8.3: Printing Dialog box
43


![[1]Oracle® DIVAdirector](http://vs1.manualzilla.com/store/data/005731358_1-211e3778ae12716a403cbbeaab90ad2a-150x150.png)