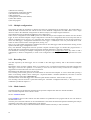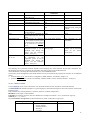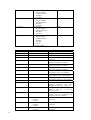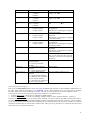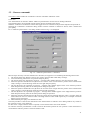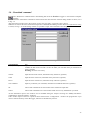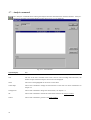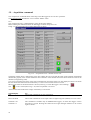
1
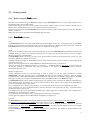
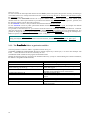
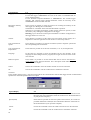
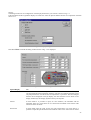
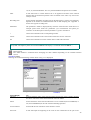
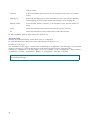
The Race Studio Software manual Configuration for Drack 1 AIM s.r.l. reserves the right to make changes in the content of this manual without obligation to notify any person of such changes. AIM s.r.l. shall not be liable for any errors contained herein or for incidental or consequential damages in connection with the furnishing, performance or use of all the parts (hardware, software and manuals). Revision code: 1649-10001-0100. Microsoft, Windows 95, Windows 98 and Windows 2000 are registered trademarks of Microsoft Corporation. 2 Table of Contents TABLE OF CONTENTS..................................................................................................................................................3 INTRODUCTION.............................................................................................................................................................5 WHAT IS THE RACE STUDIO? ..........................................................................................................................................5 WHAT YOU CAN FIND IN THIS MANUAL ............................................................................................................................5 CHAPTER 1 - DATA ACQUISITION CONCEPTS.....................................................................................................6 1.1 – ANALOGUE AND DIGITAL SIGNALS ..........................................................................................................................6 1.2 – CALIBRATION..........................................................................................................................................................6 1.3 – SAMPLING RATE ......................................................................................................................................................6 1.4 – DATA DOWNLOAD ...................................................................................................................................................7 CHAPTER 2 – SOFTWARE: GENERAL DESCRIPTION.........................................................................................8 2.1 – INTRODUCTION .......................................................................................................................................................8 2.1.1 - Notational Conventions ..................................................................................................................................8 2.2 – GETTING STARTED ..................................................................................................................................................9 2.2.1 – Before using the Drack system........................................................................................................................9 2.2.2 – Race Studio concepts .......................................................................................................................................9 Tests........................................................................................................................................................................................... 9 Track.......................................................................................................................................................................................... 9 Multiple configurations.............................................................................................................................................................. 9 Channels .................................................................................................................................................................................... 9 Reference speed ....................................................................................................................................................................... 10 2.2.3 - The Race Studio folders organisation and files.............................................................................................10 2.2.4 – Run the program ..........................................................................................................................................11 2.2.5 – Drack device selection ...................................................................................................................................11 2.2.6 – Language selection.......................................................................................................................................11 2.2.7 – Vehicle selection ...........................................................................................................................................12 2.3 FUNCTIONALITY.......................................................................................................................................................13 2.3.1 – Main window ................................................................................................................................................13 2.3.2 – Multiple configurations................................................................................................................................14 2.3.3 – Recording data .............................................................................................................................................14 2.3.4 – Math channels ..............................................................................................................................................14 2.3.4.1 – Standard version ..................................................................................................................................................... 14 2.3.4.2 – Advanced version .................................................................................................................................................... 15 Using math formula interpreter........................................................................................................................................... 17 2.4 SENSORS AND SOFTWARE.........................................................................................................................................19 Potentiometers ......................................................................................................................................................................... 20 2.5 CHANNELS AND SAMPLING RATES............................................................................................................................21 CHAPTER 3 – SOFTWARE: MAIN COMMANDS...................................................................................................22 3.1 – INTRODUCTION .....................................................................................................................................................22 3.2 – FILE COMMANDS ...................................................................................................................................................22 Backup test .............................................................................................................................................................................. 22 Restore test .............................................................................................................................................................................. 22 Delete test ................................................................................................................................................................................ 22 Exit .......................................................................................................................................................................................... 22 3.3 – TRACK COMMANDS ...............................................................................................................................................23 New.......................................................................................................................................................................................... 23 Selection... ............................................................................................................................................................................... 23 Modify... .................................................................................................................................................................................. 24 Delete…................................................................................................................................................................................... 24 3.4 – CONFIGURATION COMMANDS ...............................................................................................................................25 New.......................................................................................................................................................................................... 25 Load…..................................................................................................................................................................................... 25 Copy ........................................................................................................................................................................................ 25 Delete....................................................................................................................................................................................... 25 General .................................................................................................................................................................................... 25 3 Serial line................................................................................................................................................................................. 26 Display..................................................................................................................................................................................... 27 Beacon ..................................................................................................................................................................................... 28 Input channels.......................................................................................................................................................................... 28 Math channels.......................................................................................................................................................................... 29 Standard version.................................................................................................................................................................. 29 Advanced version ................................................................................................................................................................ 30 Transmission to the logger....................................................................................................................................................... 30 3.5 – SENSORS COMMANDS ............................................................................................................................................31 Calibration ............................................................................................................................................................................... 31 Automatic calibration .............................................................................................................................................................. 32 3.6 – DOWNLOAD COMMAND.........................................................................................................................................33 3.7 – ANALYSIS COMMAND............................................................................................................................................34 3.8 – CHECK LIST COMMAND .........................................................................................................................................35 3.9 – ACQUISITION COMMANDS .....................................................................................................................................36 View ........................................................................................................................................................................................ 36 Memo....................................................................................................................................................................................... 37 3.10 – HELP COMMANDS................................................................................................................................................38 Manual..................................................................................................................................................................................... 38 About Race Studio…............................................................................................................................................................... 38 CHAPTER 4 – TROUBLESHOOTING .......................................................................................................................39 4.1 - Data logger does not reply during serial communication...............................................................................39 On line operations.................................................................................................................................................................... 39 Download operation................................................................................................................................................................. 39 4.2 - The data logger did not record data ................................................................................................................39 APPENDIX A ..................................................................................................................................................................40 4 Introduction What is the Race Studio? The Race Studio software is able to communicate with all the Aim data loggers and to analyse the data recorded by them. This manual gives you all the information necessary to use the Race Studio with the data loggers of the Drack family. The Race Studio exists in two different versions: Standard and Advanced (for more information about the differences between the versions see the “Installation manual”); this manual is designed for both the Standard and the Advanced versions of the software. The Drack system has two main functions: • it records data collected by the data logger mounted on your vehicle, • it provides the means to display and analyse the recorded data. A PC program (Race Studio) allows the user to see and print the data in a lot of different ways, to configure the data logger and to calibrate the sensors. These figures are performed joining the hardware performances and the software functions. What you can find in this manual Here in the manual you can find a full description of the functions necessary to configure the software and the Drack data loggers and to communicate with the data loggers. More in details: Chapter 1 gives some general data acquisition concepts for an easier understanding of the Drack system. Chapter 2 gives a general description of the main functionality of the Race Studio software. Chapter 3 describes all the general functions for the hardware management provided by the Race Studio software. Chapter 4 explains how to solve the most common troubles concerning the utilisation of the Drack system. 5 Chapter 1 - Data acquisition concepts 1.1 – Analogue and digital signals The measurement of a physical quantity, such as the speed of a car or the temperature of the exhaust gas is at the same time a very simple and a very complex operation. The first element necessary to the measurement is the sensor; it is a device that transforms a physical quantity in an electrical signal. An electrical signal may change between two fixed values or it may assume any value in a fixed range, moreover it can be defined in a continuous time interval or in discrete time. When a signal is defined in discrete time interval and can assume any value in a fixed range it is named analogue. When a signal is defined for finite time intervals and can assume only fixed values it is named digital. A data logger records and a Personal Computer elaborates only signals in a numerical (or digital) form, for this reason it is necessary to convert all the signals in a digital form. The data logger makes the conversion. The sensors used for the measure of the number of engine revolutions and wheel speed provide an output signal assuming only fixed values and it is defined for a continuous time interval. The data logger converts these signals in a digital form counting the impulses generated by the sensors. All the other sensors, like potentiometers and thermocouples, have analogue outputs. The data logger again performs the analog-to-digital conversion. 1.2 – Calibration The relationship between the physical quantity and the electrical output of the sensor is a necessary parameter to be known for the data acquisition system. It may be linear, the output increases or decreases in the same way of the input, or non-linear, the output varies in a different way of the input. For example the potentiometers have a linear characteristic on the contrary the thermocouples have a non-linear one. The Race Studio software performs the transformation from the number obtained from the analog-to-digital conversion to the engineering unit, like bar or °C. For some sensors the program already have all the information for the transformation, for example thermocouples. For some others, which depend on the mounting conditions, it is necessary to give their resting (or zero) position (Automatic calibration). At last few sensors need a full calibration, two or more positions are necessary. For a description of the calibration functions of the Race Studio refer to the chapter 3.5. 1.3 – Sampling rate The sampling rate is the data acquisition system’s recording frequency. Although the output from the sensors changes continuously and instantaneously, the data acquisition system records data at prefixed time intervals. The sampling rate is expressed in Hertz (Hz = 1/sec). For example if you have a sampling rate of 10 Hertz, it means that the input is red ten times in a second and the time between any two successive readings is 0.1 second. For a correct representation of a physical phenomenon, like the travel of a suspension, it is very important to read the output of the sensor a number of times sufficient to have no lost of information about the phenomenon itself. So it is very important to select the right sampling rate. Two factors influence the choice of the sampling rate. They are the frequency of the signal from sensor and the total recording time of the data logger. These factors are joined: in fact the number of channels recorded and the sampling rate selected for each channel determine the total recording time of the data acquisition system. More channels you record and/or higher sampling rates you select less recording time you have. 6 1.4 – Data download The recorded measures are stored inside the non-volatile data logger memory. In order to see or to modify the recorded data they have to be downloaded on the Personal Computer. A serial communication is necessary to perform the download operation. The higher is the communication speed (named baud rate) the shorter is the download time. The unit that is used is baud; typical values are 38400 or 115200. The baud rate depends on the Personal Computer hardware. After the download operation has been performed the data are available for any graphical representation, for any modification and calculation you like. In short it is possible to analyse data (for a full description of the analysis functions refer to the “Software manual - Analysis”). 7 Chapter 2 – Software: general description 2.1 – Introduction Here we assume you have a good knowledge of the use of your Personal Computer and of the Microsoft Windows 95, Windows 98 or Windows 2000 operating systems. The manual has been written referencing to the Windows 95 operating system. 2.1.1 - Notational Conventions This manual uses the following notations: Example of convention “Configuration-Load…” Description of convention Quotation marks enclose menu item in the program. [OK] Brackets enclose buttons you find in the program or keys. CHANNELS.CFG Italic capital letters are used for file names. File menu Underlined letters are used for menu name. Track selection Underlined italic letters are used for operations or windows titles. Advanced Blue bold letters are used for the names of the software versions. 8 2.2 – Getting started 2.2.1 – Before using the Drack system The time invested before using the Drack data logger and the Race Studio software for the first time produces more accurate data and a more reliable system. Install the data logger, the sensors and the cables on the vehicle and the software on your Personal Computer well in advance of the departure to the track, in case problems arise they can be solved. Learn the analysis section of the Race Studio software with the examples given with the program (see also the “Software manual – Analysis”). Make a few trial runs of recording and downloading data in the shop. 2.2.2 – Race Studio concepts Tests The Race Studio software stores data downloaded from the data logger in files, they are defined by the program tests. The user at the end of the download operation gives the name of the tests. Changing the name of the tests outside the Race Studio software may cause the tests to be no more recognised by the program. Track The tests are recorded into directories created and named by the user; the Race Studio software defines these directories as tracks. When you create a new track the best thing to do is to name it as the real track where you are, for example: Monza, Laguna Seca or Brands Hatch. The Race Studio software has always an active track, shown inside the status bar of the application, see Fig. 2.3. The status bar is placed at the bottom of the screen. The data from the data logger is downloaded inside the active track; moreover the test to analyse is selected among the ones in the active track. The first time the program runs the track FORMULE, installed during the setup, is made active. The track creation can be fulfilled selecting the “Track-New…” command from the main menu or the first time the “Download” operation is performed, every time the program is run. When a new track is created it becomes automatically the active one. Multiple configurations All the information necessary to the data logger to work is stored in a file; the whole information is named configuration. The setup program copies, for the Drack, four files into the installation directory. They are named: CHANNELS.CFG, MINI.CFG, GOLD.CFG and EXPERT.CFG. The first file is the default configuration for the Drack data logger the others are examples of configuration files for the different models of the Drack data logger. The Race Studio software allows multiple configurations; it is possible to have more than one different configuration to send to the data logger. For instance, it is useful for teams with more than a vehicle or for a single vehicle with different sensors for testing the engine or the chassis. Every configuration has a name, typed by the user; it is also the name of the file where the configuration is stored. At any time there is an active configuration that is shown in status bar of the application see Fig. 2.2. The status bar is placed at the bottom of the screen. The configurations may be also provided for different types of data logger for this reason when a new configuration is created the type of the data logger is asked. The program allows to modify, to create, to delete and to set the active configuration. The first time the program runs the CHANNELS configuration is made active. Channels The Race Studio software allows analysing two different kinds of measures: Input channels and Math channels. The data logger acquires the Input channels (for example speed or oil pressure). For the Advanced version the user defines the Math channels and the program calculates them on the Personal Computer using the Input channels or the Math channels themselves (examples of math channels are linear acceleration or gear number). For the Standard version the Math channels are predefined (for example the gear number is already defined in the program). 9 Reference speed For tests on track the most important measure for the Drack system is the speed. The speed is necessary for starting to record data and for a lot of analysis functions like the creation of the map, the plot vs. distance, the calculation of splits, the simulation an so on. For the analysis the Race Studio software has a special channel named Reference speed used as the official speed channel of the test. Three input channels are provided to become the Reference speed, they are speed #1, speed #2, and the analogue channel with the Pitot tube connected. For the Standard version it is also provided a math channel named Calculated speed. For the Advanced version any other speed math channel can become the Reference speed, for example the medium between speed #1 and speed #2 values. It is possible to select the Reference speed channel from the main menu inside the “Configuration-General” command. After the selection the selected channel becomes the official reference speed channel for next downloaded tests. It is possible to change the reference speed channel for the loaded test in the Analysis menu running the “Modify-TestsReference speed” command (see the “Software manual – Analysis”). WARNING. If the Reference speed is not selected or the values of the Reference speed channel are always zero during the analysis there is not visualisation referred to distance, for example Plot vs. distance or Split report. 2.2.3 - The Race Studio folders organisation and files The set-up software creates the folders’ organisation shown in Fig. 2.1. The BIKE, FORMULE and KARTING directories include respectively a motorcycle, a car and a kart example. The track1 … trackn directories are the ones created by the user. The Manuals folder includes all the program documentation files. Besides the following files are copied into the installation directory (it may be selected during the software installation, the default is \Programs\Aim\RaceStudio). Name Race Studio.exe Race Studio.ini Channels.cfg, Mini.cfg, Gold.cfg, MyChronPro.cfg, Mychron.cfg MathAd.ini or MathStd.ini EnglishUI.dll, ItalianUI.dll Readme.txt Pdf.ocx Mfc42.dll Files with the “pdf” extension 10 Description Executable file: the application. Initialisation file: it configures the application. Expert.cfg, Initialisation files: they configure the acquisition parameters for the data loggers. Initialisation files: they configure the math channels, depending on the installed version of the software. Language localisation files. Text file: short description of differences from previous version. ActiveX file for the manuals’ visualisation. Library file for the application. Documentation files: the manuals of the program in the MANUALS folder. Fig. 2.1 – Directories organisation 2.2.4 – Run the program Run the program with a double click of the left button of the mouse over the shortcut to the Race Studio software on the desktop of your computer, the shortcut has been created by the installation program. Otherwise run it from the Programs menu into the Start menu. 2.2.5 – Drack device selection When you run the program first of all make sure that the selected device is the Drack. The name of the selected device is written in red colour, the others are black coloured, in the main window (for a description of the main window refers to chapter 2.3.1). For the selection of the Drack device click over the name with the left button of the mouse or move the cursor with the arrow keys and when it is over the Drack button press the [Enter] key. 2.2.6 – Language selection The Race Studio software allows selecting the language of the user interface. When the program is run for the first time it loads automatically the language set on your computer, if the language is not provided the English is loaded. If you want to change the language of your computer run “Control panelInternational settings” and refer to the Windows user manual. It is possible to change the selected language, from the main menu of the software choose the “Configuration-General” command and then select the desired language, the program shows the allowed ones. If the selection has been changed for its activation it is necessary to exit the program and run it again. 11 2.2.7 – Vehicle selection When the Race Studio program is run for the first time it is necessary to select the type of the vehicle mounting the data logger. Run the “Configuration.General” command and then select the vehicle (the selectable values are two wheels and four wheels). The vehicle selection is a very important operation to do because a wrong selected vehicle disables you from calculating the map of the track. 12 2.3 Functionality The Race Studio software includes all the functions for the configuration and communication with the data logger. This chapter gives a description of all the main functions provided by the software. Before to start describing the program functionality it is necessary to outline the first window shown when the software is run: it is the main window. 2.3.1 – Main window The main window is the first window shown when the program is run. In Fig. 2.2 the default main window for a video resolution bigger than 800x600 is displayed. Fig. 2.2 – Main window The most important areas in the window are: (1) – The menu includes the main commands of the program. (2) – The toolbar of the window includes some shortcuts to the most important functions. (3) – The name of the active Track shown on the status bar. (4) – The name of the active Configuration shown on the status bar. (5) – The three “big” buttons for the selection of the connected device, in Fig. 2.2 the Drack is the selected device. The main toolbar includes nine buttons for some of the most used commands of the main menu. Starting from the left they run the following commands: 1) Backup of tests and maps on floppy disk, 2) Restore tests and maps from floppy disk, 13 3) Delete tests and maps, 4) Configuration of the input channels, 5) Download from the data logger, 6) Run the analysis, 7) Configuration of the math channels, 8) Show this manual, 9) Exit the program. 2.3.2 – Multiple configurations The program provides the possibility to manage more than one configuration for the data logger. This functionality is useful for teams with more than one vehicle in order to have different configurations for each vehicle or for a single vehicle in order to have different configurations for distinct analysis, for example engine and chassis. The configurations may be defined for different types of data loggers. There are two configurations in the Drack system: one loaded on the personal computer and another one into the data logger. If on the Personal Computer a single configuration is used the two configurations have to be always the same. If multiple configurations are used it is very important that, when the loaded configuration on the personal computer is sent to the data logger, “Configuration-Transmission to the logger ” command, it is the one you would like to send. Check its name on the status bar of the application (see Fig. 2.2). Don’t worry if the loaded configuration is different from the one into data logger when the download is running, for this operation the data logger configuration is used. Every time different configurations between personal computer and data logger are checked the program shows a message and does not perform the operation selected for example calibration or automatic calibration. The commands concerning the multiple configurations are grouped in the Configuration menu, they allow to load a configuration, to delete a configuration, to create a new configuration and to copy the loaded configuration into a new one. 2.3.3 – Recording data The data acquired by the data logger can be recorded on the data logger memory and on the Personal Computer memory. Record data on the personal computer when it is possible to have a continuous link between Personal Computer and data logger, in fact for this operation it is necessary to have the two devices always connected. For example it is suggested to use this solution for tests with a dyno bench. Record data in the data logger always on the track. Two recording criterions are given for the memorisation on the Personal Computer. It can be started both pressing a button in the dialog window shown running the “Acquisition-Memo” command (MANUAL) and when a selected channel reaches a fixed value (THRESHOLD). The memorisation on the data logger starts when the speed channel reaches the 10 km/h value (6.2 mph). The recording criterion selection is performed running the command “Configuration-General”, a description of this command is provided in chapter 3.4. 2.3.4 – Math channels The math channels are the channels calculated by the personal computer after data have been downloaded. Their calculation depends on the software version. 2.3.4.1 – Standard version In the Standard version of the software the math channels are predefined in the program and the user can decide to calculate them or not. The most part of the math channels can be calculated both at the end of the download operation and during the analysis of the data; some others can be calculated only in the analysis. Table 1 shows the list of the provided math channels and the channels necessary to their calculation. 14 Name Description Linear Acceleration Wheel Power Slip Factor Angle Gear no. Channels necessary to the calculation The vehicle acceleration in the Reference speed. motion direction The available engine power. Reference speed. The ratio between the reference Reference speed and engine speed and the engine rpm. rpm. The inclinations angle of bike. Gyro and vertical acceleration. The gear. Reference speed and the engine rpm. Distance For every lap is calculated the Reference speed. travelled distance. Time For every lap is calculated the None. elapsed time from the start of the lap Calculated speed The maximum, the minimum Two speeds input channels. or the average between Speed #1 and Speed #2. This channel can be selected as reference speed. Kus A representation of Speed, lateral acceleration and understeer/oversteer. It can be steering angle. calculated only during the analysis (see the “Software manual – Analysis”). Suspension speed #1, Four derivative channels for Suspension travels channel. #2, #3, #4 the calculation of the suspensions speed. It can be calculated only during the analysis (see the “Software manual – Analysis”). Table 1: the math channels for the Standard version. Parameters None. Vehicle weight. None. None. The maximum and minimum really used gear number. None. None. The algorithm for the calculation The wheel base of the vehicle and the threshold value for the lateral acceleration. None. The sampling rate of the math channels depends on the sampling rate of the channels used for their calculation. It is automatically fixed by the program at the maximum value among those of the needed channels. All the definitions concerning the math channels are in the MATHSTD.INI file. The function for the management of the math channels can be accessed from the program user interface in two different places: • From the Main menu, with the item “Configuration–Math channels”, described in chapter 3.4. • From the Analysis menu, with the item “Modify–Channels–Math” (see the “Software manual – Analysis”). 2.3.4.2 – Advanced version In the Advanced version of the software the user inputs the formula for the calculation of the math channels. The Race Studio math formula interpreter is a general-purpose, full-featured interpreter that works with the natural math language syntax. Every formula may include identifiers, constants, functions, symbols and operators. Identifiers are the input or math channels. Constants are symbolic constants value user defined. For example ACCGRAV = 9.81, acceleration of gravity. Symbols are “,”, “(“ and “)”. Provided functions and operators are described below in Table 2 and Table 3 respectively. + Operator (sum) Parameters A,B could be - Integer numbers - Decimal numbers - Identifiers - Constants Result A+B 15 - (subtraction) * (product) / (division) ^ (integer power) Function Sqrt(p1) Exp(p1) Log(p1) Ln(p1) Argument(s) p1 = channel identifier p1 = channel identifier p1 = channel identifier p1 = channel identifier Sin(p1) p1 = channel identifier Cos(p1) p1 = channel identifier Tan(p1) p1 = channel identifier Asin(p1) p1 = channel identifier Acos(p1) p1 = channel identifier Atan(p1) p1 = channel identifier Abs(p1) Deriv(p1) p1 = channel identifier p1 = channel identifier Integ(p1) p1 = channel identifier Lap_integ(p1) p1 = channel identifier Min(p1, p2) p1,p2 = channel identifier = constant = number p1,p2 = channel identifier = constant = number p1,p2 = channel identifier = constant Med(p1, p2) Max(p1, p2) 16 A-B A,B could be - Integer numbers - Decimal numbers - Identifiers - Constants A*B A,B could be - Integer numbers - Decimal numbers - Identifiers - Constants A/B A,B could be - Integer numbers - Decimal numbers - Identifiers - Constants A^B A could be - Integer number - Decimal number - Identifier - Constant B must be - integer number Table 2: math formula interpreter operators’ table Result The square root of the argument The exponential of the argument The base 10 logarithm of the argument The natural logarithm (base e) of the argument The trigonometric sine of the argument (argument in radians) The trigonometric cosine of the argument (argument in radians) The trigonometric tangent of the argument (argument in radians) The arc, in radians, whose trigonometric sine is the argument The arc, in radians, whose trigonometric cosine is the argument The arc, in radians, whose trigonometric tangent is the argument The absolute value of the argument The first derivative function of the argument function over time, computed as (F(t0 + dt) – F(t0)) / dt The integral function of the argument function, with t0 = 0 as start integration point The integral function of the argument function, with t0 = startlap as start integration point for each lap The minimum value between the arguments The mean arguments value between the The maximum value between the arguments High_pass(p1,p2) Low_pass(p1, p2) Band_pass(p1, p2, p3) Bit_and(p1, p2) = number = channel identifier = constant = number p1 = channel identifier p2 = constant = number p1 = channel identifier p2,p3 = constant = number p1 = raw channel identifier p2 = integer constant = integer number p1 p2 Bit_or(p1, p2) p1 p2 = raw channel identifier = integer constant = integer number Bit_xor(p1, p2) p1 p2 = raw channel identifier = integer constant = integer number Bit_not(p1) p1 = raw channel identifier Time() If p1(t) >= p2 ! p1(t) If p1(t) < p2 ! 0 If p1(t) <= p2 ! p1(t) If p1(t) > p2 ! 0 If p2 <= p1(t) <= p3 ! p1(t) Else !0 The logical AND operation between the arguments The function is meaningless if applied to decimal numbers The logical OR operation between the arguments The function is meaningless if applied to decimal numbers The logical XOR operation between the arguments The function is meaningless if applied to decimal numbers The logical NOT operation of the arguments The function is meaningless if applied to decimal numbers It builds a function whose value for each t is the actual lap time, the time calculation is started at the beginning of each lap. The bike inclination angle (degrees) Bike_angle(p1, p2) p1 = Vertical acceleration channel identifier p2 = Gyroscope channel identifier The slip factor Slip(p1,p2) p1 = Engine RPM channel identifier p2 = Speed channel identifier The gear number (from p3 to p4) Gear(p1, p2, p3, p1 = Engine RPM channel p4) identifier p2 = Speed channel identifier p3 = minimum gear used along the track (integer number) p4 = maximum gear used along the track (integer number) Table 3: math formula interpreter functions table Using math formula interpreter First of all, the Race Studio software comes with some predefined math channels we had included as default (they are the same math channels hard-coded in the Standard version). These channels have been expressed as standard formulae, and they are totally modifiable by the user. You can use these channels to see how the interpreter works. The interpreter can be accessed from the program user interface in two different places: • From the Main menu, with the item “Configuration–Math channels”. • From the Analysis menu, with the item “Modify–Channels–Math” (see the “Software manual – Analysis”). From the Configuration Menu you can define all the formulae you need to analyse your data, keeping them ready to use. The “Status field” allows you to Enable/Disable automatic calculation of the channel: you have to choose “Enable” if you want the channel to be automatically computed when you download the test. If you choose “Disable”, the channel will not be computed, but you will be able to enable it later, when you will go in analysis on a particular test (the second place where you can enter the interpreter). 17 When you enter the interpreter the software will present you the dialog window shown in Fig. 2.3. Fig. 2.3 – Math channels for the Advanced version In the left top window you can find the math channels already defined. When you click over a math channel you can see its properties in the “Channel Parameters” pane, and its associated formula in the “Formula” pane. With the button [Insert] and [Delete] you can insert or delete channels; if you need to modify a channel you simply select it and change the parameters and/or the formula (the channel parameters have the same meaning of the parameters of the input channels configuration). To change the formula you can either edit manually the string, or use the four panes “Constants”, “Identifiers”, “Symbols & Operators” and “Functions” to build-up automatically the formula. If you double-click on an item of these four panes, the corresponding item is automatically copied in the formula pane. After finishing to define the formula you should use the button [Formula Check] to check if the formula string has been interpreted correctly. You can find the result of the elaboration in the grey line below the formula string. If there is something wrong you can see the offending item highlighted in the formula string (try to misspell some identifiers to see how it works). The meaning of the interpreter panes is: Constants: the user can define some symbolic constant that loads some common number (such as the acceleration of gravity, or the mass of the vehicle) to be used in the formulae. With the button [Define Constants] you can add, delete and modify the constants. Obviously, in the formulae you can enter either the symbolic constant (ACCGRAV) or the number (9.81) to get the same result. Identifiers: the identifiers are the names of input and math channels already defined by the user. These are the only channels the interpreter can use to compute the new math channel. If a name is misspelt the interpreter warns you. Symbols & Operators: this pane contains the five formula operators (+ - * / ^), the comma used as function parameters separator, and the brackets used to define the precedence of operator and functions. Functions: this pane contains the list of functions supported by the interpreter. It’s strongly recommended using this pane to insert functions in the formulae because this way the software automatically inserts also the brackets and the commas needed, indicating also the number of parameters that each function uses. All the definitions concerning the interpreter are in the MATHAD.INI file. 18 2.4 Sensors and software Because the output of a sensor can be displayed on the screen of the Personal Computer it is necessary for the program to know the sensor characteristics The provided sensors are described in Table 4. Warning, if the program does not provide a sensor it is not possible to connect it to the data logger, unless its characteristic is linear. Name Engine RPM Input type RPM Calibration Parameters Notes NO Multiply factor. For the “maximum value” input a Maximum value (used for value that is about 10% more the covering function). than the maximum rpm value reached by the engine Speed Speed for NO Tyre circumference. Speed #1 or Pulses per revolution. #2 Rotation speed Speed NO Pulses per revolution. Detonation: transducer Speed NO NO It is possible to select this sensor digital output when you have a detonation transducer with a digital output Temperature Analogue NO NO (thermocouple K) Temperature (infrared Analogue NO NO TC) Temperature (NTC Analogue NO NO Weber) VDO temp. 40-120 °C Analogue NO NO (104-248 °F) VDO temp. 50-150 °C Analogue NO NO (122-272 °F) VDO temp. 60-200 °C Analogue NO NO (140-392 °F) Potentiometer distance Analogue Automatic- Sensor full scale value Measurement of travel length Calibration (mm or inches). For suspensions or throttle or brake position Potentiometer to Analogue Calibration NO Measurement of travel length calibrate (mm, inches or percentage). For suspensions or throttle or brake position Mid-zero potentiometer Analogue Calibration NO Measurement of travel angle. For steering position VDO pressure 0-5 bar Analogue NO NO (0-72.5 PSI) VDO pressure 0-10 bar (0-145 PSI) Bosch lambda sensor (1 ST/PC) NGK lambda sensor (TL 7111W1) 0-50 milliVolt linear Analogue NO NO Analogue NO NO Stoichiometric value 1 Analogue NO NO Stoichiometric value 14.57 Analogue NO For custom sensors with linear characteristic and output voltage up to 50 milliVolts. If the sensor is a pressure sensor check the corresponding box. Analogue NO Input in the X0 and X1 fields the output voltage (mV) of two typical points; for instance zero scale and full scale. Input in the Y0 and Y1 fields the corresponding values in engineering units Input in the X0 and X1 0-500 milliVolt linear For custom sensors with linear 19 0-5 Volt linear Analogue NO Pitot tube speed sensor Analogue Water temp. installed (RENAULT) Oil temp. installed (RENAULT) Oil pressure installed (RENAULT) Lateral accelerometer Analogue AutomaticCalibration NO fields the output voltage (mV) of two typical points; for instance zero scale and full scale. Input in the Y0 and Y1 fields the corresponding values in engineering units Input in the X0 and X1 fields the output voltage (V) of two typical points; for instance zero scale and full scale. Input in the Y0 and Y1 fields the corresponding values in engineering units Sensor full scale value Multiply factor NO Analogue NO NO Analogue NO NO Analogueinternal Analoguespecial input Analoguespecial input Automatic- NO Calibration Automatic- NO Calibration Automatic- NO Calibration Table 4 – Sensors Vertical accelerometer Gyro characteristic and output voltage up to 500 milliVolts. If the sensor is a pressure sensor check the corresponding box. For custom sensors with linear characteristic and output voltage up to 5 Volts. If the sensor is a pressure sensor check the corresponding box. The “Multiply factor” depends on the geometry of the tube. Water temperature sensor installed on the Renault engine Oil temperature sensor installed on the Renault engine Oil pressure sensor installed on the Renault engine Some more information may be useful for the usage of the <Potentiometers>. Potentiometers The potentiometers are used for many measurements like suspensions, throttle, brake and steering angle. The Race Studio software provides three different potentiometers: potentiometer distance, potentiometer to calibrate and mid-zero potentiometer. The <Potentiometer distance> is suggested for the suspensions when their travels are parallel to the potentiometer mounting, for example for cars or some kind of motorcycle fork. This sensor requires inputting the full-scale value of the sensor for example 100 mm. Moreover the auto-calibration of the sensor is necessary; for this operation the vehicle has to be in the rest position. The <Potentiometer to calibrate> is suggested for throttle or brake position or for rear suspension of motorcycles. It needs calibration and during this operation it is necessary to input a reference value, for example 100 percentage or 150 millimetres. The <Mid-zero potentiometer> is suggested for steering angle. It needs calibration, during this operation it is necessary to input two reference values, for example – 20° and +20°. 20 2.5 Channels and sampling rates The Drack system provides different sampling rates depending on the channel. Table 5 shows for every kind of channel the available sampling rates. Channels Sampling rates (Hz) Rpm 10, 20. Speed 10, 20, 50, 100. Analogue 1, 2, 10, 20, 50, 100, 200. Analogue-internal 10, 20, 50, 100, 200. Analogue special inputs 10, 20, 50, 100, 200. Data logger temperature 10. Battery 1, 2, 10, 20, 50, 100, 200. Math 1, 2, 10, 20, 50, 100, 200. Table 5 – Channels and sampling rates. The sampling rate of input channels is selected when the “Configuration-Input channels” command is run. For math channels in the Advanced version it is selected running the Math channels configuration (“ConfigurationMath channels” command). For math channels in the Standard version it is automatically fixed, it is the maximum sampling rate among the acquisition frequencies of the channels necessary to the computation. 21 Chapter 3 – Software: main commands 3.1 – Introduction The main commands are the commands in the main menu that is the menu of the main window. The main window is displayed running the program and it is shown in Fig. 2.2. 3.2 – File commands The File menu items are: “Backup test”, “Restore test”, “Delete test” and “Exit”. Backup test The command allows copying or moving tests and maps files from the selected track to a floppy disk. Restore test The command allows restoring tests and maps files from a floppy disk to the selected track. Delete test The command allows deleting tests and maps files from the selected track. It is possible to delete tests after they have been copied to a floppy disk selecting this option in the backup dialog window. Exit The command exits the Race Studio software. 22 3.3 – Track commands The Track commands provided the functions to menage the tracks (directories) where the recorded data are stored. The Track menu items are: “New…”, “Selection…”, “Modify…” and “Delete…”. New... This command creates a new track. Running the command the Track description dialog window is shown, see Fig. 3.1. This dialog includes all the information necessary to describe the track. Fig. 3.1 – Track creation Option/Display Track name Use In this field the name of the new track (consistent names are suggested). Maximum 12 characters can be input. Track shape In this field it is possible to select the shape of the circuit, it is very important to choose the right one for a correct calculation of the map. Official track length Input in this field the official length of the track. Lap time threshold In this field type the number of seconds under which the best lap is not calculated, the default value is 30 seconds. Input a value that is some seconds less than the one you are expecting Cancel Choose this command to leave the window and do not create the new track Ok Choose this command to exit the window and to create the new track WARNING. If a track is created outside the program (for instance with the Windows Explorer) it must be created in the DATA folder of the Race Studio working directory. Selection... The command allows setting the active track for the program. 23 Fig. 3.2 – “Track-Selection…” command: track selection Option/Display Track Use In this field the active track is shown, all the available tracks are listed below Cancel Choose this command to leave the window and do not change the active track Ok Choose this command to exit the window and to confirm the selection Modify... This command allows modifying the description parameters of the track. Running the command the dialog window of Fig. 3.1 is shown. See the “New…” paragraph of this chapter for a description of the dialog window. Delete… This command allows deleting a track with all the included tests. It is not possible to delete the active track. Running the command a dialog window for the selection of the track to delete is shown. 24 3.4 – Configuration commands The configuration commands are divided into three groups, the first is dedicated to the multiple configuration management, the second to the configuration of the data logger and of the program and the third is the command for the transmission of the configuration to the data logger. The multiple configurations management commands are: “New…”, “Load…”, “Copy” and “Delete”. New... This command creates a new configuration file for the data logger, with the name you input, the data logger type may be also selected. The configuration is created alike the one in the CHANNELS.INI file. Use consistent names like the name of the driver or the number of the vehicle. Load… Running this command it is possible to select the active configuration. The active configuration is the one edited with the “Configuration-Input channels” command and transmitted to the logger with the “Configuration-Logger transmit” command. The name of the loaded configuration is shown in the status bar of the application, see Fig. 2.2. Copy This command copies the active configuration into a new one named by the user. Use consistent names like the name of the driver or the number of the vehicle. Delete This command deletes the selected configuration. It is not possible to erase the CHANNELS.INI configuration and the active one. The commands for the configuration of the program and of the data logger are “General”, “Serial line”, “Display”, “Beacon”, “Input channels” and “Math channels”. General In the dialog window shown selecting the command it is possible to select the recording criterions for the data logger and the Personal Computer, the data logger cleaning memory criterion. Moreover you can choose the vehicle type, the units of measure for speeds and temperatures, the user interface language and the Reference speed channel. The Fig. 3.3 shows the dialog window for the general configuration. Fig. 3.3 – General configuration 25 Option/Display Logging Use The logging section groups the recording criterions. For the data logger: THRESHOLD for tests on the track or CONTINUOUS for test on the dyno bench. For the Personal Computer MANUAL or THRESHOLD. The <Online trigger channel> and <Online trigger channel threshold> values are necessary if the THRESHOLD choice has been selected. Data logger memory cleaning In this section is possible to select the criterion for cleaning the memory of the data logger (for deleting the recorded data). The default is <Automatic at the end of the download> operation. Otherwise it is possible, selecting the <Under request of the user> option, to clean the memory only sending the configuration to the logger. Warning: if you choose the second option remember to send the configuration to the logger before run a new test. Vehicle In this field it is possible to set the vehicle type (two wheels or four wheels). It is important to select the right item in order to have a correct map creation. Unit of measure for speeds In this field it is possible to set the unit of measure (km/h or mph) for speeds and the corresponding units for distance. Unit of measure for temperatures In this field it is possible to set the unit of measure (°C or °F) for temperatures. Language In this field it is possible to select the language for the user interface, if the language has been changed exit the program, run it again for the activation of the new selection. Reference speed In this filed it is possible to set the channel that will be used as the Reference speed channel in the Analysis functions. For a description of the reference speed role see the 2.2.2 chapter. Cancel Choose this command to leave the window and do not save the selections. Ok Choose this command to exit the window and to confirm the selections. Serial line In this window shown in Fig. 3.4 the serial line used for the communication with the data logger and the communication speed for the download operation have to be input. Fig. 3.4 – Serial line configuration Option/Display Port Use In this field it is possible to select the port used for the communications with the logger (for more information about the serial lines see the documentation of your personal computer) Speed (baud) In this field it is possible to select the speed of the serial line, two values are provided 38400 and 115200 (for more information about the serial lines see the documentation of your personal computer) Cancel Choose this command to leave the window and do not save the selections Ok Choose this command to exit the window and to confirm the selections 26 Display The dialog window for the configuration of the display mounted on your vehicle is shown in Fig. 3.5. If the M2-dash and the Light-dash displays are used here select the Speed channel and the two temperature channels shown on it. Fig. 3.5 – Display configuration If the DashChron is selected the dialog window shown in Fig. 3.6 is displayed. Fig. 3.6 – DashChron configuration Option/Display Measures Use In these fields select the channel you would like to see also in the dashboard. They are one speed channel and four analogue channels. The first two analogue channels can be only temperatures the second two can be temperatures or pressures. The first analogue channel will be displayed in the (1) display, the other channels can be shown in the display number (2). The display (3) shows always the lap time. Alarms In these fields it is possible to input, for each channels, the minimum and the maximum alarm. For each alarm can be selected the threshold value and the LED which will show the alarm. Gear Flash In these fields input the value for the five Gear Flash LED’s. For each LED it is possible to input the rpm threshold value. Different values or the same value for all the 27 LED’s can be input. The fifth value is also the threshold for the external Gear Flash. For a description of the characteristics and of the functionality of all the displays and dashboard see the “Software manual – Displays and Dash”. Beacon The “Beacon” command allows configuring the obscuring time for the beacon. How many seconds the infrared receiver has to be obscured after a lap marker has been detected. Input channels The “Input channels” command allows configuring all the data logger channels. Fig. 3.7 shows the dialog window displayed for the configuration; it refers to a GOLD data logger (eight analogue channels available). Fig. 3.7 – Input channels configuration Select a channel from the list, all the information about it is shown. A description of all the fields in the dialog window is given below. 28 Option/Display Channels Use In these fields the name of the selected channel and the list of the available channels are shown. The name of the selected channel can be edited. Sensors In these fields the name of the selected sensor and the list of the sensors are shown. A double click over a sensor name in the list and it becomes the selected one. Warning with a single click the sensor does not become the selected one! Status In this field choice if the selected channel have to be acquired (select ENABLED) or not (select DISABLED). Unit of measure In this field input the unit of measure of the channel. For instance °C for a temperature or km/h for speed. Zero scale In this field input the beginning of the scale for the visualisation of the plot in the Analysis section. Full scale In this field input the end of the scale for the visualisation of the plot in the Analysis section. Sampling rate Select the number of readings per second of the channel. The provided values are 1, 2, 10, 20, 50, 100 and 200 Hertz. For every channel different frequencies are available Filter In this field select if a filter function has to be applied to the data of the selected channel after the download operation. Data is filtered in the same way used in the Analysis section Recording time In this field the maximum recording time for the data logger is shown. This parameter depends on the number of enabled channels and on their sampling rate. Appendix A shown some typical recording time. Parameters The parameters’ fields are displayed only when the selected sensor needs them. For example speed sensor needs two parameters: tyre circumference and pulses per revolution. A full description of these parameters is given in the Table 4. ? Choose this command to show a help dialog window. Cancel Choose this command to leave the window and do not save the selections. Ok Choose this command to exit the window and to confirm the selections. Warning. Summing the sampling rate of all the enabled channels we obtain the total acquisition frequency of the system. The frequency must not exceed the 930 Hz if the display is connected otherwise 960 Hz. Math channels The “Math channels” command allows managing the math channels depending on the installed software version. Standard version Selecting the command the dialog window shown in Fig. 3.8 is displayed. Fig. 3.8 – Math channels configuration for the Standard version Option/Display Channels Use In these fields the name of the selected channel and the list of the available channels are shown. The name of the selected channel cannot be edited. Status In this field choice if the selected channel have to be calculated (select ENABLED) or not (select DISABLED) at the end of the downloading operation. Unit of measure In this field the unit of measure of the channel is shown. Zero scale In this field input the beginning of the scale for the visualisation of the plot in the 29 Analysis section. Full scale In this field input the end of the scale for the visualisation of the plot in the Analysis section. Sampling rate In this field the readings per second of the channel are shown. The software depending on the sampling rate of the needed channels automatically sets the sampling rate. Measure needed In this field the measures necessary to the calculation of the selected channel are shown. Cancel Choose this command to leave the window and do not save the selections. Ok Choose this command to exit the window and to confirm the selections. For more information about the math channels see chapter 2.3.4.1. Advanced version Selecting the command the dialog window shown in Fig. 2.3 is displayed. For a full description of the math channel editor and interpreter see chapter 2.3.4.2. Transmission to the logger The “Transmission to the logger” command allows transmitting the configuration to the data logger. To perform this operation is necessary to connect the data logger to the Personal Computer and power on the data logger. Transmit the configuration to the data logger every time something in the “Configuration – Input channels”, “Configuration – General”, “Configuration – Display” or “Configuration – Serial line” is changed. Warning. If multiple configurations are used be careful that the transmitted configuration is the correct one for the connected data logger. 30 3.5 – Sensors commands The sensors’ menu includes the “Calibration” and the “Automatic calibration” items. Calibration The <Potentiometer to calibrate> and the <Mid-zero potentiometer> are the sensors needing calibration. The calibration has to be performed with the sensors directly mounted on the vehicle. When the “Calibration” command is run the data logger has to be connected to the personal computer and powered on. Selecting the “Calibration” command a dialog window with the channels to calibrate is shown; select a channel and press [Start]. For a < Mid-zero potentiometer > the dialog window shown in Fig. 3.9 is displayed. Fig. 3.9 - < Mid-zero potentiometer > calibration Here the steps necessary to do the calibration are described, we suppose we are calibrating the Steering wheel sensor. 1. The area (1) shows the “Put the sensor in zero position. Press START when ready” message. 2. Leave the Steering wheel in the rest position and press [Start]. 3. The area (1) shows the “Operation in progress...” message and a number appears in the “Zero position” field. 4. When the operation finished the area (1) shows the “Put the sensor in low reference position. Press START when ready” message. Turn the Steering wheel all on the right and press [Start]. 5. The area (1) shows the “Operation in progress...” message and a number appears in the “Low reference position” field. Keep the Steering wheel in the same position during the operation. 6. When the operation finished the area (1) shows the “Put the sensor in high reference position. Press START when ready” message. Turn the Steering wheel all on the left and press [Start]. 7. The area (1) shows the “Operation in progress...” message and a number appears in the “High reference position” field. Keep the Steering wheel in the same position during the operation. 8. When the operation finished the area (1) shows the “Enter the low and high reference values.” message. Input the asked values into the “Low reference value” and “High reference value” field respectively. For example –20 and 20 degrees can be good values. 9. When finished press [Ok]. The calibration is done. The same procedure is done for the calibration of the <Potentiometer to calibrate> and a dialog window very similar to the one shown in Fig. 3.8 is displayed. For this sensor a single reference value is required, it can be the full-scale value of the measure. For instance when the potentiometer is used to measure the throttle position the zero position is when the throttle is closed and the reference position is when the throttle is full. 31 Automatic calibration The automatic calibration is necessary for the sensors that change their value depending on a zero (or rest) position. See Table 4 for knowing the sensor needing automatic calibration. Before starting the “Automatic calibration” command make sure the data logger is connected to the personal computer and it is powered on. If multiple configurations are used check the loaded configuration, it has to be the right one for the data logger connected to the personal computer. Then in order to perform a correct calibration put the vehicle in the rest position, for example places the car on the ground with the driver inside, and run the command. After a few seconds the operation can be finished pressing [Ok]. 32 3.6 – Download command The “Download” command allows downloading data from the Drack data loggers to the Personal Computer memory. When the “Download” command is selected for the first time the track selection dialog window is shown, see it in Fig. 3.2. After the selection of the track or the creation of a new one press [Ok], a progressive bar is shown. When the bar reaches the 100% the download operation is finished and a dialog window named Test information setting is shown, see Fig. 3.10. In this dialog window it is possible to input some information describing the test. Fig. 3.10 – Test information setting Option/Display Name (necessary) Use Input here the name of the test, maximum twenty characters. This is the name of the file that includes the data of the test and it is also the name you will find when you would like to analyse the data. Warning, the name is necessary. Vehicle Input the kind of the vehicle, maximum twenty characters (optional). Track Input the name of the track, maximum twenty characters (optional). Driver Input the name of the driver, maximum twenty characters (optional). Test comments Input any comments you would like, maximum two hundreds characters (optional). Ok Choose this command to exit the window and to confirm the input data. Cancel Choose this command to leave the window and do not save any modification you made. All the information input in this window can be modified during the analysis selecting the “Modify-Test-Name” command (see “Software manual – Analysis). If the <Under request of the user> option has been selected in the “Configuration – General” the program asks if you want to clean the memory of the data logger, otherwise it automatically cleans it. 33 3.7 – Analysis command The “Analysis” command allows entering the analysis functions described in the “Software manual – Analysis”. When this command is selected the dialog window shown in Fig. 3.11 is displayed. Fig. 3.11 – Test selection Option/Display Track Use The selected track is shown in this field. Test The list of the tests recorded in the track is shown. The recording Date and Time, the number of laps and the best lap for each test are also displayed. Notes The notes of the highlighted test are shown in this field. Track shape Choose this command to change the characteristics of the track. For more information see chapter 3.3. Change track Choose this command to change the selected track, see chapter 3.3. Ok Choose this command to confirm the selected test and enter the analysis window. Cancel Choose this command to go back to the main window. 34 3.8 – Check list command The “Check list” command shows a dialog window with some useful information for the operation on the track. These suggestions can appear obvious for a skilled user but follow them can prevent you from recording unreadable data or from recording no data at all. 35 3.9 – Acquisition commands The “Acquisition” commands allow connecting to the data logger for the “on line” operations. The acquisition menu includes the “View” and the “Memo” items. View The “Acquisition-View” command allows seeing all the input channels. Before running the command connect the data logger to the PC and power it on. In Fig. 3.12 the visualisation for a GOLD data logger is shown. Fig. 3.12 – “Acquisition-View”: channels on line view The dialog window shows a table having in the first column (the one on the left) the name of the channels (the disabled channels are greyed), in the second column the unit of measure of the channels and in the third column the value of the channels (in engineering units). Two icons representing the status of the serial communication and of the battery are also displayed. Green icons mean that the status of the serial line and of the battery is correct red icons mean status not correct. Moreover the status of the memorisation is shown (in the Fig. 3.12 the data logger is not recording). The icon is shown (like in Fig. 3.12) when a lap marker is received. At the bottom of the window the voltage of the battery is also shown. Option/Display Quit Use Choose this command to exit the visualisation. Raw/Calculated Choose this command to see the input values in engineering units (default) or in raw counts. Channels 9-16/ Channels 1-8 This command is available only for EXPERT data loggers, for other data loggers version this button is greyed. Pressing this button the first eight analogue channels or the second eight are shown. 36 Memo The “Acquisition-Memo” command allows seeing data from the data logger and recording them in the Personal Computer. Before running the command connect the data logger to the PC and power it on. The functionality of this command depends on the logging criterion selected in the general configuration, see chapter 3.4. If the MANUAL start/stop recording has been selected pressing the [Start/Stop acquisition] button the acquisition begins or ends. At the end of the acquisition press [Save] to record data on the PC hard disk, the dialog window shown in Fig. 3.10 is displayed. If the THRESHOLD start/stop recording has been selected the acquisition begins when one of the speed channels reach the 10 km/h (6.2 mph) and ends when all the speed channels values are below the 10 km/h (6.2 mph). At the end of the acquisition press [Save] to record data on the PC hard disk, the dialog window shown in Fig. 3.7 is displayed. When the command is selected a dialog window is shown, in Fig. 3.13 an example for a GOLD data logger is displayed. Fig. 3.13 – “Acquisition -Memo”: on line data acquisition The dialog window shows a table having in the first column (the one on the left) the name of the channels (the disabled channels are greyed), in the second column the unit of measure of the channels and in the third column the value of the channels (in engineering units). Two icons representing the status of the serial communication and of the battery are also displayed. Green icons mean status of the battery and of the serial line ok red icons mean status not correct. Another icon shows a traffic light, the red light on means the acquisition is stopped the green light on means the acquisition is running. Beside the traffic light icon the acquisition time is shown. The icon is shown (like in Fig. 3.13) when a lap marker is received. At the bottom of the window the voltage of the battery is also shown (11.29 Volt in Fig. 3.13). Option/Display Quit Use Choose this command to exit the visualisation. Save Choose this command to save on the PC hard disk the recorded data. Channels 9-16/ Channels 1-8 This command is available only for EXPERT data logger, for other data logger version this button is greyed. Pressing this button the first eight analogue channels or the second eight are shown. Start acquisition/ Stop acquisition Choose this command to start the acquisition when the MANUAL recording has been selected, otherwise the button is greyed. Acquisition The start/stop recording criterion is shown, the MANUAL start/stop is shown in Fig. 3.11. 37 3.10 – Help commands Manual Running this command this manual in PDF format is displayed. About Race Studio… The command shows the version of the Race Studio software running on your Personal Computer and the available resources of the PC. 38 Chapter 4 – Troubleshooting 4.1 - Data logger does not reply during serial communication On line operations 1. Check the connections of the cable for the serial communication to the data logger and to the Personal Computer. If the cable has one or more extensions check every connection. The maximum length of the cable has to be 10 metres (32.8 feet). 2. Check the state of charge of the battery powering the data logger (during this operation the data logger must be powered). Download operation This trouble happens when the Race Studio program shows an error message during the download, for example the operation does not start or stops. It does not concern the problem “no data has been recorded” (for this problem see below). 1. Check the connections of the cable for the serial communication to the data logger and to the Personal Computer. If the cable has one or more extensions check every connection. The maximum length of the cable has to be 10 metres (32.8 feet). 2. Check the state of charge of the battery powering the data logger (during this operation the data logger must be powered). 3. Remove all the power saving features of the Personal Computer. Performing the operation use the Control Panel of the Windows operating system. For more details refer to the manual of the operating system installed on your Personal Computer. 4. Reduce the serial line speed from 115200 to 38400. Select the “Configuration-Serial line” command to make the change. 4.2 - The data logger did not record data This information may appear at the beginning of the download operation. 1. Check the voltage of the battery powering the data logger (during this operation the data logger must be connected to the battery). 2. If the recording criterion for the data logger is THRESHOLD, check the position of the speed sensor. 39 Appendix A Examples of acquisition time for a GOLD or EXPERT Drack data logger. Example 1 Channel Rpm Speed #1 Speed #2 Front suspension Front roll Rear right suspension Rear left suspension Throttle position Steering wheel Lateral acceleration Battery Data logger temperature Display Sampling rate (Hz) 10 20 20 50 50 50 50 20 20 20 1 10 YES Total recording time: 20 minutes. Example 2 Channel Rpm Speed #1 Speed #2 Water temperature Egt temperature Brake position Lambda sond Throttle position Steering wheel Lateral acceleration Battery Data logger temperature Display Total recording time: 43 minutes. 40 Sampling rate (Hz) 10 10 10 10 10 10 10 10 10 10 1 10 YES s.r.l. Via Cavalcanti 8 20063 Cernusco sul Naviglio – MI ITALY Tel. (+39)-(0)2-9290571 Fax. (+39)-(0)2-92118024 http://www.aim-sportline.com/ 41