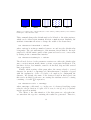
1
IPHC-PHENO-12-06
MadAnalysis 5, a user-friendly framework for
collider phenomenology
Manual for the v 1.0.x series
Eric Contea , Benjamin Fuksb , Guillaume Serretb
a
Groupe de Recherche de Physique des Hautes Energies (GRPHE), Université de
Haute-Alsace, IUT Colmar, 34 rue du Grillenbreit BP 50568, 68008 Colmar Cedex,
France
E-mail: [email protected]
b
Institut Pluridisciplinaire Hubert Curien/Département Recherches Subatomiques,
Université de Strasbourg/CNRS-IN2P3, 23 Rue du Loess, F-67037 Strasbourg, France
E-mail: [email protected], [email protected]
Abstract
We present MadAnalysis 5, a new framework for phenomenological investigations at particle colliders. Based on a C++ kernel, this program allows us
to efficiently perform, in a straightforward and user-friendly fashion, sophisticated physics analyses of event files such as those generated by a large class
of Monte Carlo event generators. MadAnalysis 5 comes with two modes
of running. The first one, easier to handle, uses the strengths of a powerful Python interface in order to implement physics analyses by means of a
set of intuitive commands. The second one requires one to implement the
analyses in the C++ programming language, directly within the core of the
analysis framework. This opens unlimited possibilities concerning the level
of complexity which can be reached, being only limited by the programming
skills and the originality of the user.
Keywords: Particle physics phenomenology, Monte Carlo event generators,
hadron colliders.
Preprint submitted to Computer Physics Communications
September 29, 2012
PROGRAM SUMMARY
Manuscript Title: MadAnalysis 5, a user-friendly framework for collider phenomenology.
Authors: Eric Conte, Benjamin Fuks, Guillaume Serret.
Program Title: MadAnalysis 5
Licensing provisions: Permission to use, copy, modify and distribute this program
is granted under the terms of the GNU General Public License.
Programming language: Python, C++.
Computer: All platforms on which Python version 2.7, Root version 5.27 and
the g++ compiler are available. Compatibility with newer versions of these programs is also ensured. However, the Python version must be below version 3.0.
Operating system: Unix, Linux and Mac OS operating systems on which the
above-mentioned versions of Python and Root, as well as g++, are available.
Keywords: Particle physics phenomenology, Monte Carlo event generators, hadron
colliders.
Classification: 11.1 General, High Energy Physics and Computing.
Nature of problem: Implementing sophisticated phenomenological analyses in highenergy physics through a flexible, efficient and straightforward fashion, starting
from event files as those produced by Monte Carlo event generators. The event
files can have been matched or not to parton-showering and can have been processed or not by a (fast) simulation of a detector. According to the sophistication
level of the event files (parton-level, hadron-level, reconstructed-level), one must
note that several input formats are possible.
Solution method: We implement an interface allowing to produce predefined as
well as user-defined histograms for a large class of kinematical distributions after
applying a set of event selection cuts specified by the user. This therefore allows
to devise robust and novel search strategies for collider experiments, such as those
currently running at the Large Hadron Collider at CERN, in a very efficient way.
Restrictions: Unsupported event file format.
Unusual features: The code is fully based on object representations for events,
particles, reconstructed objects and cuts, which facilitates the implementation of
an analysis.
Running time: It depends on the purposes of the user and on the number of events
to process. It varies from a few seconds to the order of the minute for several millions of events.
2
Contents
1 Introduction
5
2 Overview of MadAnalysis 5
2.1 MadAnalysis 5 in a nutshell . . . . . . . . . . . . . . . . . .
2.2 Basic concepts . . . . . . . . . . . . . . . . . . . . . . . . . . .
2.3 Logical architecture of the program . . . . . . . . . . . . . . .
10
10
12
14
3 First steps with MadAnalysis 5
3.1 Starting the command interface . . . . .
3.2 Particles and multiparticles . . . . . . .
3.3 Importing event samples . . . . . . . . .
3.4 Selection cuts and creation of histograms
3.5 Displaying the results . . . . . . . . . . .
.
.
.
.
.
15
16
17
18
19
21
way
. . .
. . .
. . .
. . .
. . .
. . .
. . .
24
24
27
33
40
43
56
58
. . . .
. . . .
. . . .
events
. . . .
. . . .
. . . .
. . . .
. . . .
. . . .
65
66
69
73
74
80
87
92
93
94
101
.
.
.
.
.
.
.
.
.
.
.
.
.
.
.
.
.
.
.
.
.
.
.
.
.
.
.
.
.
.
.
.
.
.
.
.
.
.
.
.
.
.
.
.
.
4 Implementing analyses in an efficient and user-friendly
4.1 Starting a MadAnalysis 5 session . . . . . . . . . . . .
4.2 The command line user interface of MadAnalysis 5 . .
4.3 Datasets . . . . . . . . . . . . . . . . . . . . . . . . . . .
4.4 Particles and multiparticles . . . . . . . . . . . . . . . .
4.5 Creating histograms . . . . . . . . . . . . . . . . . . . .
4.6 Selection cuts . . . . . . . . . . . . . . . . . . . . . . . .
4.7 Executing an analysis and displaying the results . . . . .
5 MadAnalysis 5 for expert users
5.1 The SampleAnalyzer framework . . . . . . . . . . .
5.2 Implementing new analyses using the analysis template
5.3 The data format used by SampleAnalyzer . . . . . .
5.3.1 The data format for parton-level or hadron-level
5.3.2 The data format for reconstructed events . . . .
5.4 The sample format used by SampleAnalyzer . . . .
5.5 Framework services . . . . . . . . . . . . . . . . . . . .
5.5.1 Message services . . . . . . . . . . . . . . . . .
5.5.2 Physics services . . . . . . . . . . . . . . . . . .
5.6 A detailed example . . . . . . . . . . . . . . . . . . . .
6 Conclusions
.
.
.
.
.
.
.
.
.
.
108
3
Appendix A
Installation of the program
110
Appendix A.1 Requirements . . . . . . . . . . . . . . . . . . . . 110
Appendix A.2 Downloading the program . . . . . . . . . . . . . 111
Appendix A.3 Running MadAnalysis 5 . . . . . . . . . . . . . 112
4
1. Introduction
Among the key topics of the present experimental program of high-energy
physics lies the quest for new physics and the identification of the fundamental building blocks of matter, together with their interactions. In these
prospects, the Large Hadron Collider (LHC) is currently exploring the TeV
scale and multi-purpose experiments, such as ATLAS or CMS, are currently
pushing the limits on beyond the Standard Model physics to a further and
further frontier. Discoveries from these experiments, together with their interpretation, are in general challenging and strongly rely on our ability to
accurately simulate both the possible candidate signals and the backgrounds.
This task is however rendered quite complicated due to the complexity of the
typical final states to be produced at the LHC, which contain large numbers
of light and heavy flavor jets, charged leptons and missing transverse energy.
Consequently, the overwhelming sources of Standard Model background require the development of robust, and possibly novel, search strategies. In this
context, tools allowing us to compute predictions for large classes of models
are central.
This has triggered, during the last twenty years, a lot of efforts dedicated to the development of multi-purpose matrix-element based event generators such as Alpgen [1], Comix [2], CompHep/CalcHep [3, 4, 5],
Helac [6], MadGraph/MadEvent [7, 8, 9, 10, 11], Sherpa [12, 13] and
Whizard [14, 15]. As a result, the problem of the generation of partonlevel events, at the leading-order accuracy, for many renormalizable or nonrenormalizable new physics theories has been solved. More recently, progress
has also been achieved in the automation of next-to-leading-order computations. On the one hand, the generation of the real emission contributions
with the appropriate subtraction terms has been achieved in an automatic
way [16, 17, 18, 19, 20, 21]. On the other hand, several algorithms addressing the numerical calculation of loop amplitudes have been proposed
[22, 23, 24, 25, 26] and successfully applied to the computation of Standard
Model processes of physical interest [27, 28, 29, 30, 31].
Even if each of the above-mentioned tools is based on a different philosophy, uses a specific programming language and requires a well-defined
input format for the physics models under consideration, programs such as
FeynRules [32, 33, 34, 35, 36] and LanHep [37, 38] have alleviated the
time-consuming and error-prone task of implementing new physics theories in
the Monte Carlo tools. Furthermore, the introduction of the Universal Feyn5
Rules Output (UFO) format [39] and the development of an automated tool
computing helicity amplitudes [40] have also streamlined the communication
between the construction of a new physics theory and its implementation in
the matrix-element generators through a standardized fashion.
Parton-level physics analyses based on event samples produced by matrixelement generators are far from describing the reality of what is observed in
any existing detector. This kind of phenomenological work can however be
useful in the prospects of investigating new types of signature and devising
original search strategies, preliminary to more complete phenomenological
investigations. In order to facilitate the information transfer from the matrixelement generators, a generic format for storing (parton-level) events and
their properties has been proposed ten years ago, the so-called Les Houches
Event (LHE) file format [41, 42]. Following the LHE standards, events
are stored in a single file, following an XML-like structure, together with
additional information related to the way in which the events have been
generated.
Monte Carlo generator-based physics analyses at the parton-level then
consist in first parsing LHE event files related to both the signal and the different sources of background, then implementing various selection cuts on the
objects contained in the events, i.e., quarks, leptons, neutrinos, new stable
particles, etc, and finally in creating histograms representing several kinematical quantities. By means of signal over background ratios, optimization
of the selection cuts can be achieved in order to maximize the chances to
unveil the signal of interest. Of course, the only sensible conclusions which
could be stated at this stage would be to motivate (or not) a more realistic
analysis, including at least parton showering and hadronization.
An accurate simulation of the collision to be observed at hadron colliders
indeed requires a proper modeling of the strong interaction, including parton
showering, fragmentation and hadronization. This is efficiently provided by
packages such as Pythia [43, 44] and Herwig [45, 46] and several algorithms
matching parton showering to hard scattering matrix elements have been
recently developed [47, 48, 49, 50].
Even if not directly necessary for the analysis of the event samples, a large
part of the information present in a parton-level LHE event file allows for
a further matching procedure. Consequently, the generation of hadron-level
events for a multitude of Standard Model and beyond the Standard Model
processes can be (and has been) done in a systematic fashion. This starts
from parton-level events stored in LHE format-compliant files, as generated
6
by matrix-element based event generators. These files are then further processed by a parton showering and hadronization code which allows us to
match the strengths of both the description of the physics embedded into
the matrix elements and the one modeled by the parton showering. Consequently, physics analyses at the hadron-level are far more sophisticated than
their counterparts at the parton-level.
When analyzing hadron-level events, one must note that the key difference
with respect to the parton-level case lies in the objects which are contained
in the event files. In contrast to partonic events, hadronic events consist
in general in a huge collection of hadrons given together with their fourmomentum. The particle content of the final state is thus much richer and
the storing of the information at the time of parsing the event file is hence
rendered rather cumbersome.
In order to streamline this procedure, dedicated event class libraries have
been developed and several common formats for outputting hadron-level
event samples exist. Event files compliant with such formats can in general
be straightforwardly read by fast detector simulation programs, necessary
for a more advanced level of sophistication of the phenomenological analysis.
As examples, one finds the StdHep [51] or HepMC [52] structure for event
files, both widely used in the high-energy physics community. According to
these conventions, an event contains, in addition to the final state particles
and their properties, the whole event history as a set of mother-particle to
daughter-particle relations. Let us also note that the task of parsing hadronlevel event files can be highly simplified after clustering the hadrons into jets,
using jet algorithms such as, e.g., those included in the FastJet program
[53]. This simplified picture allows for the usage of a simpler event format,
such as the LHE format introduced above, which subsequently renders an
analysis easier to implement.
State-of-the-art phenomenological analyses require in general fast (and
realistic) detector simulation in order to correctly estimate both the signals
under consideration and the backgrounds. Starting from hadronized event
samples, several frameworks, such as PGS 4 [54] and Delphes [55] are dedicated to this task. They produce event samples containing reconstructed
objects such as photons, jets, electrons, muons or missing energy, together
with their properties. Whereas the description of a specific signature as provided by a fast detector simulation tool is still far from what could have
been obtained using a full detector simulation, including among others the
transport of the particles through the detector material, fast simulation of
7
collider experiments is often sufficient to study the feasibility of a specific
analysis on realistic grounds. The results then motivate (or not) the associated analysis in the context of a full detector simulation, the latter being
embedded in generally complex experimental software such as those used by
large collaborations.
As stated above, after their processing by a fast detector simulation,
the original sets of hadrons are replaced by high-level reconstructed objects
stored together with properties such as their (smeared) four-momentum or
if they have been tagged as a b-jet or not. The structure of the events and
their properties can be very efficiently saved into a file following the LHCO
conventions [56]. Let us note that this format has been designed in particular
for that purpose.
As outlined above, the study of the hadron collider phenomenology of a
given signature can be performed at several levels of sophistication. Sometimes, very preliminary works at the parton-level are necessary in order to
motivate further investigations. Hadron-level analyses give a clearer hint
about the expected sensitivity of colliders to the signal under consideration.
This assumes a perfect and ideal detector. In contrast, state-of-the-art phenomenology includes a fast and semi-realistic simulation of the detectors.
This allows us to derive conclusions closer to the expectations estimated
with the help of a full simulation of the detector as performed by the large
collaboration software. The major drawback of the latter is that such tools
consist in very heavy, complex, time-consuming and non-public algorithms.
This therefore motivates pioneering works under the parton-level, hadroniclevel or reconstructed-level assumptions1 . It is however important to keep in
mind that the final word is always included in the data.
Performing a phenomenological analysis on the basis of the results provided by Monte Carlo generators always starts with the reading of several
event samples. Since partonic or hadronic events (the latter including or not
a fast detector simulation) are in general stored under different formats, this
step demands to use appropriate routines capable of understanding the file
structure. Selection cuts on the objects included in the events, i.e., partons,
hadrons or high-level objects, according to the level of sophistication, are
1
In this paper, we denote by reconstructed-level events which have already been processed by a fast detector simulation, in contrast to hadron-level events which have only
been showered, fragmented and hadronized and parton-level events where the matching
to a parton showering algorithm is fully absent.
8
then implemented and applied to both the signal and background samples.
This allows for the creation of histograms of various quantities in order to
be able to extract (or not, in the worst case scenario) information about a
signal in general swamped by backgrounds.
This procedure is most of the time based on home-made and non-public
programs, especially due to the lack of a dedicated framework. As a consequence, this can lead to various problems in the validation and the traceability of the analyses as well as possibly in the interpretation of the results.
In this work, we are alleviating this issue by proposing a single efficient
framework for phenomenological analyses at any level of sophistication. We
introduce the package MadAnalysis 5, an open source program based on
a multi-purpose C++ kernel, denoted SampleAnalyzer, which uses the
Root platform [57].
Using the strengths of a Python interface, the user can define his own
physics analysis in an efficient, flexible and straightforward way. Similarly to
the older Fortran and Perl version of MadAnalysis which was linked
to version 4 of the MadGraph program, MadAnalysis 5 can either be
run within MadGraph 5 or as a standalone package. It includes a complete
reorganization of the code and the implementation of many novel functionalities such as an efficient method to implement cuts as well as to generate
histograms and cut-flow charts in an automated fashion. Moreover, care has
been taken in developing a fast and optimized code.
Consequently, the procedure for performing a phenomenological analysis
has been drastically simplified since the only task left to the user is to define
the corresponding selection cuts and the distributions to be computed. Sometimes, these embedded features might however not be sufficient according to
the needs of the user. In order to overcome this limitation, MadAnalysis 5
offers an expert mode of running with unlimited possibilities. It is unlimited
in the sense that the user directly implements, within the C++ kernel, his
own analysis.
Finally, in order to release a single framework for the analysis of partonlevel, hadron-level or reconstructed-level based event simulations, several
event file formats are supported as input, from the LHE files which could
describe partonic or hadronic events to the more complex StdHep, HepMC
and LHCO file formats. Let us note that, according to the needs of the users,
interfacing additional event formats, such as, e.g., the ExRootAnalysis
format [58], can be easily achieved.
This paper documents the fifth version of MadAnalysis and consists in
9
its user guide. An up-to-date version of this document, together with the
program can be found on the web page
http://madanalysis.irmp.ucl.ac.be
Moreover, an extended, more pedestrian, version of this manual is also available at the same Internet address. The outline of this paper is as follows.
In Section 2, we give a general overview of the program, its philosophy and
its structure. Section 3 illustrates the capabilities of MadAnalysis 5 without entering into the details, the latter being given in the next sections.
Hence, Section 4 provides the guidelines for implementing basic (but still
professional) physics analyses, i.e., implementing simple selection cuts and
creating histograms for various kinematical distributions, whilst Section 5
is dedicated to a more expert usage of the program which allows us to design more sophisticated analyses. Our conclusions are presented in Section
6. Finally, a technical Appendix on the installation of the program and its
dependencies follows.
2. Overview of MadAnalysis 5
2.1. MadAnalysis 5 in a nutshell
The MadAnalysis 5 package is an open source program allowing us to
perform physics analyses of Monte Carlo event samples in an efficient, flexible
and straightforward way. It relies on a C++ kernel, named SampleAnalyzer, which uses the Root platform and interacts with the user by means
of a Python command line interface.
The distribution of the program includes a home-made reader of event
files created by Monte Carlo event generators. The reader is compliant with
Monte Carlo samples containing events either at the parton-level, at the
hadron-level or at the reconstructed-level. Hence, a unique framework can
be used for analyzing events embedded equivalently into simplified LHE files
or into more complex StdHep, HepMC and LHCO files.
From the information included in the event files, the user can ask MadAnalysis 5 to generate histograms illustrating various properties of the generated physics processes. These properties range from observables related to
the whole content of the events, such as the multiplicity of a given particle
species or the missing transverse energy distribution, to observables associated to a specific particle such as, for instance, the transverse-momentum
distribution of the final-state muon with the highest energy or the angular
10
separation between the final-state jets. The user has also the possibility to
compare event samples related to different physical processes in a straightforward fashion. On the one hand, the investigated distributions can be
stacked on the same histogram, after automatic normalization of the samples to an integrated luminosity which the user can specify. On the other
hand, the distributions can be normalized to unity in order to facilitate the
design of event selection cuts allowing for an efficient background rejection
based on the shape of the distribution. In this case, the histograms could be
superimposed rather than stacked in the aim of improving readability.
Moreover, if available, the whole event history, i.e., all the event information from the hard-scattering process to the final-state hadrons, including
the mother-particle to daughter-particle relations among the different stages
yielding the final state particle content, is stored. One can emphasize that
this feature is important for sanity and consistency checks of the generated
event samples.
Event selection can be easily performed by means of a series of intuitive
Python commands yielding the application of selection cuts to the samples under consideration. For instance, it is possible to only consider, in the
current analysis, events which contain at least a certain amount of missing
transverse energy or a given number of final-state leptons. In the same way,
one can access a specific particle in the event, such as the jet with the hardest transverse momentum, and require that it fulfills a given geometrical or
kinematical criterion. As a last example, the user could decide to only select
events containing at least two muons whose invariant mass is compatible with
the Z-boson mass. After applying a given cut, MadAnalysis 5 proceeds
with an automatic computation of the associated cut efficiency.
The ultimate goal of a physics analysis in particle physics is to extract
some signal from a usually swamping background so that one could study
its properties. The MadAnalysis 5 framework offers the possibility to tag
a specific event sample as a background or signal sample. This tagging
allows for an automatic treatment of the signal over background ratio, or
of any other similar observable which can be specified by the user, together
with the associated uncertainty. This quantity is recomputed after each of
the different selection cuts implemented by the user. With these pieces of
information available, optimizing selection cuts consequently becomes easier,
which allows us to investigate in a fast and efficient way whether a given
signature could be observable at colliders.
To display the results in a human-readable form, MadAnalysis 5 can
11
collect them either into a latex document to be further compiled or under
the form of an html webpage.
2.2. Basic concepts
The MadAnalysis 5 program provides to the user a platform including
a wide class of functionalities allowing one to perform sophisticated physics
analyses. Even if the existing possibilities are rather large, see Section 4 and
Section 5, implementing an analysis within the MadAnalysis 5 framework
always follows the same steps, each of these steps being linked to one or
several of the key features of the program. These key features are briefly
described in this Section, whilst additional and more detailed information
can be found in the rest of this manual.
Sample declaration - datasets.
When implementing an analysis within the framework of MadAnalysis
5, the first task which is asked of the user is to indicate the Monte Carlo event
files to be processed on run-time. In general, a full Monte Carlo event generation requires the simulation of several physical processes, such as the signal
under consideration and the associated sources of background. Furthermore,
for the processes with the highest cross sections, more than one event sample
may have to be generated in order to get enough statistical significance. The
user then requires these samples, describing the same physics, to be treated
on the same footing. In MadAnalysis 5, this can be performed in a very
natural way. The event files to be merged are gathered under the form of
an object dubbed a dataset. When the analysis is effectively executed by
the C++ core of the program, datasets, i.e., collections of event files, are
processed rather than the event files individually.
The particle content of the events - particles and multiparticles.
According to the conventions of the different event formats introduced
above, the particles described in the events are defined, in an unambiguous
way, through their Particle Data Group identifier (PDG-id) [59]. Similarly,
the algorithms generated by MadAnalysis 5 are widely based on this concept to distinguish the various particle species. The drawback is obviously
that this identifier is most of the time non-intuitive for the user and can even
become unreadable when the set of particles included in the events becomes
large. For instance, the particle content of hadron-level events consists in
12
hundreds of different particles, each of them being identified by a different
PDG-id.
In the spirit of the MadGraph program, MadAnalysis 5 alleviates this
issue by allowing us to associate a particle label to a given PDG-id. Hence,
instead of representing an electron and a positron by the integer numbers 11
and -11, one can create the (more intuitive) labels e- and e+ and associate
them to the PDG-ids 11 and -11, respectively. It is also possible to collect
labels together through the concept of multiparticles. Hence, one could define
a label e referring to both the electron and the positron.
In order to implement an analysis in an efficient way, it is recommended
to the user to define, in a first step, a series of particle and multiparticle
labels facilitating the readability (and then the validation) of his analysis.
Definition of the analysis - selections.
Implementing the analysis is the core task of the user. It consists in
defining the histograms that have to be generated and the selection cuts that
need to be applied. These two types of objects, i.e., histograms and cuts,
are uniquely dubbed selections. It can be noted that even if asking for the
generation of several histograms is a commutative operation, the ordering of
the selection cuts is in contrast important. Applying the cuts in a different
order indeed leads to the production of different (intermediate) histograms
and efficiency tables.
Running the analysis - jobs.
After having created a series of dataset objects and defined the analysis
to be performed, i.e., having implemented the histograms and selection cuts
of interest, the user needs to execute the analysis on the datasets. Contrary
to the previous steps which rely on the Python module of MadAnalysis
5, this task is built, for efficiency reasons, upon a C++ code which is generated by MadAnalysis 5 and denoted as a job. After MadAnalysis 5
creates the job, it has to be executed by the SampleAnalyzer kernel for
each of the predefined datasets. Once the analysis has been performed, the
results are subsequently imported in the Python module and re-interpreted
by MadAnalysis 5.
Display of the results - reports.
The generated results can be collected and displayed in a synthetic report.
This report is given either under the html format, as a webpage, or as a
13
Monte Carlo
samples
Particle list
Multiparticle list
UFO model
Job
root file
Python
interface
User
commands
Latex
HTML
compilation
}
report
SampleAnalyzer
kernel
Figure 1: The MadAnalysis 5 flowchart.
latex document that has to be further compiled. The report contains the
histograms which have been generated and the efficiency tables related to
the implemented selection cuts. Furthermore, a signal over background table
is generated provided the datasets defined by the user have been tagged as
signal and background samples.
2.3. Logical architecture of the program
The MadAnalysis 5 program has two components, a Python command
line interface and a C++ kernel dubbed SampleAnalyzer. In the normal
mode of running of the program, these two modules interact at different
stages, as illustrated in Figure 1. The way to perform physics analyses in this
mode is presented in detail in Section 3 and Section 4. For more sophisticated
analyses, users with advanced skills in programming can bypass the Python
interface and directly implement their analysis within the SampleAnalyzer
framework. This expert mode of running the code is described in detail in
Section 5.
The Python command line interface of MadAnalysis 5 consists in
a command prompt where the user accesses all the functionalities of the
program through a set of commands. This allows to implement an analysis
in a very user-friendly way. Each command entered by the user is first checked
from the point of view of the syntax and if necessary, an error message is
14
printed to the screen. The issued command is then stored in the memory of
the computer.
The interface can import different types of external information. Hence, a
predefined list of particle and multiparticle labels could be imported if given
as a text file or as a UFO model [39]. In a similar way, the list of the Monte
Carlo event files to be analyzed can be easily loaded in the current session of
MadAnalysis 5.
After the user has typed in all the commands defining his analysis (definition of the datasets, histograms and selection cuts), the Python interface
creates a C++ code using the SampleAnalyzer framework, the previously
introduced MadAnalysis 5 job. This C++ code comes with a Makefile
and is kept available to the user for further modifications or improvements
of the analysis without having to be regenerated. After the compilation and
execution of the job, the Python interface loads the results and uses the
Root library of functions [57] to normalize and draw the histograms according to the requirements of the user. The html and latex reports are
eventually generated.
The SampleAnalyzer C++ kernel of MadAnalysis 5 is, strictly
speaking, the part of the program dedicated to the analysis of the Monte
Carlo event samples itself. It consists in a framework built upon an adaptive
data format common for all types of Monte Carlo event samples and which
contains a series of well-suited functionalities. In addition, it includes a reader
compliant with the LHE, StdHep, HepMC and LHCO event formats and
a library of specific functions facilitating particle physics analyses. Among
the latter, one finds, e.g., methods allowing for boosting four-momenta or
testing if a particle is a final-state particle or not. Let us finally note that
the storage of information within the context of the SampleAnalyzer platform is widely based on the functions implemented within the Root library.
3. First steps with MadAnalysis 5
In this Section, we present the philosophy, main features and the userfriendliness of MadAnalysis 5 by means of a simple example. In contrast,
the full list of capabilities of MadAnalysis 5, which are much broader than
what is shown in this Section, are described in Section 4.
For the sake of the illustration, we decide to perform a toy analysis at
the parton-level. We consider several samples of 1000 events each describing
various Standard Model hard-scattering processes at the LHC running at a
15
center-of-mass energy of 7 TeV. Events are generated with the Monte Carlo
generator MadGraph 5 [11]. Neglecting all quark masses (but the top
mass), we employ the leading order set of the CTEQ6 parton density fit
[60] and identify both the renormalization and factorization scales as the
transverse mass of the produced particles.
We consider four different event samples describing three different physical processes. They are stored into the directory samples of MadAnalysis
5. If this directory is not present on the system of the user or if the event files
are not there for any reason, one can type, once the command line interface
of MadAnalysis 5 has been started (see Section 3.1),
install samples
This leads to the creation of the directory samples, if relevant, and to the
download from the Internet of the four samples
ttbar_sl_1.lhe.gz
ttbar_sl_2.lhe.gz
ttbar_fh.lhe.gz
zz.lhe.gz
The first two samples are related to the production of a semi-leptonically
decaying top-antitop pair where the lepton is an electron or a muon, and the
third one is related to the production of a fully hadronically decaying topantitop pair. The last sample describes the production of a Z-boson pair,
including also diagrams with virtual photons, where each of the bosons is
decaying either to an electron pair or to a muon pair. At the time of event
generation, we demand that the produced parton-level jets have a transverse
momentum pT > 20 GeV, a pseudorapidity |η| < 2.5 and a relative distance
∆R > 0.4. Leptons are required to have a pseudorapidity |η| < 2.5 and we
ask the invariant mass of a pair of two leptons of the same flavor to be higher
than 20 GeV.
3.1. Starting the command interface
Once downloaded from the web and unpacked, the MadAnalysis 5 package does not require any compilation2 or configuration and its command in2
The C++ core of MadAnalysis 5 has in fact to be compiled but this task is performed
automatically, behind the scenes, without requiring any interaction from the user.
16
terface, consisting in a command prompt ma5>, can immediately be launched
by issuing
bin/ma5
from the directory where MadAnalysis 5 has been installed. For the installation procedure of the program and all its dependencies, we refer to
Appendix A. The user is now able to access all the functionalities of the
tool and can start implementing an analysis.
When launched, the program firstly checks that all the required dependencies, such as the Root header files and libraries and a C++ compiler,
are present on the system and correctly installed. If not, an error message
is printed, so that the user has enough information to solve the issue, and
the program exits. On its first run, MadAnalysis 5 also compiles a static
library which is stored into the directory lib of the distribution. This library
is further used by the SampleAnalyzer kernel when analyses are executed.
Secondly, two lists of labels corresponding to standard definitions of particles and multiparticles are loaded into the memory of the current session
of the program. By default, when MadAnalysis 5 is used as a standalone
package, they are imported from the corresponding files stored in the input
directory of the distribution of the program. In contrast, if MadAnalysis 5
has been installed in the directory where MadGraph 5 has been unpacked,
the lists of particle and multiparticle labels are directly imported from MadGraph 5. Let us note that several multiparticles, such as hadronic or
invisible, are essential for a correct running of MadAnalysis 5. Therefore, if not included in the imported files, they are automatically created.
3.2. Particles and multiparticles
As soon as all the particle and multiparticle labels have been imported,
MadAnalysis 5 creates links pointing to lists containing all the declared
labels. This allows us to access them in an easy way at any time of the
analysis, by issuing in the command interface
display_particles
display_multiparticles
New labels can be created on run-time with the command define, as, e.g.,
define mu = mu+ mu17
This command creates a multiparticle label mu which is associated to both
the muon and the antimuon. Moreover, new labels are automatically added
to the relevant list of (multi)particles.
The definition of a specific label can be retrieved with the help of the
display command which outputs the PDG-id of the associated particle(s).
For example, after invoking the two commands
display b
display l+
the command interface outputs information about the (multi)particle labels
b and l+,
The particle ’b’ is defined by the PDG-id 5.
The multiparticle ’l+’ is defined by the PDG-ids -11 -13.
As can be seen from the screen output above, the two symbols b and l+ define
a b-quark and a positively charged lepton different from a tau, respectively.
3.3. Importing event samples
Preliminary to performing any analysis, event files under consideration
must be parsed and loaded into the memory. The command import has been
designed for that purpose. As a mandatory (single) argument, it requires the
name of the Monte Carlo sample(s) to be parsed. In order to import several
files at one time, the wildcard characters * and ? are allowed when typing-in
the argument of the function. Hence, the four samples introduced above can
be loaded simultaneously by issuing the command
import samples/*.lhe.gz
which is equivalent to the set of four commands
import
import
import
import
samples/ttbar_sl_1.lhe.gz
samples/ttbar_sl_2.lhe.gz
samples/ttbar_fh.lhe.gz
samples/zz.lhe.gz
The result is the creation of a unique event sample denoted by defaultset
containing all the imported files. We are now ready to define selection cuts
which the SampleAnalyzer kernel will apply to the events included in the
dataset defaultset. The name as well as the way how to merge the samples
can be tuned according to the needs of the user, but this goes beyond the
scope of this Section and will be addressed in Section 4.
18
3.4. Selection cuts and creation of histograms
Creating a histogram representing a specific kinematical distribution has
been made very efficient in the framework of MadAnalysis 5 through the
command plot. This command requires one mandatory argument, the observable to be computed, and a set of optional arguments containing, among
others, the number of bins of the histogram to be created and the lower and
upper bounds of its x-axis. In the setup of the bounds of a histogram, one
must note that the standard unit of energy used in MadAnalysis 5 is the
GeV.
In the toy analysis which is implemented in the following, we focus
on the missing transverse-energy distribution as well as on the transversemomentum distribution of the final state muons. We recall that we are
considering a unique event sample resulting from the merging of three tt̄ and
one diboson event files, as explained in Section 3.3. In order to create the
associated histograms, it is sufficient to issue the two commands
plot MET
plot PT(mu) 20 0 100
where we recall that the multiparticle mu has been defined in Section 3.2 and
represents both the muon and the antimuon. The symbol MET is associated
to the missing transverse energy whilst the function PT stands for the transverse momentum of a given (multi)particle provided as its argument. The
next pieces of information to be passed to the command plot are optional
and related to the binning of the histograms. By default, i.e., in the case
the binning information is not specified as in the first example above, MadAnalysis 5 uses hard-coded values which depend on the observable under
consideration. In contrast, as in the second example above, the user can
provide, at the time of typing-in the command, the number of bins (20 here)
together with the values of the lowest and highest bins (which are chosen
equal to 0 GeV and 100 GeV, respectively, in our example).
We now turn to illustrating the implementation of the two types of selection cuts which is possible to employ in MadAnalysis 5. These cuts will be
further applied, by the SampleAnalyzer kernel, to the events contained in
the defaultset dataset. We recall that the program contains a set of possibilities much broader than what is presented in this Section and we refer
to Section 4 for more information. In a first step, we decide to select events
/ T ) is not too large, i.e., E
/ T < 100
where the missing transverse energy (E
19
GeV. Rejecting events not fulfilling this criterion can be very efficiently and
easily performed by issuing the command
reject MET > 100
The function reject tells MadAnalysis 5 to remove from the event selection any event where the missing energy (MET) is larger than 100 GeV.
As a second illustration about the implementation of selection cuts in
MadAnalysis 5, we focus on the kinematical properties of the muons contained in the selected events. In particular, a part of the events contain
a muon−antimuon pair and we would like to represent the corresponding
invariant-mass distribution through a histogram. However, many events do
not exactly contain one muon and one antimuon. This is taken into account
by MadAnalysis 5 at the time of the generation of the histogram, where
one entry is included for each different muon−antimuon pair which can be
formed from the event particle content. For a given event, the number of entries can hence be zero, one or bigger than one according to the (anti)muon
multiplicity of the final state.
Realistic detectors are in general not capable of correctly reconstructing
too soft particles. Even at the parton-level, this effect can (and should) be
implemented. In our case, we could consider as (anti)muon candidate only
final state (anti)muons with, e.g., a transverse momentum pT > 20 GeV. This
cut can be implemented in MadAnalysis 5 through the command reject,
but following a syntax different from above,
reject (mu) PT < 20
The effect of this command is to consider, for each of the selected events, as
muon and antimuon candidates only muons and antimuons with a transverse
momentum (PT) harder than 20 GeV. For all the histograms which are generated after having typed the line above in the command interface, only the
selected (anti)muon candidate’s are considered. As stated above, we choose,
as an example, to represent the muon-pair invariant mass distribution computed from the analyzed event samples included in the dataset defaultset.
The command to create this histogram is similar to those presented in the
beginning of this Section,
plot M(mu+ mu-) 20 0 100
20
where the arguments of the function M, associated to the invariant mass, are
multiple. This denotes that we are summing the four-momenta of the muon
and the antimuon to derive the invariant mass to be represented. As it can
be seen from the optional arguments of the command plot, we once again
ask for a histogram of 20 bins with its lower and upper bounds being fixed
to 0 GeV and 100 GeV, respectively. We recall that for a specific event,
the number of entries which are included in the histogram corresponds to
the number of different muon−antimuon pairs that can be formed from the
final-state particle content. This can then be any integer number.
Once the selection is defined, it has to be executed through a job to be run
by SampleAnalyzer. This is done through the command submit which
takes as an argument the name of a directory which will be created,
submit <dirname>
The created directory <dirname> contains a series of C++ source and header
files that are necessary for SampleAnalyzer to properly run. The compilation, linking to the external static library of MadAnalysis 5 (see Section
3.1) and the execution of the resulting code is handled by MadAnalysis 5.
The screen output indicates the status of these different tasks and various
information such as the detected format of the event samples or the number of processed events. In the case anything is not going as smoothly as it
should, MadAnalysis 5 also prints warning and/or error messages to the
user and the program exits in the worst case scenario.
3.5. Displaying the results
After having performed the analysis as indicated in the previous Section,
MadAnalysis 5 offers several ways to present the results under a humanreadable report. This report can be either generated under the html format
or under a TEX format that could be compiled with a latex or a pdflatex
compiler. The histograms are saved under a Portable Network Graphics
file (.png) for html and pdflatex reports, and under an Encapsulated
PostScript file (.eps) for latex reports. The MadAnalysis 5 commands
generating the reports read
generate_latex <dirname>
generate_pdflatex <dirname>
generate_html <dirname>
21
= 10 fb-1 )
int
# mu ( L
7000
6000
5000
4000
3000
2000
1000
0
0
10
20
30
40
50
60
70
80
90
100
PT [ mu ] (GeV/c)
Figure 2: Transverse-momentum distribution of the muons for a dataset consisting of the
four event samples introduced in Section 3.
where <dirname> stands for the directory in which the report is generated.
The structure of the report is similar whatever the adopted format is. It
starts with a table of contents and firstly displays all the information necessary to ensure the reproducibility of the analysis. One hence finds the list
of commands which have been issued, in the current session of the program,
before the generation of the report, followed by the employed version of the
code as well as the values of all the setup parameters. In this last category,
one has, e.g., the list of the event samples which have been analyzed, given
together with the corresponding cross sections and the number of events
contained in the event files.
The core of the report contains the results of all the commands related
to histogram creation and to the application of a selection cut. These commands have been treated one by one by SampleAnalyzer and the report
follows this pattern. By default, histograms are normalized to an integrated
luminosity of 10 fb−1 and comes together with a summary table containing information on the mean value of the computed distribution and the
associated root mean square (RMS), as well as on the presence of possible
22
Dataset
Integral
defaultset
82747
Entries
/ event
0.752
Mean
RMS
Underflow
Overflow
42.8177
21.36
0.0
6.181
Table 1: Statistics associated to the histogram of Figure 2.
Cuts
Initial (no cut)
cut 1
cut 2
Signal (S)
109999 +/- 789
82994 +/- 375443
82994 +/- 612
Background (B)
S vs B
Table 2: Efficiencies of the cuts applied in Section 3.4.
underflow and overflow bins in the histogram. The latter are given as a ratio
of the value of the integral of the represented distribution between its lower
and upper bounds. A green−orange−red color code indicates their relative
importance, an orange or red color suggesting more or less strongly to the
user to modify the bounds of the histograms, if relevant. We refer to Section
4 for the description of all the properties of the histograms that can be modified by the user, such as the way to modify the luminosity or the binning of
a given histogram.
In Figure 2, we take the example of the transverse-momentum distribution
of the muons implemented in Section 3.4 and present the histogram generated
by MadAnalysis 5. As stated above, if several muons are contained in one
specific event, they each correspond to a different entry in the histogram with
the same weight. The summary table generated together with the histograms
is given in Table 1. In the first column of the table, the name of the dataset is
printed. In the second column, one finds the number of events normalized to
an integrated luminosity of 10 fb−1 , since this is the default value which has
not been modified. In the third column, the average number of histogram
entries for each event is provided, with the mean and the root mean square of
the distribution under consideration shown in the fourth and fifth columns.
From the orange cells in the table, one immediately notices that the number
of underflow and overflow entries given in the last two columns are only under
a roughly reasonable control.
Let us finally note that for each selection cut, a summary table of the cut
efficiency is also given, together with the corresponding effect on the signal
over background ratio. In our toy example, we have not tagged any sample
23
as signal or background. Therefore, this feature is irrelevant here and we
refer to Section 4 for more information. The generated summary of all cuts
is provided in Table 2, where all the events are (by default) considered as
signal events.
4. Implementing analyses in an efficient and user-friendly way
4.1. Starting a MadAnalysis 5 session
The MadAnalysis 5 package is able to handle several types of Monte
Carlo samples. Supported event files can describe partonic, hadronic or reconstructed events. The key difference between these three types of events
lies in the basic objects in which the event content is expressed in terms of.
In the first case, an event consists in a set of partons (quark, gluons, charged
leptons, neutrinos, new states, etc), whilst in the second case, it consists in
hadrons (pions, kaons, baryons, etc). Finally, a reconstructed event contains
a set of high-level reconstructed objects such as electrons, muons, jets, etc.
For each of these classes of events, MadAnalysis has a specific running
mode which the user is required to specify when launching the code,
bin/ma5 [level]
Typing in a shell bin/ma5 --partonlevel or bin/ma5 -P allows us to run
MadAnalysis 5 in the mode required to analyze parton-level events, whilst
issuing bin/ma5 --hadronlevel or bin/ma5 -H makes the program running in the hadron-level mode. In a similar fashion, the two shell commands
bin/ma5 --recolevel and bin/ma5 -R allow us to start MadAnalysis 5
in a ready way to analyze reconstructed-level events. In the case no argument
is provided, as in the example of Section 3, the parton-level mode is automatically selected. Of course, the different modes cannot be combined, since the
levels of sophistication are self-excluding. Once one of the previously introduced commands is issued, the command line interface of MadAnalysis 5 is
started. It consists in a command prompt ma5> where the user can access all
the functionalities of the program and directly implement a physics analysis
by issuing a set of commands. We refer to Section 4.2 for more information
about the whole set of existing commands.
The list of commands to be typed can also be provided under the form
of a script, i.e., a simple text file. In order to execute the script, its path has
to be provided as the last argument when typing the bin/ma5 command in
a shell. Hence,
24
bin/ma5 --recolevel <filename>
starts the command interface of MadAnalysis 5 in the reconstructed-level
mode. All the commands included in the file <filename> are then sequentially applied, one after the other. When having such a script executed by
MadAnalysis 5, it can be useful to bypass all the confirmation questions
usually asked by the program. This can be done by issuing in a shell one of
the two commands
bin/ma5 --script --recolevel <filename>
bin/ma5 -s --recolevel <filename>
This script mode also enforces the automatic exit of MadAnalysis 5 after
the completion of the script <filename>, in contrast to the forced mode
described below. It is also possible to execute several scripts by providing
various filenames,
bin/ma5 -s -R <filename1> <filename2> <filename3>
The different files are handled as concatenated in one single file, i.e., all the
commands included in filename1 are processed sequentially, followed by the
commands included in filename2, etc. Let us note that the character ‘#’
can be included when writing down script files. Everything standing to the
right of this character is considered as a comment by MadAnalysis 5 and
ignored by the command line interpreter.
For highly sophisticated analyses, the features which are presented in the
rest of this section might not be sufficient. Therefore, MadAnalysis 5 can
be run in an expert mode by issuing one of the three commands
bin/ma5 --expert
bin/ma5 -e
bin/ma5 -E
The possibilities to implement any analysis are here unlimited. More information about the expert mode is provided in Section 5. Let us however note
that in this case, any other option which could be passed when starting the
interface is ignored.
Among the other options which could be provided when starting the
interpreter, one can note that the version of the distribution installed on the
system of the user can be accessed through one of the following commands,
bin/ma5 -v
bin/ma5 --version
25
bin/ma5 --release
Table 3: Syntax to launch the MadAnalysis 5 program:
bin/ma5 -h or bin/ma5 --help
This allows to display to in a shell a summary of the content of this
Table.
bin/ma5 -v , bin/ma5 --version or bin/ma5 --release
This allows to display in a shell the number of the version of MadAnalysis 5 present on the system.
bin/ma5 -f , bin/ma5 --forced
This allows to run MadAnalysis 5 in a mode where confirmation
questions are ignored.
bin/ma5 -e , bin/ma5 -E or bin/ma5 --expert
This indicates that MadAnalysis 5 has to run in expert mode. In
this case, any other option is ignored.
bin/ma5 [level] [files]
[level]
When provided, this optional argument allows to select the type of
event files to analyze. If absent, parton-level events are assumed. The
user can choose one of the following options:
-P or --partonlevel
Parton-level events.
-H or --hadronlevel
Hadron-level events.
-R or --recolevel
Reconstructed events.
[files]
When provided, this optional argument consists in a sequence of filenames, separated by blank characters, containing each a set of MadAnalysis 5 commands. The files are handled as concatenated and
the commands are applied sequentially. If the option pattern -s or
--script is included, MadAnalysis 5 exits after having executed
the script and does not ask any confirmation question.
Table 3:
26
and that typing-in
bin/ma5 -f
bin/ma5 --forced
ensures a running mode of MadAnalysis 5 where confirmation questions,
such as, e.g., those printed to the screen when a directory is about to be
removed, are not asked of the user.
The different running modes of MadAnalysis 5 and the way to cast
them are summarized in Table 3. They can also be displayed by the program
when the user types in a shell one of the following commands,
bin/ma5 --help
bin/ma5 -h
4.2. The command line user interface of MadAnalysis 5
The command line interface of MadAnalysis 5 is built upon the Python
module cmd which allows for a flexible processing of commands issued by the
user. It features, among others, text help, tab completion and shell access.
In addition, the history of commands issued by the user can be obtained by
means of the up and down keys of the keyboard. As presented in Section 4.1,
the command interface can be started by issuing in a shell the command
bin/ma5 [options]
from the directory where MadAnalysis 5 has been installed. However,
MadAnalysis 5 could also be started from any location on the computer
of the user, the command above needing only to be modified accordingly.
The user interface consists in a command prompt ma5> where the user
can implement a physics analysis very efficiently and easily by means of
a series of (case sensitive) commands. The related syntax is inspired by
the Python programming language and a command therefore always starts
with an action. Several actions can be typed together in a single command
line after separating them with a semicolumn ‘;’. The number of different
implemented actions has been made as small as possible in order to guarantee
a quick handling of the code by any physicist. Their list has been collected
in Table 4, with basic instructions about how to use each of these actions.
The information included in this table can also be displayed to the screen at
run-time by issuing
help [<action>]
27
where <action> is the action under consideration. Moreover, if help is
typed-in without any argument, the list of all the available actions is printed
out. Let us emphasize that tab completion could also be used with the aim
of obtaining that list. We now dedicate the rest of this Section 4 to a detailed
description of each of those actions.
As stated above, the history of all the actions undertaken by the user can
be accessed through the up and down keys of the keyboard, as for standard
shells. They are read from the file .ma5history stored in the directory where
MadAnalysis 5 has been unpacked. This file is updated every time that
the user types a command, and the list of the last 100 commands executed by
the interpreter is saved. In addition, if one restricts ourselves to the current
session of MadAnalysis 5, the list of typed commands can be accessed by
issuing in the command interface
history
Besides actions, the language handled by the interpreter contains objects
that actions are acting on. There exist various types of objects representing
particles, multiparticles, datasets, selection cuts or even the configuration
panel of the current session of the program, denoted by main. In addition,
any object is described by several attributes related to its properties, which
are generically denoted as options. These attributes can be accessed through
the syntax object.option.
Finally, the language of MadAnalysis 5 contains a set of reserved keywords, such as all, or or as, whose usage is described in the following. Moreover, it is important to keep in mind that both predefined and user-defined
objects have a name which has to be unique. Therefore, in an analysis, any
object which is created, such as, e.g., a new instance of the multiparticle
class, must have a name different from those of the existing actions (see
Table 4) or those of the objects already defined and/or used in the current
analysis.
The syntax introduced above has been developed with a focus on uniformization and intuition. For the sake of the example, we now focus on
the three commands display, set and remove. To display to the screen an
object denoted by <object> together with its properties, it is enough to type
the command
display <object>
28
Similarly, the display of a specific property, denoted by <option>, of the
object under consideration can be performed by issuing
display <object>.<option>
On the same footing, the value of the attribute <object>.<option> can be
easily modified via the action set
set <object>.<option> = x
where in the example above, the option under consideration is set to the
value x. Finally, an object can be deleted from the computer memory with
the help of the command remove,
remove <object>
However, three objects, the objects main, hadronic and invisible, as well
as all the particles and multiparticles currently used in the analysis, i.e.,
being related to a histogram or to a selection cut, cannot be deleted.
As already stated in the beginning of this Section, the cmd module of
Python allows for efficient access to shell commands directly from inside
the command line interface of MadAnalysis 5. This requires starting the
command line either with an exclamation mark ‘!’ or with the command
shell. Therefore, the syntax
!<command>
or equivalently
shell <command>
has to be followed in order to execute the command <command> from an
external shell.
Finally, the configuration of the command line interpreter can be restored
as for a new session of MadAnalysis 5 by issuing the command
reset
Consequently, all the user-defined particles and multiparticles as well as all
the implemented histograms and selection cuts are removed from the computer memory.
29
Table 4: Actions available from the command
line user interface of MadAnalysis 5
define <name> = <def>
display <var>
display datasets
display multiparticles
display particles
EOF
exit
generate html <dir>
generate latex <dir>
generate pdflatex <dir>
help
history
This creates a new (multi)particle label <name> defined through the (list of)
PDG-id(s) <def>.
This displays to the screen either the
properties of an object or the value of
one of its options, both generically denoted by <var>.
This displays to the screen the list of
the imported datasets.
This displays to the screen the list of
defined multiparticle labels.
This displays to the screen the list of
defined particle labels.
This closes the current session of MadAnalysis 5.
This closes the current session of MadAnalysis 5.
The report of the current analysis is
generated, under the html format, and
stored in the directory <dir>.
The report of the current analysis is
generated, under the TEX format, and
stored in the directory <dir>. Compilation requires a latex compiler.
The report of the current analysis is
generated, under the TEX format, and
stored in the directory <dir>. Compilation requires a pdflatex compiler.
This displays to the screen the list of
all the actions implemented in MadAnalysis 5.
This displays to the screen the history
of the commands typed in the current
session of the program.
30 4:
Table
Table 4 (continued): Actions available from the command
line user interface of MadAnalysis 5
import <obj>
install <obj>
plot <obs> [options]
open <rep>
preview <hist>
quit
reject (<prt>) <cond>
reject <cond>
remove <obj>
This allows to import in the current session of MadAnalysis 5 external information, generically denoted by <obj>,
such as Monte Carlo samples, a configuration used by SampleAnalyzer in
a previous analysis or a UFO model.
This allows to install the external object <obj> from the Internet. Currently, the only allowed choice for the
value of the variable <obj> consists in
the keyword samples which yields the
download of the four example samples
presented in Section 3.
This creates, in an analysis, an histogram associated to the distribution of
the observable <obs>. We refer to Section 4.5 for the list of available options.
This opens the report <rep> of a given
analysis, with the appropriate program.
This displays an histogram <hist> in a
graphical window.
This closes the current session of MadAnalysis 5.
This adds a selection cut. In an analysis, a candidate to a given particle
species <prt> is ignored if the condition <cond> is fulfilled.
This adds a selection cut. An event is
rejected if the condition <cond> is fulfilled.
This removes the object <obj> from the
memory.
31
Table 4 (continued): Actions available from the command
line user interface of MadAnalysis 5
reset
resubmit
select (<prt>) <cond>
select <cond>
set <obj>.<opt> = <val>
shell <com>
submit <dir>
swap <sel1> <sel2>
This reinitializes MadAnalysis 5 as
when a new session starts.
This allows, for an analysis which
has already been run by SampleAnalyzer and further modified, to be reexecuted.
This adds a selection cut. In order to
consider, in an analysis, a candidate to
a given particle species <prt>, the condition <cond> has to be fulfilled.
This adds a selection cut. Events are
selected only if the condition <cond> is
fulfilled.
This allows to set the attribute <opt>
of the object <obj> to the value <val>.
This allows to run the shell command
<com> from the command interface of
MadAnalysis 5. The action shell
can be replaced by an exclamation
mark ‘!’.
This allows to execute an analysis as
a job run by SampleAnalyzer. The
C++ source and header files related
to the job are created in the directory
<dir>.
This allows to permute the sequence of
two instances of the class selection,
<sel1> and <sel2>. We refer to Section 4.5 for more information.
32
Before moving on, some remarks on tab completion are in order. This
feature allows for an easy typing of commands, attributes of the objects,
etc. Typing on the ‘tab’ key has the effect of printing to the screen all the
allowed possibilities for completing the command about to be written. It
works equivalently for actions, objects and attributes. Let us emphasize that
this makes tab completion in MadAnalysis 5 much more advanced than its
counterpart in standard command shells.
4.3. Datasets
In Section 3, we have shown that four example Monte Carlo samples can
be downloaded from the Internet by employing the command install,
install samples
and stored into a directory samples of the current distribution of MadAnalysis 5. Actions, such as their gathering into datasets, the creation
of histograms and the definition of selection cuts, have been subsequently
executed on those samples. This Section is dedicated to the dataset class
of objects, whilst Section 4.5 and Section 4.6 concerns histograms and cuts,
respectively.
In order to load Monte Carlo samples into the computer memory, they
have to be imported from outside the current session of MadAnalysis 5.
This requires the use of the command import, as briefly presented in both
Section 3 and Table 4,
import <path-to-sample>
The syntax above allows us to import a Monte Carlo sample stored at a
location <path-to-sample> on the computer of the user. Several samples
can be imported at one time by employing the wildcard characters * and ?.
As a generic example, the command
import <directory>/*
imports all the samples stored in the directory <directory>. Moreover, the
tilde character ~ can be used when typing the path to a sample. As in
standard Linux shells, it points to the location of the home directory of the
user.
According to their event format, MadAnalysis 5 handles differently the
imported event samples. The key to the procedure lies in the extension of
33
the event files, up to a possible packing with gzip. The formats currently
supported are the LHE event file format, whose corresponding file extensions
are .lhe or .lhe.gz, the StdHep event file format, whose corresponding
file extensions are .hep or .hep.gz, the HepMC event file format, whose
corresponding defining extensions are .hepmc or .hepmc.gz and the LHCO
event file format, whose corresponding event file extensions are .lhco or
.lhco.gz.
Of course, all the different formats are not appropriate for any level of
sophistication of the analysis. For instance, using the parton-level mode of
MadAnalysis 5 to analyze an event file compliant with the LHCO format
is clearly inadequate. In more detail, events stored in files compliant with
the LHE format can be imported whatever is the level of sophistication of
the analysis, i.e., equally for parton-level, hadron-level or reconstructed-level
analyses. A remark is in order here. In principle, the LHE format is not
supposed to describe reconstructed events. However, there exist routines
external to MadAnalysis 5, such as the Hep2LHE converter included in
MadGraph, which allow us to efficiently convert events as produced by
hadronization algorithms or a fast detector simulation tool into reconstructed
events. Those routines use a jet algorithm in order to reconstruct light and btagged jets, and the total missing transverse energy of the event is eventually
computed. In contrast, StdHep and HepMC event files can only store
parton-level and hadron-level events, whilst complementary LHCO files can
only be used after high-level objects have been reconstructed, i.e. at the
reconstructed-level after detector simulation.
The effect of the action import is to unify all the imported samples into
one single object dubbed dataset. If nothing is specified by the user, events
are gathered together into a dataset called defaultset. The possibility to
import events and collect them into different datasets allows us, for instance,
to differentiate background event samples from signal event samples, as with
the following commands
import <path-to-signal-events>/* as signalset
import <path-to-background-events>/* as backgroundset
The first command imports all the event samples present in the directory
<path-to-signal-events> and collects them into one single dataset labeled as signalset. Similarly, the second command loads into the current session of MadAnalysis 5 all the event files located in the directory
<path-to-background-events> and gathers them together into a dataset
34
labeled as backgroundset. On the same footing, this feature can be used to
collect efficiently event files corresponding to different sources of background,
import <path-to-events>/ttbar* as ttbar
import <path-to-events>/zz* as zz
import <path-to-events>/drellyan* as drellyan
These three commands import into MadAnalysis 5 three series of samples,
related respectively to top-antitop pair, Z-boson pair and Drell-Yan events.
Three different datasets, ttbar, zz and drellyan, are created so that these
events can be treated separately when performing the analysis.
A dataset has several properties which are implemented as options of
the dataset class and whose value can be modified with the command set.
These attributes can be grouped into three categories of properties which are
summarized in Table 5.
The first category of options consists in fact in one single property which
is related to the attribute type. It allows us to tag the corresponding event
sample(s) as a part of the signal or the background. Taking the example of
a generic dataset <dataset>, the two commands
set <dataset>.type = background
set <dataset>.type = signal
tag it as a dataset belonging to the series of background or signal event
samples, respectively. By default, a dataset is always considered as of the
type signal. In an analysis, this distinction between signal and background
is mandatory for a correct (automated) computation of the cut efficiencies
by MadAnalysis 5, as well as for the corresponding derivation of the signal
over background ratio.
When creating histograms, their overall normalization is related to both
the luminosity, which can be specified by the user (see Section 4.7) and the
cross sections associated to the different datasets included in the histograms.
These cross sections are included in LHE event files and are directly read and
imported into the current session of the program, in the case LHE samples
are analyzed. In contrast, the numerical value of the cross sections are absent
from StdHep, HepMC and LHCO files. Therefore, in most of the cases,
the user has to indicate the cross section manually. Moreover, in the case of
LHE files, one could also want to modify the values which have been read.
For instance, the cross section associated to an event sample which has been
35
generated with a leading order Monte Carlo tool could be modified by the
user in order to account for next-to-leading-order normalization effects.
The second category of options related to the dataset class offers two
ways to perform the above-mentioned task, either through the weight attribute or through the xsection attribute. A weight different from one can
be assigned to each event of a dataset by modifying the value of the attribute
weight of the dataset class,
set <dataset>.weight = <weight>
The command line above leads to the assignment of a weight <weight> to
each event included in a generic dataset which has been defined as <dataset>.
Consequently, the default value of one has been superseded by the value
<weight>. In contrast, the user can also decide to leave the weight of each
event unchanged and equal to unity, and modify instead the value of the
cross section. The new value of the cross section has to be stored through
the attribute xsection of the dataset class,
set <dataset>.xsection = <value>
If the value <value> is different from the default choice of zero, MadAnalysis 5 uses it at the time of the creation of the histogram when calculating
its normalization, ignoring the value of the cross section possibly included in
the event file.
The last class of attributes associated to dataset objects concerns the
layout of the histograms generated by MadAnalysis 5, and in particular
the style of the curves associated to the datasets which can be customized.
On the one hand, styles and colors can be modified via the value of the
attributes linestyle, linewidth, linecolor, backstyle and backcolor.
On the other hand, the text used in histogram legends can be set by the user
through the attribute title. The first three attributes above are associated
to the type of lines (solid, dashed or dotted) used in the histograms, their
width and their color (blue, green, none, purple, white, black, cyan, gray,
orange, red or yellow). The two attributes backstyle and backcolor refer
to the surface under a histogram and the style (solid, dotted, or hatched
lines) and color (blue, green, none, purple, white, black, cyan, gray, orange,
red or yellow) employed when it is drawn.
The default value for the two attributes related to colors in histograms,
linecolor and backcolor, is auto. This means that MadAnalysis 5 handles the color features automatically, assigning different colors to the datasets
36
Table 5: List of the attributes of the dataset class
set <dataset>.<option> = <value>
backcolor
backstyle
linecolor
linestyle
linewidth
title
type
weight
xsection
In an histogram, this changes the color filling the surface under the curve associated to the dataset under
consideration. The allowed choices are auto (default),
blue, green, none, purple, white, black, cyan, gray,
orange, red and yellow. Integer numbers between one
and four can be added or subtracted to these values (see
Figure 3).
In an histogram, this changes the style employed when
filling the surface under the curve associated to the
dataset under consideration. The allowed choices are
auto, solid, dotted, hline, dline and vline (see Figure 4).
In an histogram, this changes the color of the line of the
curve associated to the dataset under consideration. For
the allowed choices, we refer to the attribute backcolor.
In an histogram, this changes the style of the line of
the curve associated to the dataset under consideration. The allowed choices are solid, dashed, dotted
and dash-dotted.
In an histogram, this changes the width of the line of
the curve associated to the dataset under consideration.
It takes an integer value between one and ten.
This change the string used in histogram legends for
the dataset under consideration. The possible choices
are either auto (the name of the dataset) or any string
under a valid TEX form.
This modifies the type of a dataset, associating it
to the set of either signal (signal) or background
(background) samples.
This allows to change the weight of each event included
in the dataset. The default value is one.
This allows to modify the total cross section associated
to the events included in the dataset under consideration. The value can be any real number.
37 5:
Table
+4
+3
+2
+1
black
white
gray
yellow
blue
red
green
purple
cyan
orange
-1
-2
-3
-4
Figure 3: Complete list of allowed choices for the values taken by the attributes backcolor
and linecolor of the dataset class.
created by the user. For a specific dataset object denoted by <dataset>, the
values of the two color attributes can be, as usual, superseded by employing
the command set,
set <dataset>.linecolor = <color>
set <dataset>.backcolor = <color>
The supported values for the variable <color> are intuitive and read auto,
blue, green, none, purple, white, black, cyan, gray, orange, red or
yellow. For histograms employing a large number of datasets, this panel
of colors might however be insufficient. Shades of these basic colors can be
used by adding or subtracting an integer number between one and four to
those colors. For instance, the set of commands
set
set
set
set
<dataset1>.backcolor
<dataset2>.backcolor
<dataset3>.backcolor
<dataset4>.backcolor
=
=
=
=
red+1
red+2
red+3
red+4
allows us to assign four different shades of red to the four datasets <dataset1>,
<dataset2>, <dataset3> and <dataset4>. Consequently, when a stacked
histogram containing these four datasets is drawn, the associated surfaces will
all be filled with different colors derived from the basic red. The complete
list of colors integrated in MadAnalysis 5 is illustrated in Figure 3.
The style of the lines of the curves drawn in the histograms can be modified through the attribute linestyle of the dataset class,
set <dataset>.linestyle = <value>
38
solid
dotted
hline
dline
vline
Figure 4: Complete list of styles allowed for the values possibly taken by the attribute
backstyle of the dataset class.
This command changes the default employed solid style to the value <value>,
which can be either solid, dashed, dotted or dash-dotted. Similarly, the
attribute linewidth allows us to change the width of the drawn lines,
set <dataset>.linewidth = <value>
where <value> is an integer number between one and ten, the default value
being unity. The option backstyle of the dataset class is linked to the style
employed to fill the surface under a histogram and can be set to a new value
by issuing in the command line interface
set <dataset>.backstyle = <value>
The allowed choices for the parameter <value> are either the default value
auto or solid, dotted, hline, dline or vline, as presented in Figure 4. The
last three choices, less intuitive, stand for horizontal, diagonal and vertical
lines, respectively.
Finally, when creating a histogram where the curves related to several
datasets are stacked or superimposed, MadAnalysis 5 includes a legend
with the explanation of the color/style code employed to distinguish the
datasets. By default, the name of the dataset is used in this legend, but
this can be modified by the user once setting the attribute title to a string
consisting of a valid TEX expression,
set <dataset>.title = <string>
where <string> could stand, e.g., in the case of a dataset describing events
related to the production of a pair of W -bosons, for "W^{+} W^{-}" (including the quotation marks).
The effects of the customization of the histograms are only taken into
account when the reports containing the results are generated. Therefore,
39
the user does not have to issue the command submit each time he modifies
the style of a curve or how the area under a curve is filled inside a histogram.
Before moving on, let us recall that the command display datasets
introduced in Table 4 allows us to display to the screen the list of all the
instances of the dataset class which have been created in the current session
of MadAnalysis 5. Furthermore, the action display can also be used on
datasets. This leads to the printing to the screen of the current values of
all the attributes of a given dataset. Hence, for a dataset labeled by ttbar
where no attribute has been modified by the user, the effect of the command
display ttbar
is to print to the screen the following pieces of information,
Name of the dataset = ttbar (signal)
Title = ’ttbar’
User-imposed cross section = 0.0
User-imposed weight of the set = 1.0
Line color in histograms = auto
Line style in histograms = solid
Line width in histograms = 1
Background color in histograms = auto
Background style in histograms = solid
List of event files included in this dataset:
- ttbar.lhe.gz
This indeed summarizes the status of the instance of the dataset class labeled ttbar and displays the value of all the options.
Finally, a dataset can be deleted from the memory of the computer by
employing the command remove. If several event files are included in a single
dataset, it is however not possible to remove a particular file. In this case,
the whole dataset has to be removed and then recreated without including
this file.
4.4. Particles and multiparticles
When starting a session of MadAnalysis 5, lists of predefined particle
and multiparticle labels are loaded into the memory, as it is mentioned in
the example of Section 3. These lists are taken from the content of the directory madanalysis/input which contains several files with label definitions.
40
Not all the files present in this directory are loaded when a new session of
MadAnalysis 5 starts. Indeed, according to a running with the aim of analyzing parton-level, hadron-level or reconstructed-level events, only some of
the files are appropriate, and only these are imported when MadAnalysis
5 is launched.
For parton-level analyses, the particle labels are imported from the file
particles name default.txt whilst the multiparticle labels are read from
the file multiparticles default.txt. These two files contains standard
names for the Standard Model and the Minimal Supersymmetric Standard
Model particles (e.g., an antimuon is denoted by mu+ and the lightest neutralino by n1) as well as appropriate definitions for the multiparticles hadronic
and invisible (see below). For hadron-level analyses, only a single file with
a list of 415 hadrons (see Ref. [59]), hadron default.txt, is imported. Finally, for analyses at the reconstructed-level, the two lists reco default.txt
and multiparticles reco default.txt are imported. They contain labels
for high-level reconstructed objects necessary for such a level of sophistication of the Monte Carlo simulations. The set of predefined labels is rather
short and consists of e+, e-, mu+, mu-, ta+, ta- for charged leptons, and
j and b and nb for jets, b-tagged jets and non-b-tagged jets. In addition,
several (intuitive) multiparticle labels are included, e, mu, ta, l+, l- and
l for various combinations of charged leptons, as well as two special labels
dedicated to muons and antimuons, mu- isol and mu+ isol, in case they are
isolated.
Let us note that if MadAnalysis 5 has been installed in the directory
where MadGraph 5 is unpacked, the predefined particle and multiparticle labels are directly imported from MadGraph 5 rather than from the
directory madanalysis/input of MadAnalysis 5.
Two multiparticles, denoted by the labels invisible and hadronic, have
a special role and are essential in any analysis. They are respectively related to the computation of observables related to the missing energy and
to the hadronic activity. Therefore, if they are not included in the imported
files, they are automatically created by MadAnalysis 5 when a new session
starts. Moreover, their special role prevents them from being deleted with
the command remove.
Full support is also offered to load entire UFO models [39]. The UFO
format is automatically detected by MadAnalysis 5 so that, in order to
load the model, it is enough to issue in the interpreter
41
import <path-to-UFO-files>
where <path-to-UFO-files> is the location of the UFO model under consideration. The list of particle labels is derived from the particles.py file
containing the UFO implementation of the particles of the model. Moreover,
any stable, electrically and color neutral particle, with the exception of the
photon, is automatically added to the invisible multiparticle object.
As already presented in Section 3 and in Table 4, the command interpreter
of MadAnalysis 5 contains two actions for printing to the screen the list
of all the particle and multiparticle labels which have been defined in the
current session,
display_particles
display_multiparticles
Moreover, as for any instance of any class, the properties of a given particle
or multiparticle object can be obtained with the action display,
display <label>
where <label> is the label of the (multi)particle under consideration. The
effect of the command above is to print to the screen, in the case of a particle,
the PDG-id linked to the label <label>. Similarly, for multiparticle labels,
the whole list of associated PDG-ids is displayed.
As already shown in Section 3 where we have taken the example of muons
and antimuons, new particle and multiparticle labels can be created, according to the needs of the user, by means of the command define,
define <label> = <identifiers>
The command above creates a label denoted by <label> and associates to it
the content of the parameter <identifiers>. If the value of <identifiers>
consists in one single integer number, a new particle label related to the
corresponding PDG-id is created. In the case we have either several integer
numbers separated by spaces or several other particle and multiparticle labels
separated by spaces, a new multiparticle label is created and linked to the list
of corresponding PDG-ids. The define command also allows for redefining
existing labels or to add extra (multi)particles to a definition. In this last
case, the user is allowed to issue commands such as, e.g.,
define <label> = <label> <identifiers>
42
The effect of the command above is to add the particle(s) contained in the
variable <identifiers> to the definition of the label <label>.
Even if, in principle, the user is allowed to choose any name for the labels
to be created, MadAnalysis 5 contains a set of reserved keywords that
cannot be used as labels, such as the symbols all, or and and (see below).
In addition, the names of the different actions (see Table 4) cannot be used
for (multi)particle labels.
At any time, a label not already used for the definition of a histogram or
of a cut can be deleted from the memory of the computer by issuing
remove <label>
where the label to be deleted is denoted by <label>. Due to their particular
nature, the labels hadronic and invisible however can never be removed.
4.5. Creating histograms
There are two types of observables that can be represented as histograms
by MadAnalysis 5, global observables (see Table 7), related to the entire
event content, and observables related to a given type of particle (see Table
8), thus specific to only a part of the event. In addition, a few additional
observables are dedicated to analyses at the reconstructed-level and are collected in Table 9.
We first address the description of the global observables. Two of them
are related to the missing energy. The corresponding symbols implemented
in MadAnalysis 5 are denoted by MET and MHT and correspond to the
/ T and the missing hadronic transverse energy
missing transverse energy E
/
H T , respectively. The definitions of these two quantities are not unique in
the literature, and we decide to adopt the choice
/T =
E
X
p~T
and
/T =
H
X
p~T
,
(1)
hadronic particles
visible particles
where ~pT stands for the particle transverse momentum. At the parton-level,
the generic name hadronic particles stands for gluons and light and b-quarks,
but not for top quarks (decaying most of the time to a W -boson and a
b-quark). At the hadronic-level and reconstructed-level, hadronic particles
are trivially hadrons and jets, respectively. These definitions are related to
the default values of the multiparticle labels hadronic and invisible. We
43
remind that the latter can be modified by the user by means of the command
define (see Section 4.4).
Even if particle objects are not explicitly tagged as visible, any noninvisible object, i.e., an object whose PDG-id is not included in the definition of the label invisible, is considered by MadAnalysis 5 as visible.
Similarly, any object which is not tagged as hadronic is considered as nonhadronic.
/ T , a remark is in order. DetecConcerning the missing transverse energy E
tor simulation tools are in general internally computing the missing energy,
following a built-in definition which might be different from the one of Eq.
(1). This value is stored under a special tag in the event files, compliant with
the LHCO format relevant for analyses at the reconstructed-level. When
this is read by MadAnalysis 5, the value of the missing transverse energy
is subsequently imported and always supersedes the one which would have
been computed by employing Eq. (1).
Parallel to those observables related to the invisible sector of the events,
two important global observables are related to the visible objects, the total transverse energy ET and the total transverse hadronic energy HT . In
MadAnalysis 5, these kinematical quantities are defined by
X
X
ET =
p~T
and
HT =
~pT ,
(2)
visible particles
hadronic particles
and are associated to the symbols TET and THT, respectively.
Creating histograms associated to the four variables introduced above
follows the standard syntax of the command plot,
plot <observable> <nbins> <min> <max>
where the value of the variable <observable> corresponds here either to MET,
MHT, TET or THT. The number of bins, the value of the lowest bin and the
one of the highest bin are optional information which can be passed through
the symbols <nbins>, <min> and <max>, respectively. If left unspecified,
MadAnalysis 5 uses built-in values.
The effect of the command plot is to create a new instance of the class
selection which has been designed to handle histograms (and cuts, as it is
shown in Section 4.6). The labeling of the selection objects is internally
handled by MadAnalysis 5.The first time that the command plot is issued
in the current session of MadAnalysis 5, the label selection[1] is assigned
44
to the corresponding histogram. The second occurrence of the command plot
leads to the creation of the object selection[2], and so on. The full list of
instances of the selection class which have been created can be displayed
to the screen with the display command,
display selection
As for particle and multiparticle labels, typing in the interpreter
display selection[<i>]
allows us to display the properties of the <i>th created selection object.
This <i>th selection can always be deleted from the memory of the computer
with the action remove,
remove selection[<i>]
After the removal of a specific selection, the numbering of the different created selections is automatically adapted by MadAnalysis 5 so that the
sequence of the integer numbers is respected, without any hole. Even if handled automatically, the ordering of the selections can be modified by the user
by means of the command swap. Issuing
swap selection[<i>] selection[<j>]
results then in the exchange of the <i>th and <j>th instances of the selection
class.
Objects of the selection class have several attributes, as shown in Table
6. In this section, we however only focus on selection objects related to
histograms. In the case of cuts, we refer to Section 4.6. The number of bins,
the value of the lowest bin of a histogram and the one of its highest bin are
stored in the attributes nbins, xmin and xmax, respectively. Their values are
fixed at the time the command plot is issued in the interpreter. They can
however be further modified by the use of the command set, as for any other
attribute of an object, by typing in the command interface, e.g.,
set selection[<i>].xmax = 100
This command allows us to set the value of the highest bin of the histogram
associated to the object selection[<i>] to 100.
Two of the other attributes of the selection class are related to the
scales used when drawing the axes of the histograms. By default, a linear
45
Table 6: List of the attributes of the selection class
logX
If set to true, this enforces a logarithmic scale for the
x-axis. If set to false (default), a linear scale is used.
logY
If set to true, this enforces a logarithmic scale for the
y-axis. If set to false (default), a linear scale is used.
nbins
Number of bins of the histogram. The value taken by
this attribute must be an integer.
rank
This refers to the observable to be used for ordering
particles of the same type. The value of this option
has to be anything among ETAordering (pseudorapidity ordering), ETordering (transverse-energy ordering),
Eordering (energy ordering), Pordering (momentum
ordering), PTordering (transverse-momentum ordering,
the default choice), PXordering (ordering according to
the x-component of the momentum), PYordering (ordering according to the y-component of the momentum)
or PZordering (ordering according to the z-component
of the momentum).
stacking method
.
When several datasets are represented on an histogram, the different curves can be stacked (stack),
superimposed (superimpose) or normalized to unity
(normalize2one), including superimposing. The default value is auto and then refers to the properties of
the attribute stacking method of the object main (see
Section 4.7).
statuscode By default, only final state particles are considered in
histograms. This attribute allows us to consider instead initial or intermediate particles, or all the particle
content. The (intuitive) allowed values are allstate,
initialstate, finalstate (default) and interstate.
titleX
The title of the x-axis of the histogram, given as a string.
titleY
The title of the y-axis of the histogram, given as a string.
xmin
Central value of the lowest bin of the histogram. This
must be a real number.
xmax
Central value of the highest bin of the histogram. This
must be a real number.
46 6:
Table
scale is employed. Logarithmic scales can be enforced through the boolean
attributes logX and logY which can then take the values true or false
(default choice). For instance, issuing
set selection[<i>].logY = true
set selection[<j>].logX = false
ensures the usage of a logarithmic scale for the y-axis of the histogram related
to the object selection[<i>] and the one of a linear scale for the x-axis of
the histogram associated to the object selection[<j>].
Another important attribute related to the layout of the histograms concerns the stacking method used for the curves related to the different datasets
created by the user. By default, the curves are drawn as stacked one above
each other, but this can be modified through the attribute stacking method
of the class selection. For instance, focusing on the object selection[<i>],
the command
set selection[<i>].stacking_method = <value>
allows us to change the employed stacking method to the value <value>.
By default, this attribute is set to the value auto. This means that the
value of the attribute stacking method of the object main (see Section
4.7) is employed. The other allowed choices are stack, superimpose and
normalize2one. In the first case, the curves are all stacked, whilst in the
second case, they are superimposed. The last possibility for the attribute
stacking method, i.e., normalize2one, has been designed for comparing
the shapes of the curves related to the different datasets. Here, the normalization of each curve is set to one and they are drawn superimposed. Let us
note that this consists in a helpful feature when optimizing selection cuts.
To achieve the description of the functions allowing us to tune the layout
of a histogram, the user is allowed to change the titles of the x-axis and y-axis
by means of the attributes titleX and titleY of the selection class,
set selection[<i>].titleX = <string>
set selection[<i>].titleY = <string’>
The effect of the commands above leads to the use of the strings <string>
and <string’> as titles for the x-axis and y-axis of the histogram represented
by the object selection[<i>], respectively.
The attributes of an instance of the selection class related to a histogram can also be directly set when issuing the command plot,
47
Table 7: List of the global observables that can
be represented by a histogram
NAPID The particle multiplicity of the events after mapping particles
and antiparticles.
NPID The particle multiplicity of the events.
MET
The missing transverse energy as defined in Eq. (1). At the
reconstructed-level, the missing energy is however directly
read from the LHCO file.
MHT
The missing transverse hadronic energy as defined in Eq. (1).
SQRTS Partonic center of mass energy. Only available for parton-level
and hadron-level event samples.
TET
The visible transverse energy as defined in Eq. (2).
THT
The visible transverse hadronic energy as defined in Eq. (2).
Table 7:
plot <observable> <nbins> <min> <max> [options]
The optional pattern [options] stands for logX, logY, stack, superimpose,
normalize2one or the value of any of the other attributes presented below,
statuscode and rank. Multiple keywords are allowed (however only one for
each attribute). In this way, the values of several options can be passed at one
time, each separated by a space character. For instance, creating a histogram
representing the visible transverse hadronic energy with a y-axis represented
with a logarithmic scale and where all the curves are drawn superimposed
can be done by issuing the command
plot THT [logY superimpose]
The binning is then automatically handled by MadAnalysis 5, since it is
not provided by the user.
/ T , HT and H
/ T inIn addition to the kinematical global observables ET , E
troduced in the beginning of this Section, the partonic center-of-mass energy
can be represented by a histogram by typing the command
plot SQRTS
Finally, two other global observables are available. The latter are related
to the particle multiplicity of the events. In order to draw the associated
histograms, it is enough to enter in the command interface the two commands
48
plot NPID
plot NAPID
The first command, plot NPID, generates a histogram where one bin is associated to each possible type of final-state particle, the height of the bin being
related to the multiplicity of the corresponding particle within the whole
sample. Hence, if several particles of the same type are present in one specific event, they correspond to several entries in the histogram. The second
command above, plot NAPID, produces a similar histogram after mapping
antiparticles and particles. For both types of histograms, the labels of the
x-axis correspond to the particle label imported in MadAnalysis 5. If nonexisting, the PDG-ids are used instead. We emphasize that these histograms
are special histograms dedicated to the task of getting an idea about the
particles present in the input sample. To compute the multiplicity of a given
particle species, we refer to the observable N described below.
The second large class of observables that can be represented by histograms in MadAnalysis 5 refers to the kinematical properties of the particles contained in the events. Hence, distributions such as the invariant mass
or the transverse momentum of given particle species can be computed. The
complete list of implemented observables can be found in Table 8.
Creating histograms associated to a given property <observable> of a
specific particle represented by the label <label> is also based on the command plot. In this case, the syntax is however slightly different as for the
global observables. The symbol <observable> has to be seen as a function which takes as the argument the label associated to the particle under
consideration,
plot <observable>(<label>)
For instance, if mu+ stands for the particle label related to antimuons, the
command
plot PT(mu+)
results in representing by a histogram the transverse-momentum distribution of all the antimuons in the sample. As above, if several antimuons are
included in one single event, they contribute to several entries in the histogram. In the case of the relative distance between two particles (denoted
by DELTAR), two particle labels <label1> and <label2> are required,
49
Table 8: List of the kinematical observables that can
be represented by histograms
BETA
Velocity β = v/c.
DELTAR
Relative distance between two objects in the η−φ plane.
E
Energy.
ET
Transverse energy.
ETA
Pseudorapidity.
GAMMA
Lorentz factor.
M
Invariant mass.
N
Particle multiplicity.
MT
Transverse mass.
P
Norm of the momentum.
PHI
Azimuthal angle of the momentum.
PT
Norm of the transverse momentum.
PX
Projection of the momentum on the x-axis.
PY
Projection of the momentum on the y-axis.
PZ
Projection of the momentum on the z-axis.
R
Position of the object in the η − φ plane.
THETA
Angle between the momentum and the beam axis.
Y
Rapidity.
Table 8:
plot DELTAR(<label1>, <label2>)
As illustrated above, when studying the kinematical properties of a given
particle species, the normalization of the histograms reflects the total number
of particles of this type included in the full sample. This can be different
from the total number of events, since one single event could describe a final
state with zero, one or several particles of the considered type, which then
corresponds to zero, one or several entries in the produced histograms3 .
The syntax detailed above is also valid for multiparticle objects. In this
case, the label <label> is related to an instance of the multiparticle class.
Histograms are created by treating on the same footing all the particles linked
3
In this Section, we do not consider the luminosity which also affects the normalization
of the histograms. This feature is described in more detail in Section 4.7.
50
to the label <label>. For example, the set of commands
define <multi> = <particle1> <particle2>
plot <observable>(<multi>)
defines, in a first step, a multiparticle label denoted by <multi> and linked
to the particle species <particle1> and <particle2> (see Section 4.4). In
a second step, a property represented by the observable <observable> is
investigated. For a specific event, each particle of the type <particle1> or
<particle2> is associated to one entry in the histogram.
As shown above, if several particles of the considered type appear in a
specific event, they always correspond to several entries in the histograms. In
phenomenological analyses, it is however often more relevant to only consider
the leading particle, i.e., the one which has the highest value of a kinematical variable such as the transverse momentum or the energy. The squared
brackets ‘[ ]’ allow us to access leading, next-to-leading, etc, particles. For
instance, the histogram resulting from the command
plot <observable>(<label>[<i>])
represents the distribution of the observable <observable> for the particle of
the type <label> with the <i>th largest transverse momentum, <i> being a
positive integer. Similarly, a negative value of the parameter <i> corresponds
to a pointer to the particle with the <i>th smallest transverse momentum.
Events where the number of particles of the type under consideration is
smaller than the absolute value of <i> are ignored at the time of the creation
of the histogram.
By default, the ordering variable employed in MadAnalysis 5 is the
transverse momentum. Other possible choices exist and the information is
passed, for a given histogram, through the value of the attribute rank of the
selection class. Hence, considering the instance of the class selection[<i>],
one can modify the ordering variable by issuing
set selection[<i>].rank = <value>
The parameter <value> can take any value among ETAordering (pseudorapidity ordering), ETordering (transverse-energy ordering), Eordering (energy ordering), Pordering (momentum ordering), PTordering (transversemomentum ordering), PXordering (ordering according to the x-component
of the momentum), PYordering (ordering according to the y-component of
51
the momentum) and PZordering (ordering according to the z-component of
the momentum).
For all the histograms produced so far, MadAnalysis 5 only uses information related to the final-state particles. However, for phenomenological
purposes, it is often interesting to investigate the properties of the intermediate particles or those of final-state particles issued from the decays of
a specific type of intermediate particle. This requires, of course, that the
relevant information is available. This is not the case for event samples at
the reconstructed-level since these features are totally absent from event files
under the LHCO format. In contrast, the user can access, for hadron-level
or parton-level event files, to the whole particle history by a set of motherto-daughter relations. To benefit from those relations, there exist two special
functions in MadAnalysis 5.
Firstly, the symbol ‘<’ links one particle or set of particles to their direct
mother. The command line
plot <observable>(<type1> < <type2>)
allows us hence to study a given property, which is represented by the symbol
<observable>, of the particles of type <type1> included in the final state of
the events under consideration. However, in order to correspond to an entry
in the histogram, the particles of type type1 must be issued from the direct
decay of a particle of type <type2>. Doubling the symbol ‘<’, i.e., replacing
it by ‘<<’, allows us to remove the restriction of a direct decay. Finally, the
usage of these symbols recursively
plot <observable>(<type1> < <type2> << <type3>)
allows us to focus on entire decay chains. Here, we investigate the properties
of the particle species <type1>, but only for particles of type type1 issued
from a direct decay of a particle of type <type2>, which is itself issued from a
decay of a particle represented by the label <type3>, this last decay possibly
occurring in several steps.
Secondly, kinematical properties of the intermediate particles can be directly investigated through the option statuscode of the selection class.
As suggested above, by default, only final-state particles are considered. This
corresponds to the value finalstate of the attribute statuscode. Issuing
in the interpreter
set selection[<i>].statuscode = interstate
52
indicates that, for the selection selection[<i>], we are not considering
final-state particles anymore, but only intermediate states. On the same
footing, setting statuscode to the value initialstate allows us to focus
on the initial-state particles only, whilst setting it to allstate allows us
to consider equivalently initial-state, final-state and intermediate-state particles.
Key observables to design efficient selection cuts in an analysis are in
general related to more than one single particle. For instance, highlighting
a new Z ′ gauge boson in Drell-Yan events and estimating its mass with a
good accuracy rely on the invariant-mass distribution of the produced lepton
pair. All the functions of Table 8, but the DELTAR observable which requires
exactly two arguments, can take an arbitrary number of arguments. This
allows us to combine particles before computing the kinematical distribution
to be represented. Hence, the two equivalent command lines
plot <observable>(<prtcl1> <prtcl2>)
plot v<observable>(<prtcl1> <prtcl2>)
lead to the creation of a histogram showing the distribution of the observable <observable>. The observable is computed on the basis of the combined four-vector built from the sum of the four-momentum of the particles
<prtcl1> and <prtcl2>. The optional prefix ‘v’ indicates that the fourmomenta are combined vectorially (other options are shown below). If, for a
given event, several pairs of particles <prtcl1> and <prtcl2> can be formed,
each possible pair leads to one different entry in the histogram. Hence, the
histogram describing the invariant mass of a muon pair can be created by
issuing
plot M(mu+ mu-)
where, as before, the binning is automatically handled by MadAnalysis 5.
The observable that is computed corresponds to the norm of the sum of the
four-momentum of the muon and the one of the antimuon. This syntax can
straightforwardly be generalized to multiparticles or to combinations of more
than two particles. A remark is however in order here. If <multi> denotes
the label associated to an instance of the multiparticle class, issuing
plot <observable>(<multi> <multi>)
53
generates a histogram where each entry corresponds to one different combination of the particles represented by the multiparticle <multi>. MadAnalysis 5 indeed forbids double-counting any combination.
By default, the particles are combined by adding vectorially their fourmomentum, i.e.,
X
pµ =
piµ ,
i
where pµ is the resulting four-momentum and piµ are the four-momenta of
the particles to be combined. The four-vector pµ is the one which is used
when computing the value of the observable to be represented on the corresponding histogram. MadAnalysis 5 offers additional ways to perform this
combination. The sum could be, in contrast, done scalarly, i.e., by firstly
computing the considered observable for each of the particles to be combined
and secondly adding the results. To select this option, the user must add a
prefix ‘s’ in front of the name of the observable when typing the command
in the interpreter,
plot s<observable>(<prtcl1> ...)
where the dots stand for the list of particles to be combined. In the case the
user wants to combine all particles of a given type <prtcl> in an event, the
reserved keyword all can be used in order to simplify the syntax,
plot <observable(all <prtcl>)
If two (and only two) particles are combined, differences can also be computed, rather than sums. To allow for this option, it is enough to include
one of the the prefixes ‘dv’, ‘vd’, ‘d’, ‘ds’, ‘sd’ or ‘r’ in front of the symbol
of the observable to be computed. For the options ‘dv’, ‘vd’ and ‘d’, vectorial differences are considered. Hence, the result of one of the equivalent
commands
plot dv<observable>(<prtcl1> <prtcl2>)
plot vd<observable>(<prtcl1> <prtcl2>)
plot d<observable>(<prtcl1> <prtcl2>)
is to subtract the two four-momenta from each other,
pµ = p1µ − p2µ ,
54
Table 9: List of the additional observables that can
be represented by histograms for reconstructed events
EE HE
Ratio of the electromagnetic and hadronic energy for a
given object.
HE EE
Ratio of the hadronic and electromagnetic energy for a
given object.
NTRACKS
Number of tracks in a jet. This returns zero for non-jet
objects.
Table 9:
p1µ being the four-momentum of the particle associated to the label <prtcl1>
and p2µ the one of the particle associated to the label <prtcl2> and then
compute the observable <observable> from the resulting four-vector pµ . In
the case of the prefixes ‘ds’ and ‘sd’,
plot ds<observable>(<prtcl1> <prtcl2>)
plot sd<observable>(<prtcl1> <prtcl2>)
scalar differences are computed, i.e., the observable <observable> is computed for each of the particles <prtcl1> and <prtcl2> and the results are
subtracted from each other. Relative differences can also be computed by
means of the prefix ‘r’,
plot r<observable>(<prtcl1> <prtcl2>)
In this case, the results consist in the scalar difference of the values of the
observable computed for the two particles <prtcl1> and <prtcl2> taken
individually, which is however given relative to the value of the observable
for the first particle represented by the label <prtcl1>. This corresponds
then to the quantity
<observable>(<prtcl1>) − <observable>(<prtcl2>)
.
<observable>(<prtcl1>)
If the considered observable vanishes for the particle labeled by <prtcl1>,
the value zero is returned.
A final way for combining observables is related to the reserved word
and. When the considered observable has to be evaluated for several possible
55
combinations of particles, the user can use the keyword and to efficiently
implement the corresponding command in MadAnalysis 5,
plot <observable>(<p1> <p2> and <p3> <p4>)
The command line above computes the observable represented by the symbol
<observable>, firstly, for the vectorial combination of the particles <p1> and
<p2> and secondly, for the vectorial combination of the particles <p3> and
<p4>. The two distributions are eventually summed.
Three additional observables can be represented by histograms in the
case of fully-reconstructed objects. To allow for generating histograms for
these observables, MadAnalysis 5 must be run in the reconstructed-level
mode. These observables consist of the ratio between the hadronic and the
electromagnetic energy for a given object (the ratio between the energy deposited in the electromagnetic and hadronic calorimeters of a detector), the
inverse ratio and the number of tracks within a (reconstructed) jet. For objects different from a jet, this last observable always returns the number zero.
The associated symbols are HE EE, EE HE and NTRACKS and their definitions
are collected in Table 9. The corresponding histograms can be created by
following the usual syntax,
plot <observable>(<label>)
Let us note that for these three observables, combining objects is not supported, i.e., only one single (multi)particle label can be passed as an argument.
4.6. Selection cuts
In MadAnalysis 5, the process of event selection is based on two equivalent classes of kinematical cuts which can be applied to the imported datasets.
The program offers to the user the two choices of either selecting or rejecting
events in the case a certain condition is fulfilled. This task can be performed
at the level of the command line interpreter of the program by means of the
two actions select and reject. The associated syntax is very intuitive and
reads
select <condition> [<options>]
reject <condition> [<options>]
For the first (second) command, events are selected (rejected) if the condition
<condition> is satisfied. Hence, the command
56
reject PT(mu) > 50
leads to the rejection of all the events where at least one muon with a transverse momentum pT > 50 GeV is found, whilst issuing
select M(e+ e-) > 100
allows for the selection of all the events where we have a electron-positron
pair with an invariant mass larger than 100 GeV. Internally, the effects of the
commands above are to create instances of the selection class with special
properties. Contrary to the command plot which is related to the creation
of histograms, the commands select and reject lead to the production of
tables of cut efficiencies. Consequently, the only attributes of the selection
class which are relevant are rank and statuscode (see Table 6). They can
be either passed directly at the time of typing-in the commands, by including
the desired values as the optional parameter <options> above, or at a later
stage by means of the command set (see Section 4.5).
Modifying the rank attribute only plays a role if the ordering of the
particles is necessary information for a good application of the condition, as
e.g., if we are constraining some observable related to the leading or nextto-leading particles. Furthermore, setting the option statuscode to a nondefault value allows us to apply, if needed by the user, cuts on initial or
intermediate states rather than on final states only.
The condition <condition> must be given according to the pattern
<observable> <logical-operator> <value>
where the observable <observable> can be any observable from Tables 7, 8
and 9, computed for a given particle or for any combination of particles, with
the exception of the global variables related to the symbols NPID and NAPID4 .
The supported logical operators are ‘>’ (greater than), ‘>=’ (greater than or
equal to), ‘<’ (smaller than), ‘<=’ (smaller than or equal to), ‘==’ (equal to)
and ‘!=’ (different from).
Conditions can also be combined by using one or several of the connecting
keywords and (logical and ) and or (logical inclusive or ), such as in
<cond1> <connector1> <cond2> <connector2> <cond3>
4
To implement selection cuts on the multiplicity of a given particle species, cuts on the
observable N have to be performed, rather than on the global observable NPID and NAPID.
57
The condition above consists of the combination of the three conditions
<cond1>, <cond2> and <cond3> by employing the two connecting keywords
<connector1> and <connector2> being and or or. Moreover, brackets are
also authorized by the syntax for handling more complex conditions. In the
special case both upper and lower limits are imposed on a given observable, the condition can be easily implemented by means of the keyword and.
However, there exists a more compact syntax
<value1> <logical-operator> <obs> <logical-operator> <value2>
which could be employed. The logical operator <logical-operator> is here
used twice. The parameter <obs> denotes the observable and <value1> and
<value2> the imposed bounds.
So far, we have supposed that all the objects present in each event can
be used for applying selection cuts. However, this is barely the case in most
realistic phenomenological analyses, since, for example, too soft particles
are in general omitted. This feature can also be implemented in analyses
performed with MadAnalysis 5 by means of the commands select and
reject, but following a slightly different syntax as the one shown before,
select (<particle>) <condition> [<options>]
reject (<particle>) <condition> [<options>]
The commands above allow us to respectively select and reject any particle
associated to the label <particle>, if the condition <condition> is fulfilled.
The syntax for typing-in the condition is similar to the one employed for
implementing conditions associated to the selection or rejection of events,
with the difference that the observable entering the condition cannot here
take any argument and must simply be one of the symbols presented in
Tables 8 and 9.
In the case the particle candidate is rejected, the event is considered
as without containing this particle. Let us note that whilst selecting and
rejecting events have a direct influence on the signal over background ratio,
selection or rejecting candidates to a particle type only affects the number
of entries for one event in the histograms.
4.7. Executing an analysis and displaying the results
Once an analysis has been implemented, it must be passed to SampleAnalyzer, the C++ kernel of MadAnalysis 5, for execution by means of
the command
58
submit <dirname>
A directory named dirname is created and all the files necessary for SampleAnalyzer to properly run are generated and included in this directory. The
code is further compiled and linked to the external static library of MadAnalysis (see Section 3.1), and the execution of the resulting program is
eventually managed by MadAnalysis 5.
This execution starts with the reading of the event samples under consideration and their storing in the memory of the computer according to a
format internal to MadAnalysis 5. All the histograms required by the user
are then sequentially created, including the application to all the events of the
defined selection cuts. As an output, a Root file [57] is generated so that the
analysis can be accessed later, as, e.g., directly in the Root framework or in
a new session of MadAnalysis 5. In this last case, the SampleAnalyzer
(executed) job can be imported by means of the command import
import <dirname>
where the directory <dirname> contains the analysis previously performed.
After modifications such as asking for the creation of a new histogram
or the application of a new selection cut, the user does not have to submit
the SampleAnalyzer job entirely again. A much faster option, saving a
sensible amount of computing time, consists in the command
resubmit
This updates the already existing SampleAnalyzer directory and only the
differences with respect to the original analysis are executed.
Once the Root file has been created by SampleAnalyzer, the command preview allows for the display of a single histogram,
preview selection[<i>]
where in the generic example above, the <i>th histogram is asked to be
displayed to the screen, in a Root popup window. The command preview
only works for displaying histograms. Consequently, previewing the efficiency
table associated to a selection cut is not possible.
A more complete report, with all the selection cuts, efficiency tables and
histograms can be generated by issuing in the command line interface one of
the three commands
59
generate_html <html-dirname>
generate_latex <tex-dirname>
generate_pdflatex <pdftex-dirname>
The first command, generate html, generates the report under the html
format and stores the files in the directory <html-dirname>. The second and
third commands, generate latex and generate pdflatex, are related to
the creation of TEX files to be compiled with the help of the shell commands
latex and pdflatex, respectively. In these two cases, the TEX files are
already compiled by MadAnalysis 5, if the latex and pdflatex commands
are available on the system of the user.
Histograms are exported to (non-Root) figures under either the Encapsulated PostScript (.eps) format, required for a proper compilation with
latex, or to the Portable Network Graphics (.png) format for html files or
TEX files to be compiled with pdflatex. In addition, each figure is also saved
as a Root macro which can be modified by the user for further processing.
Once generated, the report can be immediately displayed by typing-in the
command
open <report-dirname>
which opens the report in a web browser.
The analysis, and thus the generation of the histograms and the efficiency tables, is so far based on the default configuration of MadAnalysis
5. This configuration can be modified by superseding the default values of
the attributes of the object main, which are listed in Table 10 and Table 11.
Two options allow us to control the normalization of the histogram, lumi
and normalize. This last attribute defines the way the histograms are normalized. The allowed values are none, lumi and lumi weight and can be set
as for any other attribute of any class,
set main.normalize = <value>
For the first choice (<value> = none), the total number of events included
in each dataset is kept. The two other options imply that the histograms
are normalized with respect to the integrated luminosity. The difference
lies in the weight which can be possibly associated to each event (see Section 4.3), which can be ignored (<value> = lumi) or included (<value> =
lumi weight). This last possibility consists in the default choice.
60
Table 10: List of the attributes of the object main
set main.<option> = <value>
currentdir Current directory in which any directory created by
MadAnalysis 5 is stored.
lumi
This allows us to modify the value of the integrated
luminosity, in fb−1 , used for the normalization of the
histograms. The default value is 10 fb−1 .
normalize This defines the way the histograms are normalized. The
allowed choices are the number of events included in
the different datasets (none), the integrated luminosity
without (lumi) or accounting for the event weights associated to each dataset (the default choice, lumi weight).
SBerror
This fixes the way the uncertainty on the signal over
background ratios is computed by MadAnalysis 5.
The attribute <value> is the corresponding analytical
formula passed as a valid Python expression given as a
string. It has to depend on S (number of signal events),
B (number of background events), ES (uncertainty on
the number of signal events) and EB (uncertainty on the
number of background events). It is automatically handled for the most simple cases (see Eq. (3)).
SBratio
This fixes the way signal over background ratios are
computed by MadAnalysis 5. The attribute <value>
is the corresponding analytical formula passed as a valid
Python expression given as a string. It has to depend
on S (number of signal events) and B (number of background events).
stacking method
When several datasets are represented on histograms,
the different curves can be stacked (stack, default),
superimposed (superimpose) or normalized to unity
(normalize2one), including superimposing.
When
the stacking method attribute of an instance of
the class selection is set to auto, the value of
main.stacking method is employed.
Table 10:
61
By default, all the histograms are normalized to an integrated luminosity
of 10 fb−1 . This value can be updated by modifying the attribute lumi of
the object main,
set main.lumi = <new-value>
where the new value of the integrated luminosity, <new-value>, is given in
fb−1 .
Once all the datasets have been defined as part of the signal or background samples, MadAnalysis 5 can compute automatically the signal (S)
over background (B) ratio, and thus the efficiency of each selection cut. This
feature is related to an attribute of the object main denoted by SBratio.
It refers to an analytical formula, expressed as a valid Python expression,
which indicates how the signal over background ratio must be calculated5 .
When implementing this formula, the symbols related to the signal and background number of events are S and B, respectively. By default, the signal over
background ratio is computed according to S/B. This can be modified through
the command set, by issuing in the interpreter,
set main.SBratio = ’<formula>’
where <formula> is, as sketched above, a valid Python expression depending on the two variables S and B. For instance, the command
set main.SBratio = ’S/sqrt(S+B)’
enforces the signal over background ratio r to be computed according to
r=√
S
.
S+B
In the case the signal over background ratio is undefined due, e.g., to the
evaluation of the squared root of a negative number or to a division by zero,
the value zero is returned. Let us emphasize that it is safer for the user to
use real numbers when typing-in the analytical expression <formula>, rather
than integer numbers. We indeed recall that 1/2 is evaluated as 0 whilst 1./2.
returns 0.5.
5
The formula is internally stored as an instance of the TFormula class. This structure
is defined in the Root library linked to MadAnalysis 5, and all the associated attributes
can therefore be used. We refer to the Root manual for more information [57].
62
It is fundamental to associate an uncertainty to the signal over background ratio. The way to compute this quantity is related to the SBerror
attribute of the object main. As for SBratio, it refers to an analytical formula, given as a valid Python expression, which indicates how the uncertainty on the signal over background ratio must be computed. For the three
choices
r1 =
S
,
B
r2 =
S
S+B
and
r3 = √
S
,
S+B
(3)
as well as for the three additional cases obtained when S and B are exchanged, MadAnalysis 5 automatically detects the formula stored in the
SBratio attribute. It then updates accordingly the uncertainty, setting the
SBerror attribute to the values ∆ri given by
p
B 2 (∆S)2 + S 2 (∆B)2
,
∆r1 =
B2
p
B 2 (∆S)2 + S 2 (∆B)2
∆r2 =
,
(S + B)2
p
(S + 2B)2 (∆S)2 + S 2 (∆B)2
,
∆r3 =
2(S + B)3/2
where ∆S and ∆B are the uncertainties on the signal and on the background
number of events. If the user wants to use another formula or to set himself
the SBerror attribute, the command set has to be employed,
set main.SBerror = ’<formula>’
where <formula> depends this time on the number of signal and background
events S and B as well as on the associated uncertainties ES (≡ ∆S) and EB
(≡ ∆B). For instance, implementing by hand the error ∆r1 above would
give
set main.SBerror = ’sqrt(B**2*ES**2+S**2*EB**2)/B**2’
Four specific attributes of the object main concern muon isolation when
MadAnalysis 5 is run in order to analyze reconstructed-level events. The
user has the possibility to choose the algorithm which is employed by MadAnalysis 5 when defining an isolated muon. Two choices are implemented
and can be adopted by issuing one of the two commands
63
Table 11: List of the attributes of the object main
associated to the isolation of the muons.
set main.isolation.<option> = <value>
algo
deltaR
ET PT
sumPT
This specifies the algorithm to be employed for muon
isolation. The allowed choices are DELTAR (default) and
SUMPT. In the first case, we require that no tracks lies
inside a cone around the muon. In the second case, the
sum of the transverse-momentum of all the tracks inside
the cone and the ratio of the summed transverse energy
of these tracks over their summed transverse momentum
must be lower than values specified by the user. For the
second algorithm, the size of the cone is fixed by the
detector simulation tool.
This specifies the radius of the isolation cone to be used
by the DELTAR isolation algorithm.
This specifies the value of the ratio of the sum of the
transverse energy of the tracks lying in the isolation cone
over the sum of their transverse-momentum to be used
by the SUMPT algorithm.
This specifies the transverse-momentum threshold to be
used by the SUMPT algorithm.
Table 11:
64
set main.isolation.algo = DELTAR
set main.isolation.algo = SUMPT
In the first case, a muon is tagged as isolated when no track lies inside a
cone around the muon. The size of this cone can be specified by the user by
typing in the command interface
set main.isolation.deltaR = <value>
where <value> is a floating-point number. For the second algorithm, a muon
is considered as isolated when the sum of the transverse momentum of all
the tracks lying in a cone around the muon is lower than a value <value>.
The latter can be specified by typing
set main.isolation.sumPT = <value>
In addition, the ratio of the sum of the transverse energy of these tracks over
the sum of their transverse momentum has also to be lower than a value
<value’> to be specified. This value is provided by means of the command
set main.isolation.ET_PT = <value’>
On a fairly different line, the last attribute of the object main which can
be modified by the user is denoted by currentdir
set main.currentdir = <dirname>
It fixes the path to the directory in which any file and/or directory created
by MadAnalysis 5 is stored.
5. MadAnalysis 5 for expert users
Besides its user-friendliness, the way of using MadAnalysis 5 described
in Section 4 is (obviously) restricted by the set of functionalities that have
been implemented. The latter allow, in general, to perform rather traditional and standard analyses but might not be sufficient for more sophisticated and/or exotic investigations. For example, the normal running mode
of the program does not allow us to create a histogram related to either the
distribution of a new observable or to the one of an existing observable that
needs to be computed in a reference frame different from the laboratory reference frame. Along the same lines, selection cuts must match the pattern
65
presented in Section 4.6, which forbids any other selection than cutting on
the implemented kinematical variables by means of assigning a lower and/or
upper bound on the result of the computation of the associated observable.
Finally, as a last example, two- or three-dimensional histograms, necessary
for correlation studies, are not included.
In order to overcome the above-mentioned restrictions as well as any type
of, even unforeseen, limitations, MadAnalysis 5 comes with an expert mode
of running. In this case, the possibilities are only limited by the programming
skills of the user and his originality in designing the analysis. The user is
asked to implement the entire analysis himself, knowing that he is able to
benefit from all the strengths of the SampleAnalyzer framework. The
latter comes indeed with its own set of reading routines for the event samples,
its own data format and a large class of functions and methods ready to be
employed. In addition, an automated compilation of the analysis C++ files
as well as a programming error management system are included.
As already presented in Section 4.1, the expert mode of MadAnalysis
5 can be set by issuing in a shell one of the three commands
bin/ma5 --expert
bin/ma5 -e
bin/ma5 -E
5.1. The SampleAnalyzer framework
In the expert mode, there are two possibilities in order to create an analysis, i.e., to implement the C++ source and header files which are automatically generated by MadAnalysis 5 in its normal mode of running. Either
one can start from and extend an existing analysis already generated by
MadAnalysis 5, or one can design a new analysis from scratch.
In the first case, a working directory has already been created through
the issue, in the command line interface of MadAnalysis 5, of the command submit (see Section 4.7). Consequently, at least one dataset has
been imported (see Section 4.3) and at least one histogram has been created (see Section 4.5). The created working directory contains three subdirectories, SampleAnalyzer, lists and root. The first of these directories,
SampleAnalyzer, includes all the files necessary for having the C++ kernel of MadAnalysis 5 properly running and executing the analysis implemented by the user. When issuing the command submit in the command
interface, all the Python commands entered by the user are translated into
a set of three C++ files, user.cpp, user.h and analysisList.cpp, stored
in the sub-directory Analysis of SampleAnalyzer.
66
The two other sub-directories included in the working directory, lists
and root, are dedicated to the input and output files, respectively. As mentioned in Section 4.3, the imported events are gathered into different datasets.
For each dataset, a single list, containing the paths to the various associated
event files, is stored in the directory lists. After being executed, SampleAnalyzer creates a Root file for each of the defined datasets. These files,
stored into the directory root, contain the necessary information to create
the histograms requested by the user.
When the user starts an analysis from scratch, the situation is similar
to the one described in the paragraphs above, with the exception that the
working directory is initialized directly from the shell, when MadAnalysis
5 is launched. When typing in a shell the command
bin/ma5 --expert
or equivalently any of the three commands recalled in the introduction of
this section, MadAnalysis 5 indeed asks a series of questions to the user
such as the name of the working directory to be created or the chosen label
for the analysis to be created (see below).
As a result, a working directory is created, together with the sub-directory
SampleAnalyzer which contains a blank analysis. The implementation of
this analysis, as in any analysis, is divided into the implementation of three
core functions. The latter have to be provided by the user in the file user.cpp
which comes together with the corresponding header file user.h. Both files
are stored in the sub-directory SampleAnalyzer/Analysis, together with an
additional file, analysisList.cpp, that contains the list of all the analyses
which are/will be implemented in the working directory under consideration.
After the creation of a fresh working directory, this list only contains a single
analysis, the blank analysis pre-implemented in the file user.cpp. However,
there is no limitation on the number of analyses which can be included and
nothing prevents this list from becoming very large.
Once the three C++ files introduced above have been created, MadAnalysis 5 exits and the user can then start implementing his analysis by
modifying these files. In this Section 5.1, we do not address the way in which
an analysis has to be implemented, since this is the scope of Section 5.3,
Section 5.4 and Section 5.5, but we only describe the steps leading to the
execution of the analysis and the generation of the output files.
In order to properly compile and execute the implemented analysis, the
linking to the external dependencies, such as the Root header files and li67
braries, must be performed appropriately. This is allowed by a correct setting
of the environment variables LD LIBRARY PATH (or rather DYLD LIBRARY PATH
for MacOS systems), LIBRARY PATH and CPLUS INCLUDE PATH prior to the
compilation. This task has been rendered automatic by means of the scripts
setup.sh and setup.csh included in the SampleAnalyzer sub-directory. All
the above-mentioned environment variables can be appropriately set at once
by issuing
source setup.sh
in a bash shell or
source setup.csh
in a tcsh shell before compiling and/or executing SampleAnalyzer.
After this step, the analysis can be compiled with the help of the Makefile
present in the SampleAnalyzer directory, assuming that the GNU Make
package has been installed on the computer of the user. As for any program to
be compiled with GNU Make, it is enough to issue in a shell the command
make
which also takes care of linking the external libraries to the SampleAnalyzer program. In addition, the command
make clean
has also been implemented and leads to the cleaning of the various subdirectories included in the current working directory.
Once compiled, the SampleAnalyzer core, containing the user’s analysis, is ready to be executed. The only input left to be provided consists in
the location paths of the event samples. They have, for a given dataset, to be
collected into a single text file, denoted in the following by <datasetlist>.
The SampleAnalyzer package is then simply run by issuing in a shell
SampleAnalyzer [ options ] <datasetlist>
If the event samples are collected into several datasets, SampleAnalyzer
has to be run once for each of the datasets to be included in the analysis,
with a different text file with the paths to the relevant event samples.
The only option supported by SampleAnalyzer consists in specifying
the label of the analysis to be performed. In particular, this allows us to
68
include several analyses, each of them specified by a unique label, in one
single working directory of SampleAnalyzer. The user can hence indicate
which analysis to perform on run-time. If the option pattern is not provided,
SampleAnalyzer lists to the screen all the analyses included in the file
analysisList.cpp, together with the corresponding labels, and asks to the
user to make his choice.
The label of an analysis is defined in the corresponding header file. In
the case of a fresh working directory just created by MadAnalysis 5, the
chosen name for the label is asked by the program and exported to the
file user.h. We refer to Section 5.2 for more information about the way to
declare labels independently from MadAnalysis 5. Assuming that the label
under consideration is denoted by <label>, SampleAnalyzer is launched
by issuing in a shell
SampleAnalyzer --analysis=<label> <datasetlist>
As a result, the analysis defined by the label <label> is executed by SampleAnalyzer and the output files are generated according to what the user
has implemented in the C++ files related to the corresponding analysis.
5.2. Implementing new analyses using the analysis template
As mentioned in Section 5.1, the implementation of an analysis within
the SampleAnalyzer framework consists in the writing of three files. Two
of them are related to the analysis itself, i.e., one C++ source file together
with the associated header file. Since a given working directory of SampleAnalyzer can include many analyses, their list must be provided. This is
the aim of the third file, analysisList.cpp, which is common to all the
present analyses.
As presented in the previous Section, a pair of such analysis source/header
files is automatically created when MadAnalysis 5 is run in expert mode.
These files are denoted by user.cpp and user.h. However, we adopt, in
the following, the generic names name.cpp and name.h since the user has
in fact the freedom to choose the name of the files. The only requirement
is that all the filenames are different. Moreover, all these files have to be
stored, together with the list of the implemented analyses included in the file
analysisList.cpp, in the sub-directory SampleAnalyzer/Analysis.
The pair of (generic) header and source analysis files name.cpp and name.h
contains the declaration of a class denoted by name, i.e., having the same
69
name as the files. The class name is a daughter class inheriting from the base
class AnalysisBase that contains (empty) analysis methods. These methods
are then specified at the level of the definition of the daughter classes.
The structure of the header file name.h follows, for any of the analyses
included in the working directory,
#ifndef analysis_name_h
#define analysis_name_h
#include "Core/AnalysisBase.h"
class name: public AnalysisBase
{
INIT_ANALYSIS(name,label)
public:
virtual void Initialize();
virtual void Finalize(const SampleFormat& summary,
const std::vector<SampleFormat>& files);
virtual void Execute(const SampleFormat& sample,
const EventFormat& event);
private:
};
#endif
The only pieces among these predefined lines to be modified by the user are
the name tag name, related to the filename, and the label of the analysis
label which is a string. This label is the one that can be provided as an
option when running the SampleAnalyzer code (see Section 5.1).
In the C++ code above, the INIT ANALYSIS macro automatically creates
the constructor and destructor methods associated to the class name and
consistently links the filename to the name of the analysis, which must be the
same. As for any class derived from the mother class AnalysisBase, the class
name must contain the three methods Initialize, Execute and Finalize.
Apart from this, the user is free to include his own set of additional functions
and variables as required to perform his analysis.
The role of the three functions above is intuitive and related to their
names. When SampleAnalyzer is executed in a shell, the program starts
70
by calling (once) the function Initialize
void Initialize()
Its aim is to initialize all the internal variables, as well as the entire set of
user-defined variables such as the histograms that have been requested (and
that must be properly declared in the header file name.h).
After initialization, SampleAnalyzer loops over all the events which
are passed to the code. As shown in Section 5.1, the list of event files is
collected into a single file which is passed as an argument when executing
the program from a shell. For each event, the function Execute is called in
order to perform the analysis. Among others, the histograms are filled event
by event and the cuts are applied. The method,
void Execute(const SampleFormat& sample,
const EventFormat& event)
takes as arguments, on the one hand, the event event under consideration,
which is passed as a set of particles with specific properties, and on the
other hand, general information on the entire event sample sample currently
analyzed, such as the corresponding integrated cross section necessary for a
proper normalization of the histograms to be produced.
Once all the events have been processed, the function Finalize is eventually called (once) by SampleAnalyzer
void Finalize(const SampleFormat& summary,
const std::vector<SampleFormat>& files)
Its aim is twofold. Firstly, it allows for the creation of the histograms and cutflow charts requested by the user. To implement the latter in an easy way, the
user can employ all the functionalities included in the Root library and we
therefore refer to the Root manual for more information [57]. Secondly, the
method Finalize stores the results of the analysis as an output Root files
which can be further processed or modified. The method takes as arguments
general information related to the event samples, summary, such as the total
cross section and the associated uncertainty. However, this time, instead of
having this information linked to a specific event sample, an average over
the whole list of samples included in the dataset under consideration has
been performed. In the case the user wants to compute additional quantities
when implementing the method Finalize, the same information, related to
71
each of the samples individually, is passed as the second argument which is
denoted, in the example above, as files.
These three predefined functions have to be implemented by the user
in the corresponding source file name.cpp. To this aim, we refer to the
description of the internal data format used by SampleAnalyzer for event
processing (see Section 5.3 and Section 5.4) and to the one of the methods
included in the mother class AnalysisBase (see Section 5.5).
As mentioned above, several analyses can be included in the same working directory. The only requirement consists in implementing them in different files and classes since each analysis is unambiguously defined by its
(file)name, which must therefore be unique. In order for SampleAnalyzer
to correctly handle them, the user must refer to the various classes and
files in the C++ source file analysisList.cpp, located in the sub-directory
SampleAnalyzer/Analysis. This file contains a link to each of the header
files associated to the analyses to be included. In addition, one instance
of each analysis class is created. The architecture of this file follows the
structure
#include
#include
...
#include
#include
"Analysis/name1.h"
"Analysis/name2.h"
"Core/AnalysisManager.h"
"Core/logger.h"
void AnalysisManager::BuildTable()
{
Add(new name1);
Add(new name2);
....
}
At least two analyses, denoted by name1 and name2 are implemented and the
corresponding header files have been included in SampleAnalyzer. In the
example above, the dots stand for possible additional analyses that the user
might want to embed too. In the case the user has only implemented one
single analysis, the file analysisList.cpp must still be present. It however
then only includes the header file of this analysis and creates an instance of
the related class.
72
In order to facilitate the implementation of new analyses, SampleAnalyzer comes with a Python script newAnalysis.py located in the directory
SampleAnalyzer. As shown above, creating a new analysis with the name
newname requires the implementation of the two C++ files newname.h and
newname.cpp and then update the file analysisList.cpp in order to include
the new analysis. The analysis-independent part of this task has been automated through this Python script. The user can use it from a shell, by
typing
newAnalysis.py newname
The script starts by asking the user to type-in the label of the new analysis.
As a result, the two files containing the declaration of the new analysis class
are created (with a blank analysis included) and the list of the existing analyses in analysisList.cpp is updated. The user must now start implementing
the analysis itself.
To this aim, he has to declare the variables necessary for the analysis and
implement the three methods Initialize, Execute and Finalize, together
with possible additional user-defined functions. This step requires a knowledge of the methods already included in the base class AnalysisBase and
the one of the data format used internally by SampleAnalyzer. This is
the scope of Section 5.3, Section 5.4 and Section 5.5.
5.3. The data format used by SampleAnalyzer
The function Execute introduced in the previous Section takes as a second
argument an object of the type EventFormat, which points to the current
event being analyzed denoted by event in the following. We dedicate this
section to the description of the EventFormat class, which can also be found
as a Doxygen documentation on the MadAnalysis 5 website,
http://madanalysis.irmp.ucl.ac.be
In order to implement his analysis and to apply it to the event under
consideration, the user generally needs to access various pieces of information
related to this event. For example, the momentum of a specific type of
object could be needed to implement some sophisticated cuts. To this aim,
the SampleAnalyzer framework contains many built-in methods. They
are split into two categories, the first one being related to hadron-level and
parton-level events, which are generically named, in the following, as Monte
Carlo level events, and the second one to reconstructed events.
73
When processing the event event, SampleAnalyzer automatically creates, when reading the event, an object with a structure appropriate to store
the information included in the event under consideration,
event.mc()
event.rec()
These two objects are C++ pointers to all the methods implemented to
facilitate the design of an analysis at the Monte Carlo level and at the
reconstructed-level, respectively. These methods are extensively described
in the rest of this Section.
5.3.1. The data format for parton-level or hadron-level events
The pointer event.mc() introduced above allows us to access general
information related to a (Monte Carlo) event denoted by event such as the
weight of the event or the employed value of the strong coupling constant.
In addition, the whole set of initial-, intermediate- and final-state particles,
together with their kinematical properties, is available. These properties
form the so-called data format of SampleAnalyzer for Monte Carlo level
events and are summarized in Table 12.
For Monte Carlo samples which include events related to several physical
processes, matrix-element generators usually assign to each event a tag, i.e.,
an unsigned integer number, that allows us to identify the physical process
which the event is originating from. If the user needs to access this tag in
the analysis, it is available through the function
event.mc()->processId()
which returns an unsigned integer. With a similar syntax, the weight associated to the event event can be used in the C++ source file of the analysis
through,
event.mc()->weight()
which returns a floating-point number. If the implementation of the analysis
requires the evaluation of the factorization scale, it can be obtained from the
method
event.mc()->scale()
which gives the results as a floating-point number. In contrast, the renormalization scale is not available but the values of the strong and electromagnetic
coupling constants (including a possible running) can also be employed in
the analysis,
74
Table 12: Methods related to the parton-level
and hadron-level event format
Let ev be an EventFormat object, i.e., an instance of the class related
to events issued from a partonic or hadronic Monte Carlo sample.
ev.mc()->alphaQCD()
ev.mc()->alphaQED()
ev.mc()->particles()
ev.mc()->processId()
ev.mc()->scale()
ev.mc()->weight()
This returns, as a floating-point number,
the value of the strong coupling constant
used in the event.
This returns, as a floating-point number,
the value of the electromagnetic coupling
constant used in the event.
This
returns
a
vector
of
MCParticleFormat objects whose each
entry consists in one of the particles
present in the event, together with its
properties. All initial, intermediate and
final state particles are included.
This returns an unsigned integer number
related to the tag of the physical process
the event is originating from. It is especially useful when several physical processes are merged into one event sample.
This returns, as a floating-point number,
the factorization scale.
This returns, as a floating-point number,
the event weight.
Table 12:
75
event.mc()->alphaQCD()
event.mc()->alphaQED()
These last two methods also return floating-point numbers.
More importantly, implementing histograms or selection cuts requires us
to investigate the particle content of the event, as well as the properties of one
or several of these particles. All the initial-, intermediate- and final-state particles included in the event event are stored in a vector of MCParticleFormat
objects, which can be called in the analysis through
event.mc()->particles()
The syntax above returns a vector that each entry consists in a particle
present in the event, together with its properties, given as an instance of the
MCParticleFormat class.
In order to implement a loop over all the particle content of the event
event, in, e.g., the function Execute of the analysis source file, it is sufficient
to program
unsigned int n = event.mc()->particles().size();
for (unsigned int i=0; i<n; i++) { ... }
where we recall that at this stage, all the initial-, intermediate- and final-state
particles are considered equivalently. We will show in Section 5.5 how to
implement loops over, e.g., the final-state particles only. Similarly, denoting
by the object prt an instance of the MCParticleFormat class, the ith particle
is given by
MCParticleFormat* prt =
&event.mc()->particles()[i];
In the rest of this Section, we focus on the attributes of the object prt.
The class MCParticleFormat contains seven methods which allow to extract and use the properties of a given particle within the analysis. These
methods are summarized in Table 13.
The PDG-id of the particle prt can be accessed through
prt->pdgid()
which returns the corresponding signed integer number. The statuscode of
the particle, i.e., its tag as an initial-state, intermediate-state or final-state
particle, can be obtained through the function
76
Table 13: Methods related to the MCParticleFormat class
Let prt be a MCParticleFormat object.
prt.ctau()
prt.momentum()
prt.mother1()
prt.mother2()
prt.pdgid()
prt.spin()
prt.statuscode()
This returns, as a floating-point number, the
decay length of the particle, assuming that it
moves at the speed of light.
This returns a TLorentzVector containing
the four-momentum of the particle prt.
This returns a MCParticleFormat object
pointing to the mother particle of the particle prt, i.e., either the particle which decays into prt (plus other particles) or a particle which interacts with another particle (see
mother2()) to produce the particle prt.
This returns a MCParticleFormat object
pointing to the mother particle of the particle prt, but only in the case prt is produced from the interaction of two particles.
These particles can be accessed through the
two methods mother1() and mother2().
This returns an integer number standing for
the PDG-id of the particle.
This returns a floating-point number, the cosine of the angle between the momentum of
the particle prt and its spin vector, computed in the laboratory reference frame.
This returns an integer depending on the
initial-state, intermediate-state or final-state
nature of the particle. The conventions on
this integer number are taken from Ref. [41].
Table 13:
77
prt->statuscode()
which returns an integer associated to the initial-state, intermediate-state or
final-state nature of the particle. For the conventions on this integer number
we refer to Ref. [41].
For non-initial-state particles, information on mother particle(s) can be
extracted (and used in the analysis) through the two methods
prt->mother1()
prt->mother2()
which return the MCParticleFormat objects related to the particle(s) from
which the current particle prt is issued. In the case of a decay chain, only
the mother1 method has to be used. In contrast, when the particle prt
is produced from the interaction of two particles, both the mother1 and
mother2 give results, each of them pointing to one of the initial particles.
The most important property of the MCParticleFormat class to be used
in physics analyses consists in the particle four-momentum, accessible from
prt->momentum()
The result of this function is given as a TLorentzVector, a Root class
appropriate to store four-momentum. In addition, this class contains various
methods to compute a large set of observables which can be derived from
the knowledge of the four-momentum, such as the energy or the transverse
momentum. The complete list of these observables is given, together with
the associated syntax, in Table 14.
An additional observable related to the four-momentum, and more in
particular to the three-momentum component of the four-momentum, which
can be employed in an analysis reads
prt->spin()
This returns a floating-point number which stands for the cosine of the angle
between the momentum of the particle prt and its spin vector, evaluated in
the laboratory reference frame.
Finally, the decay length of the particle (assuming that the particle is
moving at the speed of light) can also be easily obtained through the function
prt->ctau()
which returns a floating-point number too.
78
Table 14: Common methods related to the MCParticleFormat
and RecParticleFormat classes
Let P be a MCParticleFormat or RecParticleFormat object.
P.angle(P2) Angle between the momenta of the objects P and P2,
where P2 is an instance of the MCParticleFormat or
RecParticleFormat class.
P.beta()
Velocity β = v/c.
P.dr(P2)
Relative distance between the objects P and P2 in
the η − φ plane, where P2 is an instance of the
MCParticleFormat or RecParticleFormat class.
P.e()
Energy.
P.et()
Transverse energy.
P.eta()
Pseudorapidity.
P.gamma() Lorentz factor.
P.m()
Invariant mass.
P.mt()
Transverse mass.
P.p()
Norm of the momentum.
P.phi()
Azimuthal angle of the momentum.
P.pt()
Norm of the transverse momentum.
P.px()
Projection of the momentum on the x-axis.
P.py()
Projection of the momentum on the y-axis.
P.pz()
Projection of the momentum on the z-axis.
P.r()
Position of the object in the η − φ plane.
P.theta() Angle between the momentum and the beam axis.
P.y()
Rapidity.
Table 14:
79
Table 15: Methods related to the reconstructed event format
Let ev be an EventFormat object, i.e., an instance of the class related
to events issued from a reconstructed Monte Carlo sample.
ev.rec()->electrons() This returns a vector with all the
electrons of the event, encoded as
RecLeptonFormat objects.
ev.rec()->jets()
This returns a vector with all the jets of
the event, given as RecJetFormat objects.
ev.rec()->met()
This points to the missing energy of the
event, encoded as a RecMETFormat object.
ev.rec()->muons()
This returns a vector with all the muons of
the event, encoded as RecLeptonFormat
objects.
ev.rec()->taus()
This returns a vector with all the taus of
the event, given as RecTauFormat objects.
Table 15:
5.3.2. The data format for reconstructed events
At the beginning of this Section, we have introduced two types of data
format which are used for event processing by SampleAnalyzer. They
consist in the two sides of the more general EventFormat class. In the previous Section, we have focused on the description of an event object event read
from a parton-level or hadron-level sample. We have shown that its properties are embedded, in the SampleAnalyzer framework, into a structure
which can be browsed from the C++ pointer event.mc().
Since the properties of reconstructed events are in general very different from those of Monte Carlo events, SampleAnalyzer embeds the latter into another structure which is, this time, linked to the C++ pointer
event.rec(). It consists in five methods, collected in Table 15, associated
to the five types of objects that can be reconstructed, i.e., electrons, muons,
taus, jets and missing energy6 . In the SampleAnalyzer framework, each
6
By electrons, muons and taus, we are considering both the corresponding particles
80
reconstructed objects is associated to a specific class derived from the generic
RecParticleFormat mother class and depending on its species. In the following, we adopt the choice of describing the daughter classes, more relevant
for the user, rather than the generic class.
Two methods are associated to first and second generation charged leptons, i.e., to the reconstructed electrons and muons, present in the event
event,
event.rec()->electrons()
event.rec()->muons()
They return vectors that the entries are the different reconstructed electrons
and muons of the event, respectively. Each reconstructed electron or muon
is encoded as a RecLeptonFormat object. This last class has six associated
methods, gathered in Table 16, related to the attributes of the reconstructed
leptonic electron and muon objects.
As for Monte Carlo event samples, the four-momentum of the reconstructed objects is one of the most incontrovertible variables to be employed
in analyses. For a reconstructed lepton lep, its four-momentum can be included and used in the analysis source file by calling the function
lep.momentum()
the syntax being similar to the one employed for particles included in partonlevel and hadron-level events. This method returns a TLorentzVector object containing the corresponding four-momentum. Therefore, the methods associated to all the observables which can be derived from the knowledge of the four-momentum, collected in Table 14, are also methods of the
RecLeptonFormat class.
Reconstructed leptons are considered as electrons or muons regardless of
their charge. In the case the user wants to select them according to the
electric charge, the method
lep.charge()
of the RecLeptonFormat class can be used. It returns, as a floating-point
number, the electric charge of the reconstructed lepton which can be equal
to either −1 or +1 according to its antiparticle or particle nature.
and antiparticles.
81
Table 16: Methods related to the RecLeptonFormat class
Let lep be an RecLeptonFormat object, i.e., an instance of the class
describing the reconstructed electrons and muons.
lep.charge()
lep.EEoverHE()
lep.ET PT isol()
lep.HEoverEE()
lep.momentum()
lep.sumET isol()
lep.sumPT isol()
This returns the electric charge of the reconstructed object lep as a floating-point
number. The returned value consists in
−1 or +1.
This returns the ratio of the electromagnetic and hadronic energy for the reconstructed object lep, given as a floatingpoint number.
This returns the ratio of the values of the functions sumET isol() and
sumPT isol().
This returns the ratio of the hadronic
and electromagnetic energy for the reconstructed object lep, given as a floatingpoint number.
This returns a TLorentzVector containing the four-momentum of the reconstructed object lep.
This returns, if the object lep is a muon,
the sum of the transverse energy of all the
tracks lying in a cone around the muon.
The size of the cone is fixed by the detector simulation tool. If lep is an electron,
this function returns zero.
This returns, if the object lep is a muon,
the sum of the transverse momentum of
all the tracks lying in a cone around the
muon. The size of the cone is fixed by
the detector simulation tool. If lep is an
electron, this function returns zero.
All the methods presented in Table 14 can also be used.
8216:
Table
Two methods allow us to get information on the splitting of the reconstructed electron or muon energy between the electromagnetic and the hadronic parts of the detector,
lep.EEoverHE()
lep.HEoverEE()
These methods compute the ratio between the energy deposited in the electromagnetic calorimeter and the one deposited in the hadronic calorimeter,
and vice-versa, and return them as floating-point numbers.
Finally, the RecLeptonFormat class contains three specific methods related to muon isolation (see also Section 5.5). The algorithms to be employed
for deciding if a muon is considered as isolated or not require in general the
evaluation of two quantities, the sum of the transverse momentum of all
tracks lying in a cone around the muon candidate and the sum of their
transverse energy. These two observables can be accessed by typing
lep.sumPT_isol()
lep.sumET_isol()
which return a zero value in the case the lepton lep is an electron. In
contrast, for muons, the value read from the event file is employed. The size
of the cone is fixed by the fast detector simulation tool and is not available
in the LHCO event format. The ratio of the values of these two functions
can be obtained via the function
lep.ET_PT_isol()
Tau leptons being unstable, they always decay either into a narrow jet,
into a muon or into an electron, each time in association with missing energy.
Therefore, a specific class, different from the RecLeptonFormat class, exists in
order to embed reconstructed taus. This class is denoted by RecTauFormat.
In the internal data format used by SampleAnalyzer, the pointer to the
reconstructed event, event.rec(), contains a specific method to access all
the taus present in the event
event.rec()->taus()
This returns, as a vector of RecTauFormat objects, all the reconstructed tau
leptons of the event (regardless of their electric charge).
83
Table 17: Methods related to the RecTauFormat class
Let tau be an instance of the RecTauFormat class, i.e., the class
describing the reconstructed taus.
tau.charge()
tau.EEoverHE()
tau.HEoverEE()
tau.momentum()
tau.ntracks()
This returns the electric charge of the object tau as a floating-point number. The
returned value consists in −1 or +1.
This returns the ratio of the electromagnetic and hadronic energy for the object
tau, given as a floating-point number.
This returns the ratio of the hadronic and
electromagnetic energy for the object tau,
given as a floating-point number.
This returns a TLorentzVector containing the four-momentum of the object tau.
This returns, as a short integer, the number of charged tracks contained in the object tau.
All the methods presented in Table 14 can also be used.
Table 17:
In addition to the four methods momentum(), charge(), EEoverHE(),
HEoverEE() and the methods given in Table 14 already present for charged
leptons of the first and second generations, the RecTauFormat class includes
an additional method extracting the number of charged tracks issued from
the decaying tau and included in the reconstructed object. Denoting by
tau the reconstructed object, this number, given as a short integer, can be
obtained and further used in the implementation of the analysis by
tau.ntracks()
The entire list of methods associated to the RecTauFormat class can be found
in Table 17.
As for electrons, muons and taus, the entire set of reconstructed jets
84
Table 18: Methods related to the RecJetFormat class
Let j be an RecJetFormat object, i.e., an instance of the class
describing the reconstructed jets.
j.btag()
j.EEoverHE()
j.HEoverEE()
j.momentum()
j.ntracks()
This returns true or false according to
the b-tagging (or not) of the object j.
This returns the ratio of the electromagnetic and hadronic energy for the object
j, given as a floating-point number.
This returns the ratio of the hadronic and
electromagnetic energy for the object j,
given as a floating-point number.
This returns a TLorentzVector containing the four-momentum of the object j.
This returns, as a short integer, the number of charged tracks contained in the object j.
All the methods presented in Table 14 can also be used.
Table 18:
included in the event event can be obtained through the intuitive method
of the event.rec() structure,
event.rec()->jets()
This returns a vector of instances of the RecJetFormat class whose properties
are collected in Table 18.
Reconstructed jets are characterized by their momentum, the number of
charged tracks induced by the parton showering, fragmentation and hadronization of the initial partons and the ratio of the hadronic and electromagnetic parts of the jet energy. These properties are related to the methods
momentum(), ntracks(), EEoverHE() and HEoverEE() as well as all those included in Table 14, of the RecJetFormat class. In addition, an extra method
returns true or false according to the fact that the jet has been tagged as
a b-jet or not,
85
Table 19: Methods related to the RecMetFormat class
Let miss be a RecMetFormat object, i.e., the variable containing the
reconstructed missing energy associated to an event.
miss.mag()
miss.phi()
miss.x()
miss.y()
This returns the magnitude of the missing
energy represented by the object miss as
a floating-point number.
This returns the azimuthal angle of the
missing energy represented by the object
miss as a floating-point number.
This returns the x-component of the missing energy represented by the object miss
as a floating-point number.
This returns the y-component of the missing energy represented by the object miss
as a floating-point number.
Table 19:
j.btag()
where j denotes an instance of the RecJetFormat class.
The last type of objects which are included in reconstructed events consists in the associated missing transverse energy. The structure event.rec()
comes with the related method
event.rec()->met()
which returns a two-dimensional vector implemented as a TVector2 object.
It contains then the direction and magnitude of the missing energy in the
transverse plane as shown in Table 19.
The x-component and y-component of the missing transverse energy can
be used when implementing an analysis through the two methods
miss.x()
miss.y()
86
which return floating-point numbers associated to the two components of the
two-dimensional vector describing the missing energy, the object miss being
an instance of the RecMETFormat class. In the case the user prefers to use
polar coordinates instead of Cartesian coordinates when implementing his
analysis, he can use the two methods
miss.mag()
miss.phi()
which return the magnitude and the azimuthal angle of the two-dimensional
transverse-momentum vector as floating-point numbers.
5.4. The sample format used by SampleAnalyzer
In Section 5.2, we have introduced the function Execute as the main
function of the analysis class. We have shown that it requires two arguments,
the event being currently analyzed, stored as an EventFormat object, and
general information about the sample which this event belongs to, passed
as a SampleFormat object. This format is also the one to be used for the
arguments of the function Finalize, dedicated to the creation of the output
files containing the results of the analysis. In this case, the user must pass
two arguments, an instance of the SampleFormat class associated to all the
event samples included in the dataset under consideration, i.e., information
averaged over all the samples, and one vector of SampleFormat objects with
one entry for each of the samples included in the dataset, i.e., the same
information, but given for each individual sample.
The SampleFormat class contains several methods allowing us to access
general information about the sample under consideration, provided the information is available. If not, the associated entries in the SampleFormat
structure are left non-initialized and the corresponding quantity cannot consequently be used in an analysis. A full Doxygen documentation is available
on the MadAnalysis 5 website,
http://madanalysis.irmp.ucl.ac.be
Since information supplementing the events is only available within LHE
and StdHep files, the SampleFormat structure is then only relevant for the
analysis of such event files. In particular, LHCO files with reconstructed
events do not include anything but the events. In this case, it is however still
possible to pass additional information such as cross sections to SampleAnalyzer through the attributes of the dataset class (see Section 4.3).
87
In Section 5.3, we have shown that SampleAnalyzer is creating an
EventFormat structure each time an event is processed, resulting in a C++
pointer pointing to the whole methods available for the EventFormat structure. Similarly, when processing a new sample generically denoted by sample,
SampleAnalyzer creates a C++ pointer
sample.mc()
which points to a structure containing all the methods allowing us to access
the global information of the event file. These methods are collected in Table
20 and Table 21.
As shown by its name, sample.mc() is related to parton-level or hadronlevel events. The counterpart of this object in the case of a sample containing
reconstructed events, sample.rec(), has been implemented within the SampleAnalyzer framework. However, the only event file format appropriate
for reconstructed events, the LHCO format, does not leave a possibility
for including additional information to the events. Therefore, the pointer
sample.rec() points to a set of null information. If in the future, a new format for reconstructed events is designed, with the room for global information about the event sample, the related structure in the SampleAnalyzer
framework will be ready for the new format.
The first series of methods available within the SampleFormat structure,
collected in Table 20, are related to the description of the initial colliding
beams. The two members of the SampleFormat class
sample.mc()-> beamPDGID().first
sample.mc()-> beamPDGID().second
return, as integer numbers, the PDG-id of the first and second beams, respectively, whilst the four class members
sample.mc()->
sample.mc()->
sample.mc()->
sample.mc()->
beamPDFauthor().first
beamPDFID().first
beamPDFauthor().second
beamPDFID().second
return, as four unsigned integer numbers, information with respect to the
set of parton density functions used for the beams. These identifying numbers are exported from the event samples (if available) and correspond to
the numbering scheme employed by matrix element generators to identify
88
Table 20: Methods related to the SampleFormat class
giving information on the colliding beams
Let sample be a SampleFormat object.
sample.mc()->beamE().first
This returns, as a floating-point number, the energy of the
first of the colliding beams.
sample.mc()->beamPDFauthor().first
This returns the author group of the parton density set used
for the first of the colliding beams, as an unsigned integer
number.
sample.mc()->beamPDFID().first
This returns the identifier, as an unsigned integer number, of
the parton density set used for the first of the colliding beams,
within a given author group of parton densities.
sample.mc()->beamPDGID().first
This returns the PDG-id of the first of the colliding beams,
as an integer number.
sample.mc()->beamE().second
This returns, as a floating-point number, the energy of the
second of the colliding beams.
sample.mc()->beamPDFauthor().second
This returns the author group of the parton density set used
for the second of the colliding beams, as an unsigned integer
number.
sample.mc()->beamPDFID().second
This returns the identifier, as an unsigned integer number,
of the parton density set used for the second of the colliding
beams, within a given author group of parton densities.
sample.mc()->beamPDGID().second
This returns the PDG-id of the second of the colliding beams,
as an integer number.
Table 20:
89
Table 21: Other methods related to the SampleFormat class
Let sample be a SampleFormat object.
sample.mc()->weightingmode()
This returns, as an integer number, information on the type of
events present in the sample (e.g., weighted versus unweighted
events).
sample.mc()->processes()
This returns a vector where the entries are ProcessFormat
objects containing basic information about each of the physical processes included in the sample sample.
sample.mc()->xsection()
This returns the cross section associated to the event sample
sample, as a floating-point number.
sample.mc()->xsection error()
This returns the Monte Carlo uncertainty related to the cross
section associated to the event sample sample, as a floatingpoint number.
Table 21:
the set of parton densities employed. According to the Les Houches conventions, this scheme is based on the PDFLib [61] and LHAPDF [62] packages.
Hence, the method beamPDFauthor() is related to the author group which
has released the parton density relevant for the sample under consideration
and the method beamPDFID() indicates which specific set of parton densities
of the corresponding group has been used.
The last pieces of information available with respect to the beams which
can be stored in the event files, and thus exported to the SampleAnalyzer
framework, consist in their energy. This can be used in the implementation
of an analysis by means of the two methods
sample.mc()-> beamE().first
sample.mc()-> beamE().second
for the first and second beams, respectively.
90
The second series of methods available from the SampleFormat class are
related to the sample itself. When available, information about the weighting
of the events is passed to SampleAnalyzer and can be accessed through
sample.mc()-> weightingmode()
According to the LHE format [41, 42], this type of information is stored as an
integer number which indicates how event weights and cross sections have to
be interpreted, and the weightingmode() method returns this integer number. Even if presently, SampleAnalyzer does not fully support weighted
events, the architecture has already been implemented with respect to future
developments of the program. Finally, the most important quantities included in this second series of methods concern the cross section associated
to the sample sample, together with the corresponding uncertainty. Both
can be called at the level of the analysis by using the methods
sample.mc()->xsection()
sample.mc()->xsection_error()
which return floating-point numbers.
As mentioned in Section 5.3.1, several physical processes can be included
within the same event sample. In this case, each of the processes is associated with an identifying tag (see the processId method introduced in Section
5.3.1). The SampleFormat structure allows us to easily access detailed information about the processes individually. This information is stored into
a new structure, the ProcessFormat class, all of whose associated methods
are summarized in Table 22. The method
sample.mc()->processes()
returns a vector that each entry is a ProcessFormat object. For an instance
of this class denoted by process, information on the identifier of the process
can be obtained through
process.processId()
the corresponding cross section together with its associated uncertainty through
the methods
process.xsection()
process.xsection_error()
91
Table 22: Methods related to the ProcessFormat class
Let proc be an instance of the ProcessFormat class.
proc.processId()
This returns an unsigned integer number related to the tag of
the physical process the event is originating from.
proc.xsection()
This returns the cross section associated to the process proc,
as a floating-point number.
proc.xsection error()
This returns the Monte Carlo uncertainty related to the cross
section associated to the process proc, as a floating-point
number.
proc.maxweight()
This returns the maximum weight carried by an event associated to the process proc, as a floating-point number.
Table 22:
and finally, the maximum weight carried by a single event originating from
the subprocess process through
process.maxweight()
5.5. Framework services
In this Section, we describe the various services included in the SampleAnalyzer framework. These services are components of the program
that are initialized (internally or by the user) at the beginning of the execution of SampleAnalyzer (within the Initialize method) and can then
be further called within the analysis as many times as necessary. Two series of services are currently available, message services and physics services
and are described in the rest of this Section. We recall that full Doxygen
documentation is available on the MadAnalysis 5 website,
http://madanalysis.irmp.ucl.ac.be
92
5.5.1. Message services
This class of functions has been implemented and can be used by the
users in order to print text to the screen during an on-going analysis in a
rather sophisticated fashion.
As for the implementation of any C++ program, the user can, when
designing his analysis, use the standard C++ streamers std::cout and
std:cerr in order to implement messages to be printed to the screen. However, these methods only include two levels of messages, i.e., normal and
error messages. It is hence rather cumbersome to handle multi-level messages and give information both on the reason leading to the printing of the
message and on its location in the analysis code in a clear and useful way.
Therefore, SampleAnalyzer includes its own message services with four
different levels of printing, DEBUG, INFO, WARNING and ERROR. The way to use
these four modes mimics the one of the C++ commands std::cout and
std::cerr,
DEBUG
INFO
WARNING
ERROR
<<
<<
<<
<<
"Debug message." << std::endl;
"Information message." << std::endl;
"Warning message." << std::endl;
"Error message." << std::endl;
Each message level is associated to a different color. Debugging messages
are printed in yellow, information messages in white, warning messages in
purple and error messages in red. However, if the user is not interested in
the color of the messages, this message can be switched off by including, in
the source code of the analysis, the line
LEVEL->DisableColor()
The color can be enabled again through the command
LEVEL->EnableColor()
In the command lines above, the keyword LEVEL stands for any of the four
levels of message, DEBUG, INFO, WARNING or ERROR.
Warning and error messages have a special role concerning the debugging
of the analysis code. In addition to the message, the line number of the
code having generated the message is also printed in order to facilitate the
debugging.
93
Finally, let us note that messages associated to a given level can be fully
switched off, if this is needed by the user, by including in the analysis code
the command
LEVEL->Mute()
Messages can be restored by implementing
LEVEL->UnMute()
where the keyword LEVEL again stands for any of the four levels of message.
5.5.2. Physics services
Under the name physics services, we collect a series of methods and functions aiming to facilitate the writing of an analysis by the user. It includes,
among others, functions to compute global observables related to the entire
event, such as the transverse missing energy, and this for any type of event
(parton-level, hadron-level and reconstructed-level). All these functions can
be called through the C++ pointer PHYSICS.
Before moving on to the description of these functions, one must note
that in the case the user wants to use, within his analysis, one or several of
the methods related to the invisible or hadronizing particles, the definition
of these invisible and hadronic particles must first be provided. This task is
performed within the Initialize function introduced in Section 5.2 with the
help of two different functions, one being associated to the invisible particles
and another one being associated to the particles taking part in the hadronic
activity. However, before declaring a new particle as invisible or hadronizing,
the physics services class must be initialized by means of one of the commands
PHYSICS->mcConfig()->Reset()
PHYSICS->recConfig()->Reset()
In the case the event samples which are analyzed consist in parton-level and
hadron-level event files, the method mcConfig is used whilst for reconstructedlevel event files, recConfig is instead used. Then, a particle whose PDG-id
is PDGID can be declared as an invisible particle by means of
PHYSICS->mcConfig()->AddInvisibleId(PDGID)
94
In the non-expert mode of MadAnalysis 5, the definition of the multiparticle invisible (see Section 4.4) corresponds to several calls of the function
above behind the scenes. Taking the example of an analysis at the partonlevel in the context of the Minimal Supersymmetric Standard Model, the
invisible particles consist of the neutrinos and the lightest superpartner assumed to be the lightest neutralino. The corresponding declaration within
the SampleAnalyzer framework reads
PHYSICS->mcConfig().AddInvisibleId(-16);
PHYSICS->mcConfig().AddInvisibleId(-14);
PHYSICS->mcConfig().AddInvisibleId(-12);
PHYSICS->mcConfig().AddInvisibleId(12);
PHYSICS->mcConfig().AddInvisibleId(14);
PHYSICS->mcConfig().AddInvisibleId(16);
PHYSICS->mcConfig().AddInvisibleId(1000022);
Similarly, the method
PHYSICS->mcConfig()->AddHadronicId(PDGID)
declares the particle whose PDG-id is given by PDGID as a particle related
to the hadronic activity in an event. Again, in the non-expert mode of
MadAnalysis 5, the definition of the multiparticle hadronic (see Section
4.4) corresponds to a series of calls to this last function. For the example of
a parton-level analysis within the Standard Model, the related declaration
would be given by
PHYSICS->mcConfig().AddHadronicId(-5);
PHYSICS->mcConfig().AddHadronicId(-4);
PHYSICS->mcConfig().AddHadronicId(-3);
PHYSICS->mcConfig().AddHadronicId(-2);
PHYSICS->mcConfig().AddHadronicId(-1);
PHYSICS->mcConfig().AddHadronicId(1);
PHYSICS->mcConfig().AddHadronicId(2);
PHYSICS->mcConfig().AddHadronicId(3);
PHYSICS->mcConfig().AddHadronicId(4);
PHYSICS->mcConfig().AddHadronicId(5);
PHYSICS->mcConfig().AddHadronicId(21);
95
Table 23: Methods related to the initialization
of the physics services
PHYSICS->mcConfig()->AddHadronic(PDGID)
This adds the particle whose PDG-id is PDGID to the list of the
invisible particles.
PHYSICS->mcConfig()->AddInvisible(PDGID)
This adds the particle whose PDG-id is PDGID to the list of the
particles taking part of the hadronic activity of an event.
PHYSICS->mcConfig()->Reset()
This initializes physics services when analyzing parton-level or
hadron-level events.
PHYSICS->recConfig()->Reset()
This initializes physics services when analyzing reconstructed-level
events.
Table 23:
In the case of events at the reconstructed-level, the user may need to
specify the algorithm to be employed when testing the isolation of a muon.
This can be done through the two (self-excluding) methods
PHYSICS->recConfig().UseDeltaRIsolation(deltaR=0.5);
PHYSICS->recConfig().UseSumPTIsolation(sumPT, ET_PT);
In the first case, a muon is tagged as isolated when no track lies inside a
cone of size deltaR around the muon. The default size of this cone is set to
0.5. In the second case, the muon is tagged as isolated when the sum of the
transverse momentum of all the tracks lying in a cone around the muon is
lower than sumPT and in addition, when the sum of the transverse energy of
these tracks over the sum of their transverse momentum is lower than ET PT.
By default, the first algorithm is adopted with deltaR being set to 0.5.
The usage of all the methods associated to the initialization of the physics
services, i.e., to the PHYSICS->mcConfig() and PHYSICS->recConfig() objects, is summarized in Table 23. All the other methods included in the
physics services are in general called within the function Execute, at the
core of the analysis and are summarized in Table 24 and Table 25.
96
Three boolean functions exist in order to test if a particle prt is invisible
or visible as well as if this particle takes part in the hadronic activity of the
event or not,
PHYSICS->IsHadronic(prt)
PHYSICS->IsInvisible(prt)
PHYSICS->IsVisible(prt)
When analyzing partonic or hadronic event samples, the particle prt is
passed as a MCParticleFormat object. In contrast, for analyses at the
reconstructed-level, prt is an instance of the RecParticleFormat class7 . In
order for these three methods to correctly work, it is necessary to declare
which particle is invisible and which particle takes part in the hadronic activity as shown above. In the reconstructed-level case, an additional method
exists to test whether a muon is isolated within an event event,
PHYSICS->IsIsolatedMuon(prt,event)
which returns always false for particles which are not muon candidates. In
the case of muons, this method applies the isolation algorithm chosen by the
user when setting the PHYSICS->recConfig() properties.
Another set of three methods checks whether a given particle prt is a
final-state, initial-state or intermediate-state particle,
PHYSICS->IsFinalState(prt)
PHYSICS->IsInitialState(prt)
PHYSICS->IsInterState(prt)
These functions all return a boolean value according to the final-state, initialstate or intermediate-state nature of the particle under consideration. As
above, those methods work equivalently for analyses at the hadronic, partonic
and reconstructed levels, the particle prt being hence either an instance of
the MCParticleFormat or of the RecParticleFormat classes. Since status
codes are defined in a different fashion according to the event file format, we
have adopted the choice to include these features within the physics services
rather than the data format itself, which allows us to have a unified way to
probe the initial-, intermediate- or final-state nature of the particles included
7
The RecParticleFormat class is the mother class of all the classes defining reconstructed objects, i.e., the RecLeptonFormat, RecJetFormat and RecTauFormat classes.
97
Table 24: Boolean methods included in the physics services
Let prt be an instance of either the MCParticleFormat or the
RecParticleFormat classes.
PHYSICS->IsFinalState(prt)
This checks if the particle prt is a final-state particle.
PHYSICS->IsHadronic(prt)
This checks if the particle prt takes part to the hadronic activity
in an event.
PHYSICS->IsInitinalState(prt)
This checks if the particle prt is an initial-state particle.
PHYSICS->IsInterState(prt)
This checks if the particle prt is an intermediate-state particle.
PHYSICS->IsInvisible(prt)
This checks if the particle prt is an invisible particle.
IsIsolatedMuon(prt,evt)
This checks if the particle prt is a muon isolated from the other
particles of the event evt.
PHYSICS->IsVisible(prt)
This checks if the particle prt is a visible particle.
Table 24:
in an event. These last series of functions allows us to implement efficiently
a loop over, e.g., the final-state particles of the event, and not on all the
particles, in contrast to the example given in Section 5.3.1,
unsigned int n = event.mc()->particles().size();
for (unsigned int i=0; i<n; i++)
{
MCParticleFormat* prt = &event.mc()->particles()[i];
if(PHYSICS->IsFinalState(prt))
{ ... }
}
Five methods included in the physics services are dedicated to the computation of global observables related to the entire event content: the missing
98
/ T , the missing hadronic energy H
/ T , the total transverse
transverse energy E
energy ET and the total hadronic energy HT as defined in Eq. (1) and Eq.
(2), as well as the partonic center-of-mass energy. The associated functions
read, respectively,
PHYSICS->EventMET(evt->mc())
PHYSICS->EventMHT(evt->mc())
PHYSICS->EventTET(evt->mc())
PHYSICS->EventTHT(evt->mc())
PHYSICS->SqrtS(event->mc())
PHYSICS->EventMET(evt->rec())
PHYSICS->EventMHT(evt->rec())
PHYSICS->EventTET(evt->rec())
PHYSICS->EventTHT(evt->rec())
PHYSICS->SqrtS(event->rec())
where evt is an instance of the EventFormat class. These five methods work
for any level of analysis (partonic, hadronic and reconstructed) and then
take accordingly as argument either an event->mc() or an event->rec()
object. The value, in GeV, of the corresponding observable is returned as a
floating-point number.
For most analyses, it is important to be able to order the particles according to a specific variable. Therefore, in order to avoid requiring the user to
implement his own sorting algorithm, physics services include one dedicated
function,
PHYSICS->sort(prtVect, OrderingObs)
The command above allows us to sort a vector of particles prtVect, that each
entry is either a MCParticleFormat or a RecParticleFormat object, according to the ordering observable OrderingObs. The implemented choices for the
latter are ETAordering (pseudorapidity ordering), ETordering (transverseenergy ordering), Eordering (energy ordering), Pordering (momentum ordering), PTordering (transverse-momentum ordering), PXordering (ordering according to the x-component of the momentum), PYordering (ordering
according to the y-component of the momentum) and PZordering (ordering
according to the z-component of the momentum).
The last method included in the physics services that can be useful when
implementing an analysis is related to the reference frame in which the fourmomenta of the particles included in the event are computed. When reading
the event files, all the four-momenta are, by convention, given in the laboratory reference frame. However, for specific observables, it is necessary to
recalculate one or several of the four-momenta in the rest frame of a given
particle, which is equivalent to applying a Lorentz boost to these four-vectors.
This task can be done automatically by means of the method
99
Table 25: Other methods included in the physics services
Let evt be an instance of the EventFormat class assuming to point
to an evt->mc() or a evt->rec() structure.
PHYSICS->ToRestFrame(prt,prt1)
This recalculates (and modifies) the four-momentum of the particle prt after a Lorentz boost to the rest frame of the particle prt1. The objects prt and prt1 are two instances of the
MCParticleFormat or RecParticleFormat classes.
PHYSICS->EventMET(evt)
/ T associated to the
This computes the missing transverse energy E
event evt.
PHYSICS->EventMHT(evt)
/ T associThis computes the missing transverse hadronic energy H
ated to the event evt.
PHYSICS->EventTET(evt)
This computes the total transverse energy ET associated to the
event evt.
PHYSICS->EventTHT(evt)
This computes the total transverse hadronic energy HT associated
to the event evt.
PHYSICS->sort(prtvector,orderobs)
This sorts a vector of MCParticleFormat or MCRecFormat objects according to the ordering observable orderobs. The allowed
choices for the ordering variable are ETAordering (pseudorapidity
ordering), ETordering (transverse-energy ordering), Eordering
(energy ordering), Pordering (momentum ordering), PTordering
(transverse-momentum ordering), PXordering (ordering according to the x-component of the momentum), PYordering (ordering
according to the y-component of the momentum) and PZordering
(ordering according to the z-component of the momentum).
PHYSICS->SqrtS(evt)
This returns the partonic center-of-mass energy of the event in
GeV.
Table 25:
100
PHYSICS->ToRestFrame(prt,prt1)
where the objects prt and prt1 are two instances of the MCParticleFormat
or RecParticleFormat classes. The four-momentum of the particle prt
is boosted to the rest frame of the particle prt1 and overwritten. Let us
note that the Lorentz transformation is chosen in such a way that the tridimensional (x, y, z) axes are kept unchanged.
5.6. A detailed example
In this Section, we give a detailed example about how to implement an
analysis within the expert mode of MadAnalysis 5. We choose to investigate the polarization of the W -boson issued from a top quark decaying
leptonically,
t → W + b → ℓ+ νl b .
(4)
This property of the W -boson is usually studied through the shape of a
particular angular distribution, dσ/d cos θ∗ . The θ∗ angle is defined as the
angle between the momentum of the W -boson evaluated in the rest frame of
the originating top quark and the one of the lepton ℓ+ evaluated in the rest
frame of the W -boson.
To investigate this observable, we focus on the production of a top-antitop
pair where one of the final state top quarks undergoes a leptonic decay and
the other one decays hadronically,
pp → tt̄ → (b j j)(b̄ ℓ− ν̄l )
or
pp → tt̄ → (b ℓ+ νl )(b̄ j j) ,
where ℓ stands for an electron or a muon and j for a light jet. From the
parton-level samples stored in the directory samples of MadAnalysis 58 ,
ttbar sl 1.lhe.gz and ttbar sl 2.lhe.gz, we illustrate the implementation, within the SampleAnalyzer framework, of an analysis code leading
to the creation of a histogram representing the dσ/d cos θ∗ distribution introduced above. We refer to Section 3 concerning details on the generation
of these two Monte Carlo samples.
When launching MadAnalysis 5 in expert mode by issuing in a shell
bin/ma5 -e
8
If the samples directory is absent, we recall that it can be created by issuing, in the
command line interface of MadAnalysis 5, the command install samples.
101
the user is asked to enter the name of the directory to be created and the label
of the analysis. For the sake of the example, the name of the directory is chosen to be Wpol whilst the string W polarization from a top decay is entered as the label, or title, of the analysis. The three files analysisList.cpp,
user.cpp and user.h are automatically created and stored in the directory
Wpol/SampleAnalyzer/Analysis, as mentioned in Section 5.1. Whilst the
first of these files does not have to be modified by the user, the two others
must be updated to include the analysis which has to be implemented.
The file user.h strictly follows the structure presented in Section 5.2,
#ifndef analysis_user_h
#define analysis_user_h
#include "Core/AnalysisBase.h"
class user: public AnalysisBase
{
INIT_ANALYSIS(user,"W polarization from a top decay")
public:
virtual void Initialize();
virtual void Finalize(const SampleFormat& summary,
const std::vector<SampleFormat>& files);
virtual void Execute(const SampleFormat& sample,
const EventFormat& event);
private:
TH1F* myHisto;
};
#endif
The label of the analysis has been automatically included into the arguments
of the INIT ANALYSIS function at the execution of MadAnalysis 5, together
with the declaration of the three main functions Initialize, Execute and
Finalize. Since we are interested in the creation of a single histogram, we
therefore need to declare, as a private member of the user class, an instance
102
of the TH1F class9 which we denote by myHisto.
The C++ source file user.cpp contains the implementation of the three
core functions Initialize, Execute and Finalize. Its structure reads thus
#include "Analysis/user.h"
void user::Initialize()
{ ... }
void user::Execute(const SampleFormat& sample,
const EventFormat& event)
{ ... }
void user::Finalize(const SampleFormat& summary,
const std::vector<SampleFormat>& files)
{ ... }
where the dots are specified in the remainder of this Section. The function
Initialize contains on the one hand the initialization of the physics services
as well as, on the other hand, the one of the histogram to be drawn, following
the Root syntax,
void user::Initialize()
{
// Initializing Physics services
PHYSICS->mcConfig().Reset();
// Initializing the histogram
myHisto = new TH1F("myHisto","cos#theta^{*}",15,-1.,1.);
}
We here ask for the creation of a histogram containing 15 bins ranging from
-1 to +1, the minimal and maximal values for the cosine of the θ∗ -angle.
The implementation of the function Execute is a bit more complicated.
First of all, the observable of interest can only be computed once the three
relevant particles have been identified, i.e., the final-state lepton ℓ, the intermediate W -boson decaying into this lepton ℓ and the originating top quark.
9
We refer to the Root manual [57] for the definition of the TH1F class and its attributes.
103
Then, the four-momentum of the W -boson has to be boosted into the rest
frame of the top quark and the one of the lepton into the rest frame of the
W -boson. Once this is done, the cosine of the angle θ∗ can be computed and
the value filled into the histogram. The skeleton of the function Execute
reads thus
void user::Execute(const SampleFormat& sample,
const EventFormat& event)
{
// Initialization of three pointers to the lepton,
// W and top quark
{ ... }
// Identification of the three particles of interest
{ ... }
// Computing the observable; filling the histogram
{ ... }
}
The first series of dots concerns the declaration of the three objects which
contain the three particles of interest, once identified, and which are necessary
to compute the observable cos θ∗ ,
const MCParticleFormat* top
= 0;
const MCParticleFormat* w
= 0;
const MCParticleFormat* lepton = 0;
In the lines above, three pointers to a MCParticleFormat structure are created and initialized to the zero value.
The second series of dots are related to the identification of the top quark,
the W -boson and the lepton. In particular, the analysis code needs to check
that the mother-to-daughter relations given by the decay chain of Eq. (4)
are fulfilled. Otherwise, the event must be rejected. In practice, this task is
performed through a loop over the particle content of the event. The lepton
is firstly selected as a final-state particle whose PDG-id reads ±11 (electron)
or ±13 (muon). The W -boson is then further identified by requiring that the
mother particle of this lepton has a PDG-id equal to ±24. The top quark
is finally identified by requiring that the ‘grandmother’ of the lepton has a
PDG-id equal to ±6. The implemented code is given by
104
for (unsigned int i=0;i<event.mc()->particles().size();i++)
{
const MCParticleFormat* prt=&(event.mc()->particles()[i]);
// The lepton is a final state particle
if (!PHYSICS->IsFinalState(prt)) continue;
// Lepton selection based on the PDG-id
if ( std::abs(prt->pdgid())!=11 &&
std::abs(prt->pdgid())!=13 ) continue;
// Getting the mother of the lepton and
// checking if it is a W-boson
const MCParticleFormat* mother = prt->mother1();
if (mother==0) continue;
if (std::abs(mother->pdgid())!=24) continue;
// Getting the grand-mother of the lepton and
// checking if it is a top quark
const MCParticleFormat* grandmother = mother->mother1();
if (grandmother==0) continue;
if (std::abs(grandmother->pdgid())!=6) continue;
// Saving the selected particles
lepton = prt;
w
= mother;
top
= grandmother;
// Particles are found: breaking the loop
break;
}
In the case the three particles are not identified, the event must be rejected,
which is done by implementing
// Rejection of the event if the decay chain is not found
if (lepton==0)
{
WARNING << "(t > b W > b l nu) decay chain not found!"
105
<< std::endl;
return;
}
where we have used the message services included in the SampleAnalyzer
framework to print a warning message to the screen.
In the third and last series of dots included in the skeleton of the user.cpp
file, the observable cos θ∗ is computed and the histogram filled, this last task
being performed by means of standard Root commands,
// Boosting the lepton four-momentum to the W rest frame
MCParticleFormat lepton_new = *lepton;
PHYSICS->ToRestFrame(lepton_new,w);
// Boosting the W four-momentum to the top rest frame
MCParticleFormat w_new = *w;
PHYSICS->ToRestFrame(w_new,top);
// Computing the observable; filling the histogram
myHisto -> Fill( cos(lepton_new.angle(w_new)) );
The histogram must now be created and exported to a human-readable
format. This is done at the level of the function Finalize by means of a
series of Root commands. For the sake of the example, we have decided
to normalize the histogram to the number of events N expected for an integrated luminosity of 10 fb−1 ,
N = σLint /N ,
where σ is the cross section, in pb, corresponding to the process under consideration, Lint the integrated luminosity (thus set to 10000 pb−1 ) and N the
number of events included in the samples. As stated above, the value of the
cross section read from the LHE files is stored in the SampleFormat object
summary (see Section 5.4) where the average over both input samples has
been performed. The corresponding C++ implementation of the function
Finalize reads
void user::Finalize(const SampleFormat& summary,
const std::vector<SampleFormat>& files)
{
106
// Color of the canvas background
gStyle->SetCanvasColor(0);
// Turning off the border lines of the canvas
gStyle->SetCanvasBorderMode(0);
// Configuring statistics printing
gStyle->SetOptStat(111110);
// Creating the output root file
TCanvas* myCanvas = new TCanvas("myCanvas","");
// Setting background color
myHisto->SetFillColor(kBlue);
// Normalization of the histogram: L = 10 fb-1
double nrm = summary.mc()->xsection() * 10000. /
static_cast<float>(summary.nevents());
myHisto->Scale(nrm);
// Setting axis title
myHisto->GetXaxis()->SetTitle("cos#theta^{*}");
// Drawing histogram
myHisto->Draw();
// Saving plot
myCanvas->SaveAs((outputName_+".eps").c_str());
}
After compiling the analysis and linking it to the external libraries with
the help of the provided Makefile located in the SampleAnalyzer directory,
the analysis can be executed,
SampleAnalyzer --analysis="W polarization from a top decay" \
list.txt
where list.txt is a text file containing the absolute paths to the two event
samples under consideration. A figure, named list.eps, is generated in the
107
*
cosθ
Entries
2000
Mean
-0.139
RMS
0.4947
Underflow
0
Overflow
0
14000
12000
10000
8000
6000
4000
2000
-1
-0.8
-0.6
-0.4
-0.2
0
0.2
0.4
0.6
0.8
cosθ
1
*
Figure 5: cos θ∗ distribution for the production of a top-antitop pair semi-leptonically
decaying. The θ∗ angle is defined as in the text.
directory where the executable is stored. The results, shown in Figure 5,
agree, for instance, with Ref. [63].
6. Conclusions
The task of performing a phenomenological analysis based on event files
such as those generated by Monte Carlo generators can be divided into three
stages. Firstly, the event samples must be read and loaded into the memory of the computer. The format of these files depends in general on the
level of sophistication of the analysis (at the parton-level, hadron-level or
reconstructed-level). Secondly, the analysis itself must be performed, i.e.,
selection cuts are applied on the signal and background event samples with
the aim of being able to extract information on the signal from the often
overwhelming background. Finally, the results are outputted as histograms
and/or cut-flow charts to improve their readability and interpretation.
In this work, we have presented MadAnalysis 5, a new user-friendly and
efficient framework aiming to facilitate the implementation of phenomenological analyses such as the one described above. We have explained how to
108
implement and run an analysis within this framework in a straightforward
way and have given several detailed examples addressing the different facets
of the program.
MadAnalysis 5 is based on a multi-purpose C++ kernel, SampleAnalyzer, which uses the Root platform. Compatible with most of the event
file formats commonly used for analyzing parton-level, hadron-level and reconstructed events, MadAnalysis 5 offers two modes of running according
to the needs and the expertise of the user.
A highly-user-friendly mode, the normal running mode of the program,
uses the strengths of a Python interface to reduce the implementation of
an analysis to a set of intuitive commands whose syntax has been inspired
by the Python programming language. Therefore, rather complex analyses
can be achieved without too much effort.
For users with more advanced C++ and Root programming skills,
MadAnalysis 5 can also be run in its expert mode. This overcomes the
limitations of the normal mode of running in which the scope is restricted
by the set of functionalities that have been implemented. The user is in this
case required to directly implement his analysis in C++ within the SampleAnalyzer framework, rendering the possibilities, at the analysis level, only
limited by the imagination and the skills of the user. However, even if this
mode of running is in principle more complicated to handle, the existence of
many built-in functions and methods renders the task of implementing the
analysis easier and more straightforward.
Acknowledgments
The authors are extremely grateful to J. Andrea for being the first user
and beta-tester of this program. We also thank the MadGraph 5 development team (J. Alwall, F. Maltoni, O. Mattelaer and T. Stelzer) and R.
Frederix for commenting and supporting the development of MadAnalysis 5 as well as our colleagues from Strasbourg for their help in testing and
debugging the code, J.L. Agram, A. Alloul, A. Aubin, E. Chabert, C. Collard, A. Gallo, P. Lansonneur and S. Marrazzo. Finally, we acknowledge
V. Boucher, J. de Favereau and P. Demin for their help in administrating
our web and svn server. This work has been supported by the Theory-LHC
France-initiative of the CNRS/IN2P3 and a Ph.D. fellowship of the French
ministry for education and research.
109
Appendix A. Installation of the program
Appendix A.1. Requirements
For a proper running, MadAnalysis 5 requires several mandatory external libraries. In addition, the full set of functionalities of the program
can be made available by installing optional external dependencies on the
computer of the user. If these optional libraries are absent, several of the
functionalities of MadAnalysis 5 are deactivated but analyses of event files
can still be performed. In contrast, the absence of one of the mandatory
external libraries simply does not allow use of the program.
In order to run MadAnalysis 5 locally, Python 2.6 or a more recent
version (however not from the 3.x series) must be installed on the computer
of the user [64]. We recall that in order to check the version of Python
present on a system, it is enough to type in a shell
python --version
The installation of the Python package is one of the three mandatory requirements without which the program cannot run. The two other external
packages that have to be installed are related to C++ and Root.
The SampleAnalyzer kernel requires the installation of a C++ compiler together with the associated Standard Template Libraries (STL). Since
the validation procedure of MadAnalysis 5 has only been achieved within
the context of the GNU gcc compiler and since this compiler is available
on most operating systems [65], we have adopted the choice of requiring the
installation of gcc. The program has been validated with the versions 4.3.x
and 4.4.x. We recall that the version of the gcc installed on a system can
be obtained by issuing in a shell
g++ --version
Let us however stress that compatibility with any other C++ compiler is
in principle ensured, but requires the modification of several core files of
MadAnalysis 5. Therefore, it is currently not supported.
Concerning the Root package, a version more recent than version 5.27
has to be installed [66], and the user has to check that the Python functionalities of the Root library are available. We remind that in order to
install a version of Root including its Python library, the Linux package
Python-devel has to be present on the system of the user and the Root
configuration script must be run as
110
./configure --with-python
Very importantly, the version of Python employed to start MadAnalysis 5 must match the one used to generate the Python library of Root.
Finally, the version of Root present on a computer, together with the compatibility with the Python language, can be checked by issuing in a shell
the commands
root-config --version
root-config --has-python
The three above-mentioned programs, i.e., Python, the gcc compiler
and Root, must be available from any location of the computer. If this is
not the case, the user has to modify the system variable $PATH. If these programs have been installed at standard location on the system, the necessary
environment variables are set automatically by MadAnalysis 5. Contrary,
it is left to the user to check that the paths to the associated header and
library files are included in the environment variables of the gcc compiler,
$CPLUS INCLUDE PATH and $LIBRARY PATH. Finally, for a proper linking of
the external libraries, the variable $LD LIBRARY PATH (or, on MacOS operating systems, $DYLD LIBRARY PATH) must also contain the paths to the
libraries to be linked.
We now turn to the optional libraries that can be linked to MadAnalysis
5. In order to handle zipped Monte Carlo event samples, the zlib library has
to be installed on the system [67]. However, if zlib is not locally installed,
the possibility of analyzing zipped event samples is simply deactivated, i.e.,
the user will have to unzip the event files manually before running the code.
Appendix A.2. Downloading the program
It is recommended to always use the latest stable version of the MadAnalysis 5 package, which contains, when downloaded from the web, both
the Python command line interface and the SampleAnalyzer framework.
It can always be found together with an up-to-date manual on the webpage
http://madanalysis.irmp.ucl.ac.be
The package does not require any compilation or configuration. After
having downloaded the tar-ball from the website, it can be unpacked either
in the directory where MadGraph 5 is installed,
cd <path-to-madgraph>
tar -xvf ma5_xxxx.tgz
111
or in any location on the computer of the user,
mkdir <ma5-dirname>
cd <ma5-dirname>
tar -xvf ma5_xxxx.tgz
where xxxx stands for the version number of the MadAnalysis 5 release
which has been downloaded. When MadAnalysis 5 is installed as a dependency of MadGraph 5, the list of predefined particle and multiparticle
labels is directly updated from the MadGraph 5 standards. Moreover, this
allows to perform analyses at the time of the event generation by MadGraph 5 which, in this case, pilots MadAnalysis 5. We emphasize that
several predefined analyses exist, but the user has the freedom to tune the
desired analysis to be performed according to his own aims.
Once installed and unpacked, MadAnalysis 5 can be immediately launched by issuing in a shell
bin/ma5
as presented in Section 4.1.
Appendix A.3. Running MadAnalysis 5
When started, MadAnalysis 5 first checks that all the dependencies
(gcc, Python, Root, zlib) are present on the system and that compatibility is ensured with the installed versions. In the case of any problem,
a message is printed to the screen and the code exists if it is found that it
cannot properly run. On the first session of MadAnalysis 5, the SampleAnalyzer core is compiled behind the scene as a static library stored in
the directory lib. For the next sessions, the kernel is only recompiled if the
configuration of the system has changed (new version of the dependencies or
of the main program).
References
[1] M. L. Mangano, M. Moretti, F. Piccinini, R. Pittau, A. D. Polosa, ALPGEN, a generator for hard multiparton processes in hadronic collisions,
JHEP 07 (2003) 001. arXiv:hep-ph/0206293.
[2] T. Gleisberg, S. Hoche, Comix, a new matrix element generator, JHEP
12 (2008) 039. arXiv:0808.3674, doi:10.1088/1126-6708/2008/12/039.
112
[3] A. Pukhov, et al., CompHEP: A package for evaluation of Feynman
diagrams and integration over multi-particle phase space. User’s manual
for version 33, arXiv:hep-ph/9908288.
[4] E. Boos, et al., CompHEP 4.4: Automatic computations from Lagrangians to events, Nucl. Instrum. Meth. A534 (2004) 250–259.
arXiv:hep-ph/0403113, doi:10.1016/j.nima.2004.07.096.
[5] A. Pukhov, CalcHEP 3.2: MSSM, structure functions, event generation,
batchs, and generation of matrix elements for other packages, arXiv:hepph/0412191.
[6] A. Cafarella, C. G. Papadopoulos, M. Worek, Helac-Phegas: a generator
for all parton level processes, Comput. Phys. Commun. 180 (2009) 1941–
1955. arXiv:0710.2427, doi:10.1016/j.cpc.2009.04.023.
[7] T. Stelzer, W. F. Long, Automatic generation of tree level helicity
amplitudes, Comput. Phys. Commun. 81 (1994) 357–371. arXiv:hepph/9401258, doi:10.1016/0010-4655(94)90084-1.
[8] F. Maltoni, T. Stelzer, MadEvent: Automatic event generation with
MadGraph, JHEP 02 (2003) 027. arXiv:hep-ph/0208156.
[9] J. Alwall, et al., MadGraph/MadEvent v4: The New Web Generation,
JHEP 09 (2007) 028. arXiv:0706.2334.
[10] J. Alwall, et al., New Developments in MadGraph/MadEvent, AIP Conf.
Proc. 1078 (2009) 84–89. arXiv:0809.2410, doi:10.1063/1.3052056.
[11] J. Alwall, M. Herquet, F. Maltoni, O. Mattelaer, T. Stelzer, MadGraph 5 : Going Beyond, JHEP 1106 (2011) 128. arXiv:1106.0522,
doi:10.1007/JHEP06(2011)128.
[12] T. Gleisberg, et al., SHERPA 1.alpha, a proof-of-concept version, JHEP
02 (2004) 056. arXiv:hep-ph/0311263.
[13] T. Gleisberg, et al., Event generation with SHERPA 1.1, JHEP 02 (2009)
007. arXiv:0811.4622, doi:10.1088/1126-6708/2009/02/007.
[14] M. Moretti, T. Ohl, J. Reuter, O’Mega: An Optimizing matrix element
generator, arXiv:hep-ph/0102195.
113
[15] W. Kilian, T. Ohl, J. Reuter, WHIZARD: Simulating Multi-Particle
Processes at LHC and ILC, Eur. Phys. J. C71 (2011) 1742.
arXiv:0708.4233, doi:10.1140/epjc/s10052-011-1742-y.
[16] T. Gleisberg, F. Krauss, Automating dipole subtraction for QCD NLO
calculations, Eur. Phys. J. C53 (2008) 501–523. arXiv:0709.2881,
doi:10.1140/epjc/s10052-007-0495-0.
[17] M. H. Seymour, C. Tevlin, TeVJet: A general framework for the calculation of jet observables in NLO QCD, arXiv:0803.2231.
[18] K. Hasegawa, S. Moch, P. Uwer, Automating dipole subtraction,
Nucl. Phys. Proc. Suppl. 183 (2008) 268–273.
arXiv:0807.3701,
doi:10.1016/j.nuclphysbps.2008.09.115.
[19] R. Frederix, T. Gehrmann, N. Greiner, Automation of the Dipole
Subtraction Method in MadGraph/MadEvent, JHEP 09 (2008) 122.
arXiv:0808.2128, doi:10.1088/1126-6708/2008/09/122.
[20] M. Czakon, C. G. Papadopoulos, M. Worek, Polarizing the
Dipoles, JHEP 08 (2009) 085. arXiv:0905.0883, doi:10.1088/11266708/2009/08/085.
[21] R. Frederix, S. Frixione, F. Maltoni, T. Stelzer, Automation of nextto-leading order computations in QCD: the FKS subtraction, JHEP 10
(2009) 003. arXiv:0908.4272, doi:10.1088/1126-6708/2009/10/003.
[22] G. Ossola, C. G. Papadopoulos, R. Pittau, CutTools: a program
implementing the OPP reduction method to compute one-loop amplitudes, JHEP 03 (2008) 042. arXiv:0711.3596, doi:10.1088/11266708/2008/03/042.
[23] G. Zanderighi, Recent theoretical progress in perturbative QCD,
arXiv:0810.3524.
[24] V. Hirschi, et al., Automation of one-loop QCD corrections, JHEP 05
(2011) 044. arXiv:1103.0621, doi:10.1007/JHEP05(2011)044.
[25] G. Cullen, N. Greiner, G. Heinrich, G. Luisoni, P. Mastrolia, et al., Automated One-Loop Calculations with GoSam, Eur.Phys.J. C72 (2012)
1889. arXiv:1111.2034.
114
[26] F. Cascioli, P. Maierhofer, S. Pozzorini, Scattering Amplitudes with
Open Loops, Phys.Rev.Lett. 108 (2012) 111601. arXiv:1111.5206,
doi:10.1103/PhysRevLett.108.111601.
[27] R. K. Ellis, K. Melnikov, G. Zanderighi, Generalized unitarity at work:
first NLO QCD results for hadronic W + 3jet production, JHEP 04
(2009) 077. arXiv:0901.4101, doi:10.1088/1126-6708/2009/04/077.
[28] C. F. Berger, et al., Precise Predictions for W + 3 Jet Production at
Hadron Colliders, Phys. Rev. Lett. 102 (2009) 222001. arXiv:0902.2760,
doi:10.1103/PhysRevLett.102.222001.
[29] A. van Hameren, C. G. Papadopoulos, R. Pittau, Automated one-loop
calculations: a proof of concept, JHEP 09 (2009) 106. arXiv:0903.4665,
doi:10.1088/1126-6708/2009/09/106.
[30] C. F. Berger, et al., Next-to-Leading Order QCD Predictions for
Z, gamma∗ +3-Jet Distributions at the Tevatron, Phys. Rev. D82 (2010)
074002. arXiv:1004.1659, doi:10.1103/PhysRevD.82.074002.
[31] C. F. Berger, et al., Precise Predictions for W + 4 Jet Production
at the Large Hadron Collider, Phys. Rev. Lett. 106 (2011) 092001.
arXiv:1009.2338, doi:10.1103/PhysRevLett.106.092001.
[32] N. D. Christensen, C. Duhr, FeynRules - Feynman rules made easy,
Comput. Phys. Commun. 180 (2009) 1614–1641. arXiv:0806.4194,
doi:10.1016/j.cpc.2009.02.018.
[33] N. D. Christensen, P. de Aquino, C. Degrande, C. Duhr, B. Fuks, et al.,
A Comprehensive approach to new physics simulations, Eur.Phys.J. C71
(2011) 1541. arXiv:0906.2474, doi:10.1140/epjc/s10052-011-1541-5.
[34] N. D. Christensen, C. Duhr, B. Fuks, J. Reuter, C. Speckner, Introducing an interface between WHIZARD and FeynRules, Eur.Phys.J. C72
(2012) 1990. arXiv:1010.3251.
[35] C. Duhr, B. Fuks, A superspace module for the FeynRules package, Comput. Phys. Commun. 182 (2011) 2404–2426. arXiv:1102.4191,
doi:10.1016/j.cpc.2011.06.009.
115
[36] B. Fuks, Beyond the Minimal Supersymmetric Standard Model:
from theory to phenomenology, Int.J.Mod.Phys. A27 (2012) 1230007.
arXiv:1202.4769, doi:10.1142/S0217751X12300074.
[37] A. Semenov, LanHEP: A package for automatic generation of Feynman
rules from the Lagrangian, Comput. Phys. Commun. 115 (1998) 124–
139. doi:10.1016/S0010-4655(98)00143-X.
[38] A. Semenov, LanHEP - a package for the automatic generation of Feynman rules in field theory. Version 3.0arXiv:0805.0555.
[39] C. Degrande, C. Duhr, B. Fuks, D. Grellscheid, O. Mattelaer, et al.,
UFO - The Universal FeynRules Output, Comput.Phys.Commun. 183
(2012) 1201–1214. arXiv:1108.2040, doi:10.1016/j.cpc.2012.01.022.
[40] P. de Aquino, W. Link, F. Maltoni, O. Mattelaer, T. Stelzer, ALOHA:
Automatic Libraries Of Helicity Amplitudes for Feynman diagram computations,arXiv:1108.2041.
[41] E. Boos, M. Dobbs, W. Giele, I. Hinchliffe, J. Huston, et al., Generic
user process interface for event generators, arXiv:hep-ph/0109068.
[42] J. Alwall, A. Ballestrero, P. Bartalini, S. Belov, E. Boos, et al., A Standard format for Les Houches event files, Comput.Phys.Commun. 176
(2007) 300–304. arXiv:hep-ph/0609017, doi:10.1016/j.cpc.2006.11.010.
[43] T. Sjostrand, S. Mrenna, P. Skands, PYTHIA 6.4 physics and manual,
JHEP 05 (2006) 026. arXiv:hep-ph/0603175.
[44] T. Sjostrand, S. Mrenna, P. Skands, A Brief Introduction to PYTHIA
8.1, Comput. Phys. Commun. 178 (2008) 852–867. arXiv:0710.3820,
doi:10.1016/j.cpc.2008.01.036.
[45] G. Corcella, et al., HERWIG 6: An event generator for hadron emission
reactions with interfering gluons (including supersymmetric processes),
JHEP 01 (2001) 010. arXiv:hep-ph/0011363.
[46] M. Bahr, S. Gieseke, M. Gigg, D. Grellscheid, K. Hamilton, et al.,
Herwig++ Physics and Manual, Eur.Phys.J. C58 (2008) 639–707.
arXiv:0803.0883, doi:10.1140/epjc/s10052-008-0798-9.
116
[47] S. Catani, F. Krauss, R. Kuhn, B. Webber, QCD matrix elements +
parton showers, JHEP 0111 (2001) 063. arXiv:hep-ph/0109231.
[48] F. Krauss, Matrix elements and parton showers in hadronic interactions,
JHEP 0208 (2002) 015. arXiv:hep-ph/0205283.
[49] S. Mrenna, P. Richardson, Matching matrix elements and parton showers with HERWIG and PYTHIA, JHEP 0405 (2004) 040. arXiv:hepph/0312274, doi:10.1088/1126-6708/2004/05/040.
[50] M. L. Mangano, M. Moretti, F. Piccinini, M. Treccani, Matching
matrix elements and shower evolution for top-quark production in
hadronic collisions, JHEP 0701 (2007) 013. arXiv:hep-ph/0611129,
doi:10.1088/1126-6708/2007/01/013.
[51] http://cepa.fnal.gov/psm/stdhep/c++/.
[52] M. Dobbs, J. B. Hansen, The HepMC C++ Monte Carlo event record
for High Energy Physics, Comput.Phys.Commun. 134 (2001) 41–46.
doi:10.1016/S0010-4655(00)00189-2.
[53] M. Cacciari, G. P. Salam, Dispelling the N 3 myth for the kt
jet-finder, Phys.Lett. B641 (2006) 57–61.
arXiv:hep-ph/0512210,
doi:10.1016/j.physletb.2006.08.037.
[54] http://physics.ucdavis.edu/∼conway/research/software/pgs/pgs4general.htm.
[55] S. Ovyn, X. Rouby, V. Lemaitre, DELPHES, a framework for fast simulation of a generic collider experiment, arXiv:0903.2225.
[56] http://www.jthaler.net/olympicswiki/.
[57] R. Brun, F. Rademakers, ROOT: An object oriented data analysis
framework, Nucl.Instrum.Meth. A389 (1997) 81–86. doi:10.1016/S01689002(97)00048-X.
[58] P. Demin, G. Bruno, ExRootAnalysis - a tool for CMS data analysis,
preliminary draft (2005).
[59] K. Nakamura, et al., Review of particle physics, J.Phys.G G37 (2010)
075021. doi:10.1088/0954-3899/37/7A/075021.
117
[60] J. Pumplin, D. Stump, J. Huston, H. Lai, P. M. Nadolsky, et al., New
generation of parton distributions with uncertainties from global QCD
analysis, JHEP 0207 (2002) 012. arXiv:hep-ph/0201195.
[61] H. Plothow-Besch, PDFLIB: A Library of all available parton density
functions of the nucleon, the pion and the photon and the corresponding alpha-s calculations, Comput.Phys.Commun. 75 (1993) 396–416.
doi:10.1016/0010-4655(93)90051-D.
[62] W. Giele, et al., The QCD / SM working group: Summary report,
arXiv:hep-ph/0204316.
[63] A. Giammanco, Top quark studies and perspectives with cms, in: X. Wu,
A. Clark, M. Campanelli (Eds.), Hadron Collider Physics 2005, Vol. 108
of Springer Proceedings in Physics, Springer Berlin Heidelberg, 2006,
pp. 311–314.
[64] http://www.python.org.
[65] http://www.gcc.gnu.org.
[66] http://root.cern.ch.
[67] http://www.zlib.net.
118