1
Bachelor–Thesis
in
Allgemeine Informatik
A day in the life of our eyes
Referent:
Prof. Dr. Lothar Piepmeyer
Hochschule Furtwangen
Koreferent:
Prof. Dr. Hans Gellersen
Lancaster University
vorgelegt am:
31. Januar, 2012
vorgelegt von: Christian Weichel
13 Queen Street, LA1 1RS
Lancaster, United Kingdom
Abstract
Using the eyes as input modality has a long history in human computer interaction.
However, most eye-related work is focused on using gaze only. It is only recently that
eye-movement is considered a context source and a possibility for activity recognition.
Still eye-related research is bound to controlled laboratory settings and of short-term
nature as existing video-based eye-trackers do not allow long-term data collection in a
daily life setting.
In this work we built an experimental system, including an activity centric study design and
technical implementation. The system is includes an electrooculography based eye-tracker,
as well as a user interface and video based ground truth recording. We use this system to
perform a user study with seven participants collecting data over a time of 86.7 hours in a
daily life setting and verify the soundness and validity of the system by verifying existing
findings using the recorded data. The experimental system and collected data form the
base for future daily life eye-movement related work.
Keywords: EOG, eye tracking, human computer interaction, activity recognition
i
ii
Abstract
Contents
Abstract
i
List of Figures
vii
List of Tables
ix
Listings
xi
Abbreviations
1
2
Introduction
1
1.1
1.2
1.3
1
2
2
Context and Objectives . . . . . . . . . . . . . . . . . . . . . . . . . . .
Challenges . . . . . . . . . . . . . . . . . . . . . . . . . . . . . . . . . .
Structure of the thesis . . . . . . . . . . . . . . . . . . . . . . . . . . . .
Related work and background
2.1
2.2
2.3
3
xiii
5
Human-computer interaction and ubiquitous computing
Our eyes . . . . . . . . . . . . . . . . . . . . . . . . .
2.2.1 Types of eye movements . . . . . . . . . . . .
Eye-tracking . . . . . . . . . . . . . . . . . . . . . . .
2.3.1 Electrooculography . . . . . . . . . . . . . . .
.
.
.
.
.
.
.
.
.
.
.
.
.
.
.
.
.
.
.
.
.
.
.
.
.
.
.
.
.
.
.
.
.
.
.
.
.
.
.
.
.
.
.
.
.
.
.
.
.
.
Development of the experimental system
3.1
3.2
3.3
Requirements . . . . . . . . . . . . . . . .
Ground truth . . . . . . . . . . . . . . . . .
3.2.1 Labeling . . . . . . . . . . . . . .
3.2.2 Video recording and spatial location
Technical realization . . . . . . . . . . . .
5
6
7
7
9
11
.
.
.
.
.
.
.
.
.
.
.
.
.
.
.
.
.
.
.
.
.
.
.
.
.
.
.
.
.
.
.
.
.
.
.
.
.
.
.
.
.
.
.
.
.
.
.
.
.
.
.
.
.
.
.
.
.
.
.
.
.
.
.
.
.
.
.
.
.
.
.
.
.
.
.
.
.
.
.
.
11
12
12
13
15
iii
Contents
iv
3.3.1
3.3.2
3.3.3
4
4.2
4.3
Preparation . . . . . . . . . . . . . . . . . . . . . . .
4.1.1 Preparing the equipment . . . . . . . . . . . .
4.1.2 Training the participant . . . . . . . . . . . . .
4.1.3 Consent form and survey . . . . . . . . . . . .
Data collection . . . . . . . . . . . . . . . . . . . . .
4.2.1 System performance and problems encountered
Preprocessing . . . . . . . . . . . . . . . . . . . . . .
Methodology . . . . . . . . . .
Feature extraction . . . . . . . .
First results . . . . . . . . . . .
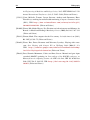
5.3.1 Leisure vs. concentrated
Conclusion
16
18
20
21
21
24
24
25
26
27
29
31
31
33
.
.
.
.
.
.
.
.
.
.
.
.
.
.
.
.
.
.
.
.
.
.
.
.
.
.
.
.
.
.
.
.
.
.
.
.
.
.
.
.
.
.
.
.
.
.
.
.
.
.
.
.
.
.
.
.
.
.
.
.
.
.
.
.
.
.
.
.
.
.
System verification and data analysis
5.1
5.2
5.3
6
.
.
.
.
.
.
.
.
.
.
.
.
.
Data acquisition
4.1
5
TMSi Mobi8 body signal amplifier . . . . . . . . . . . . . . .
3.3.1.1 TMSi procotol . . . . . . . . . . . . . . . . . . . . .
3.3.1.2 Byte order and unsigned integers issues . . . . . . . .
3.3.1.3 Verification and debugging . . . . . . . . . . . . . .
3.3.1.4 Open issues . . . . . . . . . . . . . . . . . . . . . .
Microsoft SenseCam . . . . . . . . . . . . . . . . . . . . . . .
3.3.2.1 Time synchronization . . . . . . . . . . . . . . . . .
Android data recorder . . . . . . . . . . . . . . . . . . . . . .
3.3.3.1 Initializing the recorder . . . . . . . . . . . . . . . .
3.3.3.2 Applying labels and monitoring the Mobi connection
3.3.3.3 Recording EOG data . . . . . . . . . . . . . . . . . .
3.3.3.4 Recording the GPS track . . . . . . . . . . . . . . .
3.3.3.5 Battery runtime optimizations . . . . . . . . . . . . .
33
34
34
36
36
37
38
43
.
.
.
.
.
.
.
.
.
.
.
.
.
.
.
.
.
.
.
.
.
.
.
.
.
.
.
.
.
.
.
.
.
.
.
.
.
.
.
.
.
.
.
.
.
.
.
.
.
.
.
.
.
.
.
.
.
.
.
.
.
.
.
.
.
.
.
.
.
.
.
.
.
.
.
.
.
.
.
.
.
.
.
.
.
.
.
.
43
45
46
47
51
Bibliography
53
A Data loss and signal corruption
61
B Study preparation checklist
65
Contents
v
C Study consent form
67
D Participant survey
69
E CD-ROM
71
F Acknowledgements
73
vi
Contents
List of Figures
2.1
2.2
2.3
SMI Eye Tracking Glasses (courtesy SensoMotoric Instruments GmbH,
Dikablis (courtesy Ergoneers GmbH) . . . . . . . . . . . . . . . . . . . 8
The eye forms a dipole between the cornea and retina. . . . . . . . . . . . 9
Wearable Electrooculography (EOG) gogles . . . . . . . . . . . . . . . . 10
3.1
3.2
3.3
3.4
3.5
3.6
3.7
3.8
3.9
3.10
3.11
3.12
Several data streams have to be synchronized . . . . . . . . . . .
TMSi protocol stack architecture . . . . . . . . . . . . . . . . . .
The structure of a package in the TMSi protocol. . . . . . . . . .
Top side of the Mobi providing the female electrode ports . . . . .
Connecting the electrodes to the Mobi . . . . . . . . . . . . . . .
The fixOverflow algorithm . . . . . . . . . . . . . . . . . . . . .
Over-/underflow corrected EOG signal . . . . . . . . . . . . . . .
Vicon REVUE, a commercial version of the Microsoft SenseCam
Synchronizing the SenseCam and smartphone . . . . . . . . . . .
The data recorder architecture . . . . . . . . . . . . . . . . . . .
GUI of the StatusActivity . . . . . . . . . . . . . . . . . . . .
EOG logging initialization . . . . . . . . . . . . . . . . . . . . .
4.1
4.2
4.3
Packed recording equipment . . . . . . . . . . . . . . . . . . . . . . . . 35
The preprocessing pipeline . . . . . . . . . . . . . . . . . . . . . . . . . 39
Interpolating point labels to continuous events . . . . . . . . . . . . . . . 40
5.1
5.2
5.3
Extracting a set of features out of segmented data . . . . . . . . . . . . . 44
The blink rate partitioned by the labels concentrated and leisure. . . . . . 48
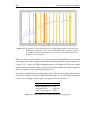
The mean saccade amplitude of all datasets partitioned by the labels
concentrated and leisure. . . . . . . . . . . . . . . . . . . . . . . . . . . 49
.
.
.
.
.
.
.
.
.
.
.
.
.
.
.
.
.
.
.
.
.
.
.
.
.
.
.
.
.
.
.
.
.
.
.
.
.
.
.
.
.
.
.
.
.
.
.
.
15
17
19
22
22
23
23
24
25
26
28
30
vii
viii
List of Figures
A.1 Testing the recorded signal against a predefined blink pattern. . . . . . . . 62
A.2 Signal corruption due to too low packet reception speed . . . . . . . . . . 63
List of Tables
2.1
A classification of eye-movement types . . . . . . . . . . . . . . . . . .
3.1
3.2
3.3
3.4
Overview of ground-truthing methods . . .
The coding scheme used for this work . . .
Criteria for choosing a smartphone platform
Datalogger file structure . . . . . . . . . .
4.1
4.2
The structure of a participants day. . . . . . . . . . . . . . . . . . . . . . 37
The encoded label configurations . . . . . . . . . . . . . . . . . . . . . . 41
5.1
An overview of the set of features extracted from each data segment. . . . 45
.
.
.
.
.
.
.
.
.
.
.
.
.
.
.
.
.
.
.
.
.
.
.
.
.
.
.
.
.
.
.
.
.
.
.
.
.
.
.
.
.
.
.
.
.
.
.
.
.
.
.
.
.
.
.
.
.
.
.
.
.
.
.
.
6
13
14
16
30
A.1 All known parameters influencing the data dropping rate. . . . . . . . . . 62
ix
x
List of Tables
Listings
3.1
3.2
TMSi protocol checksum computation . . . . . . . . . . . . . . . . . . . 19
Example of a datalogger file . . . . . . . . . . . . . . . . . . . . . . . . 30
xi
xii
Listings
Abbreviations
ACK
Acknowledge
ADC
Analog/Digital Converter
AIDL
Android Interface Definition Language
API
Application Programmer Interface
CRNT
Context Recognition Network Toolbox
EDA
Exploratory Data Analysis
EOG
Electrooculography
GUI
Graphical User Interface
HCI
Human Computer Interaction
I/O
Input/Output
IPC
Inter-Process Communication
MAC
Media Access Control
NDK
Native Development Toolkit
NiMH
Nickel-Metal-Hybrid
PIR
Passive Infrared Sensor
POJO
Plain Old Java Object
RTC
Real-Time Clock
SPP
Serial Port Profile
TMSi
Twente Medical Systems International
USB
Universal Serial Bus
UbiComp
Ubiquitous Computing
xiii
xiv
Abbreviations
CHAPTER 1
Introduction
In the past few years, the way we use computers has changed drastically. They are
no longer encased in laptops and desktop machines, but have turned into smartphones
and game consoles. Traditional input devices such as mouse and keyboard have been
substituted for touch-screens, motion sensors and gesture recognition. This new generation
of computers is seemingly becoming intelligent by gathering context information about
their environment using sensors and machine learning algorithms.
An emerging source of such context information are the eyes. Established applications
in this regard are for example drowsiness detection using the blink rate [Sch08]. In the
Human Computer Interaction (HCI) domain they’re used as input modality [Cou11], but
they can also be used for activity recognition [Bul11] and even contain markers for mental
illnesses [Vid11].
However, all eye-related studies performed so far are of short length (up to four hours) and
mostly within a controlled laboratory setting. In this work we recorded the eye-movements
of seven participants during their daily life over a period of at least twelve hours; no such
dataset existed as of yet. We devised activity centric recording procedures and built a
system that supports such a recording.
1.1 Context and Objectives
We want record eye-movement data over a whole day and then exploratively look for
patterns and trends. Until now, no such study has been performed as the technical
1
2
1 Introduction
prerequisites were not available. Hence, we needed to build a system that supports such
long runtimes and is unobtrusive enough to be worn during the period of twelve hours.
In addition to creating the technical prerequisites, we needed to design a study and devised
proper procedures. We designed a user training introducing them to the system and their
duties as participants, thus enabling them to perform a day-long data recording session.
Within a months time, we performed that recording with seven participants.
Once the data is recorded, we process it and apply methods of exploratory data analysis in
order to find interesting trends and patterns in the data. After segmenting the data into
handleable chunks (also called windows), we go on to compute several features such as
mean blink rate or mean fixation length.
1.2 Challenges
The 12h continuous recording length of the study poses several issues in a mobile environment. All technical components involved in the recording have to be able to run on battery
for the required time. Additionally, the motivation and concentration of the participants
might be diminishing over time, something the study design must account for.
When performing a study which involves sensible recording equipment, one is bound
experience issues during data recording. As the habits of some participants might interfere
with recording, we have to provide a participant training that guarantees good data quality.
Such habits include touching ones face rather often resulting in signal artifacts or forgetting
parts of the wireless recording equipment when leaving the room.
Analyzing the recorded data is a challenge itself. There is no established methodology
for analyzing such a vast amount of eye-movement data. Although proper study design
should ease the analysis, identifying proper statistical tools remains an open issue.
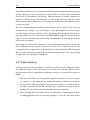
1.3 Structure of the thesis
Chapters 1–2 introduce the reader to the thesis itself and give an introduction into the
background theory necessary to understand the subsequent work. Chapter 3 describes
the development of the experimental system in terms of study design and technical
1.3 Structure of the thesis
3
implementation. In chapter 4 we describe the study preparation, data collection and
preprocessing. Chapter 5 explains our analysis methodology and framework, but also
gives evidence for the soundness of the experimental system. The thesis ends with its
conclusion and a list of open questions in chapter 6. See below for an overview.
Chapter 1 serves as an entry point to this thesis. We’ll introduce the context of the work
and define its objectives, as well as give an overview of the challenges faced during
this thesis.
Chapter 2 provides an introduction into topics necessary to understand this thesis. Thus
it deals with the human eyes, ubiquitous computing and eye-tracking (with special
focus on electrooculography).
Chapter 3 describes the development of the experimental system, including the study
design as well as the technical implementation of the recording system.
Chapter 4 lists the circumstances under which we performed the study. We’ll present
the study preparation, challenges faced during execution and the data preprocessing.
Chapter 5 performs a first analysis of the data. We give descriptive statistics of the
dataset and show a preliminary set of trends we found.
Chapter 6 summarizes the work and draws a conclusion. Further open questions and
possible applications are presented.
4
1 Introduction
CHAPTER 2
Related work and background
2.1 Human-computer interaction and ubiquitous
computing
Human Computer Interaction (HCI) is the study of interaction between users and computers and represents the intersection of computer science, behavioral sciences and psychology
[Car00]. Interacting with a computer is compromised of using software and hardware,
with the two most prominent input devices being the computer mouse and keyboard.
Ubiquitous Computing (UbiComp) is a human-computer interaction model where the
computer is no longer a dedicated device requiring explicit input, but is pervasive and
seemingly intelligent by gathering context information and recognizing user activities
using sensors. As Weiser defines it is [Wei91]:
Machines that fit the human environment, instead of forcing humans to enter
theirs [. . .]
A large amount of eye-related research in HCI (or UbiComp, for that matter) focus
on using gaze as input modality. The first computer systems controlled using the eyes
were gaze-based [Hut89], and fixations still remain a prominent way of implementing
eye-movement based computer input [Zha99, Tur11].
Although it is long known that eye-movement contains more information than just the
gaze, exploiting that information as a source of context and for activity recognition is a
rather new trend. Some applications use the blink rate and blink length as metric for driver
5
2 Related work and background
6
attention [Caf03]. More complex oculographic features can even be used for activity
recognition (e.g. if recognizing someone’s reading [Bul11]).
There is information in eye-movement of which we know it exists – e.g. bio-markers for
mental illnesses [Vid11]. However, there are no algorithms yet to automatically extract that
information from measurement data. There might even be information in eye-movement of
which we are completely unaware as of yet and it is the purpose of this work to potentially
find such information.
2.2 Our eyes
As one of our five senses, our eyes provide several important functions. We use them for
scene perception and navigation, for consuming information (i.e. by reading) and even
communication. All of those activities have been studied to a great extend, with reading
receiving the most attention [Ray98].
A great share of eye-movement related research has been done in psychology and neurobiology, where eye-movement was found closely linked to several cognitive processes
[Duc02]. For example, attention and drowsiness can be measured using oculographic
features [Liv00, Caf03].
Traditionally, eye-tracking applications were based on fixations, e.g. evaluating product
placement strategies [Wed00] or using gaze as an input modality [Zha99]. It is only
until recently, that other types of eye-movement are considered as a source of activity
and context information. Table 2.1 gives an overview of the different types of eyemovements.
type of movement
main function
saccades
fixations
vestibulo-ocular reflex
Bring images of interest onto the fovea.
Holds the image of a stationary image on the fovea.
Stabilizes the image of the seen world during small brief
movements.
Holds the image of a small moving object on the fovea; aids
gaze stabilization during sustained head rotation.
Tracks steady objects when in a moving reference frame.
smooth pursuit
optokinetic reflex
Table 2.1: A classification of eye-movement types (based on [Lei99])
2.3 Eye-tracking
7
2.2.1 Types of eye movements
When viewing a visual scene, the eyes perform rapid movement to increase the visual
resolution as only a small part of the retina, the fovea, is capable of high accuracy
perception. Those rapid eye-movements are called saccades, have a typical duration of
10ms to 100ms and reach speeds up to 600deg/sec [Duc07].
When holding our gaze on a specific location within the virtual scene, we perform so
called fixations. Those fixations are what a lot of the traditional eye-tracking applications
are based upon. Fixations can also be used to discriminate certain tasks [Can09], such as
reading, talking and counting.
As the eyes are firmly attached to the head, they need to compensate the heads movement;
otherwise we would be unable to produce a steady image. Compensating those head perturbations is especially important during locomotion [Gro88] as otherwise we would have
to hold still every now and then in order to get a non-blurred image of our surroundings.
The vestibulo-ocular reflexes provide such an image stabilization mechanism based on
perceived head acceleration. Combined with smooth persuit tracking and the opto-kinetic
reflex, we are able to produce a steady point of gaze on an object, independent of our
heads movement.
The eye-movement necessary to follow a moving object is called a smooth pursuit. Smooth
pursuits are voluntary in a sense, that we can decide to shift our gaze away from the
moving object and thus end the pursuit (as opposed to say the optokinetic reflex which is
involuntary). We do however, require a moving signal to perform a smooth pursuit and
can not produce it without a moving object. Such a moving object can also be our own
finger in complete darkness [Gau76].
Tracking stationary objects when ones reference frame is moving (e.g. following street
posts from within a moving car), is performed using the optokinetic reflex. Although very
similar to smooth pursuits this type of eye-movement is involuntary.
2.3 Eye-tracking
When conduction studies or otherwise researching eye-movement one needs a device to
measure the movement of the eyes. Some devices can measure the point of gaze on the
2 Related work and background
8
plane, as well as the pupil dilation in centimeters. Others can even measure the depth
of vision (read, the point of gaze in three dimensional space). The maximum sample
frequency is also an important property of an eye-tracking device.
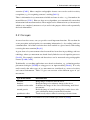
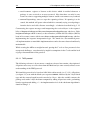
The most common kind of eye-trackers are video-based ones. They record the perceived
scene – the so called scene video – and have a camera, paired with an infrared light-source
pointing, at the eye. Based on the reflections of the infrared light-source, one can compute
the rotation of the eye using video processing gear. Prominent examples of video-based
eye-trackers are build by SensoMotoric Instruments GmbH1 and the Ergoneers GmbH2
Dikablis (figure 2.1).
Video-based eye-trackers have a maximum sampling frequency of roughly 30Hz, whereas
sampling the eye-movement frequency content of 0 − 30Hz requires at least 60Hz (considering the Nyquist-Shannon sampling theorem [Sha49]). Additionally, due to the computational intensity of video processing, the runtime of such eye-trackers when running
on battery is limited to a few hours. Both considerations make render them unsuited for
long-term studies outside of a controlled laboratory environment.
Figure 2.1: SMI Eye Tracking Glasses (courtesy SensoMotoric Instruments GmbH, Dikablis
(courtesy Ergoneers GmbH)
1
2
http://www.smivision.com/
http://www.ergoneers.com/
2.3 Eye-tracking
9
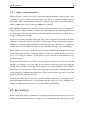
2.3.1 Electrooculography
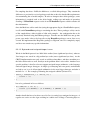
A more lightweight eye-tracking approach, by measuring the resting potential of the
eye, is Electrooculography (EOG). The eye can be considered a dipole, with its positive
pole being at the cornea and the negative pole placed by the retina (figure 2.2). Change
in potential of that electric field corresponds to eye-movement and can be measured
by placing electrodes on the opposite sides of the eye and a reference electrode on the
forehead. EOG signal typically ranges from 5µV/deg to 20µV/deg and has an essential
frequency content between 0Hz to 30Hz [Mar11].
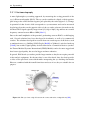
Due to the small amplitude of the potential, performing accurate EOG is a challenging
task. Several solutions have been developed in Academia, as well as by commercial
vendors. The solutions developed in research focus on certain aspects of the device, such
as unobtrusiveness e.g. Bulling’s EOG Gogles [Bul09] or Vehkaoja’s wireless head cap
[Veh05], but sacrifice signal quality for their form factor. Commercial devices (such as
the Twente Medical Systems International (TMSi) Mobi8) tend to be more rugged and
have better signal quality, but are also bigger and more obtrusive.
In general, EOG based eye-trackers provide longer runtime as they do not require powerful
video-analysis equipment. Just because they’re not video-based, they also don’t provide
a video of the perceived scene which makes interpreting the eye-tracking data harder.
However, combined with their small form factor and ease of use, they are suitable for our
purpose.
Cornea
Retina
Figure 2.2: The eye forms a dipole between the cornea and retina. Adapted from [NEI].
10
2 Related work and background
Figure 2.3: Wearable EOG gogles [Bul09]
CHAPTER 3
Development of the experimental system
3.1 Requirements
We had to design a study that records eye-movement data alongside with reference data
(ground truth). Once the study is laid out, a technical system has to developed according to
the requirements dictated by the study design. The study design described in this chapter,
as well as the technical implementation fulfill the following requirements:
• capable of continuously recording eye-movement data with a sampling rate of at
least 60Hz for at least 12 hours,
• provides the means for recording proper ground truth in terms of high-level activity
labeling and scene video,
• the system respects the participants privacy and provides means for participants
self-determination,
• is unobtrusive enough and easy enough to use so that participants are willing to
wear it over the anticipated 12 hour recording time,
• after training the participants they set up by the the recording system themselves.
11
3 Development of the experimental system
12
3.2 Ground truth
In order to validate a remote sensor based system, one needs to record sensor independent
data of ”what’s really going on”. This data is referred to as ground truth1 , a term which is
very common in the ubiquitous computing community. It has widespread use and is even
transformed into other forms, e.g. recording ground truth is called ground-truthing.
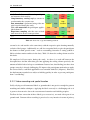
While preparing a study, designing proper ground truth collection is a very important task.
Poorly designed ground truth does not provide enough information to interpret sensor
data or might lack certain details required for an intended analysis. When deciding what
kind of ground truth should be recorded by which means, one has a wide range of options
to chose from. All methods represent a trade-off between precision, monetary costs and
effort for the participant, see table 3.1 for an overview.
One important aspect of recording ground truth is proper time synchronization with the
remote sensor data. It is a major design goal for any recording system to ensure that
synchronization which can be achieved by either synchronizing the ground truth and
sensor recorders before collecting data, or by correcting the different time-bases in post
processing. We choose to do the latter, due to technical issues with the SenseCam (see
section 3.3.2).
3.2.1 Labeling
A very important kind to ground truth are labels. Labels are simple tags/markers describing
what’s going on, either denoting continuous tasks or points in time. Typically labels are
grouped by the task they describe and can be mutually exclusive within their group.
Designing a set of labels (also called a coding scheme) is part of the ground truth design
process. The coding scheme implicitly defines the expectations of the study as it limits
what information the ground truth can contain. Thus, deciding upon labels is a delicate
and important task.
We identified the high-level activities we wanted to recognize in the eye-data and made
them part of our coding scheme. Most of those activities are pair-wise exclusive (one
1
The term originates from cartography and aerial photography where it refers to data that is collected on
the ground vs. the data collected remotely
3.2 Ground truth
13
Detail
Accuracy Costs
A dedicated observer follows the participant
very
and annotates their activity
high
Complementary sensing employs sensors to
high
overdetermine the systems state
Post annotation is performed using video ma- medium
terial recorded during the study
With self annotation the participant applies
low
labels themself
very
Experience sampling asks the user at fixed
time-interval to answer some questions
low
Legend
very good
high
very
low
low
high
very
high
low high
medium
low
low
high
very
low
very
low
high
high
good
Effort
medium
bad
low
very bad
Table 3.1: Overview of ground-truthing methods
can not be in- and outside at the same time) with the respective pairs forming mutually
exclusive label groups. Additionally, we add free-text point labels to give the participant
the chance to mark special events – such as reattaching electrodes or eating (which is
likely to induce motion artifacts in the data). Table 3.2 shows the coding scheme used for
this work.
We employed self-annotation during the study. As there is a trade-off between the
descriptiveness and the effort that goes into applying the coding scheme precisely, the
amount of labels had to be kept to a minimum. It turned out, that labeling just those four
groups correctly is already challenging. To improve the participants motivation to apply
the correct labels, each label application was rewarded with £0.1 (10 pence). However,
the final amount rewarded was subject to labeling quality, in order to prevent participants
from ”overlabeling”.
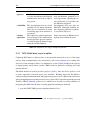
3.2.2 Video recording and spatial location
Solely relying on self-annotated labels as ground truth is not precise enough for pattern
matching and similar techniques. Applying the labels correctly is a challenging task as it
is prone to inaccuracies due to the vast amount of attention such labeling requires.
To allow for later correction of those labels (post annotation), we made video part of our
ground truth. Constant video recording is perceived as very intrusive in terms of privacy,
3 Development of the experimental system
14
vs.
(visually) interacting – the participant
is currently interacting with a person
face to face (incl. video chat). E.g.
talking to someone, checking out at a
cashier or buying a bus ticket.
not interacting – at the moment the
participant is not engaged in any form
of visual interaction with another individual. One can still be chatting with
someone or writing an email.
concentrated – concentrated work is
everything the participant actively produces or consumes, such as working
at his job, reading a book, playing a
(video-)game or driving a car.
leisure – is when the participant passively consume information/entertainment or is within a non-goal driven environment such as watching TV or a
night out.
inside – a building (at least 4 walls and
a rooftop). E.g. a public building, ones
home or a public restroom. Open bus
stops do not qualify as inside.
outside – is not inside a building. Outside is everything where the participant
could potentially be hit by wind and
rain (also bus stops with a rooftop).
physically active – is every form of
prolonged movement. That includes
walking to the restroom, but also heading to the bus and exercise.
not active – the participant sitting in a
chair, sofa or are lying in a bed. Also
when he is standing around waiting.
special event – use this label to annotate any special kind of event such as
electrodes coming off, changing the batteries of the Mobi or getting excited about
something. Whenever there is something you have the feeling that it should be
labeled, but it doesn’t fit in the categories above, use this label.
Table 3.2: The coding scheme used for this work
despite the CCTV saturation in public space [Hem04]. Such reservations can be overcome
by giving the participants full control over when video is recorded and allowing them to
censor the video afterwards.
Some locations have well known link to a specific activity, i.e. the participants movement
can be used to infer context. For example, travel can be clearly identified by considering
the movement speed (no human being is able to walk 50km/h). We record the participants
location using GPS and use it to support post annotation by context inference.
3.3 Technical realization
15
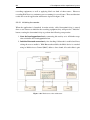
3.3 Technical realization
The technical system used during the study had to integrate and synchronize several
datasources (see figure 3.1) – some of them are part of the ground truth, some are the EOG
data:
1. EOG data is captured using a commercial system called TMSi Mobi8, which
integrates instrument amplifiers with 24bit Analog/Digital Converters (ADCs) and
uses an undocumented, proprietary protocol to communicate via Bluetooth.
2. Labels are applied to by the user (thus performing the self-observation), in order to
annotate events and activities, using a mobile application running on a smartphone.
3. GPS is recorded using the GPS receiver built-in the smartphone.
4. Video is captured as still images using the Microsoft SenseCam [Woo04], as continuous video recording would not only produce too much data, but also be too
invasive to the participants privacy.
Using a smartphone as integration platform is a natural choice, as they have a lot of
computational power to spare, are highly mobile and are readily available. There are two
main smartphone platforms to chose from: Android and the Apple iPhone, where we
decided to base this system on Android mostly due to its openness – see table 3.3 for an
overview of the criteria involved in the decision.
Figure 3.1: Several data streams have to be synchronized
3 Development of the experimental system
16
openness
Android
iPhone
Android is an open source project,
is clearly documented and supports
modifications down the to operating system.
The iPhone is closed using software mechanisms guarded by license agreements. Opening the system (jailbreaking) is possible, but
not officially supported.
Development tools run only on
MacOSX. Although available for
free, deploying software to a phone
is associated with a fee.
availability The development tools are freely
available for all major platforms.
There are no restrictions in terms
of running apps in an emulator or
in a phone.
existing
The author has gained experience Some experience in iPhone develexperience in developing for the Android plat- opment exists within the team.
form in previous projects and successfully deployed Android Apps
using the Android Market.
Table 3.3: Criteria for choosing a smartphone platform
3.3.1 TMSi Mobi8 body signal amplifier
Capturing EOG data is a delicate task, as the potentials measured are in a µ-Volt range
and are often accompanied by noise and artifacts, still several solutions for recording such
data exist. Some attempt to built a very unobtrusive system [Veh05, Bul09] at the expense
of signal quality, where others (such as TMSi) focus on quality by reducing noise and
motion artifacts1 .
The Mobi had been used in previous projects [Vid11], thus the device itself as well
as some experience with that device was available. Reading data from the Mobi is
achieved using an undocumented and proprietary protocol over a Bluetooth connection.
An open implementation of that protocol exists as part of the Context Recognition Network
Toolbox (CRNT) [Ban08] (written in C), which leaves us with several possibilities of
integrating the Mobi into the data recording platform (running on Android):
1. port the CRNT TMSi protocol implementation to Java,
1
Motion artifacts are signal errors introduced by moving the electrodes – e.g. when smiling.
3.3 Technical realization
17
2. integrate the protocol implementation into the recording application using the
Android Native Development Toolkit (NDK),
3. use the complete CRNT as part of the application, again using the Android NDK.
Approach two and three suffer from the fact, that there is no proper Bluetooth support
for the Android NDK, thus we would still use the Java-based Bluetooth stack and pass
the received data to the native part. Apart from being inelegant, this solution would most
likely result in performance issues as each native call is associated with a performance
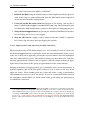
penalty. So, we choose to port the TMSi protocol implementation to Java and create a
clean API for it in the process. An overview of the Java TMSi protocol stack architecture
is shown in figure 3.2.
The Java protocol stack implementation is centered around the TMSiDevice class, which
uses java.io.InputStream and java.io.Outputstreams to communicate with the
device. All Bluetooth related code is kept out of the core protocol implementation, to
ensure portability. There are three main methods which constitute the interface of a
TMSiDevice:
• initialize: initializes the Mobi device by following a certain initialization procedure. This method gathers information about the device necessary for interpreting
the received data.
Figure 3.2: TMSi protocol stack architecture
3 Development of the experimental system
18
• setListener: registers a listener at this device which is notified whenever a
package is sent, received or an error occurred. Note that there can only be one
listener at a time as supporting multiple listeners would create unnecessary overhead.
• controlCapturing: starts or stops the capturing of data. If capturing is to be
started, this method will spawn a thread which is constantly trying to read packages
from the device and calls a listener accordingly – a behavior described in fig. 3.12.
Constructing the request messages and interpreting the received bytes is the responsibility of RequestPackage and AbstractResponsePackageFactory subclasses. Each
ResponsePackage which is merely a data container (a Plain Old Java Object (POJO)
bean in Java terms) comes with its own AbstractResponsePackageFactory subclass
implementing the response interpretation logic. We aimed for a decentralized protocol implementation as monolithic implementations tend to become cluttered and barely
maintainable.
While creating the API was straight forward, porting the C code to Java presented a few
unexpected challenges, caused mostly by implicit assumptions in the C code and the lack
of proper documentation of the protocol.
3.3.1.1 TMSi procotol
The following reference is by no means a complete reference but contains a description of
all packets necessary to receive data from the Mobi and (to some extend) reflects to our
understanding of the TMSi protocol.
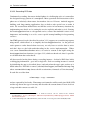
We found this protocol to be based on 16bit little-endian words (see 3.3.1.2). All packets
(see figure 3.3) start with the block sync sequence 0xAAAA, followed by the 1 byte block
type and the content length in words encoded as 1 byte. After the variable content, the
package ends with a 2-byte checksum computed by adding all previous words, performing
bitwise negation and adding + 1. An implementation in C of the checksum algorithm is
found in listing 3.1.
3.3 Technical realization
0
19
8
0xAA
16
0xAA
32
24
block type
length
content (2·length bytes)
checksum
Figure 3.3: The structure of a package in the TMSi protocol. Each package starts with
0xAAAA, its block type and content length in words. After the package content,
the package is completed by a a checksum.
Listing 3.1: TMSi protocol checksum computation
1
2
3
4
5
uint16_t checksum ( uint16_t * words , uint8_t length ) {
uint16_t checksum = 0, word = words + length - 1;
while (word >= words ) checksum += *word;
return ~ checksum + 1;
}
We subsequently list the packages involved in the device initialization and data recording
procedures.
Initializing the Mobi starts with an FrontEndInfo package containing the amount of
channels to be enabled and two flags denoting whether data is to be sent using bluetooth
and if data should be recorded on the internal SD card. The amount of channels seems to be
irrelevant and other implementations use a constant value of 14; so do we. A FrontEndInfo
package is answered with an Acknowledge package. Such a package consists of an error
code (which can also indicate ”no error”), a list of error messages and the time of the
Acknowledge (ACK).
Sending an empty FrontEndInfo request results in a FrontEndInfo response yielding
information such as the serial number, the maximum sample rate, hardware and software version, buffer sizes and battery power level. It is worth noting that some of that
information is redundant with the IDData package.
The IDData package contains information about the device at hand. It lists details about
the device, such as its serial number, name and a description of all channels. Retrieving the
full description usually requires sending several IDDataRequest packets, each containing
an offset and the restlength of data to be read.
20
3 Development of the experimental system
For sampling data above 128Hz, the Mobi uses so called delta packages. They contain the
difference to previously received packages and thus reduce the bandwidth requirements
for transmitting the recorded samples. In order to interpret those delta packages, some
information is required such as the delta length, coding type and mode of operation.
Sending a VLDataInfo request results in an VLDataInfo response which contains all
that information.
Once the Mobi was told to send data (using the appropriate flag in a FrontEndInfo request),
it will send ChannelData packages containing the data. Those packages solely consist
of the sampled data, either in 8bit or 24bit wide samples – the configuration has to be
previously obtained using the IDData packages. To make sure the Mobi does not go into
power save mode, it has to be kept alive using KeepAlive packages sent at least every
second. We implemented the KeepAlive package as singleton, since it is completely empty
and does not contain any specific information.
3.3.1.2 Byte order and unsigned integers issues
Words in the Mobi protocol are 16bit little-endian (least significant byte first), whereas
Java integers are stored in a big-endian byte order (most significant byte first). As the
CRNT implementation was only tested on x86-based machines, and those machines use
the little-endian order as well, that byte-order problem didn’t arise earlier. Another Javaspecific problem, is that Java does not support unsigned integer arithmetic, as the language
omits unsigned integer datatypes. A simple (yet annoying and error-prone) workaround
we had to use is to do all unsigned arithmetics in the next bigger datatype and take it
modulo 216 + 1. For example performing the unsigned addition (written in C)
1
2
3
uint16_t uadd( uint16_t a, uint16_t b) {
return a + b;
}
has to be performed in Java as follows:
1
2
3
int uadd(int a, int b) {
return ((a & 0 xFFFF ) + (b & 0 xFFFF )) % (0 xFFFF + 1);
}
Another detail that has to be taken care of in Java is casting bytes unsigned to integers. A
regular cast caries over the sign, resulting in a subtle cause of bugs. Converting bytes to
3.3 Technical realization
21
unsigned integers should be done by performing the cast and later masking it to remove
the sign:
1
2
3
int unsigned_byte_to_int (byte b) {
return (( int) b) & 0xFF;
}
3.3.1.3 Verification and debugging
During development we had to verify the Java implementation against the CRNT, not
only to ensure the correctness of our implementation, but also to debug the initialization
procedure of the Mobi. We performed those tasks by building a serial device recorder using
an open-source prototyping platform, based on the ATMEL ATmega328 microcontroller,
called the Arduino1 . A serial interface to the microcontroller is provided, which we used
to simulate a Mobi. We recorded all data written to the serial interface, storing it in the
internal EEPROM memory of the ATmega328, thus were able to compare the data sent
from the CRNT with the bytes sent from our implementation. That method led to the
insight of the wrong endianness and the Mobi using 16bit words.
3.3.1.4 Open issues
Despite best efforts to produce a bug-free TMSi protocol implementation, the code still
suffers some known issues as we ran out of time. None of those issues poses a serious
problem to the subsequent work, yet we list those issues for the sake of completeness.
We believe they’re linked and caused by the same issue. Our own implementation, as well
as the CRNT use blocking IO communicate with the Mobi. Thus communicating with
the device should not be time-critical as reads will block until there is something to be
read, and writes will block until the bytes can be written. However, trying to read ”too
early” from the device results in unusable readouts, thus we have to have an empirically
determined sleep of 10 milliseconds in the code. Not only is such a sleep inelegant, but also
does it limit our effective sample rate to less than 100Hz – as for recording eye-movements
a sample rate of 0-60Hz ([Mar11], considering Nyquist-Shannons sampling theorem) is
sufficient, that does not present a serious problem is still noteworthy.
1
More information about the Arduino can be found at http://www.arduino.cc
3 Development of the experimental system
22
The Mobi variant we have to our disposal connects the electrodes using bipolar connectors,
thus providing two channels per connector (as figure 3.4 illustrates) - i.e. the first connector
provides channel A& B and the second one serves C& D. With our implementation we have
been unable to read meaningful data from the second channel of each bipolar connector
(channels B and D), we have yet to find the reason for this behavior. Normally, one
would use the two electrode pairs provided by a single connector to record the vertical
and horizontal EOG channels. To workaround this second-channel issue, we use the first
channels of the two available bipolar connectors, effectively attaching the electrodes as
shown in figure 3.5.
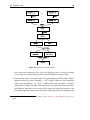
A third, yet unsolved problem is that the signal received on the ”working” channels seems
to be unscaled and thus does not fit in the 24bit wide integer packets used in the Mobi
Figure 3.4: Top side of the Mobi providing the female electrode ports
regular electrode attachment
our electrode attachment
Figure 3.5: Connecting the electrodes to the Mobi
3.3 Technical realization
23
protocol. That causes the signal to overflow (or wrap around) the value range resulting
in the block-like appearance shown in figure 3.7. As eye-movements may be rapid but
not instant1 , extreme changes in the signal indicate an over-/underflow. We empirically
determined the over-/underflow thresholds and identified ẋ < −223 as overflow and ẋ > 223
as underflow conditions (where ẋ denotes the derivate of the signal x in respect to time,
unit of measure is one divided by some unit of time). In order to reconstruct the signal,
we add 224 for every overflow and subtract the same value for underflows. Feeding an
over-/underflown signal to the fixOverflow algorithm listed below (figure 3.6), yields the
fixed signal plotted in 3.7.
The fixOverflow algorithm detects over-/underflows and corrects them by adding/subtracting multiples of 224 (denoted by the variable c), accordingly. Being an offline algorithm, it
expects a discrete signal x with its samples denoted by xt and a total length of T samples
as input. It detects under-/overflow in the tt+1 sample after correcting the xt one. A
corrected signal r (with rt being the tth sample) is computed as output.
1. (Initialze overflow count)
2. (Initialize return signal)
3. (For each sample)
4. (Correct sample)
5. (Compute derivative)
6. (Detect overflow)
7. (Detect underflow)
Set c ← 0
Set r ← 0
For t ← 0 to T − 1
Set rt ← xt + (c · 224 )
Set ẋt ← xt+1 − xt
If ẋt < −223 then c = c + 1
Else If ẋt > 223 then c = c − 1
Figure 3.6: The fixOverflow algorithm
Figure 3.7: Over-/underflow corrected EOG signal
1
As mentioned before, eye-movements can be exhaustively recorded with a sample rate of at least 60Hz.
3 Development of the experimental system
24
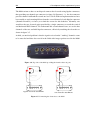
3.3.2 Microsoft SenseCam
The SenseCam is a digital camera paired with a set of different sensors, designed to
passively take pictures triggered by its sensors. Along with a passive infrared (body heat)
detector, the list of sensors includes a digital light sensor, accelerometer and a temperature
sensor. It’s main application is in research and therapy of people with memory-loss related
problems [Hod11]. In 2009 the SenseCam became available as a commercial product
called the Vicon Revue, which is the model we used (see figure 3.8).
Besides taking pictures using its 640 × 480 pixels camera module, the SenseCam also
records accelerometer, gyroscope, temperature and Passive Infrared Sensor (PIR) sensor
data in an ASCII file alongside the JPEG compressed images, stored on a cam internal
storage. Once the camera is connected to a computer, recorded sensor data as well as
the images are made available as USB drive. Microsoft Research and Vicon both supply
software to review the photostream and sensor data. We found both products unsuitable
for our purpose, as we needed a synchronized view of the images and the EOG data.
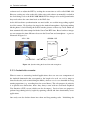
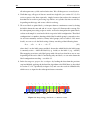
3.3.2.1 Time synchronization
Every entry in the sensor log, as well as every image is labeled with its recording time
gathered from a built-in Real-Time Clock (RTC). It is the responsibility of supplied
Figure 3.8: Vicon REVUE, a commercial version of the Microsoft SenseCam
3.3 Technical realization
25
software tools to adjust the RTC by writing the current time to a file called TIME.CSV.
However, writing any value to that file (either using said software or manually) resulted in
the clock being reset to the 01.01.2000, 00:00. For the images to be useful ground truth,
they need to have the same time-basis as the EOG data.
As the file-based time synchronization was not feasible, we used the image taking capability of the camera. We developed an App for the Android smartphone, displaying nothing
but the phone’s clock. Having the SenseCam take pictures of that very clock, which are
then automatically timestamped with the SenseCam RTC time. Based on those images
we can compute the time difference between the SenseCam and smartphone – a process
illustrated in figure 3.9.
4711.JPG
SENSOR.CSV
4711.JPG
@ 13:45:10, 01/01/2010
∆t
|1322123593 − 946734310| = 375389283
Figure 3.9: Synchronizing the SenseCam and smartphone
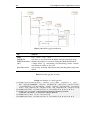
3.3.3 Android data recorder
When it comes to structuring Android applications, there are two core components of
the Android framework that correspond to the length of a task: an activity maps to
short-lived tasks (such as initializing the Mobi), whereas services are intended for longrunning operations (e.g. recording data for several hours). The sole purpose of activities
is to provide user-interaction, hence they always come with an associated Graphical
User Interface (GUI) screen (which can also be empty). Services have two purposes:
perform long running tasks by explicitly spawning a thread and share functionality across
applications.
Our study can also broken down into short and long-running tasks. Initializing the
3 Development of the experimental system
26
recording equipment, as well as applying labels are both of short nature. However,
recording EOG data is a continuous process running for several hours. That consideration
results the recorder application architecture depicted in figure 3.10.
3.3.3.1 Initializing the recorder
When the application is launched, its main activity, called StartActivity is started.
Once a user chooses to initialize the recording equipment, they will press the ”Initialize”
button, causing the StartActivity to perform the following setup routine:
1. Start the DataLoggerService by connecting this activity to it. All further steps
aim to initialize the DataLggerService.
2. Initialize Bluetooth connection by first checking if bluetooth is enabled and if not,
asking the user to enable it. With Bluetooth available, the Mobi device is searched
using its Media Access Control (MAC) address. Once found, all search effort is quit
Figure 3.10: The data recorder architecture
3.3 Technical realization
27
and a serial connection to the Mobi is established1 .
3. Initialize the Mobi using the initialization procedure implemented by the protocol
stack. In this stage we gather information about the Mobi which is then required to
decode the measurements coming from it.
4. Create the log-file file on the sdcard and prepare it for writing, each log-file is
named /sdcard/datalogger/currentUnixStamp.log. The information gathered during the Mobi initialization is written to the log-file for debugging purposes.
5. Setup the DataLoggerService by passing the initialized TMSiDevice instance
to it and asking the service to start logging.
6. Start the GPS service, supply it with a unique track name (which is computed
based on the log-file name) and begin logging the position.
3.3.3.2 Applying labels and monitoring the Mobi connection
The StatusActivity (GUI shown in figure 3.11, left screenshot) is merely a front-end
for the DataLoggerService, exposing the status and some functionality of that service
to the user. Labels can be applied by pressing the respective button, where the highlighted
ones show which labels are active. The number in button text shows how often each label
has been applied already. Whenever the user applies a label the amount of money in upper
right corner is incremented, thus giving an approximation of the earned amount.
Showing an indicator of logging activity gives confidence in the systems functioning. A
regularly updated count of the data points collected so far is shown to the user in the
upper left corner. When doubting that the system still works, seeing of that number
still continuously increases can be reassuring. In case of a connection failure between
the smartphone and the Mobi, an alarm sound would go off asking the participant to
reestablish the connection.
1
Establishing a connection using the Serial Port Profile (SPP) on Android is not straight-forward. There
is an explicit Application Programmer Interface (API) to open such a socket (as described in the
Android API reference [Inc11]), but it does not work reliably across devices. The most reliable way
of creating an RFCOMM socket seems to be using Java reflection as explained in an Android bug
report: http://code.google.com/p/android/issues/detail?id=5427. The Input/Output (I/O)
streams of the serial connection are then passed on to the TMSi protocol stack (described in section
3.3.1).
28
3 Development of the experimental system
Figure 3.11: GUI of the StatusActivity
During the study unforeseeable events may arise, which we want to annotate if they
might affect the EOG recording: that’s what the special event button is for. Pressing it
produces a dialog in which any form of free text can be entered. We tried to anticipate
certain ”special events” and added them to the dialog using auto-completion assistance
(the right screenshot in figure 3.11). Such special activities are not considered for activity
classification, but are solely used for signal cleanup and artifact removal.
All labels and special events are passed on the DataLoggerService which then logs such
events to a file. The service serves as a single point of entry to the logging storage and is
the sole governor of the log file, and can thus ensure a proper format and time-logging, as
well as log-statement counting used for approximating the earned reward.
3.3 Technical realization
29
3.3.3.3 Recording EOG data
Continuously recording data on an Android phone is a challenging task, as it contradicts
the designated usage pattern of a smartphone. Most operations and interactions with a
phone are of relatively short nature; but nowhere close to 12 hours. Android supports
building such long-running applications, but we had to take special care to make it
work. We ensured that Android does not kill the service in low-memory situations by
implementing two details: we’re starting the service explicitly and make it sticky. Starting
the DataLoggerService as a foreground service, ensures that Android is aware of its
importance and marking it as sticky, causes special startup handling for long-running
services1 .
Our TMSi protocol stack (described in section 3.3.1) supports an event driven programming model, which allows us to simplify the DataLoggerService. As the protocol
stack spawns a reader thread when necessary, we only have to wait for data to arrive
and don’t have to deal with multi-threading in the service implementation. Whenever a new ChannelDataPacket arrives, we write its content to the logfile using the
DataLoggerServices functions (see figure 3.12) which are thread-safe, thus it’s possible
to call them from the reader thread.
All data recorded on the phone during a recording instance – let that be EOG data, labels
or debugging information – goes into a single file. Such a recording instance is started
by initializing the app (as described above) and ends when the app is quit, crashes or is
killed otherwise. Each file is named /sdcard/datalogger/currentUnixStamp.log
where currentUnixStamp denotes the file creation time, formated as Unix timestamp2 .
In each file are of the form
<timestamp> <tag> <content>
and are separated by line breaks. Timestamps are formated as milliseconds since 01/01/1970
and the tags denote the type of an entry, thus describe the content format. For an overview
of tags and their content see table 3.4.
1
2
More information about the lifecycle of Android services can be found in the Android
documentation: http://developer.android.com/reference/android/app/Service.html#
ProcessLifecycle
A Unix timestamp (also called Unix time) is the amount of seconds passed since the 01/01/1970
3 Development of the experimental system
30
Figure 3.12: EOG logging initialization
tag
content
TMSi
TMSiRAW
TMSiChannelDesc
label
eog x noise eogy noise
raw bytes as received from the Mobi as base64 encoded string
channel description as received during the Mobi initialization
a single label, e.g. interacting, not interacting, inside, outside,
concentrated, leisure or free text
start or stop, denoting when interaction with the phone began and
ended
phoneInteraction
Table 3.4: Datalogger file structure
Listing 3.2: Example of a datalogger file
1
2
3
4
5
1321950051430 TMSiChannelDesc Channel [unit=VOLT , exponent =-6, type=
BIP , subType =UNKNOWN , size =24 , chnumber =0, sign=true , process =true ,
portnumber =0, a =1.0113601 E9 , b=0.0 , name=A, refsample =0, overflow =
false , vld_samplefs =0, vld_deltas =0, vld_samplediv =0, vld_divcnt =0]
1321950051446 TMSi 7953920 622592 0 -8355840 0 0 0 0 0 0 0 0 0 0
1321950051446 TMSiRAW eV4ACYAAAAAAgIAAAAAAgIAAAAAAgIAAZH8A /
yYAU0sWNc1AHiWNoA / cC1AeknMQsDtUdwHpL80AAxzK
1321950051461 label 1e not interacting
1321950051468 TMSi 7915520 622592 0 -8355840 0 0 0 0 0 0 0 0 0 0
3.3 Technical realization
31
3.3.3.4 Recording the GPS track
Recording a precise track provides several challenges, none of which are to be solved
in this work. Such issues may be the GPS signal quality, the receiver drift (remaining
stationary results in a ”moving” signal) and power consumption.
Others have tackled those problems before us, so we integrated their implementation. The
OpenGPSTracker project1 produces a versatile GPS recording Android app, under an
open source license. That GPS logging app consists of a GPSLoggerService and several
activities controlling this service using the GPSLoggerServiceManager. We made the
GPSLoggerServiceManager part of our codebase (within its original namespace and
including the comment header clarifying its origin) and use it to connect and control the
GPSLoggerService without having to include the complete OpenGPSTracker in our
application. As the service itself remains part of the OpenGPSTracker application, it runs
in a different process than our recording app. Android provides its own mechanism for
implementing such Inter-Process Communication (IPC) capable services, called Android
Interface Definition Language (AIDL). The GPSLoggerServiceManager requires that
AIDL definition, so we copied the IGPSLoggerServiceRemote.aidl into our source
tree, causing the Android development tools to generate the interface appropriately.
Although the original GPSLoggerServiceManager had a way of providing a track name
at the beginning of a new recording, we found that doing so remained without effect. But
to be able to clearly identify the recorded track with out measurements, we had to properly name the GPS logging session. Calling the GPSLoggerService.startLogging()
method yields a numeric track ID which is valid within the OpenGPS tracker. That ID is
used to set the track name using the OpenGPS tracker content provider. However, that
integration path uses unofficial API and we expect it to break in future versions.
3.3.3.5 Battery runtime optimizations
One of our biggest concerns was the power consumption of the system which is the limiting
factor to the systems runtime. That concern had great influence on the development of
the Android recorder app. On some occasions we favored performance over ”beauty”, on
others did we disable features because of their power consumption.
1
http://code.google.com/p/open-gpstracker/
32
3 Development of the experimental system
The Android development guide [Inc11] advices developers to avoid unnecessary object
creation. The clean object-oriented way for implementing unsigned 16bit integer arithmetic would be using an immutable uint16 class. That class would provide all required
basic arithmetic functions, such as plus, subtract, multiply and divide. Although
the implementation of such a class would still use regular Java integers (thus produce no
overhead for the operations themselves), we’d end up creating a lot of object instances just
to have them garbage collected a second later. Receiving a single package of n bytes size,
requires 12 · n + 3 uint16 operations – e.g. receiving a 76 byte long ChannelData package
would create 41 new objects. With a sampling frequency of 75Hz, that would be at least
3075 new unnecessary objects per second.
We use the smartphone solely to receive data and store it, but do not make it accessible to
any other entity on the phone. Android has a special mechanism for storing structured
data using SQLite1 . Typically such an SQLite database is further encapsulated using so
called ContentProvider. Both mechanisms improve the separation of concerns and
code re-usability as they define clear interfaces and responsibilities, especially when
sharing data across multiple Android applications or services. We do not need to share
data or store it in a database, thus we circumvent the overhead induced by such measures
and write all data to a single file. Doing so makes further processing slightly harder as all
different kinds of data end up in the same file, but we cope with that during pre-processing
(see section 4.3).
Android has a method profiler built in which shows the amount of time spent in each
method. We used that profiler to bring down the CPU load caused by recorder app from a
total of 80% to 60%. The first thing we realized was that, with every arriving measurement,
we’d create a new integer array holding that data. That was according to our design, as we
followed the rule of making objects immutable if possible. By ridding the ChannelData
class of its immutability and reusing the integer array instead of creating a new one every
single time, we decreased the time spent for allocation and garbage collection. We thought
about using the sensors built into the smartphone for complementary sensing (see table 3.1
for more details). The profiling showed that each additional sensor makes up for roughly
5% of total CPU load due to the reading and logging overhead they produce. Disabling all
sensors yielded a total CPU load reduction by roughly 16%.
1
The Android SQLite API is explained in the Android Dev Guide [Inc11]: http://developer.
android.com/guide/topics/data/data-storage.html#db
CHAPTER 4
Data acquisition
With the experimental system being available, we have to prepare for the study. Besides
checking the equipment, we especially focused on training the participants. Once prepared
we set out to collect data using the system and with the help of the participants - a process
described in section 4.2. We have to preprocess the recorded data to condition it for
analysis. This preprocessing involves data cleanup, merging and format transformation,
more details can be found in section 4.3.
4.1 Preparation
We had to prepare each recording session by preparing the equipment and training the
participant where both tasks are equally important. Improperly prepared equipment leads
to bad data quality or even the loss of a complete recording session. Insufficient training
results in incomparable results, bad data quality or again, the potential loss of data. We
found it harder to provide sufficient training than properly preparing the equipment, i.e. we
lost a complete dataset due to improper participant training. To ensure proper preparation,
we designed a preparation checklist (found in appendix B) and verified its feasibility in a
test run.
33
4 Data acquisition
34
4.1.1 Preparing the equipment
The EOG data and labels are stored on the phone (described in section 3.3.3), while the
images and sensor data recorded by the SenseCam are stored on the cams internal memory
(see section 3.3.2). Before starting a new recording session, both devices need to be
cleaned from previous recordings.
Recording over 12h comes with power consumption challenges, which we tackled by
designing our system to last for that amount of time, once fully charged. Both, smartphone
and SenseCam can be charged using a standard Universal Serial Bus (USB) connection.
The Mobi runs on Nickel-Metal-Hybrid (NiMH) AA batteries which have to be charged
using a specialized device. We found the time for a full recharge of all devices to be eight
hours, thus charging the system over night was feasible.
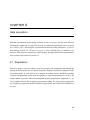
We enabled the participants to start recording as early in the day as they wanted to, by
packing the equipment in a ruggedized and compact case, which they would take home
(see figure 4.1). This package contained
• the smartphone, turned off and without any previous recordings,
• the SenseCam, turned off and without any previous images stored on it,
• at least four fully charged NiMH AA batteries for the Mobi,
• the TMSi Mobi without any batteries in it (so that they could not drain over time),
• both electrode connector cables and at least 10 electrodes; five for the initial setup
and five spare ones,
• and a participants manual providing instructions for attaching the electrodes and
explaining the labels in detail.
4.1.2 Training the participant
Before a participant started a recording session, we introduced them to the system and
their duties during participation. At no point did we mention the purpose of the recording,
however six of the seven participants were team-members and knew about our goal.
During the participant training we emphasized how vital precise labeling is for the data
quality and later analysis.
4.1 Preparation
35
Figure 4.1: Packed recording equipment
While explaining the system, we assumed that the participants knew how to use an Android
smartphone, but had no prior knowledge of the system as a whole. In the training session,
the participants were given detailed instructions how to install and setup, as well as
operate the recording system. Every component involved was shown and its usage was
demonstrated.
Proper electrode attachment is crucial to the study. Placing the electrodes in an unconventional configuration, e.g. too far away from the eyes might render the recorded data
useless. We put special emphasis on demonstrating the electrode attachment and Mobi
setup procedure. All participants were also given a diagram of the electrode configuration,
so that they could ensure proper attachment when setting up the recording equipment
themselves.
The smartphone is used for storing the data as well as collecting the ground-truth; its latter
function turning it into the component participants interact the most with. After briefly
36
4 Data acquisition
showing how to turn the smartphone on and off, as well as unlocking the screen, we went
on to demonstrate how to connect the TMSi Mobi to it. Once connected, the labeling
interface appears (figure 3.11). Participants were introduced to the labels and how to apply
them. Again we emphasized the importance of proper labeling.
Using a SenseCam is easy, but its privacy implications need to be dealt with. To operate it
one only has to press and hold the button on top of it until the LEDs light up and wear it
like a necklace. Its green LED indicates its powered on, the orange one lights up whenever
a picture is taken. Participants were given full control over when they wanted to wear the
camera and when they did not want to. There are special occasions requiring privacy (e.g.
the restrooms) and in such participants were encouraged to turn around the camera, so that
it would only record black frames. We also informed the participants that after the study,
they would be given the set of images to censor any images they deemed necessary.
4.1.3 Consent form and survey
Participants engaged on a voluntary basis only. Before they would start their training
and recording, every user signed a consent form (see appendix C). By doing so, they
acknowledged their voluntariness and that there were no foreseeable risks involved by
participating.
After their participation we asked the participants to fill out a short survey. Completing
it was voluntary and no question was mandatory, however we had a 100% return rate,
with all questions (except for those marked optional) answered. In the survey we asked
for basic data such as gender, age and if they required visual aids. One question was
whether the participant smoked or not; the motivation being less the potential influence
of the Nicotine, but more the motion artifacts introduced by the suction movement when
smoking.
4.2 Data collection
We collected 86.7 hours of data during one month, with 7 participants aged between 23 to
30 (mean: 26.29, std.: 3.55). All participants were non-smokers and right handed. Four
of the participants wore prescription glasses during the data collection. All participants
4.2 Data collection
37
recorded their dataset the day after their training and set up the recording equipment
themselves.
The participants were told to go for their regular every-day life. In personal discussions we
identified a common structure of all participants days (table 4.1). The mean recording start
time was 09:42 (std.: 50min.) and as most participants (except for one) were members of
our team, they share a similar day. None of them engaged in physically demanding tasks
despite their commute, which in one case was done by bike. All participants recorded
their data in the area of Lancaster, one commuted to Manchester.
Once a recording session was done, we extracted the data from the SenseCam and
smartphone. All EOG data and labels were fed into the preprocessing pipeline (section
4.3), the SenseCam images were directly given to the participants on a USB thumb
drive for blackening. We made sure that no one would see the pictures before them by
handling them only on the command line. Once they returned the (possibly censored) set
of images, we’d store the images along with the collected data and delete the originals on
the SenseCam.
4.2.1 System performance and problems encountered
The recording system performed as expected. Three recording sessions - including the
longest one with 14 hours - were recorded without a single system restart. We did recharge
the smartphone battery during the recording sessions to extend the runtime beyond the 12
hours we had originally designed the system for.
08:00
10:00
10:30
wake up and perform morning tasks such as taking a shower
set up the recording equipment and begin collecting data
arrive at the workplace, engage in interaction and concentrated work
13:00
18:00
21:00
22:00
have lunch
leave the office and commute home
engage in social activities such as meeting friends
end of the recording session
Table 4.1: The structure of a typical day shared by all participants (although the times might
vary).
4 Data acquisition
38
After each recording session we performed a manual inspection of the data to ensure proper
quality. During one of those inspections we realized that, in one dataset the measurements
for vertical eye-movements were missing. That missing data essentially rendered one
dataset of 13 hours useless. In retrospect we came to the conclusion that the second
EOG electrode cable (channel C) was not properly attached, hence that channel was not
correctly recorded.
We also encountered minor problems which did not destroy datasets, but still were
unexpected. For example, users would forget to take the smartphone with them (up to
ten times during a single recording session). Forgetting the smartphone resulted in an
annoying alarm tone as the connection to the TMSi Mobi is dropped once the bluetooth
range is exceeded. Restarting the system brings everything back to order and has no direct
effect on the data quality.
Performing the required self-annotation is a hard task, participants had to change the
label configuration every 8 minutes (mean, std.: 15min.). To ease their task, they would
constantly keep the display awake causing the battery to drain much faster than anticipated.
We solved this problem by bringing the participants attention to the issue and providing
enough chances to recharge the smartphone.
4.3 Preprocessing
All data recorded on the smartphone is stored in the same location – channel information, EOG data, labels, other sensor data is all written to the same file. While such an
implementation allows for performance and battery efficiency, it is unsuited for analysis in
Matlab.
1. The data needs to have several operations applied to it before we use it for analysis
(see figure 4.2). We found that the channel information (which is also stored in
the log files for debugging purposes) may contain encoding errors which cause the
subsequent operations to fail. Thus, our first step is to perform a cleanup the file by
opening it in a text-editor and correcting those few errors manually.
2. Those multiple files exist mainly because of the technical implementation of the
recording application, but serve no practical purpose; even worse, they make further
4.3 Preprocessing
39
Figure 4.2: The preprocessing pipeline
processing more complicated. We combine all datalogger files of a single recording
session into one file and make sure that we maintain the datas timely order.
3. Each datalog entry is associated with a Unix timestamp (in milliseconds). Those
numbers tend be very large (roughly x ≥ 1013 ) which is likely to cause problems
when processing the data – e.g. gnuplot1 cannot handle such large indexes. Comparing the datasets with each other is also hindered by the different offsets in the data,
depending on when they were recorded. We’re interested in the time relative to the
recordings beginning and not in absolute terms. Subtracting the first timestamp from
1
Gnuplot is a versatile and widely used plotting program. See http://www.gnuplot.org for more
details.
4 Data acquisition
40
all subsequent ones, yields such relative time. We call that process normalization.
4. Until that stage, all types of data are stored in a single file (see section 3.3.3.3). It’s
easier to process the data separately, simply because that reduces the amount of
data that has be read in a processing step. Hence, we split the data into several files,
depending on their tags and create a file for each tag.
5. We store labels as point labels, yet interpret them as continuous events by letting
the labels denote the start and end of a event – figure 4.3 illustrates this concept. For
the subsequent processing scripts to work, we need to interpolate the point labels,
so that each sample is associated with its respective label configuration. That label
configuration is a number denoting which label in which group is currently active.
As we have mutually exclusive, binary label groups (refer to table 3.2 for more
detail), we can encode the labels using a binary encoding of the following form:
L0 × . . . × Ln → k0 + . . . + kn · 2n ,
(4.1)
where the Li are the label groups and the ki denote the which label in the label group
is currently active – either the label 0 (e.g. inside) or the label 1 (e.g. outside).
That mapping associates each label group with a bit and sets that bit to one or zero
depending on the active label. Considering only our labels, we can write down the
label configuration encoding – see table 4.2.
6. In the last stage we prepare the workspace by loading the data from the previous
step into Matlab, applying the fixOverflow algorithm to the EOG data (as described
in section 3.3.1.4, specifically in figure 3.6) and save the result in a Matlab file,
which serves as input for the subsequent feature extraction.
s1
inside
s2
s3
s4
concentrated
s5 s6
outside
s7
s8
s9 s10
s11 s12
leisure
inside
Figure 4.3: Interpolating point labels to continuous events
t
4.3 Preprocessing
code
value
0
1
0x00
0x01
0x02
0x03
0x04
0x05
0x06
0x07
0x08
0x09
0x0A
0x0B
0x0C
0x0D
0x0E
0x0F
41
labels
not active
active
not interacting
interacting
outside
inside
leisure
concentrated
not active
not active
not active
not active
not active
not active
not active
not active
active
active
active
active
active
active
active
active
not interacting
not interacting
not interacting
not interacting
interacting
interacting
interacting
interacting
not interacting
not interacting
not interacting
not interacting
interacting
interacting
interacting
interacting
inside
inside
outside
outside
inside
inside
outside
outside
inside
inside
outside
outside
inside
inside
outside
outside
leisure
concentrated
leisure
concentrated
leisure
concentrated
leisure
concentrated
leisure
concentrated
leisure
concentrated
leisure
concentrated
leisure
concentrated
Table 4.2: The encoded label configurations
42
4 Data acquisition
CHAPTER 5
System verification and data analysis
We analyzed the data to verify the its validity, thus verifying the experimental system
developed in this thesis is sound. For analysis we partially relied on existing methodology
and algorithms, notably developed by Bulling et al. An overview of first results that we
found, is given to demonstrate the viability and soundness of the experimental system and
recorded data.
5.1 Methodology
The dataset recorded during this study is a novelty. As no such dataset existed before,
there is no experience or even proven methodology on how to analyze an eye-movement
dataset of such length. We find, however, the methodology and algorithms developed in
previous eye-movement based activity recognition work (namely Bulling’s work [Bul11]),
could be applicable for our purpose.
When designing the study, we identified four high-level activities. All of those activities
are typically typically sustained over a period of at least several minutes, e.g. it is unlikely
that someone is concentrated only for 30 seconds. Hence it is legit to segment the data
into windows of several minutes length. As there is no proven methodology we arbitrarily
choose a set of three different window lengths: 15 minutes, 10 minutes and 5 minutes.
Subsequent algorithms rely on equal window length in terms of samples. Although there
is variance in the sampling frequency (mean: 76.6Hz, std.: 10Hz), we consider it fixed
to 75Hz and create windows containing minutes · 602 · 75 samples length. The error
43
44
5 System verification and data analysis
introduced by the fixed sampling frequency assumption is negligible as we are interested
in high-level activities, and thus a few samples too much or too less in a window do not
matter.
Bullings work in eye-tracking based activity recognition has shown that there are eyemovement characteristics which can be used to discriminate certain activities. Also,
neurological mechanisms discovered in behavioral and biological research, motivate
certain eye-movement features. E.g. the duration of spontaneous blinks is influenced by
cognitive effort [Caf03], or the fixation duration has been found linked to certain activities
such as talking, reading and counting [Can09]. So we extract a set of features from the
segmented EOG data – figure 5.1 illustrates the process, table 5.1 gives an overview of the
feature set.
In addition to the feature extraction, every window is assigned an encoded label by
performing a majority vote on all labels within the window. The majority vote simply
selects the most often occurring label out all labels within the window, more formally it
selects the label k ∈ LW out of all labels LW in the window W, so that ∀k0 : countW (k) ≥
countW (k0 ), where countW (x) counts all occurrences of the label x in LW .
Figure 5.1: The data is segmented into windows of 15,10 and 5 minutes. For each window a
set of features is computed. Those features include mean blink length and rate,
mean fixation length and rate and saccade amplitudes. In addition to the features,
each window is assigned a label using majority vote.
5.2 Feature extraction
Group
Features
blink
mean and variance of the
45
• blink duration (in samples) and
• blink rate (in events per second).
saccade
mean and variance of the
• EOG signal amplitudes
• saccade rates (in events per second)
fixation
for all small, large, positive, negative, horizontal and vertical saccades
mean (and variance for the first item) of the
• fixation length (in seconds)
• fixation rate (in events per second)
• vertical and horizontal signal amplitudes during fixations
Table 5.1: An overview of the set of features extracted from each data segment, adapted
from Bulling et al.
5.2 Feature extraction
We extracted the exact same set of features Bulling et al. describe in their work [Bul09,
Bul11], as it is properly motivated and has been shown to have great discriminative power
for different activities. Those features were computed on the Cambridge Computer Laboratory Processor Bank1 ; a cluster of 25 dual-Opteron computers. The feature extraction
process was started at the beginning of December 2011, stopped over Christmas, resumed
beginning of January 2012 and as of January 2012, it has yet to finish for all window sizes
less than 15 minutes.
We detect saccades using the continuous wavelet-transform saccade detection (CWT-SD)
algorithm described in Bullings’ work. This algorithm computes the continuous 1D
wavelet coefficients using a Haar mother wavelet and applies a threshold th sd to these
coefficients. All wavelet coefficients Ci (s) (with s being an EOG signal component)
satisfying −th sd ≤ Ci (s) ≤ th sd mark a non-saccadic segment (i.e. fixations), whereas all
1
http://www.cl.cam.ac.uk/local/sys/processor_bank/
5 System verification and data analysis
46
others mark saccades. The threshold th sd is person specific and we determined it for each
recording by manually inspecting EOG data during reading periods.
All segments marked as non-saccadic are considered to contain a fixation. During a
fixation gaze remains stable, i.e. the points at which gaze is directed cluster over time
[Sal00]. Bullings dispersion based fixation detection algorithm exploits this behavior by
thresholding the gaze point dispersion. For a segment S composed of the vertical EOG
signal component S v , as well as the horizontal one S h , the dispersion is defined as
Disp(S ) = max(S h ) − min(S h ) + max(S v ) − min(S v ) .
All segments satisfying th f l ≤ Disp(S ) ≤ th f h are assumed to contain a fixation, where
the lower threshold th f l = 200ms and upper threshold th f h = 103 have been determined
during the CWT-SD evaluation.
Blinks are only seen in the vertical EOG signal component and are extracted using an algorithm similar to saccade detection algorithm (CWT-SD). The continuous wavelet-transform
blink detection algorithm (CWT-BD) focuses on the vertical EOG signal component only,
and uses a person independent threshold thbd that has been identified by the algorithms
author [Bul11].
5.3 First results
All subsequent analysis is performed using the features and majority voted labels, so in
the following whenever we speak about data, we refer to those feature/label pairs. This
higher-level view of the recorded data allows for better comparability with existing results
as they refer to features such as blink time and not to raw eye-movement data, too. It
remains an open question if there is interesting information to be found in the raw EOG
signal.
Analyzing this feature data can be done relative to time or relative to the labels. The
procedure is the same for both choices: segment the data by some criteria and apply
statistical methods to the classes, such as hypothesis testing or Exploratory Data Analysis
(EDA) [Nat10] methods. Time segmentation lends itself to exploratory methods as
one would expect to find trends over time. Label segmentation is especially suited for
5.3 First results
47
hypothesis testing, as one can answer questions like: ”do we blink more often during
periods of concentration?”.
To segment data by time, we choose an arbitrary number of segments |S | and assigned
k
j
2
·
f
all features f to their corresponding segment S i , i = 24·60
where ftd is the time of
td
|S |
the day in seconds the feature window falls into. We treat label segmentation as binary
segmentation problem: there are two classes L x , Ly where all features with the label x
fall into L x and all features labeled y fall into Ly . The label of a feature data point is
determined using majority vote during feature extraction (described in section 5.1).
5.3.1 Leisure vs. concentrated
The purpose of this particular analysis is to verify the soundness of the data and hence of
the experimental system. It is well established that the blink rate is influenced by cognitive
load and thus serves as an indicator for the level of concentration [Caf03, Sch08]: the
more we blink, the less concentrated we are. We shall consider our data and system sound,
if those results can be verified using our data.
We segmented the features extracted from all participants using the concentrated and
leisure labels and choose to evaluate the blink rate. So let S br,concentrated be all blink rate feature samples labeled as concentrated and S br,leisure be all blink rate feature samples labeled
as leisure, figure 5.2 shows a boxplot and normplots of those two classes. Consider the
null hypothesis H0 to be that the blink rate is independent of the level of concentration:
S br,concentrated = S br,leisure .
A two sample t-test rejects the null hypothesis at a significance level of 1% (p < 0.001),
thus the means of both classes are significantly different. As S br,concentrated < S br,leisure we
conclude that the blink rate is significantly higher during leisure, which is en par with the
findings of Caffier and Schleicher.
Using the same approach as for blink rate, we found that the saccade amplitude is lower
during concentration compared to leisure (p < 0.001, figure 5.3). Those results indicate
the eyes move slower during times of concentration, a behavior that could be exploited to
detect concentrated activities.
48
5 System verification and data analysis
Figure 5.2: The blink rate of all datasets partitioned by the concentrated and leisure labels.
Subfigure (a) shows the boxplot of both classes, subfigure (b) shows a histogram
to give an impression of the data. Subfigures (c) and (d) are normplots and
visualize how normally distributed both classes are (the more resemblance the
datapoints have with the line, the closer the data is to a normal distribution).
5.3 First results
49
Figure 5.3: The mean saccade amplitude of all datasets partitioned by the concentrated and
leisure labels. Subfigure (a) shows the boxplot of both classes, subfigure (b)
shows a histogram to give an impression of the data. Subfigures (c) and (d) are
normplots and visualize how normally distributed both classes are (the more
resemblance the datapoints have with the line, the closer the data is to a normal
distribution).
50
5 System verification and data analysis
CHAPTER 6
Conclusion
The experimental system developed in this work will be the platform for future mobile eyemovement based applications. In this thesis we showed that recording eye-movement in
daily live is feasible and that such a system can be implemented using available technology.
The system performed extremely well during the data collection in terms of stability as
well as battery runtime. We presented ideas for analyzing such massive datasets and
showed that the methodology is resilient against data recording flaws by confirming
existing results with the data recorded during this work.
Several open questions remain. Increasing the systems recording speed so that no data is
dropped during data collection remains an open problem. Also do we expect that further
analysis will show that the four high-level activities on which we focused on in this work
can be discriminated using the features we used for our system verification. Future work
should focus on showing such discriminative power using statistical methods.
51
52
6 Conclusion
Bibliography
[Ban08] B, D.; L, P. und A, O.: Rapid Prototyping of Activity Recognition Applications. Pervasive Computing, IEEE (2008), Bd. 7(2):S. 22 –31
(Zitiert auf Seiten )
[Bul09] B, Andreas; R, Daniel und T̈, Gerhard: Wearable EOG
goggles: eye-based interaction in everyday environments, in: Proceedings of the
27th international conference extended abstracts on Human factors in computing
systems, CHI EA ’09, ACM, New York, NY, USA, S. 3259–3264, URL http:
//doi.acm.org/10.1145/1520340.1520468 (Zitiert auf Seiten )
[Bul11] B, A.; W, J.A.; G, H. und T̈, G.: Eye Movement
Analysis for Activity Recognition Using Electrooculography. Pattern Analysis
and Machine Intelligence, IEEE Transactions on (2011), Bd. 33(4):S. 741 –753
(Zitiert auf Seiten )
[Caf03] C, Philipp P.; E, Udo und U, Peter: Experimental evaluation of eye-blink parameters as a drowsiness measure. European Journal of
Applied Physiology (2003), Bd. 89(3-4):S. 319–325 (Zitiert auf Seiten )
[Can09] C, Roxanne L.: Real-world vision: Selective perception and task. ACM
Trans. Appl. Percept. (2009), Bd. 6(2):S. 11:1–11:34, URL http://doi.acm.
org/10.1145/1498700.1498705 (Zitiert auf Seiten )
[Car00] C, Stuart K.; N, Allen und M, Thomas P.: The Psychology of
Human-Computer Interaction, L. Erlbaum Associates Inc., Hillsdale, NJ, USA
(2000) (Zitiert auf Seiten )
[Cou11] C, Francois; Ä, Esma; D, Aude; N, Mehdi
und M, Franck: Activity recognition using eye-gaze movements and traditional interactions. Interacting with Computers (2011), Bd. 23(3):S. 202
53
54
Bibliography
– 213, URL http://www.sciencedirect.com/science/article/pii/
S0953543811000166 (Zitiert auf Seiten )
[Duc02] D, A.: A breadth-first survey of eye-tracking applications. Behavior
research methods, instruments, & computers : a journal of the Psychonomic
Society, Inc (2002), Bd. 34, URL http://www.ncbi.nlm.nih.gov/pubmed/
12564550 (Zitiert auf Seiten )
[Duc07] D, Andrew T.: Eye tracking methodology - theory and practice (2.
ed.), Springer (2007) (Zitiert auf Seiten )
[Gau76] G, G. M. und H, J. M.: Eye tracking of self-moved targets in the
absence of vision. Exp Brain Res (1976), Bd. 26:S. 121–139 (Zitiert auf Seiten )
[Gro88] G, G. E.; L, R. J.; A, L. A.; L, D. J. und T, S. E.:
Frequency and velocity of rotational head perturbations during locomotion. Exp
Brain Res (1988), Bd. 70:S. 470–476 (Zitiert auf Seiten )
[Hem04] H, Leon und T̈, Eric: Final Report: CCTV in Europe (2004), URL
http://www.urbaneye.net/results/ue_wp15.pdf (Zitiert auf Seiten )
[Hod11] H, Steve; B, Emma und W, Ken: SenseCam: A wearable camera
that stimulates and rehabilitates autobiographical memory. Memory (2011),
Bd. 19(7):S. 685–696, URL http://www.tandfonline.com/doi/abs/10.
1080/09658211.2011.605591 (Zitiert auf Seiten )
[Hut89] H, T. E.; W, K. P.; M, W. N.; R, K. C. und F,
L. A.: Human-computer interaction using eye-gaze input. Systems, Man and
Cybernetics, IEEE Transactions on (1989), Bd. 19(6):S. 1527–1534, URL
http://dx.doi.org/10.1109/21.44068 (Zitiert auf Seiten )
[Inc11] I., Google: Android: The Developer’s Guide (2011), URL http://
developer.android.com/guide/index.html (Zitiert auf Seiten )
[Lei99] L, R. John und Z, David S.: The neurology of eye movements, Nr. 55 in
Contemporary neurology series, Oxford University Press, US, 3 Aufl. (1999)
(Zitiert auf Seiten )
[Liv00] L, Simon P. und F, John M.: Saccadic eye movements and cognition. Trends in Cognitive Sciences (2000), Bd. 4(1):S.
6 – 14, URL http://www.sciencedirect.com/science/article/pii/
S1364661399014187 (Zitiert auf Seiten )
Bibliography
55
[Mar11] M, Michael; B, Mitchell; MC, Daphne; W, Carol
und B, Michael: ISCEV standard for clinical electro-oculography (2010
update). Documenta Ophthalmologica (2011), Bd. 122:S. 1–7, URL http:
//dx.doi.org/10.1007/s10633-011-9259-0, 10.1007/s10633-011-92590 (Zitiert auf Seiten )
[Nat10] N, Mary: NIST/SEMATECH e-Handbook of Statistical Methods,
NIST/SEMATECH (2010), URL http://www.itl.nist.gov/div898/
handbook/ (Zitiert auf Seiten )
[NEI] N E I, National Institutes of Health: Eye diagram showing the macula and fovea (black and white). NEI Catalog number NEA09.,
URL http://www.nei.nih.gov/health/eyediagram/eyeimages3.asp
(Zitiert auf Seiten )
[Ray98] R, K.: Eye movements in reading and information processing: 20 years
of research. Psychological bulletin (1998), Bd. 124(3):S. 372–422, URL http:
//view.ncbi.nlm.nih.gov/pubmed/9849112 (Zitiert auf Seiten )
[Sal00] S, Dario D. und G, Joseph H.: Identifying fixations and saccades
in eye-tracking protocols, in: Proceedings of the 2000 symposium on Eye tracking research & applications, ETRA ’00, ACM, New York, NY, USA, S. 71–78,
URL http://doi.acm.org/10.1145/355017.355028 (Zitiert auf Seiten )
[Sch08] S, Robert; G, Niels; B, Susanne und G, Lars: Blinks
and saccades as indicators of fatigue in sleepiness warnings: looking tired? Ergonomics (2008), Bd. 51(7):S. 982 – 1010, URL http://www.informaworld.
com/10.1080/00140130701817062 (Zitiert auf Seiten )
[Sha49] S, C.E.: Communication in the Presence of Noise. Proceedings of the
IRE (1949), Bd. 37(1):S. 10 – 21 (Zitiert auf Seiten )
[Tur11] T, Jayson; B, Andreas und G, Hans: Combining gaze
with manual interaction to extend physical reach, in: Proceedings of the 1st
international workshop on pervasive eye tracking & mobile eye-based
interaction, PETMEI ’11, ACM, New York, NY, USA, S. 33–36, URL http:
//doi.acm.org/10.1145/2029956.2029966 (Zitiert auf Seiten )
[Veh05] V, A.T.; V, J.A.; P, M.M.; N, N.M.; L, J.O. und
H, J.A.: Wireless Head Cap for EOG and Facial EMG Measurements,
56
Bibliography
in: Engineering in Medicine and Biology Society, 2005. IEEE-EMBS 2005. 27th
Annual International Conference of the, S. 5865 –5868 (Zitiert auf Seiten )
[Vid11] V, Mélodie; T, Jayson; B, Andreas und G, Hans:
Wearable eye tracking for mental health monitoring. Computer Communications
(2011), URL http://www.sciencedirect.com/science/article/pii/
S0140366411003549 (Zitiert auf Seiten )
[Wed00] W, Rik, Michel Pieters: Eye Fixations on Advertisements and Memory for
Brands: A Model and Findings. Marketing Science (2000), Bd. 19:S. 297–312
(Zitiert auf Seiten )
[Wei91] W, Mark: The computer for the 21st century. Scientific American (1991),
Bd. 265(3):S. 66–75 (Zitiert auf Seiten )
[Woo04] W, Ken; F, Rowanne und W, Lyndsay: Playing with sensecam. Proc Playing with Sensors W3 at UbiComp 2004 (2004):S. 2–3,
URL http://scholar.google.com/scholar?hl=en&btnG=Search&q=
intitle:Playing+with+SenseCam (Zitiert auf Seiten )
[Zha99] Z, Shumin; M, Carlos und I, Steven: Manual and gaze input
cascaded (MAGIC) pointing, in: Proceedings of the SIGCHI conference on
Human factors in computing systems: the CHI is the limit, CHI ’99, ACM, New
York, NY, USA, S. 246–253, URL http://doi.acm.org/10.1145/302979.
303053 (Zitiert auf Seiten )
Erklärung der Selbstständigkeit
Ich versichere, dass ich die vorliegende Arbeit selbstständig verfasst und hierzu keinen
anderen als die angegebenen Hilfsmittel verwendet habe. Alle Stellen der Arbeit die
wörtlich oder sinngemäßaus fremden Quellen entnommen wurden, sind als solche kenntlich gemacht. Die Arbeit wurde bisher in gleicher oder ähnlicher Form in keinem
anderen Studiengang als Prüfungsleistung vorgelegt oder an anderer Stelle veröffentlicht.
Ich bin mir bewusst, dass eine falsche Erklärung rechtliche Folgen haben kann.
Ich versichere, dass die beiliegende CD-ROM und alle darauf enthaltenen Bestandteile
auf Viren überprüft und kein schädlicher, ausführbarer Code enthalten ist.
Furtwangen, den 31. Januar, 2012
Christian Weichel
APPENDIX A
Data loss and signal corruption
Three days before the deadline of this work, we set out to build new applications based on
the recording system. During the evaluation of one of these applications, we realized that
at the end of each recording, 6-9 seconds seemed to be missing. Something we had never
noticed before as all previous recordings were performed over a at least five minutes.
To investigate the issue, we recorded a predefined sequence of blinks: one blink every
three seconds and five blinks at every full minute. When comparing the recorded data with
the expected pattern, we found several blinks missing. During the time marked by the five
blinks, we would expect to see 20 blinks as the participant blinks once every three seconds
(60sec. · 1blink
= 20blinks). In the recorded data, however, we counted 11 blinks between
3sec
start and end, hence 9 blinks were dropped (figure A.1). We repeated that experiment
several times, leading us the conclusion that roughly every 10 seconds, 7-8 seconds of
data is dropped.
This phenomenon can be explained by considering the inner workings of the TMSi Mobi.
It always samples the data at 1kHz and broadcasts the data over Bluetooth at the same rate.
If one wants a lower sampling frequency, one has to receive all packages and drop those
which are unnecessary; that’s how the CRNT does it. Our implementation drops packages
on the wireless interface by only receiving packages at a certain rate (roughly 75Hz). As
opposed to a traditional RS232 serial connection, the Bluetooth SPP is reliable, so an ACK
is expected for every byte. But as we only read the data coming on the SPP connection too
slow, the Mobis send-buffer runs full and is discarded at some point - figure A.2 illustrates
that process. It is that buffer-clearing that we experience as data loss.
61
A Data loss and signal corruption
62
Figure A.1: Testing the recorded signal against a predefined blink pattern. All events (start,
blink, end) are marked in yellow, clearly identifiable points of signal corruption
are marked red. The blink count between start and end should be 20, but is 11:
9 blinks have been dropped.
This issue was not realized before, as the data coming from the Mobi does not contain
timestamps, but it is the logging program which timestamps the data upon reception (see
section 3.3.3.3). Due to the 1kHz sampling frequency of the Mobi, we do receive enough
samples which are then incorrectly scaled in time by having their timestamp assigned to
them at reception; a concept illustrated in figure A.2.
All parameters influencing the data dropping are fixed. The rate and length of the discarded
segments are influenced by the parameters listed in table A.1. As all of those parameters
are fixed, the dropping is fairly regular and applied to the whole dataset.
parameter
value
Mobi sampling rate 1kHz
send buffer size
unknown
data reception speed 75Hz
Table A.1: All known parameters influencing the data dropping rate.
63
Next steps (outside the scope of this thesis) are to analyze those data gaps by feeding a
controlled signal into the Mobi and comparing the measured signal with the original. We
could then perform a statistical analysis of the dropping rate and length. Such a test could
be performed using a signal generator to generate a sine wave with an amplitude of 5-6µV.
We expect the coupling between the Mobi and the signal generator to be a non-trivial task,
as one has to take the active shielding and external noise into account.
With the data dropping being regular and occurring during throughout the whole dataset,
we argue that we can still draw valid conclusions from the features we extract, as they’re
all affected to the same degree. However, we can not give absolute numbers, such as
”the blink rate during times of concentration is x blinks per second”. Trends and other
insights identified by any subsequent analysis of this dataset have to be subject to further
validation.
Figure A.2: Signal corruption due to too low packet reception speed. The EOG signal is only
partially received and scaled to fill the gaps.
64
A Data loss and signal corruption
APPENDIX B
Study preparation checklist
Ethics approval
Participant has signed the participation waiver
Experiment ID:
Date of preparation:
Date of study:
Observer:
1 Prepare equipment
Prepare recording equipment
On the phone /mnt/sdcard/datalogger is empty
The phone is fully charged
The SenseCam has no previous data stored on it
The SenseCams clock is synchronized to the phone
The SenseCam is fully charged
Four AA batteries charged
Pack the case
Four AA batteries charged, wrapped and placed in the case
Phone is turned off and placed in the case
At least 10 electrodes are packaged with the user manual, which is placed in the case
Both electrode cables, as well as the ground electrode cable, are placed in the case
The Mobi carrying case is placed in the case
Mobi is placed in the case
SenseCam is turned off and placed in the case
3 Review video stream
Ask if the participant wants to review the images
Image censorship process
Give the images to the participant
Request the images back from the participant
Delete the original images
4 Data recovery and post processing
Create a directory named as the experiment ID (experiment dir)
Download the datalogger (TMSi) data to the experiment dir
Download the GPX track to the experiment dir
Copy the (revised) SenseCam images to the experiment dir/images
2 Train participant
All following items have to be shown to the participant.
Mobi specifica
How to connect the electrode cables
How to attach the electrodes properly (special focus on the electrode order). Referred to
the diagram in the user manual
Inserting/replacing the batteries
Turning the Mobi on and off
Placing the Mobi in its carrying case and extracting it from said case
Recording application
Connecting to the Mobi
Told that the user must never hit the back button as it will end the recording
Told that a warning sound will ring if the connection to the Mobi is lost
Shown the labeling functionality (incl. special event - e.g. reattached electrodes)
Pointed out that the running number is an indicator for the logging activity (number is
data points logged so far)
Pointed out that accurate labeling is key to the study (can’t emphasize this enough)
SenseCam
How to turn the SenseCam on and off
Informed that the participant may choose to cover or not wear the cam in any situation
deemed too private (e.g. in the restroom)
Informed that before we use the pictures, the participant gets to see those pictures and
can blacken them when deemed necessary
65
66
B Study preparation checklist
APPENDIX C
Study consent form
Consent Form
Participant
Date
Title of Study
A day in the life of our eyes
Researcher
Before agreeing to participate in this research study, we kindly ask you to read and understand
the following explanation of the purpose and how it will be conducted.
Purpose of the study
The purpose of this study is to explore if one can identify high-level activities within eyemovement data. Further do we seek to explore other markers and information contained in
day-long eye-movement data.
Procedures
During the study, the participants eye movement data along with other modalities is recorded.
Those modalities include images being taken, accelerometer and gyroscope sensor data as well
as the users position using GPS. During the day of recording, the user is obliged to label his/her
activities using a predefined set of labels. The total experiment duration is roughly 12 hours
per subject.
Confidentiality
All information collected in the study is confidential, and the participants name will not be
identified any time. Before using the recorded images, the user is given those images and is
allowed to withhold or censor those images he/she deems necessary.
Risks
There are no risks to participants with this experiment.
Consent
I have had the opportunity to discuss this study and my questions have been answered to my
satisfaction. I consent to take part in the study with the understanding I may withdraw at any
time. I voluntarily consent to participate in this study.
Participant signature
Date
Researcher signature
Date
67
68
C Study consent form
APPENDIX D
Participant survey
69
70
D Participant survey
APPENDIX E
CD-ROM
A CD-ROM, containing the following files is attached to this work:
/thesis.pdf
bachelor thesis as PDF file
/thesis-latex/
bachelor thesis as LATEXsource code
/prasentation.pdf
thesis seminar presentation as PDF file
/monthly_reports/
monthly reports of the thesis seminar
71
72
E CD-ROM
APPENDIX F
Acknowledgements
I would like to thank Prof. Dr. Gellersen for giving me the chance to write this thesis in
such a vivid and productive environment, as well as for his supervision and advice during
the entire time.
I am grateful to Dr. Andreas Bulling for this methodological, technical and personal
support for this thesis, his experience and guidance were invaluable.
I owe to my colleagues, namely Melodie Vidal, Jayson Turner, Ming Ki Chong, Dominik
Schmidt, Adalberto Simone and Yanxia Zhang for advice and feedback during this work.
Finally, I want to express my sincere gratitude to my parents for supporting me throughout
my studies and making them possible in the first place. Notably my father for the endless
proofreading and editorial comments about this work.
Laura, thank you for your encouragement in times when I needed it the most.
73