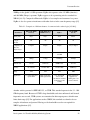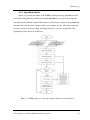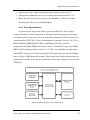
1
DEVELOPMENT OF A WEARABLE MOBILITY MONITORING SYSTEM Gaëtanne Haché Thesis submitted to the Faculty of Graduate and Postdoctoral Studies in partial fulfillment of the requirements for the degree of MASTER OF APPLIED SCIENCE in Biomedical Engineering Ottawa-Carleton Institute for Biomedical Engineering University of Ottawa © Gaëtanne Haché, Ottawa, Canada, 2010 Abstract Monitoring mobility at home and in the community, and understanding the environment and context in which mobility occurred, is essential for rehabilitation medicine. This thesis introduces a Wearable Mobility Monitoring System (WMMS) for objective measurement of community mobility. This prototype WMMS was created using a smartphone-based approach that allowed for an all-in-one WMMS. The wearable system is worn freely on a person’s belt, like a normal phone. The WMMS was designed to monitor a user’s mobility state and to take a photograph when a change-of-state was detected. These photographs are used to identify the context of mobility events (i.e., using an elevator, walking up/down stairs, type of walking surface). Mobility evaluation using the proposed WMMS was performed on five able-bodied subjects. System performance for detecting changes-of-state and the ability to identify context from the photographs was analyzed. The WMMS demonstrated good potential for community mobility monitoring. Development of a Wearable Mobility Monitoring System ii Table of Contents Abstract .............................................................................................................................. ii List of Tables .................................................................................................................... vii List of Figures ................................................................................................................. viii Acronyms ........................................................................................................................... x Acknowledgment ............................................................................................................. xii Chapter 1: Introduction ................................................................................................. 1 1.1 Contributions ..................................................................................................................... 2 1.2 Scope of the Thesis ............................................................................................................ 3 1.3 Overview of the thesis ....................................................................................................... 4 Chapter 2: 2.1 Literature Review ....................................................................................... 5 Community Mobility ......................................................................................................... 5 2.1.1 International Classification of Functioning, Disability and Health ........................... 6 2.1.2 Dimensions of Mobility Framework.......................................................................... 7 2.2 Mobility Measurement....................................................................................................... 9 2.2.1 Observation and Clinical Tests .................................................................................. 9 2.2.1.1 Dynamic Gait Index (DGI)................................................................................... 9 2.2.1.2 Functional Gait Assessment (FGA) ..................................................................... 9 2.2.1.3 Community Balance and Mobility Scale (CB&M) ............................................ 10 2.2.1.4 Berg Balance Scale............................................................................................. 10 2.2.1.5 Timed Up and Go Test ....................................................................................... 10 2.2.1.6 6-Minutes Walk Test .......................................................................................... 11 2.2.1.7 Tinetti Assessment Tool ..................................................................................... 11 2.2.1.8 Functional Independence Measure ..................................................................... 11 2.2.2 Diaries and Questionnaires ...................................................................................... 12 2.2.2.1 Diaries ................................................................................................................ 12 2.2.2.2 Functional Status Questionnaire......................................................................... 12 2.2.2.3 Health Assessment Questionnaire ...................................................................... 13 2.2.2.4 Environmental Analysis of Mobility Questionnaire........................................... 13 2.2.3 Technologies for Biomechanical Measurements ..................................................... 13 2.2.3.1 Visual Motion Tracking System......................................................................... 14 Development of a Wearable Mobility Monitoring System iii 2.2.3.2 Non-Visual Motion Tracking System ................................................................ 14 2.2.3.3 Force Plates ........................................................................................................ 15 2.2.3.4 Foot Pressure Analysis ....................................................................................... 15 2.2.4 Activity Monitoring ................................................................................................. 16 2.2.4.1 Pedometers ......................................................................................................... 16 2.2.4.2 Accelerometer-Based Activity Monitor ............................................................. 17 2.2.4.3 Physiological Measurements .............................................................................. 17 2.2.5 2.3 Summary of Mobility Measurement ........................................................................ 17 Wearable Mobility Monitoring Systems.......................................................................... 18 2.3.1 Wireless Body Sensor Network (WBSN) ................................................................ 19 2.3.2 Personal Server ........................................................................................................ 20 2.3.3 Wireless Standards................................................................................................... 21 2.3.4 Wearable Sensors..................................................................................................... 23 2.3.4.1 Accelerometers ................................................................................................... 24 2.3.4.2 Gyroscope........................................................................................................... 26 2.3.4.3 Magnetometer..................................................................................................... 26 2.3.4.4 Foot Pressure ...................................................................................................... 26 2.3.4.5 GPS .................................................................................................................... 27 2.3.4.6 Camera ............................................................................................................... 28 2.3.4.7 Ambient Sensors ................................................................................................ 29 2.3.5 Context Awareness .................................................................................................. 29 2.3.6 Summary of Wearable Systems ............................................................................... 30 2.4 Data Analysis Algorithms................................................................................................ 31 2.4.1 Accelerometer Placement ........................................................................................ 32 2.4.2 Frequency and Amplitude........................................................................................ 37 2.4.3 Calibration ............................................................................................................... 37 2.4.4 Filtering Techniques ................................................................................................ 39 2.4.5 Data Window ........................................................................................................... 40 2.4.6 Feature Extraction.................................................................................................... 41 2.4.7 Activity Classification ............................................................................................. 46 2.4.8 Summary of Data Analysis ...................................................................................... 49 Chapter 3: Rationale ................................................................................................... 51 3.1 Application of a Wearable Mobility Monitoring System (WMMS) ............................... 52 3.2 Objective of the thesis ..................................................................................................... 53 Development of a Wearable Mobility Monitoring System iv Chapter 4: 4.1 Methodology ............................................................................................. 54 Design Criteria ................................................................................................................. 54 4.1.1 System Design Criteria ............................................................................................ 54 4.1.2 Software Design Criteria ......................................................................................... 55 4.2 System Architecture......................................................................................................... 55 4.3 Determination of Change-of-State ................................................................................... 57 4.3.1 Mobility Tasks and Context Classification.............................................................. 57 4.3.2 Algorithm Outline.................................................................................................... 58 4.4 System Evaluation Outline .............................................................................................. 59 Chapter 5: Preliminary Evaluation of the BlackBerry for WMMS ............................ 60 5.1 Biomechanical Parameters Calculations .......................................................................... 61 5.2 Xbus Kit ........................................................................................................................... 63 5.3 Java Programming ........................................................................................................... 64 5.4 Test Procedure ................................................................................................................. 64 5.5 Preliminary Evaluation Results ....................................................................................... 65 5.6 Preliminary Evaluation Discussion.................................................................................. 66 5.7 Summary .......................................................................................................................... 67 Chapter 6: 6.1 Platform ........................................................................................................................... 68 6.1.1 6.2 Hardware Design and Evaluation ............................................................. 68 BlackBerry Bold Specifications and Features ......................................................... 68 External Board ................................................................................................................. 69 6.2.1 Design Criteria ......................................................................................................... 69 6.2.2 Parts Specifications.................................................................................................. 70 6.2.3 Board Functionality ................................................................................................. 73 6.2.4 Packet Format .......................................................................................................... 73 6.2.5 Commands ............................................................................................................... 73 6.2.6 Temperature and Humidity Sensors ........................................................................ 74 6.2.7 Light sensor ............................................................................................................. 74 6.2.8 Accelerometer Calibration ....................................................................................... 75 6.2.9 Data Filtering ........................................................................................................... 78 6.3 Hardware Evaluation ....................................................................................................... 78 6.3.1 6.4 Camera ..................................................................................................................... 78 Summary .......................................................................................................................... 79 Development of a Wearable Mobility Monitoring System v Chapter 7: Development of the Prototype WMMS .................................................... 80 7.1 Data Pre-processing ......................................................................................................... 80 7.2 Accelerometer Feature Generation .................................................................................. 81 7.2.1 Inclination Angle ..................................................................................................... 81 7.2.2 Standard Deviation .................................................................................................. 84 7.2.3 Skewness ................................................................................................................. 86 7.2.4 Signal Magnitude Area (SMA) ................................................................................ 90 7.3 Light................................................................................................................................. 92 7.4 GPS .................................................................................................................................. 93 7.5 Unused Features............................................................................................................... 94 7.6 Determination of State and Change-of-State ................................................................... 95 7.7 Software development ..................................................................................................... 99 7.8 Summary ........................................................................................................................ 102 Chapter 8: Technical and Mobility Evaluation of the Prototype WMMS ................ 103 8.1 Technical Evaluation ..................................................................................................... 103 8.2 Mobility Evaluation ....................................................................................................... 105 8.2.1 Subjects .................................................................................................................. 105 8.2.2 Data Collection ...................................................................................................... 105 8.2.3 Data Analysis ......................................................................................................... 110 8.2.4 Change-of-State Detection Results ........................................................................ 114 8.2.5 BlackBerry Image Evaluation Results ................................................................... 118 8.3 Mobility Task Discussion .............................................................................................. 121 8.3.1 Use of Images in WMMS ...................................................................................... 121 8.3.2 WMMS Change-of-State Detection....................................................................... 123 8.3.3 Limitations ............................................................................................................. 126 Chapter 9: 9.1 Conclusion .............................................................................................. 127 Future Work ................................................................................................................... 127 References ...................................................................................................................... 129 Appendix A .................................................................................................................... 146 Appendix B .................................................................................................................... 150 Appendix C .................................................................................................................... 151 Appendix D .................................................................................................................... 154 Appendix E..................................................................................................................... 162 Development of a Wearable Mobility Monitoring System vi List of Tables Table 2.1: Comparison of different features of common wireless technologies [85, 104])... 22 Table 2.2: Example of laboratory and clinical studies using accelerometers for movement and mobility analysis. List modified from Godfrey et al. [77]. ............................................. 34 Table 5.1: Preliminary BlackBerry evaluation results ........................................................... 66 Table 6.1: Summary of specifications for main component of the external sensors board. .. 71 Table 6.2: Average output value of the light sensor (mV) for different light conditions (standard deviation in brackets). ............................................................................................ 75 Table 6.3: BlackBerry Bold camera performance evaluation results. ................................... 79 Table 7.1: Description of the state bits................................................................................... 96 Table 7.2: Section of a WMMS output file to demonstrate timing of the picture taken. ....... 98 Table 8.1: Results for the BlackBerry Bold battery evaluation. .......................................... 104 Table 8.2: Changes-of-state and context to be identified from WMM pictures. ................. 113 Table 8.3: Summary performance results for the each subject. ........................................... 116 Table 8.4: Performance results for each of the mobility tasks ............................................. 116 Table 8.5: Summary results for the picture evaluation. ....................................................... 119 Table B.1: Compiled results for each trial of the five subjects. ........................................... 150 Table C.1: Sensitivity values for each of the mobility tasks for each of the trials............... 151 Table D.1: Picture evaluation results from evaluator 1........................................................ 154 Table D.2: Picture evaluation results from evaluator 2........................................................ 158 Development of a Wearable Mobility Monitoring System vii List of Figures Figure 2.1: Interaction between ICF components (reproduced from [18]). ............................. 7 Figure 2.2: Dimensions of Mobility framework (reproduced from [1]). ................................. 8 Figure 2.3: Vicon Motion System [62]. ................................................................................. 14 Figure 2.4: Motion track (MTx) from Xsens Technologies (reproduced from [65])............. 14 Figure 2.5: Examples of Force Plates. On the left is model BP400600 from AMTI [66] with dimensions 8.26 x 60 x 40 cm. On the right is a smaller force plate from Bertec Corporation [67]. ........................................................................................................................................ 15 Figure 2.6: On the left, example of pressure mat and software analysis using the emed-at/m model from Novel [69]. On the right, example of foot pressure insole from the F-Scan Lite VersaTek System [68]. ........................................................................................................... 16 Figure 2.7: Example of a Wireless Body Area Network of intelligent sensors for patient monitoring (reproduced from [84]). ....................................................................................... 20 Figure 2.8: Mass-spring system. ............................................................................................ 24 Figure 2.9: SenseCam images [129]. ..................................................................................... 29 v Figure 2.10: Seismic uniaxial accelerometer measuring the component a u u of an equivalent v acceleration a eq in the direction u of the sensitive axis of the accelerometer. The equivalent v acceleration is the sum of the acceleration a of the sensor and the equivalent gravitational v acceleration g acting on the seismic mass. ϕ1 is the angle between the sensitive axis of the v accelerometer and the acceleration a ; ϕ 2 is the angle between the sensitive axis and the gravitational field (reproduced from [147]). .......................................................................... 43 Figure 2.11: Dual- or tri-axis accelerometer with two axes for measuring tilt (reproduced from [172]). ............................................................................................................................ 43 Figure 2.12: Generic classification framework presented by Mathie et al. [175]. ................. 48 Figure 4.1: System Architecture of a WMMS. ...................................................................... 55 Figure 4.2: Front and side view images of the WMMS. ........................................................ 56 Figure 4.3: WMMS signal processing and algorithm outline for each data window............. 58 Development of a Wearable Mobility Monitoring System viii Figure 5.1: System architecture for the preliminary testing. .................................................. 60 Figure 5.2: Sensor placement for the calculation of biomechanical parameters. ................... 61 Figure 5.3: Sensor placement. ................................................................................................ 63 Figure 6.1: Front, side and back view of BlackBerry Bold [181]. ......................................... 68 Figure 6.2: Block diagram of the external board. .................................................................. 70 Figure 6.3: Image of the board with all the sensors identified. .............................................. 71 Figure 6.4: Examples of the drift acceleration versus time for x-, y- and z-axis. .................. 77 Figure 7.1: Inclination angle measurement method. In standing position, inclination angle is 180 degrees. ............................................................................................................................ 82 Figure 7.2: Position classification method. ............................................................................ 83 Figure 7.3: Flowchart of the double threshold (DT) algorithm applied to the standard deviation of the y-axis acceleration........................................................................................ 85 Figure 7.4: Standard deviation of y-axis acceleration during level ground walking (dynamic), followed by a short period of standing (static), and then back to walking. ........................... 86 Figure 7.5: Algorithm flow chart for skewness of y-axis acceleration. ................................. 88 Figure 7.6: Example of a skewness curve for y-axis acceleration. The top graph is the skewness only. The bottom graph is the skewness curve but with some dynamic, static and stairs states identified. The dotted line shows when the dynamic level was identified (i.e., when the skewness values was analyzed for stairs or not stairs state). .................................. 89 Figure 7.7: SMA of a person walking then sitting, standing up, walking, lying down on a bed, getting up from the bed, lying on the floor, and getting up again. ................................. 91 Figure 7.8: Flowchart of the SMA algorithm......................................................................... 92 Figure 7.9: Example of the light intensity feature signal while performing mobility tasks indoors and outdoors. ............................................................................................................. 93 Figure 7.10: State determination algorithm. DT stands for “double threshold”. ................... 97 Figure 7.11: Overview of programming flow. ..................................................................... 101 Figure 8.1: BlackBerry battery with full WMMS application running (Trial 2). ................ 104 Figure 8.2: Example of the spreadsheet used by the pictures evaluators. ............................ 113 Development of a Wearable Mobility Monitoring System ix Acronyms 3D Three dimensional AC Alternating Current ADL Activities of Daily Living ADT Automatic Decision Tree API Application Programming Interface BBS Berg Balance Scale CART Classification and Regression Trees CB&M Community Balance and Mobility Scale CDT Custom Decision Tree COPD Chronic Obstructive Pulmonary Disease CRC Cyclic Redundancy Check CWT Continuous Wavelet Transform DC Direct Current DGI Dynamic Gait Index DT Double Threshold DWT Discrete Wavelet Transform EAMQ The Environmental Analysis of Mobility Questionnaire ECG Electrocardiogram EE Energy Expenditure EEact Energy Expenditure due to physical activity FAM Functional Assessment Measure FFT Fast Fourier Transform FGA Functional Gait Assessment FIM Functional Independence Measure FSQ Functional Status Questionnaire GPS Global Positioning System GSM Global System for Mobile communications HAQ Health Assessment Questionnaire HMM Hidden Markov Model IADL Instrumental Activity of Daily Living Development of a Wearable Mobility Monitoring System x IBL Instance Based Learning ICF The International Classification of Functioning, Disability and Health IEEE Institute of Electrical and Electronics Engineers IMA Time integrals from separate measurement direction ISM Industrial, Scientific, and Medical Band J2ME Java 2 Micro Edition MEMS Micro-Electro-Mechanical System MMS Multimedia Messaging Service NN Neural Network PA Physical Activity PDA Personal Digital Assistant PDPU Personal Data Processing Unit RSS Root Sum of Square RTM Rotation Transformation Matrix SMA Signal Magnitude Area SMS Short Message Service SMV Signal Magnitude Vector STDY Standard Deviation of Y-axis SVM Support Vector Machine UWB Ultra-wideband WBAN Wireless Body Area Networks WBSN Wireless Body Sensor Networks WLAN Wireless Local Area Network WMMS Wearable Mobility Monitoring System Development of a Wearable Mobility Monitoring System xi Acknowledgment I would like to thank Dr. Lemaire and Dr. Baddour for their support and guidance that helped me complete my research. I would never be able to thank enough my fiancé Keith Heggie for his help, support, understanding, patience and encouragement throughout that journey. Thanks to Keith Heggie for designing and providing the external sensor board. Thanks to Research In Motion (RIM) for their technical and financial support. The Ontario Graduate Scholarships in Science and Technology program and the Ontario Centers of Excellence are also acknowledged for financial support. Thanks to all the people at the Ottawa Hospital Rehabilitation Center, especially to Cindy Kendell for all your help and friendship. Development of a Wearable Mobility Monitoring System xii Introduction Chapter 1: Introduction Mobility can be defined as the ability to move independently from one point to another [1] and is essential for maintaining independence. Mobility is required to perform many activities of daily life, such as cooking, dressing, shopping and visiting friends. According to Statistics Canada, mobility problems are one of the issues that affect the greatest number of adults [2]. The number of people with mobility issues has increased from 10.5% to 11% since 2001, most likely due to Canada’s aging population [2]. Mobility disabilities can affect an individual’s quality of life, health, productivity, independence, and also affect the lives of their family and the people around them. Preserving mobility is paramount in order to stay independent and active at home and in the community. Accurate mobility assessment is required for decision-making in rehabilitation medicine. Such assessments can be used to determine mobility issues outside a hospital environment, evaluate the progress made during and after rehabilitation, and enhance clinical decisionmaking about a rehabilitation program (i.e., assistive devices, exercises, treatment, etc.). Currently, many different types of mobility assessments are performed in clinical setting and are supervised by the rehabilitation physician. These assessments include clinical tests, quantitative measures, and subjective feedback from the client. Although clinical mobility tests have their value, these easy to apply assessment tools may not be appropriate for determining the contributing factors for independent community walking and the impact of the environment on the individual’s mobility [3, 4]. Monitoring the mobility outside a clinical setting is important because mobility in the real world is typically different from the mobility measured in the clinic [5]. Wearable technology can be developed to evaluate mobility in any location or environment. Wearable mobility monitoring systems are designed to be worn on the body and allow mobility monitoring in the person’s home and the community [6]. Development of a Wearable Mobility Monitoring System 1 Introduction Many wearable mobility monitoring studies measure biomechanical and/or location parameters [5, 7-10], but most lack environmental or contextual information. In community mobility monitoring, contextual information is important since it could provide insight on where, how, and on what a person is moving. A camera could provide contextual information from a person’s surrounding environment. Example of wearable systems that use contextual information, are context-aware systems [11] and life logs [12], but they are not meant for community mobility monitoring for people with physical disabilities. Some context-aware wearable systems use context information to better recognize activities [13-15], but the environmental characteristics in which activities take place are not analyzed for their impact on mobility. There is a need for an assessment tool that could monitor mobility within the home environment and the community for a long period, and provide information on the context in which mobility occurred. This tool could help clinical professionals and rehabilitation researchers to determine appropriate training to enhance mobility in the community and could help identify mobility challenges. The tool could also help monitor progress or deterioration, thereby providing an indication of treatment effectiveness. 1.1 Contributions This thesis presents a Wearable Mobility Monitoring System (WMMS) to monitor a person’s mobility at home, outside the home, and in the community. Our proposed WMMS provides solutions to the limitations of current assessment tools by providing unsupervised objective mobility measurements in a cost-effective way. The WMMS also provides information on the context and environment in which mobility event takes place, which could identify mobility challenges in a person’s own environment. The WMMS was developed using a smartphone-based approach, which takes advantage of the smartphone’s available features such as GPS, camera, Bluetooth, and Wi-Fi, to create an all-in-one WMMS. The WMMS is worn comfortably and freely on a person’s belt, just like a normal phone. A Smart-Holster was developed to hold the phone at the hip and provide Development of a Wearable Mobility Monitoring System 2 Introduction additional sensor data; such as, accelerometer, light sensor, and temperature/humidity sensor. To the best of our knowledge, an all-in-one wearable system using a smartphone to monitor a person’s mobility in his or her everyday environment, as well as using a camera to provide insight on the environment and context, has not been explored. 1.2 Scope of the Thesis The WMMS was designed to monitor a user’s mobility state and to take a photograph when a user’s change-of-state related to mobility was detected. The taken photographs assist in defining the context of the mobility event (i.e., using an elevator, walking up a ramp, type of walking surface, etc.) The changes-of-state that were evaluated in this thesis were starting or stopping an activity (e.g., walking, running, cleaning), sitting down, lying down, getting up (i.e., from chair, bed), going up and down stairs, using transportation (e.g., bus, car, biking), and moving between indoors and outdoors. The WMMS was intended for people with physical mobility disabilities, or at risk to develop mobility disabilities, but who are still mobile in the community. People with age related pathologies, such as stroke, osteoarthritis, and other physical illness, which are often associated with a reduction in mobility, could also benefit from this wearable system. The validation process was performed on five able-bodied subjects. The subjects were asked to do a series of predefined mobility tasks; such as walking, going up/down stairs, walking up/down a ramp, sitting, lying, walking outside, taking the elevator and riding in a car. The system was evaluated for sensitivity and specificity for detecting changes-of-state. The pictures were evaluated for their usefulness in defining the context of the mobility event. For this pilot study, the system was not intended to recognize all activities. However, from the different types of data that were collected, further algorithms could be developed to expand on the types of activities and improve context recognition. Development of a Wearable Mobility Monitoring System 3 Introduction 1.3 Overview of the thesis After the introduction, Chapter 2 provides a literature review related to mobility assessment. From that review, Chapter 3 gives the rationale for this research. Chapters 4 to 8 cover the methodology. Chapter 4 starts with the design criteria for the development of a wearable mobility monitoring system and gives an overview of the development and evaluation process. Chapter 5 covers a preliminary study that evaluated the BlackBerry smartphone as a hub for a WMMS. Chapter 6 presents the hardware design and evaluation. Chapter 7 describes the development of the WMMS, including the algorithms and methods used to detect a change-of-state. Chapter 8 presents the technical and mobility evaluation of the WMMS. Finally, Chapter 9 gives an overall conclusion of the thesis. Development of a Wearable Mobility Monitoring System 4 Literature Review Chapter 2: Literature Review This chapter reviews the literature on methods and technologies for monitoring and assessing a person’s mobility. This chapter is divided into four main sections: community mobility and the importance of the environment in which mobility takes place (2.1); current mobility measurement methods and technologies (2.2); wearable technologies (2.3); and data analysis techniques related to mobility monitoring studies (2.4). 2.1 Community Mobility Independent ambulation within the home and the community is an important rehabilitation goal for a person with physical impairments [16]. Lord et al. defined community ambulation [16] as “independent mobility outside the home which includes the ability to confidently negotiate uneven terrain, private venues, shopping centres and other public venues”. This definition was based on the environments that participants considered the most important. Patla and Shumway-Cook [1] defined community mobility as “the locomotion in environments outside the home or residence”. The achievement of independent community mobility is dependent on various factors. Frank and Patla [17] mentioned that community mobility depends on: 1. The skills and abilities of the performer 2. Requirement of the task (activity) 3. Challenges of the environment The importance to account for the environmental factors when assessing mobility has been previously emphasized by two well-known models. The International Classification of Functioning, Disability and Health (ICF) from the World Health Organisation [18] covers aspects of a person’s health, including mobility. The Dimensions of Mobility framework from Patla and Shumway-Cook [1] focuses on the person’s mobility. The main idea behind theses two models or frameworks is that a person’s health condition is not only a result of Development of a Wearable Mobility Monitoring System 5 Literature Review the individual alone, but is a combination of relationships between the individual and external factors. The ICF model encourages clinicians to acknowledge elements in the physical environment that can facilitate or impede a client’s ability to ambulate in their community. The eight environmental mobility dimensions provide a framework for assessing the impact of the environment in specific areas. The two models are sometimes used, such as by Corrigan and McBurney [4], to evaluate the effectiveness of mobility assessment tools to determine community ambulation status. The following summarizes these two models. 2.1.1 International Classification of Functioning, Disability and Health The International Classification of Functioning, Disability and Health (ICF), is a classification system that provides a unified and standard language and framework to describe health and health-related states [18]. The ICF belongs to the World Health Organization (WHO) family of international classifications [19]. The ICF has two parts, each divided into two components: 1) functioning and disability, which comprises body functions and structures, activities, and participation; 2) contextual factors, which comprises environmental factors and personal factors. The ICF is used to describe and evaluate disability using the complex relationships between an individual’s health condition and contextual factors. An illustration of the ICF model is presented in Figure 2.1, demonstrating the interaction between the different components. ICF environmental factors comprise “the physical, social, and attitudinal environment in which people live and conduct their lives” [18]. Understanding the impact that the physical environment can have on community mobility is important, because some environments may have barriers that could decrease a person’s mobility, or may also have facilitators that could increase mobility. Development of a Wearable Mobility Monitoring System 6 Literature Review Figure 2.1: Interaction between ICF components (reproduced from [18]). 2.1.2 Dimensions of Mobility Framework The Dimensions of Mobility framework was developed by Patla and Shumway-Cook [1] to define community ambulation with respect to the physical environment's impact on a person’s mobility (Figure 2.2). This framework consists of eight environmental factors, called dimensions, which determine the degree of complexity and difficulty of mobility. The dimensions are: minimum walking distance, time constraints on locomotion, ambient conditions, terrain conditions, physical load interaction, attention demands, postural transitions, and density of traffic (both vehicular and other individuals). These dimensions capture the external demands for independent community mobility. Therefore, with this model, disability level is expressed as the range of environmental contexts where the tasks required to perform daily activities can be carried out, as opposed to expressing disability level by the number of tasks a person can or cannot do [1]. Development of a Wearable Mobility Monitoring System 7 Literature Review Figure 2.2: Dimensions of Mobility framework (reproduced from [1]). Interestingly, around the same timeframe, a study by Stanko et al. [20] used an open-ended questionnaire to ask 15 physiotherapists which tasks and destinations are important to include in a new outcome measure. The paper mentioned that the study was completed before the dimension of mobility model was published, and therefore the respondents were not influenced by that research. The responses obtained identified items in each of the eight dimensions, which clearly emphasized the role of the environment in defining mobility. The Dimension of Mobility framework was explored further by Shummay-Cook et al. [21] who examined environmental challenges that older adult, with and without mobility impairments, would encounter while walking in the community. The frequency of encounters for each of the eight dimensions was measured using a self-administrated questionnaire to collect information on activities and trips. Subjects were video-taped during three trips in the community to record the physical environment associated with community mobility. Older adults with mobility issues were characterized by a decrease in the number of trips taken in the community and the number of activities performed during these trips. The dimensions that distinguished between an older adult with mobility disability and an older adult without such disabilities were temporal factors, physical load, terrain, and Development of a Wearable Mobility Monitoring System 8 Literature Review postural transition. The dimensions that did not distinguish between groups were distance, traffic density, ambient conditions, and attentional demands. 2.2 Mobility Measurement The following summarizes existing methods used to measure mobility; including, functional mobility, community ambulation, physical activity, and human motion analysis. The categories presented are observation and clinical tests, diaries and questionnaires, physiological measurements, and biomechanical measurements. 2.2.1 Observation and Clinical Tests Observation and clinical tests are performance-based measures used to assess an individual’s functional mobility. These tests are usually easy to perform and are carried out in a clinical environment over a short period. However, they are highly dependent on the test administrator’s subjectivity and reaction time. Furthermore, as suggested by Myers et al. [22], the individual’s performance at the time of assessment may not be representative of their usual performance. As pointed out by Patla [23], the environment in which the assessment takes place is usually a flat, well-lit area, which is an exception in community mobility. The following describes some common observational and clinical tests that measure mobility. 2.2.1.1 Dynamic Gait Index (DGI) The Dynamic Gait Index (DGI) evaluates postural stability in older adults over eight different tasks; including walking at different speeds, walking while turning the head, ambulating over and around obstacles, ascending and descending stairs, and making quick turns. Each task is scored on a scale of 0 to 3, with a maximum possible score of 24. A score less than 19 indicates a high risk of falling during gait [24-28]. 2.2.1.2 Functional Gait Assessment (FGA) The Functional Gait Assessment (FGA) is a 10-item gait assessment, based on the DGI. Wrisley et al. [29] created and validated the FGA. This test includes seven out of eight DGI tasks and three new tasks: gait with narrow base of support, ambulating backwards, and Development of a Wearable Mobility Monitoring System 9 Literature Review gait with eyes closed. These new tasks were added since they were observed to be difficult for people with vestibular disorders. The walking around obstacles task from the original DGI was removed since this task was considered to be of insufficient difficulty. The FGA demonstrated similar reliability to the DGI and was considered to have acceptable reliability and validity as a clinical gait measure for patients with vestibular disorders [29]. 2.2.1.3 Community Balance and Mobility Scale (CB&M) The Community Balance and Mobility Scale (CB&M) was designed to evaluate balance and mobility in high functioning ambulatory patients who have persistent balance problems [30]. CB&M is a multiple components test that measures performance on thirteen physical tasks: unilateral stance, tandem walking, 180 degree tandem pivot, lateral foot scooting, hopping forward, crouch and walk, lateral dodging, walking and looking, running with controlled stop, forward to backward walking, walk, look and carry, descending stairs, step-ups x 1 step. This measure was a reliable and a valid scale for the traumatic brain injury population [31], but could also be appropriated for clients with other diagnoses [32]. 2.2.1.4 Berg Balance Scale The Berg Balance Scale (BBS) is a 14-item clinical tool developed to measure functional balance in an older population [33]. The items include: a sitting task, transfer tasks (sitting to standing, standing to sitting, and other), standing tasks (unsupported, with eyes closed, with feet together, tandem, on one leg), and other mobility tasks (turning trunk with feet fixed, retrieving object from floor, turning 360 degrees, stool stepping, and reaching forward while standing). Each item is scored on a scale from zero to four, with a maximum possible score of 56. A score of 0 to 20 represents balance impairment, 21 to 40 represents acceptable balance, and 41 to 56 represents good balance. Although originally designed for older adults, a recent systematic review by Blum and Korner-Bitensky [34] about the BBS psychometric properties for stroke rehabilitation, suggested that the BBS is a valuable tool for assessing clinical change in balance after stroke. 2.2.1.5 Timed Up and Go Test The “Timed Up and Go Test” was originally called “Get Up and Go Test” [35], but the name changed after the test was validated with a timed score [36]. This simple test Development of a Wearable Mobility Monitoring System 10 Literature Review consisted of asking the patient, who is sitting in an armchair, to stand up, walk three meters, turn around, walk back to the chair, and sit down. The time taken to execute this task can predict the person’s ability to go outside alone safely. 2.2.1.6 6-Minutes Walk Test The 6-minutes walk test was developed to measure functional capacity of people with respiratory and cardiac conditions. The test is usually performed indoors on a long, flat, and straight path, but could also be done outdoors if the weather is comfortable [37]. This test measures the distance that a patient can quickly walk for a period of 6 minutes. The 6-minute walk test was recently recommended as a clinical measure for community ambulation [38]. 2.2.1.7 Tinetti Assessment Tool The Tinetti Assessment Tool [39] is a widely used tool to assess balance and gait in elderly patients and identify patients at risk of falling. The tool is divided into two parts: balance assessment and gait assessment. The balance part consists of evaluating the patient performing different static positions and position changes such as sitting balance, arising from a chair, immediate and prolonged standing balance, withstanding a nudge on the sternum, balance with eyes closed, turning balance, and sitting down. The gait part consists of observing different components of gait and scoring them as normal or abnormal [40, 41]. 2.2.1.8 Functional Independence Measure The Functional Independence Measure (FIM) is a tool used to quantify physical and cognitive disability in terms of level of care required. FIM is a widely adopted tool in rehabilitation facilities [42]. The FIM consists of 18 items covering independence in selfcare, sphincter control, mobility, locomotion, communication, and cognition [43]. Each item can be rated from observations, patient interview, or medical records. The rating is based on performance rather than the capacity. Alternative forms of the FIM include the Functional Assessment Measure (FAM), which consists of the FIM plus 12 new items in the areas of cognition, behaviour, communication, and community functioning [44]. More details of FIM can be found in [45]. Development of a Wearable Mobility Monitoring System 11 Literature Review 2.2.2 Diaries and Questionnaires Diaries and questionnaires are used to assess mobility disability or disability in activities of daily living (ADL) by having the participants report on whether they have difficulties or need help in performing ADL or mobility related tasks [46]. These two approaches provide complementary information to performance-based mobility tests, because these methods can capture a person’s perception of their ability to perform daily activities and capture details on the environmental impact on mobility. However, self-reports and questionnaires on ADL disability are known for their compromised reliability due to under or over reporting [47] and their limited reliability in a frail older population [48]. Despite these disadvantages, questionnaires remain one of the few ways to understand mobility performance in the community [49]. The following will describe some of these methods. 2.2.2.1 Diaries Diaries have been used to assess mobility in the community. Follick et al. [50] asked patients to record, three times a day in half-hour blocks over 24 hours, the time spent lying, sitting, standing/walking, and sleeping. In a recent study by Moore et al. [51], the activity diary appeared to have greater promise than pedometers (step counters) for measuring freeliving daily activities in a chronic obstructive pulmonary disease (COPD) population. However, diaries require a high level of adherence from the patients and are retrospective and subjective [6, 52]. Diaries are known for their potential recall bias and misreporting of activity level, which affect their accuracy [53]. 2.2.2.2 Functional Status Questionnaire The Functional Status Questionnaire (FSQ) is a comprehensive self-report functional assessment of patients receiving ambulatory care [54]. The FSQ is divided into five main sections: physical function of the activities of daily living, psychological function, role function, social function, and a variety of performance measures. In mobility studies, researchers sometimes used only FSQ subscales that relate to physical activities; such as, ADL, Instrumental Activity of Daily Living (IADL), and social activity [55-57]. The ADL subscale consists of questions about activities such as dressing, bathing, transfers, and Development of a Wearable Mobility Monitoring System 12 Literature Review mobility. The IADL subscale covers activities such as shopping, using public transportation, and maintaining a household. The social activity subscale is related to social interaction such as the person’s ability to visit with family and friends. 2.2.2.3 Health Assessment Questionnaire The Health Assessment Questionnaire (HAQ) was first developed to assess IADL in arthritis patients [58], but is now also used in research settings, patient care, and general population surveys [45]. The HAQ disability dimension consists of a self-report of 20 questions that covers eight areas: dressing and grooming, arising, eating, walking, hygiene, reaching, gripping, and outdoor activities. The score on each question is averaged to create a global Functional Disability Index score [59]. 2.2.2.4 Environmental Analysis of Mobility Questionnaire The Environmental Analysis of Mobility Questionnaire (EAMQ) was developed by Shumway-Cook et al.[60] as a self-report questionnaire. EAMQ collects information on 24 features of the physical environment, grouped within eight dimensions (Section 2.1.2). Subjects were asked to report the frequency of encounters or avoidance using a five-point ordinal scale (never, rarely, sometimes, often, always) for each of the features. Preliminary results indicated that mobility disability is characterized by a reduction in the number and type of environmental challenges. A reduction of encounters could lead to a reduction in movement for an individual, which could potentially lead to further deterioration in physical status and social interactions. The questionnaire was suggested to be a valid method for determining environmentally specific mobility disability [61]. EAMQ was validated using video camera and direct observation. Further research with a larger sample was still necessary to verify the findings from this study [61]. 2.2.3 Technologies for Biomechanical Measurements The following describes commonly used instruments to quantify different biomechanical parameters in laboratory settings. This includes gait and foot pressure analyses. Some of the following instruments have the advantage of being very accurate but are limited by space requirements, setup time, and cost. Development of a Wearable Mobility Monitoring System 13 Literature Review 2.2.3.1 Visual Motion Tracking System Visual motion tracking systems can be either a marker or marker-free system, based on whether they need markers to be affixed to body parts. Motion tracking systems can be integrated with force plates and electromyography (EMG) Figure 2.3: Vicon Motion System [62]. systems in a laboratory setting. In marker-based tracking systems, cameras record the motion of light-reflecting or light-producing markers attached to the human body. An example is the Vicon Motion System [62] (Figure 2.3). These video-based systems often represent the “gold standard” in human motion analysis [63]. In a marker-free system, human motion is analyzed with computer vision techniques and algorithms [64]. For both marker and marker-free systems, the number of cameras used to capture threedimensional (3D) data will vary depending on the laboratory needs, size, and configuration. Major drawbacks include the time for setup, camera calibration, and marker placement. 2.2.3.2 Non-Visual Motion Tracking System Non-visual motion tracking systems do not use cameras to detect human motion. Inertial sensor based systems are a commonly used non-visual system. These systems are based on inertial sensors such as accelerometers and gyroscopes, biomechanical models, and sensor fusion algorithms. An example is the XBus Kit (XSens Motion Technologies, Netherlands) which Figure 2.4: Motion track (MTx) from Xsens Technologies (reproduced from [65]). consists of a portable unit (XBus Master) collecting data from multiple or single motion tracker devices (MTx) [65]. MTx (Figure 2.4) are attached to different body segments and can measure 3D rate-of-turn, acceleration, and earth-magnetic field. These data are combined using a Kalman Filter technique to calculate 3D orientation of the MTx unit. A literature survey by Zhou and Hu [63] provides more details on these Development of a Wearable Mobility Monitoring System 14 Literature Review systems as well as other sensing techniques used for non-visual motion tracking systems, including magnetic, acoustic, ultrasonic, EMG, and data gloves. 2.2.3.3 Force Plates Force plates, also called force platforms, are the most common force transducers in gait analysis. This instrument consists of a plate flush with the ground, instrumented with strain gauges or piezoelectric transducers, and measures 3D ground reaction forces and moment as the subject makes contact with the plate. Force plates are often found in gait analysis laboratories and come in different sizes and prices (Figure 2.5). Figure 2.5: Examples of Force Plates. On the left is model BP400600 from AMTI [66] with dimensions 8.26 x 60 x 40 cm. On the right is a smaller force plate from Bertec Corporation [67]. 2.2.3.4 Foot Pressure Analysis Foot pressure analysis systems measure load distribution under the plantar surface of the foot. Two types of systems exist: pressure mat or pressure insole (Figure 2.6). A pressure mat is similar to a force plate since the mat is placed on the ground and the subject walks onto the mat. Pressure insoles are placed directly in the footwear, which provides portable pressure measurement between the foot and the shoe (i.e., forces are not dampened by the footwear). Examples of commercial manufacturers are TekScan Inc. (Massachusetts, USA) [68] and Novel (Munich, Germany) [69]. Both companies provide a variety of foot pressure systems including pressure mats and pressure insoles. Development of a Wearable Mobility Monitoring System 15 Literature Review Figure 2.6: On the left, example of pressure mat and software analysis using the emed-at/m model from Novel [69]. On the right, example of foot pressure insole from the F-Scan Lite VersaTek System [68]. 2.2.4 Activity Monitoring A good level of physical activity is usually associated with positive health benefits. Therefore, the assessment of the physical activity is sometimes used as an indication of health status. The following presents monitoring devices used in research, clinical, and commercial settings. 2.2.4.1 Pedometers Pedometers are a well known type of activity monitor [70]. These devices are usually worn at the waist, with some models worn on the ankle or the calf, and they estimate activity by sensing steps during walking. More advanced pedometer models may include synchronization of step count measurements to a 24-hour clock, such as the Step Watch 3 Activity Monitor (Orthocare Innovation, Oklahoma City, OK, USA) [71]. However, pedometers may be poor at identifying other activities (e.g. bicycle riding). In addition, pedometers cannot provide information on static activities. Additionally, studies have found that pedometers are not a good choice when assessing physical activity in older adults at risk of mobility disability because pedometers underestimate the number of steps during slow walking [72, 73]. Despite these limitations, pedometers were still found to be a valid, simple, and inexpensive method for assessing physical activity in research and practice [74] and for detecting differences in ambulatory activity according to age and functional limitations [75]. Recently, a more precise step counter (<0.5% error) was developed by Giansanti et al. [76]. This step counter uses calf muscle expansion measured with a force resistive sensor, to define a step for people with Parkinson’s disease. Development of a Wearable Mobility Monitoring System 16 Literature Review 2.2.4.2 Accelerometer-Based Activity Monitor Many commercially available systems for research and individual health care monitoring incorporating accelerometers are presented by Godfrey et al. [77]. Examples include a waist-mounted RT3 tri-axial device (Stayhealthy Inc., Monrovia, CA, USA) [78] for calorie monitoring and the activPAL (Pal Technologies Ltd, Glasgow, United Kingdom) [79] used to detect time-spent sitting/lying, standing and stepping. Inertial sensors applications in wearable system will be discussed in Section 2.3.4. 2.2.4.3 Physiological Measurements Metabolic energy expenditure is a standard physical activity measure [80, 81]. Measurement of heart rates, muscle activity (EMG), and pulmonary ventilation volume are examples of physiological measures used for this purpose [82]. However, these objective measures usually have a high cost per measurement [6]. In addition, these methods might need sensors attached directly to the skin at precise locations on the body, such as for EMG. This might not be suitable for a wearable long-term monitoring mobility system. 2.2.5 Summary of Mobility Measurement Observation and clinical mobility assessment tools are performance-based measures that evaluate functional mobility and predict how a person will perform in the community. However, good outcomes from standardized clinical measures do not always result in independent community ambulation [16]. The complexity of the person’s environment, found within and outside of the home, cannot be fully represented by these tools. Laboratory-based instruments to measure biomechanical parameters are usually very accurate, but are limited by space requirements, setup time, setup capabilities (i.e., may not accommodate stairs, inclines, uneven ground, etc.), and cost. Therefore, motion laboratory systems are seldom used for community mobility analysis applications. Activity motoring instruments have the advantage of being wearable and can monitor mobility for a long time in the person’s own environment. However, they usually measure one aspect of physical activity and they do not have information on where the activity took place (i.e., context). Development of a Wearable Mobility Monitoring System 17 Literature Review 2.3 Wearable Mobility Monitoring Systems A wearable system is designed to be worn on the body and allow continuous monitoring of biomechanical and physiological data, regardless of the user’s location, while he or she goes about their normal daily activities [6, 72, 83]. Some advantages of using wearable systems to measure mobility are direct access to biomechanical parameters, data logging and processing can be done anywhere, and technological advances are leading to a reduced size, weight, and cost [6]. Compared to laboratory-based systems, wearable technologies take less setup time since multiple sensors and equipment do not have to be attached to the subject and software applications do not need to be started for every session [84]. However, technical and social challenges exist for wearable mobility monitoring. These challenges include: Privacy and security: Some of the big issues with wearable monitoring system are those of privacy and security, such as eavesdropping, identity spoofing, and redirection of private data to unauthorized persons [85]. Appropriate methods of data encryption can help improve security and privacy. However, developing security and privacy solutions for wireless sensor networks applied to biomedical applications are faced with many obstacles; such as limited resources, fault tolerance, interference and attacks, confidentiality and physical security [86]. Power requirements: For long-term monitoring, a wearable system must last long enough to capture all of the data. However, adding larger batteries creates a trade-off between more power and a small, lightweight wearable system. Another issue is with wireless communication that usually increases the system’s power requirements. Sending processed data instead of raw data could help decrease power consumption, creating a trade-off between communication and data computation [84]. Portability: For continuous and long-term monitoring, wearable systems need to be small, lightweight, and should not interfere with movement. The type of sensors, location of sensors, and transmission characteristics are important factors to consider when designing wearable systems as it could affect the portability [84]. Development of a Wearable Mobility Monitoring System 18 Literature Review Acceptance/adherence: User acceptance is an important determinant of operational feasibility [72]. A potential solution is integrating sensors into devices that people already use, such as mobile phones. As suggested by Lester et al. [87], the mobile phone approach is more likely to have better acceptance and adherence “as these consumer devices do not make them look ‘different’”. A wearable system that is easy to setup and start will improve the acceptance and adherence of the system. Recent technological advances in wireless communications, sensor miniaturization, and smartphone processing power offer great potential in the development of wearable systems for mobility monitoring, and also to overcome some of the challenges related to wearable systems. The following give an overview of technologies that are relevant for this research. 2.3.1 Wireless Body Sensor Network (WBSN) Wireless body sensor networks (WBSN) and wireless body area networks (WBAN) can monitor human behaviour to allow the shift of health assessment from hospitals to the community [85]. Wearable health monitoring systems using technologies of WBSN and WBAN have been introduced in [84, 88-93]. WBSN and WBAN typically consist of one or multiple sensors worn on the body, where the sensors can sample, process, log, and communicate wirelessly to send one or more physiological or environmental parameters to a personal server [84]. Figure 2.7 shows an example of a typical WBAN system architecture for patient monitoring as presented by Jovanov et al. [84]. The first level consists of physiological sensors, second level is the personal server, and the third level is the health care servers and related services. Another example is the WiMoCA from Farella et al. [89] that is a custom-made WBSN where the sensing node consists of a triaxial integrated MEMS (micro-electro-mechanical system) accelerometer. The WiMoCa system’s ability to handle diverse application requirements such as posture detection system, bio-feedback application, and gait analysis, was recently demonstrated by Farella et al. [94]. Development of a Wearable Mobility Monitoring System 19 Literature Review Figure 2.7: Example of a Wireless Body Area Network of intelligent sensors for patient monitoring (reproduced from [84]). 2.3.2 Personal Server The use of a PDA (personal digital assistant), mobile phone, and smartphone as the central node or personal sever in WBSN or WBAN is becoming very popular. PDAs have been used in WBAN for health care monitoring [84, 94] and in context awareness applications [14, 95, 96]. Mobile phone and smartphones (e.g., a mobile phone with advanced functionality [97]) have been used to compile information on a person’s location and health status [98], as well as wireless platforms to monitor mobility and fall incidents for elderly people [99]. Multiple sensors have been integrated in mobile phones allowing monitoring to happen at only one location on the body [87]. This makes it easier to use and less obtrusive to the user. With the constant increase in processing power, allowing for sophisticated real-time data processing, smartphones are a great choice as a central node of WBSN. They also take advantage of the user’s acquaintance with the mobile device [98]. Other advantages are that smartphones and handheld devices are often already integrated with sensors; such as accelerometers, camera, and global positioning system (GPS), which makes them attractive for a fully integrated Development of a Wearable Mobility Monitoring System 20 Literature Review wearable mobility monitoring system. In addition, these devices come with a programming development platform for mobile devices usually based on Java ME (Java Platform, Micro Edition). The portability of Java has made Java ME an attractive platform in mobile medical application [94, 98, 100]. However, Java ME may not be as portable as advertised [101]. As mentioned by Xiaowei et al. [102], the diversity of mobile devices decreases the portability of Java ME applications. Some of the causative factors are the different device features, memory size limitations, function additions and deletions, and device-specific bugs [102]. Custom-made hubs have also been developed for wearable mobility monitoring. Dalton et al. [103] developed a mobility monitoring portable system that included a Global System for Mobile communications (GSM) modem and used short message service (SMS) to send accelerometer data to a remote server for further analysis and data storage. For other monitoring systems that do not use GSM networks, data loss could occur when the system devices are out of range of their receiver station. However, with a GSM modem, Dalton’s system did not suffer from this type of data loss. In the development of their WBAN, Montón et al. [92] designed a personal data processing unit (PDPU) for their hub. Advantages of PDPU are a better control of the device, ability to use the best wireless standards, and elimination of the other applications that a cell phone provides but are not required for the monitoring application. The disadvantages are the resources, time, and money it takes to design such a system. 2.3.3 Wireless Standards Three popular wireless standards are typically used in WBAN design: Bluetooth, ZigBee, and Wi-Fi. These three standards operate in the unlicensed 2.4 GHz spectrum called ISM band (industrial, scientific, and medical band). Another common wireless standard is ultra-wideband (UWB), but it is less popular in the design of WBSN. Table 2.1 summarises the different standards. ZigBee was designed specifically for control and sensor networks. This standard is intended for short-range communication and is characterized by very low power consumption. A ZigBee node can run on batteries for several months or years. Data rate is limited to Development of a Wearable Mobility Monitoring System 21 Literature Review 250Kbps in the global 2.4 GHz spectrum. ZigBee also operates at the 915 MHz (America) and 868 MHz (Europe) spectrum. ZigBee appears to be a promising wireless standard for WBAN [84, 92]. Compared to Bluetooth, ZigBee is less complex and consumes less power. ZigBee is also less prone to interference with other devices in the same frequency range [85]. Table 2.1: Comparison of different features of common wireless technologies [85, 104]). Bluetooth (IEEE 802.15.1) UWB (WiMedia or IEEE 802.15.3) ZigBee Wi-Fi (IEEE 802.11) Days Days Years Hours 6$ 6$ 3$ 9$ Complexity of Mac and physical layer Complex Simple Simple Very Complex Radio spectrum 2.4 GHz 3.1-10.6 GHz 868 MHz, 915 MHz, 2.4 GHz 2.4 GHz Maximum data rate 3 Mbps 1 Gbps 250 Kbps 54 Mbps Network size 7 nodes Unknown 64000 nodes 32 nodes 64, 128 bits 128 bits AES 128 bits AES WEP keys 10m 10m 30m 100m Low-bandwidth cable replacement High-bandwidth cable replacement Low-bandwidth sensors and automation, medical monitoring, home security High-bandwidth applications, sending data over wireless internet Parameters Battery Life Cost per Module Security Range Application Another wireless protocol is IEEE 802.15.3, or UWB. This standard operates in the 3.1 -10.6 GHz frequency band. Because of UWB’s large bandwidth, and since unlicensed and licensed frequencies are covered, UWB systems are constrained in their output power, which in turn limits their range [85]. For applications such as WBSN, this standard was found to be too complex in hardware and protocol. Having a wide bandwidth was also not required for WBSN applications [85]. Development of a Wearable Mobility Monitoring System 22 Literature Review Bluetooth, also known as IEEE 802.15.1 standard, is designed for short-distance and small devices to replace cables between electronic lightweight devices (e.g. mouse, keyboard, and headset). Bluetooth can operate at a range of 10m and up to 100m depending of its class. This standard provides small, low cost, and low power radio modules, and is attractive for its technique of frequency hopping (which increases security and privacy in radio transmissions) [105, 106]. The maximum Bluetooth data rate is approximately 3Mbps [104]. Despite the advantages of ZigBee, Bluetooth is still a commonly used standard in WBAN design due to its present penetration in the market and its related commercial support [98]. Smartphones exclusively use Bluetooth to communicate with external sensors and a Bluetooth Java API (Application Programming Interface) already exists. Wi-Fi is based on the IEEE 802.11 family of standards. The Wi-Fi standard allows a personal server to connect to a WLAN (Wireless Local Area Network). In medical applications, Wi-Fi could be used to send data from a WBAN via the internet to a remote heath care server. Many recent smartphones have this wireless technology. Wi-Fi is usually not a good candidate for communication between sensors and a central node due to the power requirements [85]. A WBAN or WBSN usually requires sensor nodes to be ultra-low power, which implies that signals from stronger sources may interfere with the sensor signal and could result in sensor data loss [85]. 2.3.4 Wearable Sensors Wearable sensors or body-fixed sensors are attached on the body to monitor the person’s kinematics and physiologic parameters, as well as contextual information. Recent technological advances have produced low-cost and miniature sensors, which have created great opportunities in designing a wearable system for health monitoring. Various wearable sensors have been used for tracking human posture and movement. Wong et al. [107] presented five sensor classes in their review: 1) accelerometers, 2) gyroscopes, 3) flexible angular sensor, 4) electromagnetic tracking systems, and 5) sensing fabrics, with accelerometers being the most commonly used. The main types of body-fixed sensors in elderly mobility monitoring were accelerometers, gyroscopes, magnetometers, and pressure sensors or foot switches [108]. Development of a Wearable Mobility Monitoring System 23 Literature Review The following gives an overview of four types of sensors that are the most relevant for mobility monitoring applications. They are accelerometers, gyroscopes, magnetometers, and pressure sensors. Other wearable sensors that are described below are those that could detect contextual information, such as GPS, camera, and ambient sensors. 2.3.4.1 Accelerometers Accelerometers are low-cost, flexible, small devices that offer great potential in human motion detection and other clinical applications. These sensors are the most commonly used wearable sensor in the field of activity recognition [81, 109]. Accelerometers applications include movement classification, physical activity level assessment, metabolic energy expenditure estimation, and assessment of balance, gait, and sit-to-stand transfers [81]. Figure 2.8: Mass-spring system. Many of these applications use a single accelerometer attached to the waist. Accelerometers were suggested to be a suitable tool for long-term monitoring of free-living subjects [81]. Other applications in the rehabilitation field are gait analysis, balance evaluation, fall risk assessment, and mobility monitoring [77, 110, 111]. An accelerometer detects acceleration or deceleration along each of its axes. A system can detect posture by measuring acceleration due to gravity or can detect motion by measuring dynamic acceleration. Different classes of accelerometers exist, but the common sensors for human motion detection are strain gauge, piezoresistive, capacitive, and piezoelectric [111]. Although each class has their own techniques to measure acceleration, the mass-spring system model is often used to describe the mechanism of accelerometers (Figure 2.8). Accelerometers operate under the principle of Hooke’s law (Equation 2.1), and Newton’s 2nd law of motion (Equation 2.2). When the mass-spring is subjected to a compression or stretching force due to movement, the spring generates a restoring force proportional to the amount of compression or stretch. With known values for mass (m) and spring stiffness (k), the resultant acceleration of the mass element can be determined from the displacement (x) characteristics (Equation 2.3). Development of a Wearable Mobility Monitoring System 24 Literature Review F = kx (2.1) F = ma (2.2) a= kx m (2.3) Accelerometer performance may vary between the different classes. Piezoelectric accelerometers use the piezoelectric effect to measure acceleration. The piezoelectric effect generates voltage from mechanically stressing crystals, such as quartz. Accelerometers using this technique typically have higher frequency response than strain-gauge accelerometers, but poor static response. Therefore, piezoelectric accelerometers should not be used to calculate tilt or inclination angle since the gravitational force cannot be measured. However, many human motion applications use piezoresistive accelerometers or variable capacitance accelerometers [81]. These two types are capable of detecting both static and dynamic motion. Another advantage of having a DC response is that the accelerometer can be calibrated with the body segment by rotating the segment around the gravitational axis. However, the DC response adds an offset in the output signal that should be corrected to avoid over or under estimate of the measured acceleration [80]. Variable capacitance accelerometers are typically made of a differential capacitor with their two central plates attached to the moving mass and external fixed plates. Acceleration applied to the mass modifies the distance between the capacitor’s plates, resulting in an output voltage change. The accelerometer output voltage is proportional to the applied acceleration. When using accelerometers to assess movement, their main limitation is that they give no indication of a body segment’s initial conditions, and they are sensitive to gravity. Therefore, additional information regarding segment orientation is needed to measure acceleration accurately [112]. Other limitations include the relative movement of the accelerometer against the body and signal drift over time [80, 112]. Calibration methods should be considered to correct for the drifts. Development of a Wearable Mobility Monitoring System 25 Literature Review 2.3.4.2 Gyroscope Gyroscopes sensors can measure angular rotation of body segments, when attached to the segment with their axis parallel to the segment axis. Gyroscopes that use a vibrating mechanical element to sense angular velocity have been used in mobility assessment applications [108]. These sensors can measure transitions between postures by measuring the Coriolis acceleration from rotational angular velocity. Unlike the accelerometer, gravitational acceleration has no effect on gyroscopes. Gyroscopes are often combined with accelerometers in human motion studies. Some recent examples of their applications are in recording of human body segment orientation [113], identification of gait event for drop foot [114], calculation of 3D knee joint angles [115], and also in the detection of pre-falls [116]. The drawbacks of vibrating element gyroscopes are power consumption, price, drift, and sensitivity to shock [109]. 2.3.4.3 Magnetometer Magnetometers can be used to measure a change in rotation of the body segment with respect to the earth’s magnetic field. The basic principle of these sensors corresponds to the magneto-resistive effect, which is the property to change the resistance with a change in magnetic induction. Magnetometer sensors are sometimes combined with inertial sensors (gyroscope and accelerometer) to correct gyroscopes drift about the vertical axis [117]. However, a drawback of magnetometers is their sensitivity to nearby iron and local magnetic fields. Magnetometers also need to be calibrated for any change of location [109]. 2.3.4.4 Foot Pressure Pressure sensors or foot switches can be used to measure gait temporal parameters when attached to the sole [118]. The pressure is measured from the force/deformation properties of a specific material. For instance, the deformation caused by pressure can be measured from capacitance and resistance changes, where both decrease with compression. Another example is piezoelectric polymers that generate more charge with compression [119]. Their applicability in pathological gait is limited by many problems, including the inability to measure shear forces, calibration issues (sensors change calibration when bent or Development of a Wearable Mobility Monitoring System 26 Literature Review due to temperature effects), difficulty with sensor positioning and to connect attachments, mechanical failure, and subject acceptance [109]. 2.3.4.5 GPS The global positioning system, or GPS, consists of a constellation of 24 satellites (plus 6 spare ones) orbiting the earth and continuously sending signals to ground stations. A GPS receiver will detect several GPS satellite signals and will calculate how far they are by comparing the time the signal was sent from the satellite and the time the signal was received. Using the triangulation principle, a user’s location on earth can be determined. GPS works anywhere on earth, any time and no subscription fee or setup charge is required to use GPS services. However, the performance of GPS receivers is reduced during situation where their view of the sky is obstructed (e.g., indoors, close to tall building, cloudy). Determining the speed of displacement from a GPS receiver is usually based on the Doppler Effect, which is the measurement of the rate of change in the satellite’s signal frequency caused by the movement of the GPS receiver. The speed of displacement can also be calculated by the change of distance divided by the change of time, but it is usually less accurate than using the Doppler Effect [120]. Many mobility monitoring studies have used GPS systems. For human locomotion, nondifferential GPS receivers can provide accurate speed, displacement, and position information [120]. GPS was recently found to potentially provide valid information on walking capacity in patients with peripheral arterial disease [121]. In human tracking, GPS technology offers a great opportunity to help understanding how environmental factors can influence a person’s mobility. Frank and Patla [17] proposed a mobility envelope measured from excursions in the community over a week as a potential outcome measure for mobility. Frank and Patla’s mobility envelope is the length of the outer perimeter of spatial excursions made by the individual during the assessment period. The mobility envelope was found to be smaller for a frail individual compare to a healthy individual. GPS receivers can also be used to complement accelerometer data, by providing the locations where physical activity occurs [8] and also to help better recognize activities [122]. Development of a Wearable Mobility Monitoring System 27 Literature Review Many smartphones and mobile phones are now integrated with GPS receivers, which offer a feasible way to collect location information for contextual health research. Using the GPSenabled BlackBerry 7520, Wiehe et al. [123] tracked adolescent travel patterns and gathered daily diary GPS data. MacLellan et al. [124] used a smartphone, GPS receiver, and the activPal [79] in order to help people to examine their activity pattern and potentially provide indications where environmental barriers could occur. GPS was found to be a promising tool to characterize exposure to social and physical environments in studies of older adults living in diverse communities [125]. Other GPS applications are in wearable activity recognition systems to help detecting more types of activity, such as cycling outdoors [5]. Also, GPS can be used in life log applications [12] and to annotate text notes and photos to location in mobile phones [126]. Despite all the advantages and uses of GPS, some limitations exist when recording positions for indoor, and for some outdoor environments, such as under heavy tree canopy and in dense urban areas [8]. GPS accuracy may vary based on atmospheric conditions as well as from signal deflection or obstruction. GPS was also found to be unable to detect static activity [127]. 2.3.4.6 Camera Many cell phones and smartphones include a digital camera. Applications that have used cameras in a wearable system are mostly for life log or diary purposes. A wearable system to capture audio and visual information corresponding to user experiences was presented in [128]. Yamazoe et al.’s system is worn below chest level and consists of a headdetection camera, a wide-angle camera, a microphone, and possibly GPS. A method to extract meaningful context from life logs and a smartphone was proposed by Lee and Cho [12]. The life logs included GPS, SMS, call, charging, MP3, photos taken, images viewed, and weather information. SenseCam from Microsoft Research (Microsoft Corporation) [129] is an example of a wearable digital camera that takes pictures without the user intervention (Figure 2.9). The camera contains different sensors such as light-intensity and light-color sensors, a passive Development of a Wearable Mobility Monitoring System 28 Literature Review infrared detector, temperature sensor, and accelerometers. Pictures are taken based on significant changes measured by the sensors and/or at specific time interval. Microsoft Research has also explored the use of audio level detection, audio recording, and GPS location. The camera can take up to 3000 images per day. A recent study proposed an automatic event segmentation method for the Figure 2.9: SenseCam images [129]. SenseCam, using content and contextual information [130]. SenseCam has been particularly explored for its memory aid application [131-133]. A list of publications related to SenseCam is presented on the Microsoft research website [129]. In research applications, video cameras are often used to validate other mobility assessment methods. For instance, participants have been videotaped during community excursions to validate self-report mobility tools [61]. 2.3.4.7 Ambient Sensors Ambient sensors are sensors that can measure different properties related to the surrounding conditions and environments. Light, humidity, temperature, acoustic, and barometric pressure sensors are example of ambient sensors. These sensors are used in context awareness systems to add more information about the context that can help to better identify location and recognize activity [14, 15]. Light sensors such as photodiodes, color sensors, IR, and UV sensors can help differentiate between indoors and outdoors. Temperature and humidity sensors can help detect weather characteristics, such as raining or cold, and differentiate between indoor and outdoor activities. 2.3.5 Context Awareness A context-aware system was defined by Dey and Abowd [134] as a system that “uses context to provide relevant information and/or services to the user, where relevancy depends on the user’s task” and “any information that can be used to characterize the situation of an Development of a Wearable Mobility Monitoring System 29 Literature Review entity. An entity is a person, place, or object that is considered relevant to the interaction between a user and an application, including the user and application themselves”. In other words, context-aware systems could monitor a user’s activity, location and physiological parameters, and ambient conditions. Then the system could adapt its behaviour based on the information. Context-awareness wearable systems have been used in activity and location recognition [12, 14, 15], in health pervasive environments [135], and in recognizing emergency situations by distinguish user motion states [13]. Many context-awareness approaches related to activity recognition use multiple sensors to recognize a wide range of activities. However, they also need more complex classification approaches, such as artificial neural networks, Bayesian networks, and hidden Markov models [136]. 2.3.6 Summary of Wearable Systems In mobility monitoring, a wearable system worn on the body can be used to continuously monitor biomechanical parameters regardless of the user’s location. Many social and technical challenges exist with wearable systems, such as privacy and security, power requirements, portability, acceptance, and adherence. Recent technological advances in wireless communications, sensor miniaturization, and smartphone processing power could help overcome some of these challenges and offer great potential in the development of wearable systems for mobility monitoring. Research in the field of wireless body sensor networks (WBSN) and wireless body area networks (WBAN) could allow healthcare to be delivered outside the hospital (i.e., at the patient’s home and in the community) [84, 94]. The hub or personal server of a WBSN or WBAN could be a PDA, mobile and smartphone, or custom-made hub. Smartphones are particularly attractive in the development of wearable systems due to their increasing processing power, effective display and user interface, and features such as GPS, accelerometers, and camera. Wearable system using smartphones may also improve the user acceptance. Development of a Wearable Mobility Monitoring System 30 Literature Review Advances in wireless technology could allow wearable systems to eliminate the use of cables. Wireless wearable systems could be more comfortable to wear, less obtrusive, and less encumbering with the user’s movement [85]. Many smartphones are equipped with wireless technologies such as Bluetooth to communicate between sensors and phones, and Wi-Fi to communicate with an external server via the internet [84, 137]. Commonly used wearable sensors for mobility monitoring are accelerometers, gyroscope, magnetometer, and foot switches, with accelerometers being the most commonly used. These sensors have been explored by many in applications such as movement classification, activity recognition, assessment of balance, gait and transitions, and fall detection. However, many of these studies are missing environmental or contextual information related to the user’s activities [5, 7, 9, 10, 110]. Other studies have used GPS to monitor mobility or travelling patterns in the community [17, 123], but details on the type of activities performed were not considered. GPS is also used to complement motion data and improve activity recognition [5, 8]. GPS can provide contextual information, such as location, but its accuracy depends of the number of satellites it can detect. GPS typically does not work indoors. Other context information, such as light, temperature, and sounds, provides contextawareness for wearable systems. Context-aware wearable systems used context information to better recognize activities [12-15], but the environmental characteristics in which activities took place were not analyzed for their impact on mobility. A camera is an interesting sensor to include in a wearable system since a picture or video can give information on the user’s surroundings. Studies that used camera, GPS, and other context data are mostly oriented to life log applications [12, 130]. To the best of our knowledge, the use of a camera in a wearable system to capture the context in which activities take place and to analyze mobility in the community has not yet been explored. 2.4 Data Analysis Algorithms As previously mentioned, accelerometers are the most used wearable sensor to detect activity and to measure mobility. Many researchers have already explored algorithms and data analysis techniques to extract useful information from the raw acceleration data and to Development of a Wearable Mobility Monitoring System 31 Literature Review classify activities. A review from Godfrey et al. [77] highlighted laboratory and clinical studies using accelerometers (Table 2.2). As mentioned by Mathie et al. [81], the output of an accelerometer when worn on the body will vary depending on four factors: 1) Position at which it is placed 2) Its orientation relative to the subject 3) The posture of the subject 4) The activity being performed by the subject The following sections review concepts and techniques applied to accelerometers to detect human body activity. These sections focus on sensor placement and specifications, data calibration, filtering, windowing, feature extractions, and classification algorithms. 2.4.1 Accelerometer Placement An accelerometer’s location and its orientation relative to the body will affect the way its output signal will vary. Deciding on the accelerometer placement on the body is important in human motion measurement. Normally, the sensor is attached to the body part whose movement is being studied [81]. Accelerometers have been attached to different parts of the body and in various numbers depending of the application. In studies using a single location to study whole body movement, the sensor is usually placed as close as possible to the center of mass (e.g. trunk, under arm, waist). One reason for this placement is that the body parts in that region move during most daily activities [80]. Bouten et al. [80] studied accelerometer placement at the trunk for physical activity assessment. Studies by Sekine et al. [138, 139] demonstrated that walking on level ground and walking on stairways could be distinguished with a single waist-mounted accelerometer. Work from Mathie et al. [7, 140] and Karantonis et al. [9] showed that, with only a waistmounted triaxial accelerometer, it is possible to detect between periods of rest and activity and also to identify postural orientation, falls, and estimate energy expenditure. Using a twoaxis accelerometer worn at the waist, Baek et al. [141] was able to obtain an overall Development of a Wearable Mobility Monitoring System 32 Literature Review classification rate of 97.5% for activities; such as standing, sitting, lying, walking, running, upstairs and downstairs. The discrimination of falls from activity of daily living using a single triaxial accelerometer worn at the trunk was successfully (100%) demonstrated by Bourke et al. [142]. A wearable surveillance system developed by Yoshida et al. [143] for detection of various posture, falls and gait disabilities, used triaxial acceleration data taken at the abdominal level. Wearing a single sensor at other locations rather than the center of mass region has been explored as well. For example, one sensor on the thigh has been used to study leg movement during walking [144, 145], a triaxial accelerometer placed on the dorsum of the hand has recently been studied for the evaluation of Parkinson disease [146]. Accelerometers placed at multiple locations on the body have also been used in many studies (Table 2.2). One common configuration is having one accelerometer placed on the chest or trunk and one on the thigh. This configuration has demonstrated capability in detecting sitting, standing, and lying, and in detecting walking and postural transitions [147-150]. Development of a Wearable Mobility Monitoring System 33 Development of a Wearable Mobility Monitoring System Table 2.2: Example of laboratory and clinical studies using accelerometers for movement and mobility analysis. List modified from Godfrey et al. [77]. Year Author #Sensor placement Detection success Motivation and activity recognition Signal processing and algorithm Vetlink et al. [147] 1 sternum, 1 thigh Visual detection (errors 20% some cases) Physical Activity (PA): static/dynamic activities, stand, sit, lying supine, walking, cycling, ascending/descending stairs, speed of activity Threshold, mean values, standard deviation, signal morphology (correlations), cycle times 1997 Bouten et al. [80] 1 waist, lower back Correlations (r=0.77 and 0.89) for IMAtot and EEact PA: bench test of device, correlation of activities of daily living (dressing, walk, lie, desk work, etc.) in respiration chamber to monitor output Time integrals from separate measurement direction (IMAtot) versus energy expenditure due to physical activity (EE act, chamber), mean, std deviation, FFTs 1998 Bussmann et al. [151] 2 upper legs, 2 sternum, HR 88% spontaneous, 96% standard (video to monitor) Psychophysiological study in the young, static/dynamic activities, 40 activity protocols (sit, lie, stand, walk + variations, etc.), Electrocardiogram (ECG) Threshold, video analysis, 1 second resolutions, psychophysiological effect of benzodiazepines 1999 Foerster et al. [152] 1 sternum, 1 wrist, 1 upper thigh, 1lower leg, HR 95% posture, 67% ambulation Ambulatory monitoring: retests, 9 postures (lab ref of sit, lie, walk, stairs, etc), recording in real world vs. observer, speech activity and heart rate Measured vs. observed readings (L1 distances, standard deviations), resolutions of > 20s and > 40s 2000 Yoshida et al.[153] 1 centre of abdomen Visual detection PA: 11 postures (e.g., lying left, right, supine and prone) Rectified and integrate output of accelerometer. Activity obtained from addition of integrated outputs for 1 minute. 2000 Najafi et al. [154] 1 chest (gyroscopes +accelerometer) 99% postural transition, >90% lie/walk Postures, posture transitions (gyroscope), walking periods Discrete wavelet transform (DWT), optical reference system (Vicon) Literature Review 34 1996 Development of a Wearable Mobility Monitoring System Mathie et al. [7] 1 front of waist Sensitivity 0.98, specificity 0.880.94 Activity of daily living (ADL): 11 discrete dynamic activities (sit-to-stand, stand-to-sit, walk), 12 distinct rest periods (stand, sit) Various length of median filter, window widths and thresholds, mean, energy expenditure (integral area) 2003 Najafi et al. [155] 1 chest Postural transition 99%, average sensitivity and specificity 94% and 95% Sitting, standing, lying, walking, postural transitions (gyroscope) Wavelet transform ( DWT), thresholds, visual observation 2004 Bao et al [156] 1 wrist, 1 waist, 1 upper arm, 1 thigh, 1 leg Ranging from 41.42% to 97.49% Walking, sit and relax, stand, watch television, run, stretch, scrubbing, fold laundry, brush teeth, ride elevator, walk +carry, read, cycle, climb stairs, vacuuming, lie down, strength training, etc. Mean, energy, frequency domain entropy, correlation of acceleration data, classifiers: C4.5 decision tree, decision table, naïve Bayers classifier, instance based learning (IBL) 2004 Luinge et al. [157] 1 upper back, 1 pelvis 98% Posture: inclination of trunk and pelvis Kalman filtering, optical reference system (Vicon) 2004 Lyons et al. [149] 1 sternum, 1 upper thigh Sit 93%, stand 95%, lying 84% Posture and movement detection: static and dynamic activities, postures (sit, lie, stand) Best-estimate/mid-point thresholds, mean, standard deviation, observed comparison (1 minute resolution) 2004 Baek et al [141] 1 waist 97.5% Activity: retest, standing, sitting, lying back/on, walking, running, upstairs, downstairs Mean, standard deviation, skewness, kurtosis, eccentricity, histograms, neural networks 2004 Culhane et al. [148] 1 chest, 1 thigh >92% Mobility monitoring of elderly in clinical environment (stroke patient); sit, stand, lying, postures. Means and standard deviations, thresholding (best estimate and mid-point), comparison with manual recordings, of patient activity 35 Literature Review 2003 Development of a Wearable Mobility Monitoring System Barralon et al. [158] 1 chest (under arm pit) Walk 76%, postures 80% Postural states, walking, postural transitions Angles/inclinations, frequency analysis (FFT, thresholds, video) 2006 Barralon et al. [159] 1 under left arm pit DWT* 78.5% sensitivity, 67.7% specificity Six methods for walking periods Video analysis, thresholds applied/not to: short time Fourier transform (StFTT, StFTT/Tb), discrete wavelet transform (DWT, DWT*), continuous wavelet transform (CWT, CWT*) (*less coefficients) 2006 NiScanaill et al. [150] 1 trunk, 1 thigh Remote sensor for home care: sit, stand, lie, walk Means, thresholds, SMS message on GSM network 2006 Hester et al. [160] 1 wrist, 1 ankle, 1 walking stick Sensitivity 95%, specificity >95% Stroke patients: Motor tasks at homeassessment of mobility assistive devices (cane) (accelerometers+gyroscopes) Dominant frequencies, energy aspects, cross-correlations, autocovariance’s, Neural Network(NN), threshold, wireless transmission 2006 Parkka et al. [161] 1 wrist, 1 chest CDT 82%, ADT 86%, NN 82% Lie, row, cycling, sit/stand, run, Nordic walk, walk (includes heat rate, ECG, SaO2, skin temperature, skin resistance, light intensity, compass, audio, GPS and altitude sensors) Mean, variance, median, skewness, kurtosis, percentiles, spectral centroid/spread, peak frequencies, power, power in frequency bands, custom decision trees (CDT), automatically generated decision tree (ADT), and neural network (NN). 2006 Karantonis et al. [9] 1 waist Overall 90.8% (posture 94.1%, walk 83.3%, possible falls 95%) Ambulatory monitoring: activity (12 tasks), rest, posture, walking, falls, estimation of metabolic energy FFT, normalised signal magnitude area (SMA), signal magnitude vector (SMV), threshold 36 Literature Review 2005 Literature Review 2.4.2 Frequency and Amplitude Accelerations produced by human movement vary across the body, and depend on the activity being performed. Acceleration amplitude decreases from ankle to head, with the greatest amplitude found in the vertical direction [162]. During walking and running, Bhattacharya et al. [162] found that acceleration amplitude could reach 12g at the ankle, 5g at the lower back, and 4g at the head (g = acceleration due to gravity). When selecting an accelerometer for human movement studies, the choice of the accelerometer amplitude range should be based on the type of activity being studied and the location of the sensor. Ermes et al. [5] found that an accelerometer of range ± 2g was insufficient for detecting vigorous exercises; therefore, they had to use an accelerometer of range ±10g instead. However, a larger range of acceleration results in a decrease in signal resolution, but this decrease had a negligible effect on the signal features in Ermes et al.’s study. During different walking speeds (0.99 to 2.35 m/s), the acceleration frequency spectra measured at the head, shoulder, and pelvis was between 0.75 to 4.8 Hz [163]. These results from Cappozzo also demonstrated that the maximum frequencies measured, increased from head to ankle, and were the greatest in the vertical direction. A study by Antonsson and Mann [164] found that in foot acceleration measurement during walking, 98% of the frequency spectra were less than 10 Hz and 99% were less than 15 Hz. The major energy band caused by daily activities was found by Sun and Hill to be between 0.3 to 3.5 Hz [165]. Many studies related to the measurement of frequency and amplitude spectra of human body accelerations, including the ones in the above, were reviewed by Bouten et al. [80] to determine the appropriate specifications to use for their accelerometer. For daily activity assessment, Bouten et al. concluded that body-fixed accelerometers placed at the waist must be able to measure acceleration with amplitude ranging from -6 to +6 g and frequencies up to 20 Hz. 2.4.3 Calibration Accelerometer calibration is usually required to correct for DC offset and signal drift. Having a DC component in the signal allows for easier calibration of the sensor. One simple Development of a Wearable Mobility Monitoring System 37 Literature Review calibration method is based on rotation of the sensor to known angles. For example, under static conditions, if the axis of interest is pointed towards the center of the Earth, the output should equal 1g. If the axis is then rotated by 180 degrees, its output should equal -1g. This ±1g rotation method is often suggested by manufacturers to calculate the sensitivity s of a particular axis of the sensor [166]: s= (u max − u min ) 2 (2.4) The offset o can also be corrected using a similar equation: o= (u max + u min ) 2 (2.5) Where umax and umin are the maximum and minimum acceleration measured during the rotation between ±1g. The output a of one accelerometer can then be expressed as: a= (u − o) s (2.6) where u is the un-calibrated acceleration. However, this calibration method requires input from the user and should be performed in a controlled environment. Therefore, autocalibration procedures have been developed where a specific angular rotation is not required. These auto-calibration methods are based on the fact that the modulus of the acceleration signal during quasi-static movement is equal to g = 9.81 m/s2. For a triaxial accelerometer, this concept can be expressed as: a x2 + a y2 + a z2 = 1g (2.7) By replacing the three accelerations ax, ay, and az with Equation 2.6, Equation 2.7 can be rewritten as: Development of a Wearable Mobility Monitoring System 38 Literature Review u x − ox sx 2 u y − oy + sy 2 u z − oz + s z 2 = 1g (2.8) This concept was used by Lotters et al. [167] to create a method for calibrating the sensitivity and the offset of a triaxial accelerometer while in use. The method calculated six elements ( s x , s y , s z , o x , o y , o z ) after detecting quasi-static state, and only required random movements to be performed. Another example is an on-the-field auto-calibration procedure created by Frosio et al. [168]. Frosio et al.’s calibration model incorporated the bias (offset) ( o x , o y , o z ) and scale factor (sensitivity) for each axis ( s xx , s yy , s zz ) and the cross-axis symmetrical scale factors ( s xy , s xz , s yz ). The cross-axis scale factors describe two-axis misalignment and crosstalk between channels, caused by the sensor electronics [169]. This method of using nine elements resulted in higher accuracy than both the factory calibration and the six elements model [168]. The choice of calibration method depends of the type of application. When an application needs to estimate the distance traveled from double integration of the acceleration signal, the error from offset drift may cause the position measurement to diverge in just a few seconds [170]. A drift correction technique was studied by Yun et al. [170] where the drift was corrected by detecting periods where velocity is zero (i.e. stance phase during walking). Finally, in other cases, the application may only require an offset removal at the start of a data measurement session [148]. 2.4.4 Filtering Techniques The output signal of an accelerometer worn on the body is composed of the acceleration due to body movement, gravitational acceleration, and noise. Undesirable accelerations could come from external vibration such as vehicle’s acceleration, bouncing of the sensor against objects, jolting of the sensor caused by loose attachment, etc. [80]. If the frequency range of the noise does not interfere with human body acceleration, filtering techniques could attenuate the noise in the accelerometer’s output signal [80]. For example, Development of a Wearable Mobility Monitoring System 39 Literature Review Bouten et al. [80] used a 20 Hz low pass filter to attenuate frequencies not expected to be caused by body movement. Another common filtering technique such as used by Mathie et al. [7] is applying a median (low-pass) filter to the signal to remove noise spikes. Digital filtering techniques can be used to separate gravitational acceleration from the body movement acceleration. Since human movement will never correspond to a DC response, it is important to remove the DC offset from the accelerometer output; otherwise, the measured acceleration could over or underestimate the body movement acceleration [80]. Since most daily activity movements appear between 0.3 to 3.5 Hz [165], filters use a cut-off frequency between 0.1 to 0.5 Hz [81]. The DC component of the acceleration signal can also be represented by the mean of the acceleration over a certain window [156]. 2.4.5 Data Window In an activity classification system, acceleration signals are usually divided into smaller time segments or windows prior to feature extraction. The feature set generated from each window can then be used as input to a classification algorithm. Preece et al. [171] found three windowing techniques that have been used for activity identification: sliding windows, event-defined windows, and activity-defined windows. The sliding windows technique divides the signal into small windows of the same length with no gap in-between, with the option to overlap windows. The sliding-window technique is one of the most used approaches in activity classification studies because of its simplicity [171]. Additionally, pre-processing of the sensor signal is not required with the sliding-window technique, making this approach effective for real-time applications [171]. A non-overlapping window of approximately one second has often been used to detect static and dynamic states, identify postures and postural transitions, identify activities, and detect falls [5, 9, 148, 149]. Furthermore, Mathie et al. [7] found that the optimal size was between 0.8 to 1.4 seconds for such classification systems. However, windows of different sizes and degree of overlap have been successful, such as non-overlapping 2 seconds window by Baek et al. [141], a 50% overlapping window of 5.12 seconds by Ravi et al. [96], and a 6.12 seconds window by Bao and Intille [156]. An advantage of having a larger window is that Development of a Wearable Mobility Monitoring System 40 Literature Review cyclic information could be captured for activities such as walking, running, and climbing stairs. The event-defined windows method needs pre-processing to detect specific events, for instance heel strike or toe off [171]. The windows are defined from the timing of these events; therefore, window length may vary depending on the location of the events in the signal. An example of a study detecting heel strike and toe off events is the one by Aminian et al. [145] where event timing was used to estimate temporal parameters of a gait cycle. More examples of event-defined window studies have been presented in Preece et al. [171]. The activity-defined window [171] technique detects the time when activity changes, and from these times data windows are identified. Every window corresponds to a specific activity. For example, Sekine et al. [139] used wavelet analysis to detect the time when changes in walking pattern occurred. These times were then used to classify walking pattern, such as walking on level ground or ascending and descending stairs. 2.4.6 Feature Extraction Many different features can be extracted from an accelerometer signal and then used as inputs to classification algorithms. Preece et al. [171] presented different feature generation techniques applied to body-worn sensor data in the field of activity classification, including heuristic features, time-domain features, frequency-domain features, and timefrequency domain. The following presents feature extraction techniques that have been applied to accelerometer data. The term “heuristics features” is referred by Preece et al. [171] as “the features which have been derived from a fundamental and often intuitive understanding of how a specific movement or posture will produce a characteristic body-worn sensor signal”. The first example is extracting the inclination angle from the DC or static component of an accelerometer signal. The inclination angle represents the orientation of the segment with respect to the gravitational field as illustrated in Figure 2.10. The inclination angle φ2 can be calculated using Equation 2.9: Development of a Wearable Mobility Monitoring System 41 Literature Review ϕ 2 = − cos −1 ( au ) g (2.9) where au is the measured acceleration and g the gravitational acceleration (9.81 m/s2). This feature has been used to detect postures [9, 147-149] and also to identify postural transition [155]. However, the technique presented in Figure 2.10 and Equation 2.9 only uses one axis for the angle calculation and is subject to resolution problems when the measured acceleration is near +1g or -1 g [172]. The one axis technique only allows for a 180-degree range. To fix the resolution and range problem, Freescale Semiconductor [172] described a method of calculating inclination angle using two axes (Figure 2.11). Using basic trigonometry, the acceleration in the x-axis can be expressed with the following equation: AX = sin(θ ) (2.10) Similarly, the acceleration in the y-axis can be expressed with the following equation: AY = cos(θ ) (2.11) then by combining Equation 2.10 and 2.11, the following equation is obtained: AX = tan(θ ) AY (2.12) With the two axes technique, a 360-degree range can be measured using the sign of the acceleration of both x and y-axis. From the sign of the accelerations, the quadrant in which the tilt occurred can be identified and the proper tilt angle can be determined. Development of a Wearable Mobility Monitoring System 42 Literature Review v Figure 2.10: Seismic uniaxial accelerometer measuring the component a u u of an equivalent v acceleration a eq in the direction u of the sensitive axis of the accelerometer. The equivalent v acceleration is the sum of the acceleration a of the sensor and the equivalent gravitational v acceleration g acting on the seismic mass. ϕ1 is the angle between the sensitive axis of the v accelerometer and the acceleration a ; ϕ 2 is the angle between the sensitive axis and the gravitational field (reproduced from [147]). Figure 2.11: Dual- or tri-axis accelerometer with two axes for measuring tilt (reproduced from [172]). Another example of heuristic features is the signal magnitude area (SMA) of the acceleration signal. This feature is extracted from the AC or dynamic component of the acceleration signal. SMA has been used to estimate the energy expenditure (EE) of physical activity and to quantify the acceleration amplitude. The relationship between SMA of a triaxial accelerometer signal and EE has been demonstrated by Bouten et al. [80]. SMA was further used to discriminate between rest and activity periods in similar studies such as Mathie et al. Development of a Wearable Mobility Monitoring System 43 Literature Review [7] and Karantonis et al. [9]. Equation 2.13 represents the normalized SMA used by Mathie et al. [7] and Karantonis et al. [9]: T T 1 T SMA = ∫ | a x |dt + ∫ | a y |dt + ∫ | a z |dt t = 0 t = 0 t =0 t (2.13) Since the amplitude and duration of the acceleration signal vary depending on the type of activity, between subjects, and even for the same subject and activity, calculating SMA is a good way to capture both amplitude and duration effects [7]. Bourke et al. [142] studied fall detections from a triaxial accelerometer worn at the chest. The resultant or root sum of square (RSS) of the accelerometer signal was calculated (Equation 2.14) and compared to a threshold to detect falling with 100% success for 240 falls. RSS = a x2 + a y2 + a z2 (2.14) Bourke et al. [173] also examined vertical velocity for pre-impact detection of fall. The vertical velocity was calculated from the integration of the vertical acceleration during static and dynamic periods. Bourke et al.’s method was able to detect pre-impact of falls (before trunk and knee touch the ground) with an average lead-time of 323ms. The next sub-category as identified by Preece et al. [171] is time-domain features, which are typically statistic features. For example, Veltink et al. [147] calculated the standard deviation of an accelerometer signal to differentiate between static and dynamic movement. To distinguish between different dynamic activities, Veltink et al. also examined the signal morphology (correlations), mean, standard deviation, and cycle time. Other statistic features are skewness, kurtosis, and eccentricity of the accelerometer signal, which have been used by Baek et al. [141] to discriminate between walking, running, and walking up/down stairs. Percentiles of the acceleration signals have also been used by Maurer et al. [15] for similar applications. Development of a Wearable Mobility Monitoring System 44 Literature Review Differentiation among activities that involve translation in just one dimension could be done by calculating the correlation of the accelerometer signal for each pair of axes, such as presented by Ravi et al. [96]. For example, walking and running can be distinguished from stair climbing using correlation. Walking and running usually involve translation in one dimension whereas climbing involves translation in more than one dimension. The correlation of the accelerometer signal corresponds to the ratio of the covariance and the product of the standard deviations (Equation 2.15): Corr ( x, y ) = cov( x, y ) (2.15) σ xσ y Despite the processing time efficiency of using time-domain features, they do not give information on the cyclic behaviour of the acceleration signal caused by dynamic activities (e.g. walking, running). Therefore, recent studies have used frequency-domain features. To generate these features, the signal must first be converted into the frequency-domain. A common technique used for this conversion is the Fast Fourier Transform (FFT). The FFT compares a family of sine functions at harmonically related frequencies by multiplying the waveform with sinusoidal functions and then averaging. From the FFT output, Bao and Intille [156] extracted the energy (sum of the squared FFT coefficient) and the frequencydomain entropy (normalized information entropy of the FFT components). The dominant frequencies in the signal have also been observed by Barralon et al. [158] and Hester et al. [160]. Frequency-domain features give information about the frequency components contained in a signal; however, they do not provide the time at which those components occurred. Information on signal time and frequency content is important in signal analyses where frequency changes over time (e.g., human movement). Using wavelet analysis, timefrequency features can be used to investigate both time and frequency characteristics. Similar to the Fourier transform, the use of wavelets also requires signal decomposition into simple elements but it is more efficient than the Fourier transform for signals dominated by transient behaviour or discontinuities, such as human movement [155]. Wavelet transforms also use simple basis functions instead of a sinusoidal signal. A variety of time-frequency Development of a Wearable Mobility Monitoring System 45 Literature Review features using wavelet transform is presented in Preece et al. [171, 174] . Preece et al. [174] found that wavelet analysis was not as accurate as the frequency-domain features for classifying dynamic activities, although wavelet analysis can be used to characterize nonstationary signals. 2.4.7 Activity Classification After features have been extracted from the accelerometer signals, they can be used as input for activity classification algorithms. The following presents classification algorithms that have been used in activity identification. Thresholds are one of the simplest methods to extract activity information from the accelerometer signals. Signal properties or features (e.g., mean, standard deviation, vertical velocity) are compared with thresholds to determine if a particular activity is present in the data window. For example, static and dynamic movement can be distinguished by comparing the signal’s standard deviation with a threshold value, as demonstrated by Veltink et al. [147] and Mathie et al. [7]. Threshold methods applied to inclination angle can also detect different postures, as shown in the studies by Cuhrane et al. [148] and Najafi et al. [155]. Fall detection has also been studied by Bourke et al. [142] where heuristic features were used with thresholds. Threshold methods are often chosen for real-time processing applications to be performed by low memory and low processing capability devices, such as microcontroller embedded portable units [9]. Classification systems using a hierarchical approach are very popular. A hierarchical decision tree starts with a top level broad classification (e.g. rest and active) followed by more detailed sub-classifications at lower levels. The nodes of the tree are where questions are asked and the nodes are connected to other nodes through links (branches). Mathie et al. [175] developed a generic framework (Figure 2.12) using a binary tree structure to classify movements from a single triaxial waist accelerometer. The advantage of Mathie et al.’s framework was its flexibility to allow nodes to be added, removed, and reordered without affecting the rest of the tree. When applied to the classification of specific movements (e.g. upright, lying, sit-to-stand, stand-to-sit transitions, walking and fall) performed in a controlled laboratory setting, this generic classification framework demonstrated an average Development of a Wearable Mobility Monitoring System 46 Literature Review classification performance of 97.7% for sensitivity and 98.7% for specificity [175]. This classification was well suited for real-time applications because it did not require a large amount of computational power. This was shown by Karantonis et al. [9] who implemented a simpler version of Mathie’s algorithm to create a real-time human movement classification system. A similar approach to hierarchical classification is the decision tree. The difference is that decision trees are automatically generated. Automatic generation of decision trees can be done using popular algorithms such as CART (classification and regression tree), ID3 (iterative dichotomiser 3), and C4.5 [77]. These techniques require training data to generate the decision tree. Bao and Intille [156] have compared different classifiers such as decision tables, instance based-learning, C4.5, and naïve bayes. C4.5 had the best overall recognition accuracy of 84% for the detection of 20 daily activities. The custom decision tree, automatic generated tree (CART), and neural network were explored by Parkka et al. [161]. The custom decision tree had the best classification results in recognizing most activities, except walking and biking, but overall the automatic decision tree had a better result (total of 86% compared to 82% for custom tree, and 82% for neural network). The k-nearest neighbour approach for classifying activity was first used by Foester et al. [152]. With the k-nearest neighbour, a feature space is created from training data points. Each data point corresponds to a particular activity. An unknown window of sensor data can be classified by finding which training data point is the closest in the feature space. Although this method could detect a wide range of different activities, the execution time is slower than the decision tree [171]. In addition, in the study by Bao and Intille, the k-nearest neighbour obtained lower recognition accuracy than the decision tree approach. Lau et al. [176] demonstrated the high performance and consistency of the support vector machine (SVM) to classify different walking conditions using accelerometer and gyroscope sensors. Preece et al. [171] found that, although SVM method was a powerful classification method, few activity classification studies have used that approach. Classification system using SVM could also be slow to train. Development of a Wearable Mobility Monitoring System 47 Literature Review Figure 2.12: Generic classification framework presented by Mathie et al. [175]. Research studies have also used artificial neural networks to recognize activity, such as Wang et al. [177] and Yang et al. [178]. An artificial neural network is a mathematical model based on the biological neural network. It consists of inputs and outputs with a processing layer or hidden layer in between [77]. Artificial neural networks are complex and required previous training data. Research studies have also used naïve bayes classifiers to recognize activity from accelerometer data [96, 156]. This type of classifier assumes that all attributes of the variables class are independent and learns, from training data, the probability of each attribute [77]. Fuzzy logic is another example of a classification technique that provides a way to arrive at a specific conclusion based upon vague, ambiguous, imprecise, noisy, or missing input information [179]. Recently Chen et al. [180] demonstrated that a classifier based on a fuzzy basic function was able to recognize different human daily activities using a tri-axial Development of a Wearable Mobility Monitoring System 48 Literature Review accelerometer with a performance of 93% accuracy. In a context awareness system, Jin et al. [13] used fuzzy logic to detect user motion states such as lying, sitting, walking and running with a recognition rate of 98.9%, 98.9%, 99.7% and 99.9% respectively. Emergency situations, such as falling while walking and falling while running, were also recognized at a rate of 100%. Markov chain is a random process where future states depend on the present state and is independent of the past states [181]. The Hidden Markov model (HMM) is similar to Markov chain, but the present state is unknown. Once trained, a classification algorithm using HMM can identify a sequence of activities from a sequence of measured features and the likelihood of a transition from previous activity [171]. He et al. [182] used the HMM for real-time activity classification using data from three two-axis accelerometers. Data was collected from five subjects performing 11 different activity series: stable states such as standing, sitting, lying, and transition states such as standing to sitting, sitting to lying, sitting to standing, lying to sitting, and falling. The activity detection accuracy was 95.82%. HMM can also be combined with other classifiers. For example, Lester et al. [87] used HMM as a second classifier to differentiate a range of daily activities. The outputs of a static binary classifier were used as inputs to the HMM classifier. Adding that second HMM layer, Lester et al. improved their classification accuracy by approximately 10-15%. 2.4.8 Summary of Data Analysis Accelerometers have been used in many studies to measure mobility, identify postures and posture transitions, detect falls, classify activity, and so on. Accelerometer specifications for human motion studies may depend on where the sensor is placed on the body and type of activity to be identified. Some studies placed sensors at multiple locations, but some also proved that it was possible to detect activity with a single accelerometer placed around the center of mass area. For an accelerometer placed at the waist for daily activity assessment, Bouten et al. [80] concluded that an accelerometer should be able to measure acceleration with amplitude ranging from -6 to +6 g and frequency up to 20 Hz. Development of a Wearable Mobility Monitoring System 49 Literature Review Methods for calibrating accelerometers vary from simple DC offset removal to more complex automatic signal calibration to correct for drift. The DC offset can be removed with a low cut-off frequency filter. Filtering techniques were also used to remove spikes, noise, and undesirable frequencies from the raw signals. The raw filtered and calibrated acceleration signals are usually divided into small windows from which features can be extracted. The different categories of features are heuristic features, time-domain features, frequency-domain features and time-frequency domain. Usually the time-domain features do not required as much processing power as the frequency analysis methods, which is important when designing real-time portable application using low power and memory devices. However, frequency-domain features have the advantage of detecting cyclic motion such as in walking and running. Features showing both time and frequency characteristics can also be obtained from wavelet analysis methods. However, wavelet analysis may be inferior to frequency-domain features to detect dynamic activity. Data transfer to a personal computer is often required to perform more advanced signal processing techniques and to better analyze the signal [9, 155, 160]. After a set of features have been generated and selected, they can be used as inputs for a classification algorithm. Simple algorithms based on threshold and hierarchical tree configurations have been successfully used to detect different activities, postures, falls, etc. These methods are often implemented in applications using low memory and processing power devices. Other advanced methods have been used such as decision tree, k-nearest neighbor, support vector machine, neural network, naïve bayes, fuzzy logic, and Markov chains. Many of these methods have demonstrated good classification accuracy but may require more processing power or training data. Development of a Wearable Mobility Monitoring System 50 Rationale Chapter 3: Rationale As noted in Chapter 1, mobility deficits are a large and increasing problem in our aging society. A decrease in mobility can reduce independence for activities of daily living, produce deterioration in health status, and diminish quality of life. One of the main rehabilitation program goals is to achieve independent community mobility. To understand how people move, we must be able to measure mobility at home, outside the home, and in the community. A better understanding of the challenges encountered in these three environments, and the skills required to overcome these challenges, can help healthcare providers make informed decisions that enable individuals to attain independent community mobility. Unfortunately, the current tools for measuring mobility outside of a laboratory or clinic are insufficient. Therefore, there is a need to develop assessment tools that can monitor mobility at home and in the community, and provide insight on the context/environment in which the activity takes place. Current mobility assessment methods include observational and clinical tests, diaries and questionnaires, biomechanical and physiological measurement, and activity monitoring. Mobility assessment limitations are presented in Section 2.2. A wearable system approach for mobility assessment presents many advantages and allows a person’s mobility to be measured anywhere. Challenges encountered with wearable systems include their portability, power consumption, privacy and security, acceptance, and adherence (Section 2.3.6). Recent technological advances in sensor miniaturization, wireless communication, power consumption, smartphones, and handheld devices have helped overcome many of these challenges. These advances lead to the development of wearable systems that detect and recognize a person’s activity and provide contextual information. However, many of the reviewed studies involving both activities and context measurement were not intended for mobility monitoring of a person with physical disabilities (Section 2.3.6). Development of a Wearable Mobility Monitoring System 51 Rationale Smartphones are considered a viable wearable system platform to monitor mobility in the community. Such phones are small, lightweight and have good battery life, sufficient processing power, large memory capacity, and multiple networking capabilities. These phones can also include technologies appropriate for mobility monitoring; such as a camera, GPS, and accelerometer. The advantages of using accelerometers in mobility monitoring have been well documented (Section 2.3.4.1). Light, humidity and temperature sensors can also be included in the wearable system to add more details on weather and ambient condition. However, the use of the camera/video for wearable, context-sensitive mobility assessment has not been previously reported. Wearable video and/or still image analysis could greatly enhance accuracy and reliability over systems that only rely on inertial sensors. 3.1 Application of a Wearable Mobility Monitoring System (WMMS) A wearable system that can validly monitor mobility in the community and capture the context associated with mobility could benefit people with physical disability by helping the rehabilitation medicine field. For instance, such a system could help evaluate the progress made during and after rehabilitation, help identify mobility issues outside a hospital environment, and enhance clinical decision-making about the rehabilitation program (i.e., assistive devices, exercises, etc.). Measurement of activities avoidance and categorizing activities are other useful information for physical rehabilitation that could be provided by a WMMS. A WMMS could also be used as a research tool to evaluate mobility interventions and assessment methods in the community. In addition, a WMMS could determine the skills required to overcome challenges found in different community environments (e.g., busy city street, farm, mall, etc.). These results could help improve training or advocate for changes to the environment. Additionally, exploration of the camera in smartphones to capture context will provide insight on this approach for mobility monitoring applications. Development of a Wearable Mobility Monitoring System 52 Rationale 3.2 Objective of the thesis The purpose of the thesis is to develop and validate a wearable system that will monitor mobility in the community. The wearable system must be light and portable, easy to use, and contained at one body location. The WMMS was developed to meet the following objectives: • Detect, in real-time, a user’s change-of-state related to mobility and context. • Take a picture for every valid change-of-state to identify the mobility context and environment. • Validate the system with a normal population. From the WMMS developed in this research, it was hypothesised that a change-of-state can be identified with 95% specificity and 95% sensitivity, and that images can be correctly categorized 95% of the time. Development of a Wearable Mobility Monitoring System 53 Methodology Chapter 4: Methodology The following section contains the design criteria for a Wearable Mobility Monitoring System (WMMS). This chapter includes an overview of the system architecture, materials, data processing methods, and system evaluation methods. 4.1 Design Criteria A high-compliance WMMS must be lightweight, wearable, easy to place on the person, easy to use, and located at one location on the body. The objectives of the system were also to identify changes-of-state and take pictures to capture the context. The following list of criteria was used in the design of a Wearable Mobility Monitoring System (WMMS): 4.1.1 System Design Criteria • Minimum number of sensors to obtain valid data • Captures motion data, location data, and ambient/environmental data • Wearable, small, lightweight, does not interfere with range of motion • Integrated in one package so that the device is only worn at one location on the body • Power efficiency (system lasts one day on one charge) • Memory capacity should be at least one day • User friendly for consumer and health care provider • Uses commercially available technology • Follows wireless transmission standard protocols • Inexpensive • Reliable • Safe • Detect a change-of-state, within a 5% tolerance, for sensitivity and specificity Development of a Wearable Mobility Monitoring System 54 Methodology 4.1.2 Software Design Criteria • Perform real-time processing of incoming data • Identify change-of-state • Obtain contextual information automatically when there is a change-of-state • Save processed data and pictures to a file • Data security on device and during transmission • Application easily upgradeable for future use 4.2 System Architecture The proposed WMMS system architecture is illustrated in Figure 4.1. A smart-phone was used as the platform for the WMMS to perform functions such as capturing, processing, storing, and transmitting motion data and contextual information. The system could send community mobility data or emergency events (e.g. fall) to a hospital external server. Data received at the external server could be further analyzed and feedback could be given back to the user if required. Figure 4.1: System Architecture of a WMMS. In this research, the WMMS consisted of a central node or hub that captured, processed, and logged the motion and contextual data. An external sensor board was added to the design since the current central node (Blackberry Bold) did not provide access to raw accelerometer Development of a Wearable Mobility Monitoring System 55 Methodology data. The external board was designed to fit on the BlackBerry Bold holster to simulate an all-in-one WMMS (Figure 4.2). The board captured motion data (accelerometer), ambient data (light intensity), temperature, and humidity. The central node provided GPS location data and speed, time, and digital photo images (contextual information). The WMMS was designed to be worn on the waist, which is a common location to wear a mobile or smartphone and a validated site for accelerometer data collection for mobility measurement (Section 2.4.1). The WMMS determined the user’s state and took a digital picture whenever a change-of-state occurred. The mobility state was determined within a one-second window and then copied to a file along with contextual information for that second. Figure 4.2: Front and side view images of the WMMS. Development of a Wearable Mobility Monitoring System 56 Methodology 4.3 Determination of Change-of-State In this research, a change-of-state was defined as the user’s change of movement, intensity of movement, and/or position. The WMMS was designed to detect the following changes-of-state: • Start/Stop moving (e.g., walking, running, cleaning) • Going up or down stairs/ramp/hill • Posture change (e.g., standing, sitting, lying) • Speed increase (e.g., bus, car) • Light intensity change (e.g., indoor, outdoor) • Posture transitions (e.g., stand-to-sit, sit-to-stand, stand-to-lie, lie-to-stand) • Increase in movement intensity (e.g., stairs) 4.3.1 Mobility Tasks and Context Classification To detect mobility tasks and identify the context associated with the mobility tasks, the WMMS should detect a change-of-state when transitioning between mobility tasks, which signal the smartphone to take a picture to capture the context and help identify the mobility task. The WMMS was evaluated for its capability to detect the following list of mobility tasks and contexts: • Walking on a level ground • Walking on a ramp • Walking up and down stairs • Inside a building • Outside the building on paved pathway • Taking the elevator • Riding in car • Sitting • Lying • Standing Development of a Wearable Mobility Monitoring System 57 Methodology 4.3.2 Algorithm Outline Figure 4.3 presents the outline of the WMMS signal-processing, algorithm and data flow. Data coming from the external board and the BlackBerry were pre-processed before extracting features from the signals. The features were then used as input to an algorithm that determined the state and took a picture if there was a change-of-state. All features extracted for every second of data, time stamp, and image name were saved to an output file. The digital images were stored on an SD card. Figure 4.3: WMMS signal processing and algorithm outline for each data window. Development of a Wearable Mobility Monitoring System 58 Methodology 4.4 System Evaluation Outline One of the first steps in developing the WMMS was to select a hub or platform that met our design requirements. Therefore, a preliminary evaluation was performed to evaluate the BlackBerry smartphone as a hub of a mobility monitoring system. Chapter 5 presents the details about the preliminary BlackBerry evaluation. The next step, presented in Chapter 6, was to design and evaluate hardware for the WMMS. Then, everything was put together to create the WMMS and the software was developed to capture, process, and log data. Chapter 7 presents the details about data processing and algorithm. Chapter 8 presents the technical evaluation and the mobility evaluation from five healthy subjects of the WMMS. Development of a Wearable Mobility Monitoring System 59 Preliminary Evaluation of the BlackBerry for WMMS Chapter 5: Preliminary Evaluation of the BlackBerry for WMMS A proof-of-concept WMMS system was assembled consisting of a Blackberry 8800 handheld (Research In Motion, Ontario, Canada) serving as a hub or central node and a commercial motion capture system (Xbus Kit, Xsens Technologies, Netherland). The purpose was to evaluate the BlackBerry smartphone as a platform for a WMMS. The choice for the BlackBerry model 8800 was based on the currently available Java development environment and application programming interface (API). Figure 5.1 illustrates the proof-of-concept system architecture. Five motion trackers (MTx) were connected to the Xbus Master in a daisy chain configuration. The BlackBerry 8800 used Bluetooth to communicate with the Xbus Master during motion capture to configure and initialize the Xbus Master and the five MTx sensors. Motion data was in orientation mode expressed in quaternion units. Another command was sent to the Xbus Master from the BlackBerry to start data capture. Processing the incoming motion data was performed by the BlackBerry to calculate Euler angles for both knees and hips (four sets of Euler angles in total). The processed data, the GPS coordinates, and the GPS acquisition time were saved to a file on the smart phone’s SD card. After completing data collection, the file was downloaded to a personal computer via USB to visualize the results. Figure 5.1: System architecture for the preliminary testing. Development of a Wearable Mobility Monitoring System 60 Preliminary Evaluation of the BlackBerry for WMMS 5.1 Biomechanical Parameters Calculations The proof-of-concept WMMS system calculated biomechanical parameters, such as joint angles of both knees and hips. The sensor placement for this application is shown on Figure 5.2 and Figure 5.3. The Cardan/Euler technique was used, which is one of the most widely used methods in biomechanics, to calculate 3D joint angles [183]. For each joint, the relative orientation between the distal sensor coordinate system and the proximal sensor coordinate system was determined by computing the rotation transformation matrix (RTM) of that particular joint. For the knee joints, the distal sensor was on the lower leg and the proximal sensor was on the upper leg. For the hip joints, the distal sensor was placed on the upper leg and the proximal sensor was on sacrum. Figure 5.2: Sensor placement for the calculation of biomechanical parameters. Development of a Wearable Mobility Monitoring System 61 Preliminary Evaluation of the BlackBerry for WMMS Both sensors have a rotation matrix relative to the global coordinate system G ( GS R ): 2q 02 + 2q12 − 1 G S R = 2 q1 q 2 + 2 q 0 q 3 2q1 q3 − 2q0 q 2 2q1 q 2 − 2q0 q3 2 0 2 2 2q + 2 q − 1 2q 2 q3 + 2q0 q1 2q1 q3 + 2q0 q 2 2q 2 q3 − 2q0 q1 2q 02 + 2q32 − 1 (5.1) where q0 , q1, q2 , q3 are the quaternion numbers of one MTx sensor. The subscript S represents the sensor coordinate system and G the global coordinate system. The RTM for one joint (i.e., knee or hip) is then calculated with matrix manipulation: RTM = S proximalG R T ⋅SdistalG R RTM = S proximal S distal R11 R = R21 R31 R12 R22 R32 (5.2) R13 R23 R33 (5.3) where S proximal and S distal represent the coordinate systems of both the proximal and distal sensors respectively. S proximal S distal R is the rotation matrix of the distal coordinate system relative to the proximal coordinate system. From the resulting RTM, the Euler angles can be calculated: R32 R 33 φ = tan −1 (5.4) S proximal S distal θ = − sin −1 ( R31 ) (5.5) S proximal S distal ψ = tan −1 R21 R 11 (5.6) S proximal S distal Development of a Wearable Mobility Monitoring System 62 Preliminary Evaluation of the BlackBerry for WMMS The Euler angles φ , θ ,ψ are also called roll, pitch, and yaw, respectively. Roll is the rotation around the x-axis, pitch the rotation around the y-axis and yaw the rotation around the z-axis. Figure 5.3: Sensor placement. 5.2 Xbus Kit The Xbus kit consists of an Xbus Master (XM-B-XB3) and five MTx motion trackers (MTx-49A53G25) [184-186]. The five MTx and the Xbus Master are interconnected in a daisy-chained configuration. The Xbus Master delivers power to the five motion trackers and retrieves the sampled data. With the output mode set to orientation mode with quaternion units, each MTx data record contains four float numbers. Each float number is 4 bytes long and corresponds with the single-precision floating-point value as defined in the IEEE 754 standard. For every data sample, the packet sent is a total of 87 bytes ((4 bytes * 4 float number * 5 sensors) + 7 bytes for header). The message structure contains the following fields: PREAMBLE BID MID Development of a Wearable Mobility Monitoring System LEN DATA CHECKSUM 63 Preliminary Evaluation of the BlackBerry for WMMS 5.3 Java Programming A Java application was developed using the BlackBerry Java Development Environment version 4.5.0.7. The Java application was then uploaded to the BlackBerry platform through the BlackBerry Desktop Manager. The BlackBerry API (application programming interface) net.rim.device.api.bluetooth was used to initiate a Bluetooth serial port connection and to write and read data from the port. The Java application used one thread to read incoming data from the Bluetooth port and then parse the data. The checksum was calculated for every sample to verify that there were no errors. If the checksum was correct, data bytes were converted to float numbers and then the biomechanical parameters calculations were completed. The resulting joint angles were then put in a writing queue waiting to be copied to a file. A second thread took data from the writing queue and then copied the data to a file along with the most recent GPS data. Creating and writing files on the BlackBerry SD card were performed using the FileConnection interface from the javax.microedition.io.file package. The GPS data was obtained using the LocationListener interface from the javax.microedition.location package. 5.4 Test Procedure Static and dynamic trials were performed. In the static trials, the Xbus kit and the BlackBerry were placed on a desk for the full duration. An adapter connected to the wall AC outlet powered the Xbus Master. In dynamic trials, the sensors were attached on a subject’s lower limbs and hip (Figure 5.3) to simulate real-world orientation angle measurements. The Xbus kit was battery powered for the dynamic trials. For the static trials, the Xbus Master was set to sample data at 50 Hz and at 25 Hz (5 trials per frequency). The Java application received the data from the Xbus for as long as there was no error sent by the Xbus Master. A timer overflow error (error code 28) typically occurred when the Xbus Master did not receive the Motion Tracker response within the measurement period [186]. This was an internal error with the XBus system. Following this error, the Xbus Master stopped sending data and the BlackBerry application had to be restarted. When no error occurred after 2.5 hours and the application was still running, data Development of a Wearable Mobility Monitoring System 64 Preliminary Evaluation of the BlackBerry for WMMS collection was stopped manually. For each trial, the time the system ran without error, the BlackBerry battery level before and after each trial, the amount of data loss, and the error that made the Xbus Master stop were evaluated. Following the 50 Hz and 25 Hz static data collection trials, another five static trials were run at 50 Hz but with minimal processing (e.g., static minimal trials). For these trials, the Java application was modified to only receive motion data; no biomechanical parameters were calculated, no GPS data were received, and no data file was created. This was to verify that the Java application was not causing the Xbus Master to stop early during data collection. Finally, dynamic trials were performed to simulate real orientation angle measurements. The sensors were attached on a subject’s lower limbs and hip (Figure 5.3). The Xbus Master was powered by battery. Five trials were run at 50 Hz and 25 Hz for as long as possible. This set of dynamic trials was compared to the first set of static trials. 5.5 Preliminary Evaluation Results Table 5.1 shows the average time and the standard deviation for the static and dynamic trials, as well as the number of trials that stopped due to error. The timer overflow error caused the Xbus Master to stop sending motion data. For both the static and dynamic trials, the application was able to run longer without error at 25 Hz than at 50 Hz. Only one trial at 50 Hz ran without error. The other 50 Hz trials stopped due to the same timer overflow error. At 25 Hz, the dynamic trials had only one stop due to this error, compared to two stops during the static trials. In addition, the averaged time was smaller during the dynamic rather than the static trials. The Xbus Master’s batteries were not able to last more than 1.5 hours, causing this smaller average time. For the static minimal trials, the average time was slightly better than the normal static trials at 50 Hz. However, the application still stopped due to the Xbus timer overflow error. No data were lost for all trials. The BlackBerry battery trials indicated an average usage of 12.1 ± 2.6% per hour. At this rate, the BlackBerry would run out of battery power after approximately 6.8 hours. Development of a Wearable Mobility Monitoring System 65 Preliminary Evaluation of the BlackBerry for WMMS Table 5.1: Preliminary BlackBerry evaluation results Average Time (minutes) Standard Deviation (minutes) Number of stops due to Xsens Error 0x1C Static (50 Hz) 36.4 37.5 4 Static (25 Hz) 99.6 47.3 2 Static Minimal (50 Hz) 50.1 42.9 5 Dynamic (50 Hz) 30.9 20.3 5 Dynamic (25 Hz) 55.7 31.4 1 Description of Trial 5.6 Preliminary Evaluation Discussion The error sent by the Xbus Master was always error code 28, implying that a timer overflow occurred during measurement (i.e., the Motion Tracker response was not received by the Xbus Master within the measurement period [186]). Ignoring this error instead of having the application stopped would have been ideal. A few missing data points would have not been as critical as missing a large amount of data due to the application stopping. However, the Xbus kit was a commercial system that provided minimal control of error handling between the XBus and the MTx sensors. Since lowering the sampling frequency showed a decreased in error occurrence, a value lower than 25 Hz could have potentially avoided the error. However, in human motion measurement using accelerometers, a sampling frequency lower than 25 Hz might not be sufficient (Section 2.4.2). Results from the static minimal trials showed that removing processing, logging sensor data, and including GPS data, did not improve the total sampling time. The error code was always the same, i.e., timer overflow. The results suggest that the problems encountered during measurement were a result of external sensor errors. One of the design criteria for the WMMS is that battery should last at least one day on one charge (Section 4.1). However, the results from this preliminary study showed that the BlackBerry’s battery might last for less than seven hours. This issue could be resolved by upgrading the battery to a larger capacity. Development of a Wearable Mobility Monitoring System 66 Preliminary Evaluation of the BlackBerry for WMMS Java programming problems with conversion of float numbers to a string resulted in excessively long execution times causing the Xbus Master to stop sending data. String conversion was required for data display purposes. To solve this problem, integer numbers were used instead of float numbers. The conversion of integer to string was less time consuming for the Java application. 5.7 Summary A proof-of-concept system that calculated biomechanical parameters of the human body was created. The objective was to evaluate the BlackBerry as a Wearable Mobility Monitoring System platform. The BlackBerry device demonstrated capability and good potential as a WMMS hub. Many of the problems encountered during data collection were due to the motion capture system. Thus, the choice of external sensors for long-term monitoring should be made with care. Based on this analysis, proceeding with BlackBerry as a development and WMM application platform was supported. Development of a Wearable Mobility Monitoring System 67 Hardware Design and Evaluation Chapter 6: 6.1 Hardware Design and Evaluation Platform The BlackBerry 9000 (Bold) (Figure 6.1) was used as the platform or central node of the WMMS. As shown in Chapter 5, BlackBerry smartphones are appropriate for a WMMS and the BlackBerry 9000 met the design criteria as outlined in Section 4.1. BlackBerry is a commercially available technology, reliable, and user-friendly. The device is also small and lightweight, and does not interfere with movement when worn on the waist. Potential issues with power capacity and memory could be resolved by upgrading to a larger size battery and memory card. Figure 6.1: Front, side and back view of BlackBerry Bold [181]. Other important features of BlackBerry smartphones are the built-in industry-leading security features that come with the use of the Blackberry Enterprise Solution. Additionally, newer BlackBerry smartphone models provide access to accelerometer raw data that could enable the design of an all-in-one WMMS. A mature Java environment and many secure API’s are also available with the BlackBerry devices. 6.1.1 BlackBerry Bold Specifications and Features The following summarizes the BlackBerry 9000 specifications and features [187]. • Built-in GPS • 2.0 Mega Pixel Camera with flash and 3x digital zoom • Video Recording Development of a Wearable Mobility Monitoring System 68 Hardware Design and Evaluation • Web browser • Corporate Data Access • Phone, SMS/MMS • Wi-Fi support: 802.11a/b/g enabled • Bluetooth v2.0; Serial Port Profile supported • Device password protected and keyboard lock • AES or Triple DES encryption when integrated with Blackberry Enterprise Server • Battery Life: 4.5 hours of talk time and 13.5 hours of standby time • Memory: 1 GB of onboard memory, 128 MB of Flash memory and expandable memory support for microSD card • Processor speed: 624 MHz • Operating System: 4.6.0.244 6.2 External Board While the cutting edge and future smartphones have integrated accelerometers and the potential to test ambient light via the integrated camera, an external board with mobility analysis sensors was used in this thesis. The external sensors were required because a BlackBerry smartphone with all the required capabilities was not on the market during the development phase (i.e., accelerometer, GPS, Wi-Fi, Bluetooth, camera). The external board design, integrated into the phone’s holster, provided a flexible approach to add other measurement sensors or tools in the future. 6.2.1 Design Criteria The custom-made external board design criteria were: • Bluetooth serial port profile communication to allow communication with the BlackBerry smartphone. • Rechargeable battery that can last at least a day. • Triaxial accelerometer with a range of ±6g, and able to detect frequency up to 20 Hz as discussed in Section 2.4.1.2. This is to detect motion of the user. Development of a Wearable Mobility Monitoring System 69 Hardware Design and Evaluation • Light sensor to help in differentiating indoor from outdoor (Section 2.3.4.7). • Temperature and humidity sensor to give weather information (Section 2.3.4.7). • Board shaped in such a way to be fixed on the BlackBerry’s holster and without obstructing the camera view of the BlackBerry. 6.2.2 Parts Specifications A general system design of the board is presented in Figure 6.2. The complete electrical schematic is shown in Appendix A. An image of the board is presented in Figure 6.3, indicating the location of the sensors and other main components. The board consists of a microcontroller CY8C27443 (Cypress Semiconductor Corporation, San Jose, CA, USA), a Bluetooth Module F2M03GLA (Free2Move AB, Halmstad, Sweden), a triaxial accelerometer LIS344alh (STMicroelectronics, Geneva, Switzerland), a light sensor APDS9005 (Avago Technologies Limited, San Jose, CA, USA), and a humidity and temperature sensor SHT71 (Sensirion AG, Staefa, Switzerland). The board is powered up with a lithium battery and has a USB rechargeable circuitry. This external board could run continuously for approximately 14 hours on one charge. Specifications for the main components are presented in Table 6.1. Figure 6.2: Block diagram of the external board. Development of a Wearable Mobility Monitoring System 70 Hardware Design and Evaluation Figure 6.3: Image of the board with all the sensors identified. Table 6.1: Summary of specifications for main component of the external sensors board. Device Type Microcontroller [188] Manufacturer Cypress Semiconductor Corporation Part Number CY8C27443 -24SXI Summary of Specifications • • • • • • • • • • • • M8C Processor Speeds to 24MHz 8x8 Multiply, 32-Bit Accumulate Low Power at High Speed 3.0V to 5.25V Operating Voltage 12 Rail-to-Rail Analog PSoC blocks 8 Digital PSoC Blocks Programmable Clocking 16K Flash Program Storage 256 Bytes SRAM Data Storage Watchdog and Sleep Timers Physical size (LxWxH) [mm]: 18.1x7.6x0.1 Weight: 0.85grams Development of a Wearable Mobility Monitoring System 71 Hardware Design and Evaluation Bluetooth Module [189] Free2Move F2M03GLA • • • • • • • • • • • • • • • Accelerometer [166] ST Microelectronics LIS344ALH • • • • • • • • • • • Light Sensor [190] Avago Technologies Limited APDS-9005 • • • • • • Digital Humidity and Temperature Sensor [191] Sensirion AG SHT71 Fully qualified end product with Bluetooth v2.0+EDR, CE, FCC, and IC Low Power consumption Nominal transmit power: +6dBm Nominal sensitivity: -83dBm Frequency: 2.4GHz ISM band Range up to 250m (line of sight) Integrated high output antenna 8Mbit Flash for complete system solution 10 digital and two 8bit analog I/O Enhanced Data Rate (EDR) compliant for both 2Mbps and 3Mbps modulation modes Serial interface up to 4Mbps No additional Bluetooth qualification needed Physical size (LxWxH) [mm]: 28.5x15.2x2.0 Weight: 1.2grams Supply voltage: regulated 3.1-3.6 VDC 2.4 V to 3.6 V single supply operation ±2 g / ±6 g user selectable full-scale Maximum bandwidth of 1.8kHz Low power consumption Output voltage, offset and sensitivity are ratiometric to the supply voltage Sensitivity at Full-scale ±6g: Typical Vdd/15 V/g Sensitivity change Vs Temperature: ±0.01 %/ºC Zero-g-Level (Voffset) at Full-scale ±2g: Vdd/2V Zero-g-Level change Vs Temperature: ±0.4mg/ ºC Weight: 0.040 grams Physical size (LxWxH) [mm]: 4x4x1.5 VCC supply 1.8 to 5.5V Low sensitivity variation across various light sources Peak sensitivity wavelength: typical 500nm Physical size (LxWxH) [mm]: 1.50x1.60x0.55 Photo current with Lux=100 from incandescent lamp: typical 44 uA Dark current (Lux=0): typical 300 nA Relative Humidity: • Resolution: typical 12bit (0.05 %RH) • Accuracy typical ±3.0 %RH • Repeatability ± 0.1 %RH • Response time typical 8s • Operating Rage: 0-100 %RH Temperature: • Resolution 14 bit (0.01 ºC) • Accuracy typical ± 0.4 ºC • Repeatability ± 0.1 ºC • Operating range: -40 to 123.8 ºC • Response time: 5 – 30 s Development of a Wearable Mobility Monitoring System 72 Hardware Design and Evaluation 6.2.3 Board Functionality The board power is turned on by flipping a switch installed on the board. To start and stop sampling of the sensor data, commands that set the sampling delay are sent to the microcontroller. Communication with the external board is done via Bluetooth or the debug serial port. Data from the accelerometer and the light sensor are first sampled by the microcontroller at a rate of 130 Hz. The temperature and humidity sensors are sampled by the microcontroller at 0.25 Hz. These data are stored in a buffer on the microcontroller. Then, at every sampling delay, the last data stored in the buffer are sent to the host (BlackBerry) via Bluetooth. In this thesis, the sampling delay was set to 20 ms (50 Hz). 6.2.4 Packet Format The external board sends a 21-bytes data packet to the host (BlackBerry or personal computer) using Bluetooth Serial Port Profile (SPP) protocol or RS232 serial protocol: Header (2 bytes) Packet Type (1 byte) Packet Length Sample (1 byte) Number (1 byte) X-axis Acceleration (2 bytes) Y-axis Acceleration (2 bytes) Z-axis Acceleration (2 bytes) Light Intensity (2 bytes) Temperature (2 byte) Battery Voltage (2 bytes) CRC (2 bytes) Humidity (2 byte) The header bytes are 0xC3 and 0x42. The packet type can be either 0x01 for data packet, or 0x02 for control packet. All the sensor data are sent to the host as integer values (2 bytes). 6.2.5 Commands Commands available to control the external board were for setting the board’s sampling delay and to turn off sampling. Command – setting sampling delay • Packet: 0xC3 0x42 0x02 0x01 0x(delay) • “delay” is the delay between samples in milliseconds. For example, if the delay byte is set to 0x14, which means 20 milliseconds, then the sampling frequency is 50 Hz. Development of a Wearable Mobility Monitoring System 73 Hardware Design and Evaluation Command – Turning off sampling • Packet: 0xC3 0x42 0x02 0x01 0x00 • This will turn off sampling 6.2.6 Temperature and Humidity Sensors The temperature and humidity raw data coming from the board was converted using Equation 6.1 and 6.2 to get the temperature in Celsius and the humidity in percent of Relative Humidity [191]. The two bytes received from the board (rxTemp) were processed using Equation 6.1 to give temperature T in Celsius: T = (rxTemp × 0.01) − 39 (°C) (6.1) For humidity, the two bytes received (rxHum) were processed using Equation 6.2 to provide humidity H in % of Relative Humidity (RH): H = [(rxHum 2 × −1.5955e −6 ) + (rxHum × 0.0367)] − 2.0468 (%RH) (6.2) 6.2.7 Light sensor The board provided 3.3 volts and a load resistance of 2 kohms to the light sensor. Since the manufacturer did not provide calibration curves for VCC=3.3V, a calibration table of different light conditions versus voltage output of the light sensor was created (Table 6.2). These different lighting conditions were subjectively chosen based on common lighting conditions under which the WMMS will operate. Having different light condition associated with a real-world light intensity value helped determine classification threshold values for indoor and outdoor conditions. The board was worn on the right hip of one subject during testing. The subject was asked to stay in the same light condition within a circle of approximately 1.5-2 meters of diameter for the whole measurement period but to move and turn around within that circle. Five trials for each light condition were completed at different times, days, and locations. Each trial was Development of a Wearable Mobility Monitoring System 74 Hardware Design and Evaluation for one minute. The light sensor values were averaged for each light condition. From these results, thresholds for indoor and outdoor conditions were set to 1000 and 300, respectively. More details on the algorithm using these thresholds are provided in Chapter 7. Table 6.2: Average output value of the light sensor (mV) for different light conditions (standard deviation in brackets). Light condition Average light sensor Vout (mV) Outdoor sunny day 1474.0 (16.3) Outdoor sunny day in the shade 1214.6 (334.4) Outdoor cloudy day 1185.9 (451.6) Indoor away from window 74.5 (83.9) Indoor cloudy in front of window 252.7 (236.1) Indoor sunny day in front of window 531.5 (387.5) Outdoor during the night 19.3 (7.3) Indoor during the night, light off 17.3 (0.5) Indoor during the night, light on 28.3 (13.5) Pitch dark (in black box) 17.3 (0.5) 6.2.8 Accelerometer Calibration A variable capacitance accelerometer, which has the property to measure both DC and AC acceleration, was used for the WMMS (Section 2.3.4.1). An advantage of measuring DC acceleration is the ability to calculate inclination angle. However, having a DC component creates a signal offset, which, as mentioned by Bouten et al. [80], should be corrected to avoid over or under estimation of the measured acceleration. The other calibration parameter necessary for the acceleration calculation is sensor sensitivity. Sensitivity describes the accelerometer gain. Despite the factory calibration for offset and sensitivity, re-calibration was recommended after mounting the sensor onto the board because this process could have modified the factory values. Re-calibration also defined the orientation of the accelerometer axes with respect to the external board axes. Development of a Wearable Mobility Monitoring System 75 Hardware Design and Evaluation Accelerometer sensitivity and offset values for each axis (x,y,z) were calculated prior to the WMMS evaluation. The calibration method was described on the manufacturer datasheet [166]. The method is described here using the x-axis as an example (the same procedure applies to y and z-axis). The board was oriented such that its x-axis was pointing in the opposite direction to the gravity vector. With the board in that position, the acceleration was measured. The board was then rotated 180 degrees such that its x-axis was in the same direction as the gravity vector; the acceleration was again measured. The offset value of the x-axis was obtained by adding the maximum acceleration measured value (umax) and the minimum acceleration measured value (umin), divided by two (Equation 2.5). Then, the xaxis sensitivity was obtained by subtracting the minimum acceleration measured value from the maximum acceleration measured value, and dividing by two (Equation 2.4). The calculated offset and the sensitivity values were used to calculate acceleration in g prior to data processing (Equation 2.6). Accelerometer calibration and re-calibration is often needed to correct for signal drift (Section 2.4.1.4). Drift of the acceleration DC component was tested during five trials of 2 hours each. During each trial, acceleration data was collected where the WMMS was run without moving the external sensor board. The drift was calculated by subtracting the minimum value from the maximum value of the mean DC acceleration. The average drift value and the standard deviation for the three axes were: 0.0023 ± 0.0010 g/hour for x-axis, 0.0029 ± 0.0008 g/hour for y-axis, and 0.0040 ± 0.0016 g/hour for z-axis. From these drifting rates, the inclination angle calculation might vary by no more than 5 degrees after 12 hours. From these results, it was determined that there was no need for re-calibrating the accelerometer during trials. These results were also expected since the external board used a low-drift accelerometer that has a trimming circuit to reset the device trimming value during power up. Therefore, calibration of the accelerometer was performed once prior to the evaluation. Development of a Wearable Mobility Monitoring System 76 Hardware Design and Evaluation Figure 6.4: Examples of the drift acceleration versus time for x-, y- and z-axis. Development of a Wearable Mobility Monitoring System 77 Hardware Design and Evaluation 6.2.9 Data Filtering The external board was designed such that each of the accelerometer output signals were passed through an analog low-pass filter with a cut-off frequency of approximately 145 Hz before being sent to the BlackBerry. Each low-pass filter was located on the output of each axis and was composed of an internal output resistor of 110 kohms (typical value) and an external load capacitor of 10 nF. The light, temperature and humidity sensors signals were not analog filtered. Some digital filtering of the external board sensors data were performed by the Java application developed for the WMMS and will be described in the next Chapter. 6.3 Hardware Evaluation 6.3.1 Camera The BlackBerry Bold camera was evaluated for shutter lag, which is the time between calling the “take-a-picture” function and the time the picture was taken. The time before the camera is ready to take another picture was also evaluated. A Java application was developed to take a picture continuously until manually stopped. The picture encoding was set to jpeg with size 640x480 pixels and quality set to normal. The memory size of a picture with this encoding was 10 to 70 Kbytes. The time before and after the picture was taken was measured using the Java function System.currentTimeMillis(). Five trials were performed with 20 pictures taken per trial. During the trials, the BlackBerry was held by a user. The shutter lag values were averaged. From the same trials, the time before the camera was ready to take another picture was calculated by subtracting the time after the previous picture was taken from the time before taking the next picture. These time values were averaged. Table 6.3 shows the results for camera performance evaluation. The time the function take-a-picture was executed and the time the camera was ready again to take a picture was almost 2 seconds. This is slow for application where real-time processing was one of the criteria. These time results will need to be taken into account Development of a Wearable Mobility Monitoring System 78 Hardware Design and Evaluation during WMMS design. If the user’s state changes between 1.02 seconds windows, consecutive pictures cannot be taken. Table 6.3: BlackBerry Bold camera performance evaluation results. Shutter Lag (s) Time before camera is ready (s) Average Standard Deviation Average Standard Deviation Trial 1 0.65 0.07 0.86 0.01 Trial 2 0.63 0.12 0.86 0.01 Trial 3 0.70 0.08 0.86 0.01 Trial 4 0.66 0.08 0.86 0.01 Trial 5 0.61 0.03 0.86 0.01 TOTAL AVERAGE 0.65 0.07 0.86 0.01 6.4 Summary The BlackBerry Bold was chosen as the platform for the WMMS. Since access to raw accelerometer data was not available with the 9000 model, an external board was added to the design. The external board, designed to fit on the BlackBerry holster, provides motion data and context data such as light intensity, humidity and temperature. The BlackBerry provides GPS, current time, and camera functions. The light sensor was calibrated with different lighting conditions present in everyday life. A threshold value of 1000 was a good estimate for detecting outdoors. The low threshold to reset back to the indoor state was 300. Accelerometer calibration was only required once prior to use. Testing for drift demonstrated that there was no need to recalibrate during use. This was expected since a low-drift accelerometer was placed on the board. The BlackBerry camera test indicated that a picture could not be taken for every window of 1.02 seconds. This limited the real-time processing aspect of the WMMS. Development of a Wearable Mobility Monitoring System 79 Development of the Prototype WMMS Chapter 7: Development of the Prototype WMMS This chapter describes the development of the prototype WMMS, including the methods to generate the different signal features and how each feature is used to determine the user’s state. For this prototype WMMS, the selected features were mostly time-domain features and some heuristic features (Section 2.4.6); such as inclination angle, standard deviation of y-axis, skewness of y-axis, signal magnitude area (SMA), light intensity, and GPS speed. Farther in this chapter, the algorithm to determine the state and the change-ofstate of the user is given. 7.1 Data Pre-processing The raw acceleration data received on the BlackBerry were calibrated as explained in Section 6.2.8. The calibrated acceleration data were then passed through a median filter (n=3) to remove spikes [7]. Since the external board uses a variable capacitance accelerometer (Section 2.3.4.1), the acceleration signal was composed of accelerations caused by gravity (static) and accelerations caused by movement (dynamic). Mathie et al. [81] mentioned that these two acceleration components can be separated by filtering the signal with a cut off frequency between 0.1 to 0.5 Hz. In this thesis, a RC low-pass digital filter with a cut-off frequency of 0.25 Hz was applied to the median filtered acceleration signal to extract the static component. The dynamic component was then obtained by subtracting the static component from the median filtered signal. The pseudo code used to simulate the RC low-pass filter effect is [192]: for i from 1 to n y[i] := y[i-1] + α * (x[i] – y[i-1]) return y where x is the median filtered signal, y the static component, and α the smoothing factor. The smoothing factor can be expressed as: Development of a Wearable Mobility Monitoring System 80 Development of the Prototype WMMS α= dt dt + RC (7.1) where dt is the sampling delay and RC the time constant. The cutoff frequency is expressed as: Fc = 1 2πRC (7.2) For a cutoff frequency of 0.25 Hz and a sampling delay of 0.020 second, the time constant RC was 0.64 second and the smoothing factor α was 0.0304. To determine the state, features were extracted from the static and dynamic components over a non-overlapping sliding window of 1.02 seconds. With a sampling frequency of 50 Hz, 1.02 seconds corresponds to 51 samples. As mentioned by Preece et al. [171], a sliding window is well suited for real-time processing application since signal pre-processing is not required to detect events or activity periods (Section 2.4.5). The 1.02 seconds window size was chosen based on the work from Mathie et al. [7] who found that the optimal window size for activity classification was between 0.8 to 1.4 seconds. For temperature and humidity sensor data, pre-processing corresponded to the conversion of these two data into a temperature value in Celsius and a humidity value in percentage of Relative Humidity. These conversions are explained in Section 6.2.6. Filtering was not required for the temperature and humidity data since these values were only updated every 4 seconds (0.25 Hz). As for the light sensor, the non-overlapping sliding window of 1.02 seconds was applied to the light sensor, which acted as a moving average filter. 7.2 Accelerometer Feature Generation 7.2.1 Inclination Angle The inclination angle was added to the algorithm to help classify posture [9, 147- 149] and identify postural transition [155]. For this prototype WMMS, the posture was either standing, lying on the back, or somewhere in between (e.g., sitting). Development of a Wearable Mobility Monitoring System 81 Development of the Prototype WMMS The static components of the acceleration signals, which were obtained from the RC lowpass filter, were averaged over the 1.02 seconds window. The inclination angle was calculated for every window period. The angle calculation was based on the two-axes method presented in application note AN3461 from Freescale Semiconductor [172]. Using two axes instead of one to calculate inclination angle improved resolution and provided a 360-degree range of inclination angle. The vertical (y-axis) and horizontal forward (z-axis) axes were used. Figure 7.1 illustrates the method. Figure 7.1: Inclination angle measurement method. In standing position, inclination angle is 180 degrees. The Java function atand2 was used to calculate the inclination angle Φ (Equation 7.3): Φ=atand2(GAz, GAy) (°) (7.3) where GAz and GAy are the averaged static accelerations of z-axis and y-axis respectively. The atand2 function returns the arctangent of GAz/GAy with the resulting angle ranging Development of a Wearable Mobility Monitoring System 82 Development of the Prototype WMMS between -180 to 180 degrees. However, for convenience, an offset of 180 degrees was added to the inclination angle to give a range of 0 to 360 degrees and to measure 0 degrees when the y-axis was pointing down (Figure 7.1). Another possible option was to use the Java function atan instead of atand2. However, the method using atan required more steps and more processing time to get the inclination angle Φ with a range of 0 to 360 degrees. The atan method had to identify in which quadrant the point (z, y) was in and then apply a certain offset based on the quadrant [172]. Figure 7.2: Position classification method. For every 1.02 seconds window, the averaged inclination angle was compared with a high and low standing-threshold to verify if the person was in a standing position. If the person was not standing, the angle was compared with a high and low lying-threshold to verify if the person was lying on their back. If not, then the position was determined to be somewhere in between. Figure 7.2 demonstrates the two states and the range of angles. The threshold values to detect these two postures were based on the study by Culhane et al. [148] that found that their “best estimate” approach to determine thresholds demonstrated higher detection accuracy compared to using mid-point tolerances values. Therefore, with the assumption that the sensor is perfectly mounted on the person, the angular range for standing position was set to 200 to 160 degrees. Similarly, range for lying position was set to 300 to 240 degrees. However, during preliminary testing, it was observed that certain sitting and lying positions had an angle value very close to the thresholds, causing false positive Development of a Wearable Mobility Monitoring System 83 Development of the Prototype WMMS changes-of-state to occur. The sitting posture was sometimes identified as lying and the lying position was outside the range. This was due to the way the WMMS is worn on the waist. During sitting, the leg may touch the WMMS which may caused extra inclination angle of the system. During lying, if the person had their legs bent this may also caused extra inclination. Therefore, the lying-thresholds were adjusted to 320 and 250. 7.2.2 Standard Deviation Another feature that was chosen to determine the user’s state is the standard deviation [80, 141, 147-149]. The standard deviations for the three axes were calculated using the following equation: σ= 1 n ( xi − x ) 2 ∑ n − 1 i =1 (7.4) where n is the number of point, xi the acceleration at point i, and x the mean of the acceleration signal. The Equation 7.4 can then be rearranged to the following equation for programming purposes: σ= n 1 (∑ xi2 − nx 2 ) n − 1 i =1 (7.5) In this thesis, since most daily activities such as walking, sitting, lying down and going up/down stairs can be observed by a change of acceleration on the vertical axis, only the vertical acceleration (y-axis) was required to differentiate between static and dynamic states. The y-axis standard deviation was passed through a double threshold (DT) algorithm (Figure 7.3). Figure 7.4 shows an example of the y-axis acceleration standard deviation during dynamic (walking) and static state. With the DT algorithm, if the state starts with static state, it will stay static until the signal cross the dynamic threshold. Then, the state will be set to dynamic and will stay dynamic until the signal goes below the static threshold. The dynamic threshold was set to 0.120g and the static threshold was set to 0.075g. These threshold values were estimated based on preliminary testing of the WMMS. Development of a Wearable Mobility Monitoring System 84 Development of the Prototype WMMS Figure 7.3: Flowchart of the double threshold (DT) algorithm applied to the standard deviation of the y-axis acceleration. Development of a Wearable Mobility Monitoring System 85 Development of the Prototype WMMS Standard deviation of y-axis acceleration versus time Figure 7.4: Standard deviation of y-axis acceleration during level ground walking (dynamic), followed by a short period of standing (static), and then back to walking. 7.2.3 Skewness One of the changes-of-state that the WMMS was aiming to detect was going up or down stairs. The skewness value of the vertical acceleration is a time-domain feature that was used by Baek et al. [141] to differentiate walking/running from going up/down stairs. The skewness of the y-axis was calculated as follows: n n xi − x skewness = ∑ (n − 1)(n − 2) i =1 σ 3 (7.6) where n is the number of point, xi the y-axis acceleration at point i, and σ and x are the standard deviation and the mean of the y-axis acceleration signal, respectively. Equation 7.6 can be rearranged as Equation 7.7 for programming purposes: Development of a Wearable Mobility Monitoring System 86 Development of the Prototype WMMS n n 3 x − 3 x xi2 + 2nx 3 ∑ ∑ i n i =1 i =1 skewness = (n − 1)(n − 2) σ3 (7.7) Figure 7.6 gives an example of the signal when walking and when walking up and down stairs. The top curve shows the skewness curve only. The bottom curve shows the same skewness curve, but with the dynamic level identified by the dashed line. A dashed curve value of 2 means the desired dynamic level was reached and the stairs detection algorithm determined if the state was stairs or no stairs. If the dashed curve value was 0, the state was determined as no stairs. Based on preliminary work, a skewness value larger than 1 was observed when a person walked down stairs. Skewness increased when walking up stairs, but not as much as when going down stairs. The same skewness values as upstairs were sometimes observed during normal walking, which could result in a false positive change-of-state detection. The high and low thresholds were chosen to detect down stairs and allow the possibility to detect up stairs with minimal false positive stairs detection. The high stairs threshold was set to 0.6 and the low stairs threshold was set to 0.2. Because the WMMS was not rigidly attached on the person’s waist, WMMS movement may add noise to the signal. Various smoothing techniques on the skewness signal were tried which seemed to improved the false positive, but the time resolution to detect true positive stairs was reduced. Therefore, since the goal was to take a picture when there was a changeof-state, the skewness signal was not smoothed more than the 1.02 seconds sliding window already applied. More advanced data processing could be performed later on the WMMS output to improve stairs detection. A double threshold (DT) algorithm, such as the one used for the standard deviation, was also applied to the skewness value. However, since walking up or down stairs is a dynamic state, the DT was only applied to the skewness when the standard deviation of the vertical axis was verified to be in a sufficient dynamic level. Waiting to be in dynamic state to identify Development of a Wearable Mobility Monitoring System 87 Development of the Prototype WMMS stairs was also to decrease the false positives detection of stairs caused by peak in the skewness signal observed during the stop and start of dynamic motions. The high and low thresholds of the standard deviation used to determine the sufficient dynamic level for stairs detection were 0.3g and 0.2g respectively. Figure 7.5 illustrates the DT algorithm applied to the y-axis acceleration skewness. Figure 7.5: Algorithm flow chart for skewness of y-axis acceleration. Development of a Wearable Mobility Monitoring System 88 Development of the Prototype WMMS Skewness of y-axis acceleration versus time Figure 7.6: Example of a skewness curve for y-axis acceleration. The top graph is the skewness only. The bottom graph is the skewness curve but with some dynamic, static and stairs states identified. The dotted line shows when the dynamic level was identified (i.e., when the skewness values was analyzed for stairs or not stairs state). Development of a Wearable Mobility Monitoring System 89 Development of the Prototype WMMS 7.2.4 Signal Magnitude Area (SMA) The SMA of the three acceleration signals (x, y, z) was used by Mathie et al. [7] and Karantonis et al. [9] to measure mobility. SMA was shown to detect both amplitude and duration variation in the acceleration signal, which could help detect the type of activity [7]. SMA normalized to the length t can be calculated using Equation 7.8: T T 1 T SMA = ∫ | a x |dt + ∫ | a y |dt + ∫ | a z |dt t = 0 t = 0 t =0 t (7.8) where t is the time in seconds and ax, ay, and az are the acceleration of x-, y-, and z-axis respectively. The integration technique used to calculate SMA in Equation 7.8 was based on Simpson’s rule: ∫ b a ydx = n −1 n− 2 (b − a ) y + y + 4 y + 2 y meven ∑ ∑ 0 n modd 3n m =1 m =2 (7.9) where n is the number of equal steps and y the acceleration ax, ay, or az. With a sampling frequency of 50 Hz, a 1-second window gives 50 samples and 49 steps. Since Simpson’s rule requires an even number of steps, 51 samples were used for the window size. Therefore, the window size is 1.02 seconds instead of 1 second. During preliminary testing, peaks occurred during transition when the person sat down, rose from a chair, or lay down (Figure 7.7). For this reason, SMA was added to the algorithm to determine the current state. Another reason to add SMA is to help identify activity intensity changes, which could mean a change-of-state. Therefore, three thresholds were used and three states were determined: no peak with normal intensity, no peak with increased in intensity, or a peak. The low threshold value was 0.100g and the high threshold value was 0.190g. The threshold for the peak was set to 0.320g. A DT algorithm was used to determine increases in intensity and peak detection. illustrates the DT algorithm flowchart applied to the SMA feature. When a peak was detected, the next data window was not classified as a peak again until the signal went below the low threshold. This avoided inappropriately switching from state “peak”, to state “no peak with increased in intensity”, and then to “no peak with normal intensity” since each Development of a Wearable Mobility Monitoring System 90 Development of the Prototype WMMS windows is independently analysed. However, if the transition was slow and a change happens across windows, it was possible to detect the state “no peak with increase in intensity” just before detecting the state “peak”. These false positives could be removed later with more offline processing. Signal Magnitude Area (SMA) of acceleration signals versus Time Figure 7.7: SMA of a person walking then sitting, standing up, walking, lying down on a bed, getting up from the bed, lying on the floor, and getting up again. A DT algorithm was used to determine increases in intensity and peak detection. Figure 7.8 illustrates the DT algorithm flowchart applied to the SMA feature. When a peak was detected, the next data window was not classified as a peak again until the signal went below the low threshold. This avoided inappropriately switching from state “peak”, to state “no peak with increased in intensity”, and then to “no peak with normal intensity” since each windows is independently analysed. However, if the transition was slow and a change happens across windows, it was possible to detect the state “no peak with increase in intensity” just before detecting the state “peak”. These false positives could be removed later with more offline processing. Development of a Wearable Mobility Monitoring System 91 Development of the Prototype WMMS During preliminary testing of the SMA algorithm, it was also observed that the state “no peak with increase in intensity” would occur during riding in a car. This false state was detected with the car’s stop-and-go motion, at a stop sign. Since an increase in intensity should happen when the person is moving, another threshold to verify that the person was in a certain active state was added to the algorithm. The algorithm verified that the standard deviation was above 0.1g in order to detect the state “no peak with increase in intensity”. Figure 7.8: Flowchart of the SMA algorithm. 7.3 Light The light sensor on the external board measured light intensity of the ambient environment. Light intensity level detected indoor and outdoor states during the day. During preliminary hardware testing, the light sensor was calibrated with different light conditions (Table 6.2 in Section 6.2.7). From those results, it was estimated that a high threshold of 1000 mV and a Development of a Wearable Mobility Monitoring System 92 Development of the Prototype WMMS low threshold of 300 mV would differentiate outdoor from indoor states during the day. The same DT algorithm as the one applied to the standard deviation was applied to the light intensity feature (Figure 7.3). However, during preliminary testing while driving, many false changes of state were recorded due to the light intensity changes. To remove those false changes-of-state, the DT algorithm was only applied to the light intensity feature when the state was not detected as riding in a vehicle. Light intensity versus Time Figure 7.9: Example of the light intensity feature signal while performing mobility tasks indoors and outdoors. 7.4 GPS GPS data have been used in mobility monitoring to complement motion data, improve activity recognition, and provide contextual data (Section 2.3.4.5). Therefore, the GPS location coordinates and speed were collected and added to the WMMS output file. Development of a Wearable Mobility Monitoring System 93 Development of the Prototype WMMS GPS data were provided by the BlackBerry Bold. Both data were extracted every 9 seconds, using the Java locationListener interface. The speed value was based on the Doppler Effect as explain in Section 2.3.4.5. For this WMMS prototype, only the speed was considered for the change-of-state detection algorithm. The speed feature was added for its potential to detect if the person is in a vehicle such as car, bus, train, and so on. This feature was passed through a DT algorithm such as the one used for standard deviation. The low threshold value was set to 1 m/s and the high threshold value was set to 7 m/s. With this algorithm, a change-of-state could be triggered when the car stops at a stop sign or slows down sufficiently. However, since the GPS data is refreshed every 9 seconds, the algorithm might miss some stopping instances. This could help in decreasing false positive changes-of-state while riding in a car. 7.5 Unused Features Other features have been generated from the accelerometer data, but were not used in the algorithm to detect changes-of-state. The correlation between x and y, y and z, and x and z were generated. The correlation values have been used by Ravi et al. [96] since these features could detect activities that involve translations in one dimension (i.e. differentiation walking from going up/down stairs). However, in our research with a window of 1.02 seconds, correlation values did not help to detect stairs. In the work from Ravi et al., the correlation values were calculated over a window of 5.12 seconds. This window size was not adequate for our research since we wanted real-time processing. Further data processing using correlation values could be done offline in the future. The skewness value of the forward axis (z-axis) and the kurtosis of the vertical axis (y-axis) were also calculated. The z-axis skewness was used by Baek et al. [141] to differentiate between walking/going up stairs from running. Baek et al. also used kurtosis to detect upstairs/downstairs from walking/running. From preliminary work in this thesis, these two features were combined with y-axis skewness to try and to improve upstairs detection and decrease the number of false positive. However, combining these two extra features was Development of a Wearable Mobility Monitoring System 94 Development of the Prototype WMMS ineffective. Therefore, they were not added in the algorithm but were kept in the output file for further data processing. For further data processing purposes, other features kept in the output file are the mean value of the body acceleration of all three axes, the temperature and humidity, and the GPS location coordinates. 7.6 Determination of State and Change-of-State The algorithm developed determined the user’s state every 1.02 seconds and compared the current state with previous states to determine if a change-of-state occurred. The features extracted from the acceleration signals, GPS speed, and the light intensity were used to set the bits of an 8-bit number, representing the user’s state: STA-DYN STAIRS STAND LIE GPS LIGHT SMA-PEAK SMA-INT If the state was 160 in decimal value, which gives 10100000, the person was moving and in a standing position. Table 7.1 describes each bit. A flowchart including all selected features and their methods to determine the user’s state is presented in Figure 7.10. A change-of-state was determined by subtracting the three previous states from the current state. If the answer was different from zero for one of the subtractions, a change-of-state had occurred. As a result of a change-of-state, the algorithm determined if a picture should be taken. Development of a Wearable Mobility Monitoring System 95 Development of the Prototype WMMS Table 7.1: Description of the state bits. BIT NAME STA-DYN STAIRS STAND LIE Definition Standard deviation of y-axis to determine if static or dynamic Skewness of y-axis to determine if going up/down stairs Inclination angle indicating standing position Inclination angle indicating lying position Description If 0, person in static mode (not moving); if 1, person in dynamic mode (moving) If 0, person is walking; if 1, person is walking up/down stairs If 0, person is not in standing position; if 1, person is in standing position If 0, person is not in standing position; if 1, person is in standing position If 0, person is walking; GPS GPS speed LIGHT Light intensity value SMA-PEAK SMA peak detection if 1, person could be in vehicle. If 0, person is inside; if 1, person could be outside If 0, no peak in SMA; SMA-INT SMA intensity if 1, peak occurred and person might be sitting, or getting up If 1, increased in acceleration intensity If 0, back to normal intensity Development of a Wearable Mobility Monitoring System 96 Development of the Prototype WMMS Figure 7.10: State determination algorithm. DT stands for “double threshold”. Development of a Wearable Mobility Monitoring System 97 Development of the Prototype WMMS From the camera performance test in Chapter 6, approximately 0.7 second was required to take a picture and the BlackBerry Bold camera needed another 0.9 second before it was ready to take another picture. During that time, the BlackBerry Bold was busy and no data was received and processed, causing the data to accumulate in a buffer. The affected timing could be demonstrated by observing the time frame of every window of data from the WMMS output file as presented in Table 7.2. The section of the WMMS output file in Table 7.2 was recorded with a sampling rate of 50 Hz and a window size of 1.02 seconds. It can be observed that the elapsed time is approximately 1 second when no picture is taken and an extra second is added after a picture is taken. Another observation is that the second window of data after a picture is taken is smaller, but by the third window, the timing is back to normal. Therefore, it was decided to wait at least 2 windows (or 2.04 seconds) before taking another picture (i.e., 3 seconds later). Table 7.2: Section of a WMMS output file to demonstrate timing of the picture taken. Time Frame (s) Elapsed Time from previous window (s) Image Name or “0” if no image taken State of the User 0 0.978 2.057 3.053 5.09 5.269 6.078 7.055 8.093 9.111 10.129 11.147 12.964 13.183 14.18 15.987 16.207 17.185 18.232 19.23 20.248 21.207 22.204 23.262 0 0.978 1.079 0.996 2.037 0.179 0.809 0.977 1.038 1.018 1.018 1.018 1.817 0.219 0.997 1.807 0.22 0.978 1.047 0.998 1.018 0.959 0.997 1.058 0 0 0 IMAGE9 0 0 0 0 0 0 0 IMAGE10 0 0 IMAGE11 0 0 0 0 0 0 0 0 0 100000 100000 100000 10100000 10100000 10100000 10100000 10100000 10100000 10100000 10100000 10100001 100010 10 0 0 0 0 0 0 0 0 0 0 Development of a Wearable Mobility Monitoring System Picture taken Ready to take picture again Picture taken Ready to take picture again and picture taken Ready to take picture again 98 Development of the Prototype WMMS 7.7 Software development The software part of the WMMS was developed using Java Eclipse and the BlackBerry Java Development Environment component package version 4.6.1. The Java application was then uploaded to the BlackBerry platform through the BlackBerry Desktop Manager. The BlackBerry APIs (application programming interface) and the Java packages that were used for this Java application are [193]: • net.rim.device.api.bluetooth to initiate a Bluetooth serial port connection and to write and read data from the port, • net.rim.device.api.math.Fixed32 to execute specific math functions such as arctan2, • net.rim.device.api.ui to provide functionality to construct the user interface, • net.rim.device.api.util to provide utility methods and interfaces, such as arrays and data buffer, • net.rim.device.api.system to provide system-level functionality such as the control of the BlackBerry backlight and information on the battery level status, • javax.microedition.io.Connector and javax.microedition.io.FileConnection to copy data and images to output files stored on SDcard or device memory, • javax.microedition.media to take picture with the BlackBerry Bold integrated camera, • javax.microedition.location with the LocationListener interface to obtain GPS location coordinates and speed, • java.io to provide system input and output to data stream, • java.lang.math for other math functions such as squared root, and absolute value. Additionally, the BlackBerry data encryption built-in option was selected to ensure privacy and security of the data. Encryption was set so that reading and downloading the output file from the BlackBerry to the computer required a password, as well as the same handheld device used to store the data. The use of the BlackBerry Bold was also password protected. An overview of the programming flow chart for the WMMS Java application is presented in Figure 7.11. The BluetoothListener interface from the Bluetooth API, had a built-in method Development of a Wearable Mobility Monitoring System 99 Development of the Prototype WMMS called datareceived(), that was automatically run when data was detected on the Bluetooth port. When data were received, our data processing method was run. Every received byte was processed before reading more data from the Bluetooth port. The received bytes were first parsed to verify CRC (Cyclic Redundancy Check). If the CRC test passed, the data were parsed into six integer numbers: AccX, AccY, AccZ, Light, Temperature, Humidity, and Battery. At this point, depending on the selected option, the raw data could be copied in a circular queue, which could then be emptied by a separate thread to copy the data to a raw data output file stored on the BlackBerry SD card. The other option was to proceed with data processing. With the processing option selected, the acceleration integer values were calibrated, median filtered, and divided into the static and dynamic component using a low-pass filter. Calculation of different variables necessary to compute features as well as integration of acceleration signal were performed as well. When all the received bytes were processed, then more bytes were received on the Bluetooth port and the same process started again until the number of samples reached the selected window size. When one window of data was processed, other types of processing were performed. From the variables computed, the features were calculated. Then, these features were passed through the algorithm to determine the state and change-of-state of the user. From the change-of-state result, another Java function determined if a picture should be taken. Finally, an output sample object was created, which contained all the features computed, image name, user state, GPS data, and time frame. This sample object was put in a circular queue, which was emptied by a separate thread that copied the data to an output file stored on the BlackBerry SD card. Development of a Wearable Mobility Monitoring System 100 Development of the Prototype WMMS Figure 7.11: Overview of programming flow. Development of a Wearable Mobility Monitoring System 101 Development of the Prototype WMMS 7.8 Summary The prototype WMMS was designed to determine a user’s state, detect changes-of- state, and take a picture when a change-of-state occurred. The data used in the algorithm were coming from the external board and the BlackBerry. The raw acceleration signal was divided into its dynamic and static components using a digital low-pass filter. Signal features were extracted from these two components and then input to the algorithm. The features selected for this prototype WMMS were standard deviation of the y-axis acceleration, inclination angle, skewness of the y-axis acceleration, signal magnitude area (SMA), light intensity, and GPS speed. The standard deviation was selected to detect changes-of-state caused by start/stop actions; the inclination angle detected postural changes; skewness detected changes-of-state caused by walking on stairs; SMA detected a change in movement intensity and postural transition; light intensity differentiated between indoor and outdoor states; and GPS speed detected when a person was riding in a vehicle. The user’s state was determined for every data window of 1.02 seconds. When a change-ofstate was detected, a picture was taken. However, due to the limitations of the BlackBerry camera (Chapter 6), the WMMS had to wait at least 2.04 seconds before being able to take another a picture. Therefore, the current state was compared with the three previous states to determine if a change-of-state happened. The prototype WMMS software application was developed using the Java Development Environment and API version 4.6.1. All WMMS output data were saved to the BlackBerry SD card. Development of a Wearable Mobility Monitoring System 102 Technical and Mobility Evaluation of the Prototype WMMS Chapter 8: Technical and Mobility Evaluation of the Prototype WMMS The WMMS evaluation was divided into two main parts: the technical evaluation and the mobility evaluation. The technical evaluation examined the BlackBerry battery and the data loss. The purpose of the mobility evaluation was to evaluate the performance of the WMMS for detecting changes-of-state. The mobility evaluation was also to evaluate the pictures taken by the WMMS for their usefulness in determining context associated with the mobility tasks. The following describes the method for the WMMS evaluations. 8.1 Technical Evaluation The battery life of the BlackBerry Bold while running the full application (GPS, data processing, camera) was evaluated using the Java command DeviceInfo.getBatteryLevel(). This Java command was called every minute inside the WMMS application to verify the battery level of the BlackBerry. Five trials were run and the results are presented in Table 8.1. The starting and ending battery levels were the first and last battery level value captured during a trial, respectively. Total battery usage was calculated by subtracting the ending level from the starting level and dividing by the starting level. Then, the battery usage per hour was calculated by dividing the total battery usage with the total time of the trial. The battery usage averaged 29% per hour. Figure 8.1 give an example of one of the batteryvoltage curve obtained during this evaluation. Table 8.1 presents the trials results. During battery tests, data loss was also evaluated. No data loss were observed in any of the trials. Development of a Wearable Mobility Monitoring System 103 Technical and Mobility Evaluation of the Prototype WMMS Table 8.1: Results for the BlackBerry Bold battery evaluation. Starting Battery Level (%) Ending Battery Level (%) Total Time (hours) Total Battery Usage (%) Battery Usage per hour (%/hour) Trial 1 100 58 1.54 42 27 Trial 2 100 2 3.23 98 30 Trial 3 99 6 3.20 94 29 Trial 4 100 6 3.12 94 30 Trial 5 100 6 3.12 94 30 Battery usage curve of the BlackBerry Bold versus time 100 90 80 B attery L evel (% ) 70 60 50 40 30 20 10 0 0.00 0.25 0.50 0.75 1.00 1.25 1.50 1.75 2.00 2.25 2.50 2.75 3.00 3.25 T ime (hours ) Figure 8.1: BlackBerry battery with full WMMS application running (Trial 2). Development of a Wearable Mobility Monitoring System 104 Technical and Mobility Evaluation of the Prototype WMMS 8.2 Mobility Evaluation 8.2.1 Subjects A sample of five subjects (3 males, 2 females; age: 36.6 ± 6.4 years; height: 173.8 ± 13.2 cm; weight: 69.3 ± 16.1 kg) was recruited from the staff at The Ottawa Hospital Rehabilitation Center, Ottawa, Canada and the community. Consent forms were obtained from all the participants prior to the trial. People with injuries or a gait deficit were excluded at this stage of the testing. All the participants were able-bodied without abnormal gait patterns. 8.2.2 Data Collection Data collection took placed inside The Ottawa Hospital Rehabilitation Center (hallways, elevator, stairs, and Rehabilitation Technology Lab) and outside The Ottawa Hospital Rehabilitation Center, on the paved pathway. The last part of the data collection involved taking a car ride as a passenger or driver, around the Ottawa Hospital campus, on the Ring road. The subjects were asked to wear the WMMS on their waist, attached on a belt, on their right hip with the device pointing forward. No additional instructions were given for positioning the instrumented holster. The subjects were asked to follow a pre-determined path with a series of mobility tasks. Each subject followed verbal instructions indicating the next mobility task. For every trial, the subjects were filmed with a digital camera. The digital camera was synchronized with the WMMS by having the subject to block the light sensor with their hand for 5 seconds when starting data collection. Digital video was necessary to validate change-of-state detection, to determine the change-of-state timing, and to provide context information. The following is the list of tasks that the subjects were asked to perform. The list is divided to facilitate video time-segmenting of the different tasks: Development of a Wearable Mobility Monitoring System 105 Technical and Mobility Evaluation of the Prototype WMMS 1. From standing position, walk for 25 meters. a. Initiation: Start of forward walking progression b. Termination: End of forward walking progression 2. Transition walk to stand-to-sit transition a. Initiation: End of forward walking progression b. Termination: Initiation of hip flexion at the start of stand-to-sit transition 3. Stand-to-sit transition a. Initiation: Initiation of hip flexion at the start of stand-to-sit transition b. Termination: Seated position on chair 4. Sitting for 30 seconds a. Initiation: Seated position on chair b. Termination: Initiation of trunk flexion and buttock lifting from chair 5. Sit-to-stand transition a. Initiation: Initiation of trunk flexion and buttock lifting from chair b. Termination: Standing position 6. Transition Sit-to-stand transition to walk a. Initiation: Standing position b. Termination: Start of forward walking progression 7. Walk 60 meters until the elevator a. Initiation: Start of forward walking progression b. Termination: End of forward walking progression and moving to press elevator button 8. Transition walk to wait for elevator a. Initiation: End of forward walking progression and moving to press elevator button b. Termination: Standing 9. Standing waiting for elevator a. Initiation: Standing b. Termination: Start of forward walking progression to get inside the elevator 10. Get in the elevator a. Initiation: Start of forward walking progression to get inside the elevator b. Termination: Standing inside the elevator 11. Take the elevator to the second floor a. Initiation: Standing inside the elevator b. Termination: Start of forward walking progression to get outside the elevator 12. Get out of the elevator and walk 15 meters a. Initiation: Start of forward walking progression to get outside the elevator b. Termination: End of forward walking progression 13. Turn around a. Initiation: End of forward walking progression b. Termination: Facing elevator 14. Transition turn around to walk a. Initiation: Facing elevator b. Termination: Start of forward walking progression 15. Walk 15 meters towards the elevator a. Initiation: Start of forward walking progression b. Termination: End of forward walking progression and moving to press elevator button 16. Transition walk to wait for elevator a. Initiation: End of forward walking progression and moving to press elevator button b. Termination: Standing Development of a Wearable Mobility Monitoring System 106 Technical and Mobility Evaluation of the Prototype WMMS 17. Standing waiting for elevator a. Initiation: Standing b. Termination: Start of forward walking progression to get inside the elevator 18. Get in the elevator a. Initiation: Start of forward walking progression to get inside the elevator b. Termination: Standing inside the elevator 19. Take the elevator to the first floor a. Initiation: Standing inside the elevator b. Termination: Start of forward walking progression to get outside the elevator 20. Walk 50 meters towards the stairwell a. Initiation: Start of forward walking progression get outside the elevator b. Termination: Start pushing on the door of the stairwell 21. Open door and enter stairwell a. Initiation: Start pushing on the door of the stairwell b. Termination: Lead leg contacts a stair 22. Walk up stairs (13 steps) a. Initiation: Lead leg contacts a stair b. Termination: Trail leg off of last stair 23. Walk on stair intermediate landing (level ground for approx 1.5 meter) a. Initiation: Trail leg off of last stair b. Termination: Lead leg contacts a stair 24. Walk up stairs (13 steps) a. Initiation: Lead leg contacts a stair b. Termination: Trail leg off of last stair 25. Open door and turn right a. Initiation: Trail leg off of last stair b. Termination: Exit stairwell with start forward walking progression 26. Walk 15 meters a. Initiation: Exit stairwell with start forward walking progression b. Termination: End of forward walking progression 27. Turn around a. Initiation: End of forward walking progression b. Termination: Facing opposite direction 28. Transition turn around to walk a. Initiation: Facing opposite direction b. Termination: Start of forward walking progression 29. Walk 15 meters towards the stairwell a. Initiation: Start of forward walking progression b. Termination: Start pushing on the door of the stairwell 30. Open door and enter stairwell a. Initiation: Start pushing on the door of the stairwell b. Termination: Lead leg contacts a stair 31. Walk down stairs (16 steps) a. Initiation: Lead leg contacts a stair b. Termination: Trail leg off of last stair 32. Walk on stair intermediate landing (level ground for approx 1.5 meter) a. Initiation: Trail leg off of last stair b. Termination: Lead leg contacts a stair Development of a Wearable Mobility Monitoring System 107 Technical and Mobility Evaluation of the Prototype WMMS 33. Walk down stairs (13 steps) a. Initiation: Lead leg contacts a stair b. Termination: Trail leg off of last stair 34. Open door and turn right a. Initiation Trail leg off of last stair b. Termination: Start forward walking progression outside the stairwell 35. Walk 20 meters inside the Rehab Technology Lab toward the bed a. Initiation: Start forward walking progression outside the stairwell b. Termination: End of forward walking progression 36. Transition walk to stand-to-lie transition a. Initiation: End of forward walking progression b. Termination: Initiation of hip flexion at the start of stand-to-lie transition 37. Stand-to-lie transition a. Initiation: Initiation of hip flexion at the start of stand-to-lie transition b. Termination: Lying position on bed 38. Lying on back for 30 seconds a. Initiation: Lying position on bed b. Termination: Initiation of upper body movement off the bed at the start of lie-to-stand transition 39. Lie-to-stand transition a. Initiation: Initiation of upper body movement off the bed at the start of lie-to-stand transition b. Termination: Standing position 40. Transition lie-to-stand transition to walk a. Initiation: Standing position b. Termination: Start of forward walking progression 41. Walk 30 meters towards the hall way and keep walking in left direction a. Initiation: Start of forward walking progression b. Termination: End of forward walking progression 42. Turn around a. Initiation: End of forward walking progression b. Termination: Facing opposite direction 43. Transition turn around to walk a. Initiation: Facing opposite direction b. Termination: Start of forward walking progression 44. Walk 25 meters inside the Rehab Technology towards the ramp a. Initiation: Start of forward walking progression b. Termination: Lead leg contacts the ramp 45. Walk up the ramp a. Initiation: Lead leg contacts the ramp b. Termination: End of forward walking progression on the ramp 46. Turn around a. Initiation: End of forward walking progression b. Termination: Facing opposite direction 47. Transition turn around to walk a. Initiation: Facing opposite direction b. Termination: Lead leg contacts the ramp 48. Walk down the ramp a. Initiation: Lead leg contacts the ramp b. Termination: Lead leg contacts level ground Development of a Wearable Mobility Monitoring System 108 Technical and Mobility Evaluation of the Prototype WMMS 49. Walk 15 meters towards the exit door a. Initiation: Lead leg contacts level ground b. Termination: End of forward walking progression and start pushing on the door to go outside 50. Open the door to go outside and transition inside to outside a. Initiation: End of forward walking progression and start pushing on the door to go outside b. Termination: Person standing outside 51. Transition open door to walk a. Initiation: Person standing outside b. Termination: Start of forward walking progression 52. Walk 60 meters on paved path way towards the front door a. Initiation: Start of forward walking progression b. Termination: Pulling on the door to go inside 53. Open the door to go inside and transition outside to inside a. Initiation: Pulling on the door to go inside b. Termination: Person standing inside 54. Transition open door to walk a. Initiation: Person standing inside b. Termination: Start of forward walking progression 55. Walk 20 meters a. Initiation: Start of forward walking progression b. Termination: End of forward walking progression 56. Turn around a. Initiation: End of forward walking progression b. Termination: Facing opposite direction 57. Transition turn around to walk a. Initiation: Facing opposite direction b. Termination: Start of forward walking progression 58. Walk 20 meters towards the front door a. Initiation: Start of forward walking progression b. Termination: Inside stepping outside 59. Transition inside to outside (automatic door) a. Initiation: Inside stepping outside b. Termination: Start of forward walking progression 60. Walk 30 outside towards the car a. Initiation: Start of forward walking progression b. Termination: End of forward walking progression when arrive at the car 61. Transition walk to open car door a. Initiation: End of forward walking progression when arrive at the car b. Termination: Start opening car door 62. Opening car door a. Initiation: Start opening car door b. Termination: Initiation of hip flexion at the start of stand-to-sit transition 63. Stand-to-sit transition (get in the car) a. Initiation: Initiation of hip flexion at the start of stand-to-sit transition b. Termination: Seated position in the car 64. Sitting in the car a. Initiation: Seated position in the car b. Termination: Seated position, start to open the door. Development of a Wearable Mobility Monitoring System 109 Technical and Mobility Evaluation of the Prototype WMMS 65. Car ride – one loop around the Ottawa Hospital campus (Ring Road) a. Initiation: Car starts moving b. Termination: Car is in park mode 66. Opening car door to get out a. Initiation: Seated position, start to open the door. b. Termination: From seated position, initiation of trunk flexion and buttock lifting from car seat 67. Sit-to-stand transition (get out of the car) a. Initiation: From seated position, initiation of trunk flexion and buttock lifting from chair b. Termination: Standing position outside the car 68. Transition get out of the car to walk a. Initiation: Standing position outside the car b. Termination: Start of forward walking progression 69. Walk 30 meters towards the Ottawa Hospital Rehabilitation Center entrance a. Initiation: Start of forward walking progression b. Termination: End of forward walking progression 70. Transition outside to inside (automatic door) a. Initiation: Outside stepping inside b. Termination: Start of forward walking progression 71. Walk 5 meters a. Initiation: Start of forward walking progression b. Termination: End of forward walking progression 72. Turn around a. Initiation: End of forward walking progression b. Termination: Facing opposite direction 73. Standing a. Initiation: Facing opposite direction b. Termination: Standing 8.2.3 Data Analysis Data collected with the digital video camera was used to determine the time value of when a change-of-state occurred. The timing for all tasks were determined based on the initiation and termination details given in the list presented above. For this thesis, the possible changes-of-state caused by opening a door and turning around were not evaluated. These possible changes-of-state were not in the scope of this WMMS prototype. In addition, to be able to compare one trial to another, changes-of-state created by extra mobility tasks were removed from the evaluation (i.e., subject movements not related to the protocol). The following list is the mobility tasks that were included in the evaluation of the WMMS; going from one task to another should trigger a change-of-state, providing 38 changes-of-state per trial: Development of a Wearable Mobility Monitoring System 110 Technical and Mobility Evaluation of the Prototype WMMS 1. Standing 2. Walking on level ground 3. Stand-to-sit transition 4. Sitting 5. Sit-to-stand 6. Walking on level ground 7. Standing waiting for elevator 8. Walking to get in the elevator 9. Taking elevator to second floor 10. Walking to get out of elevator and keep walking on level ground 11. Standing waiting for elevator 12. Walking to get in the elevator 13. Taking elevator to first floor 14. Walking to get out of elevator and keep walking on level ground 15. Walking up stairs 16. Walking on stair intermediate landing (level ground for 1.5 meters) 17. Walking up stairs 18. Walking on level ground 19. Walking down stairs 20. Walking on stair intermediate landing (level ground for 1.5 meters) 21. Walking down stairs 22. Walking on level ground 23. Stand-to-lie transition 24. Lying 25. Lie-to-Stand transition 26. Walking on level ground 27. Walking on ramp 28. Walking on level ground 29. Transition indoor/outdoor and keep walking on level ground 30. Transition outdoor/indoor and keep walking on level ground 31. Transition indoor/outdoor and keep walking on level ground 32. Stand-to-sit transition to get in the car 33. Sitting in the car Development of a Wearable Mobility Monitoring System 111 Technical and Mobility Evaluation of the Prototype WMMS 34. Starts of car ride 35. Stop of car ride 36. Sit-to-stand transition 37. Walking on level ground 38. Transition outdoor/indoor and keep walking on level ground 39. Standing Changes-of-state timing from digital video was compared with the WMMS change-of-state timestamps. WMMS data output was analyzed window by window. All data windows were analysed to determine if the state for that window was a true or false negative. True positives occurred when a change-of-state occurred, the algorithm identified a change-of-state, and WMMS took a picture. False positives occurred when the algorithm identified a change-ofstate but there was no real change-of-state. True negatives occurred when there was no change-of-state and the algorithm did not detect a change-of-state. Finally, false negatives occurred when there was a change-of-state but the algorithm did not detect the change. The number of true and false positives and true and false negatives were used to calculate WMMS sensitivity and the specificity (Equations 8.1 and 8.2). Sensitivity = # TruePositives × 100 # TruePosives + # FalseNegatives (8.1) Specificity = # TrueNegatives × 100 # TrueNegatives + # FalsePositives (8.2) Two research assistants independently evaluated the BlackBerry Bold images. The evaluators were asked to identify the context (i.e. stairs, elevator, ramp, floor, outdoor, etc) from the digital images. Only the images taken due to a real change-of-state (true positives) were evaluated. The evaluators were given a list of context options to choose from. Figure 8.2 show an example of the spreadsheet that the evaluators filled out for every trial. The evaluators were not informed of the mobility tasks represented by the images prior to Development of a Wearable Mobility Monitoring System 112 Technical and Mobility Evaluation of the Prototype WMMS evaluation. The results from the two evaluators were then analyzed to determine if context was successfully identified from the pictures. Depending on the mobility task, context detection from the pictures was required to consider the context successfully identified. Table 8.2 gives the list of the context to identify for each mobility task. Context Indoor Picture Floor Ceiling Ramp Stairs Outdoor Door Elevator Other Grass Pavement In a Car Door Other Unknown IMAGE1 IMAGE2 IMAGE3 Figure 8.2: Example of the spreadsheet used by the pictures evaluators. Table 8.2: Changes-of-state and context to be identified from WMM pictures. Change of State Walking on level ground Context to identify Indoor, floor Stand-to-sit transition Indoor Sitting Indoor Sit-to-stand Indoor Walking on level ground Indoor, floor Standing waiting for elevator Indoor Walking to get in the elevator Indoor, elevator Taking elevator to 2 floor Indoor, elevator Walking to get out of elevator and keep walking on level ground Indoor, floor Standing waiting for elevator Indoor Walking to get in the elevator Indoor, elevator Taking elevator to 1 floor Indoor, elevator Walking to get out of elevator and keep walking on level ground Development of a Wearable Mobility Monitoring System Indoor, floor 113 Technical and Mobility Evaluation of the Prototype WMMS Walking up stairs Walking on stair intermediate landing (level ground for 1.5 meter) Indoor, stairs Indoor, floor or stairs Walking up stairs Indoor, stairs Walking on level ground Indoor, floor Walking down stairs Indoor, stairs Walking on stair intermediate landing (level ground for 1.5 meter) Indoor, floor or stairs Walking down stairs Indoor, stairs Walking on level ground Indoor, floor Stand-to-lie transition Lying Lie-to-Stand transition Indoor Indoor, ceiling Indoor Walking on level ground Indoor, floor Walking on ramp Indoor, ramp Walking on level ground Indoor, floor Transition indoor/outdoor and keep walking on level ground Outdoor, pavement Transition outdoor/indoor and keep walking on level ground Indoor, floor Transition indoor/outdoor and keep walking on level ground Outdoor, pavement Stand-to-sit transition to get in the car Outdoor Sitting in the car Outdoor, car Starts of car ride Outdoor, car Stop of car ride Outdoor, car Sit-to-stand transition Walking on level ground Transition outdoor/indoor and keep walking on level ground Standing Outdoor Outdoor, pavement Indoor, floor Indoor 8.2.4 Change-of-State Detection Results For every trial, WMMS sensitivity and specificity were calculated. The average values for each subject and the overall values are given in Table 8.3. An overall sensitivity of Development of a Wearable Mobility Monitoring System 114 Technical and Mobility Evaluation of the Prototype WMMS 77.7% (± 2.5%) and a specificity of 96.4% (± 2.2%) were obtained. Sensitivity and specificity results for each trial are given in Appendix B. The sensitivity and the specificity were also calculated for each of the mobility tasks and are given in Table 8.4. Results per mobility task for each trial are given in Appendix C. The lowest performances were obtained for going up stairs (13.3%), walking on a ramp (40.0%), and transitioning from indoor to outdoor (46.7% for the first time going outside and 20.0% for the second time going outside), and outdoor to indoor (46.7% for first time going inside and 26.7% for second time going inside). For the first outdoor activity, the subjects walked through an unobstructed courtyard. In the second outdoor scenario, the subjects walked under a building overpass to the car. Lighting was different between the two scenarios. The subjects were walking indoors before and after these four activities. Therefore, if a change-of-state was not detected, the following “walking indoor change-of-state” was also not identified, since the system believed that the subject was still walking indoors. This resulted in lower performance values. If these low results were to be removed from the overall performance, a sensitivity of 93.2% (± 12.0 %) would have be measured. Very good algorithm performance was obtained for detecting changes-of-state produced by start/stop motions (sensitivity of 97.4% (± 5.3%)). Furthermore, as opposed to walking up stairs, walking down stairs was detected at 100.0%. However, the stair intermediate landing was not always detected, causing the lower stair section to have a sensitivity of 66.7%. However, the lower section would still be considered as stair descent since the state would not have changed from the upper stair section. A sensitivity of 97.8% (± 4.7%) was found for the change-of-state caused by postural change (i.e., stand-to-sit, sitting, sit-to-stand, lying, etc.). The start and stop of the car ride was detected at 66.7% and 64.3%, respectively. These results depended on the BlackBerry detecting the GPS satellites. Development of a Wearable Mobility Monitoring System 115 Technical and Mobility Evaluation of the Prototype WMMS Table 8.3: Summary performance results for the each subject. Subject Sensitivity (% Average ± %Standard deviation) Specificity (% Average ± %Standard deviation) 1 75.4 ± 4.0 96.4 ± 0.4 2 79.7 ± 2.9 93.3 ± 0.7 3 75.4 ± 1.5 96.7 ± 1.1 4 80.9 ± 8.6 96.1 ± 1.6 5 77.2 ± 1.5 99.5 ± 0.5 Overall 77.7 ± 2.5 96.4 ± 2.2 Table 8.4: Performance results for each of the mobility tasks Change of State True Positive False Negative Sensitivity Walking on level ground 15 0 100.0% Stand-to-sit transition 14 1 93.3% Sitting 15 0 100.0% Sit-to-stand 15 0 100.0% Walking on level ground 15 0 100.0% Standing waiting for elevator 14 0 100.0% Walking to get in the elevator 12 2 85.7% Taking elevator to 2 floor 13 2 86.7% Walking to get out of elevator and keep walking on level ground 15 0 100.0% Standing waiting for elevator 15 0 100.0% Walking to get in the elevator 15 0 100.0% Taking elevator to 1 floor 15 0 100.0% Walking to get out of elevator and keep walking on level ground 15 0 100.0% Walking up stairs 2 13 13.3% Development of a Wearable Mobility Monitoring System 116 Technical and Mobility Evaluation of the Prototype WMMS Walking on stair intermediate landing (level ground for 1.5 meters) 6 9 40.0% Walking up stairs 6 9 40.0% Walking on level ground 4 11 26.7% Walking down stairs 15 0 100.0% Walking on stair intermediate landing (level ground for 1.5 meters) 10 5 66.7% Walking down stairs 10 5 66.7% Walking on level ground 15 0 100.0% Stand-to-lie transition 15 0 100.0% Lying 15 0 100.0% Lie-to-Stand transition 15 0 100.0% Walking on level ground 15 0 100.0% Walking on ramp 6 9 40.0% Walking on level ground 7 8 46.7% 7 8 46.7% 7 8 46.7% 3 12 20.0% Stand-to-sit transition to get in the car 15 0 100.0% Sitting in the car 15 0 100.0% Starts of car ride 10 5 66.7% Stop of car ride 9 5 64.3% Sit-to-stand transition 13 2 86.7% Walking on level ground 14 1 93.3% Transition outdoor/indoor and keep walking on level ground 4 11 26.7% Standing 14 0 100.0% Transition indoor/outdoor and keep walking on level ground Transition outdoor/indoor and keep walking on level ground Transition indoor/outdoor and keep walking on level ground Development of a Wearable Mobility Monitoring System 117 Technical and Mobility Evaluation of the Prototype WMMS 8.2.5 BlackBerry Image Evaluation Results Two evaluators evaluated each picture taken for true positive changes-of-state. Table 8.5 gives the percentage of pictures where each evaluator identified the context successfully. An overall percentage of 74.3% (± 1.9%) was obtained. The results from each evaluator, for each of the trials, are given in Appendix D. Some contexts were frequently identified from the images (> 95%). Most successful image categorizations happened during good light condition and when fewer details had to be identified in the image (i.e., indoor). Walking while in the Rehab Technology Lab, which was a darker room, had 53.3% success rate for walking on level ground after getting up from the bed and 42.9% for walking on level ground after walking on the ramp. Also in the lab, the ramp was not well identified at 16.7%. Walking in the elevator had low results as well, 15.4% for the elevator going up and 21.4% the elevator going down. However, standing in the elevator obtained 75.0% for going up and 71.4% for going down. For walking up stairs, the stairs could be identified from seven images out of eight for one evaluator and all eight images for the other evaluator. However, the WMMS pictures were unable to identify stairs descent. For images taken while sitting in a car, the vehicle context was identified at 86.7%. The pictures taken during the start of the car ride obtained a result of 100.0%. For the end of the car ride, after the car stopped, pictures was not always taken while sitting in the car due to the GPS sampling rate (i.e., the 9-second GPS analysis interval created a delay where the picture would be taken after the person left the car and was already starting to walk). Therefore, the evaluators had to identify the type of ground for those particular images. The success rate was 84.4%. Identifying the context from the images taken during the transition from outdoor/indoor were low at 57.1% for the first time going inside and 37.5% for the second time. The success rate for the indoor/outdoor transitions were better with 85.7% for the first time going outside and 100.0% the second time. The low results for the transition outdoor/indoor could be caused from the decreased light intensity when approaching the door of the building from outside. Development of a Wearable Mobility Monitoring System 118 Technical and Mobility Evaluation of the Prototype WMMS Outdoor/indoor transitions sometimes happened before the person actually stepped inside, which made identifying indoor or outdoor very difficult. Table 8.5: Summary results for the picture evaluation. Total Number of Pictures Evaluator 1 Evaluator 2 Average Standard deviation Walking on level ground 15 93.3% 86.7% 90.0% 4.7% Stand-to-sit transition 14 92.9% 100.0% 96.4% 5.1% Sitting 15 93.3% 100.0% 96.7% 4.7% Sit-to-stand 15 100.0% 100.0% 100.0% 0.0% Walking on level ground 15 73.3% 93.3% 83.3% 14.1% Standing waiting for elevator 14 85.7% 100.0% 92.9% 10.1% Walking to get in the elevator 13 7.7% 23.1% 15.4% 10.9% Taking elevator to 2 floor 14 78.6% 71.4% 75.0% 5.1% Walking to get out of elevator and keep walking on level ground 15 100.0% 100.0% 100.0% 0.0% Standing waiting for elevator 15 93.3% 100.0% 96.7% 4.7% Walking to get in the elevator 14 7.1% 35.7% 21.4% 20.2% Taking elevator to 1 floor 14 85.7% 57.1% 71.4% 20.2% Walking to get out of elevator and keep walking on level ground 15 86.7% 86.7% 86.7% 0.0% Walking up stairs 2 100.0% 50.0% 75.0% 35.4% Walking on stair intermediate landing (level ground for 1.5 m) 6 100.0% 100.0% 100.0% 0.0% Walking up stairs 6 100.0% 100.0% 100.0% 0.0% Walking on level ground 4 75.0% 75.0% 75.0% 0.0% Walking down stairs 15 0.0% 0.0% 0.0% 0.0% Change of State Successfully identifying context Development of a Wearable Mobility Monitoring System 119 Technical and Mobility Evaluation of the Prototype WMMS Walking on stair intermediate landing (level ground for 1.5 m) 10 0.0% 0.0% 0.0% 0.0% Walking down stairs 10 0.0% 0.0% 0.0% 0.0% Walking on level ground 15 73.3% 73.3% 73.3% 0.0% Stand-to-lie transition 15 100.0% 100.0% 100.0% 0.0% Lying 15 100.0% 86.7% 93.3% 9.4% Lie-to-Stand transition 15 100.0% 100.0% 100.0% 0.0% Walking on level ground 15 60.0% 46.7% 53.3% 9.4% Walking on ramp 6 33.3% 0.0% 16.7% 23.6% Walking on level ground 7 42.9% 42.9% 42.9% 0.0% Transition indoor/outdoor and keep walking on level ground 7 100.0% 71.4% 85.7% 20.2% Transition outdoor/indoor and keep walking on level ground 7 71.4% 42.9% 57.1% 20.2% Transition indoor/outdoor and keep walking on level ground 3 100.0% 100.0% 100.0% 0.0% Stand-to-sit transition to get in the car 15 86.7% 80.0% 83.3% 4.7% Sitting in the car 15 93.3% 80.0% 86.7% 9.4% Starts of car ride 10 100.0% 100.0% 100.0% 0.0% Stop of car ride 9 88.9% 80.0% 84.4% 6.3% Sit-to-stand transition 13 92.3% 69.2% 80.8% 16.3% Walking outside on level ground 14 92.9% 73.3% 83.1% 13.8% Transition outdoor/indoor and keep walking on level ground 4 25.0% 50.0% 37.5% 17.7% Standing 14 100.0% 100.0% 100.0% 0.0% Total Number of Pictures 440 440 Total Number of Success 333 321 75.7% 73.0% 74.3% 1.9% Total Percentage of Successfully Identifying Context Development of a Wearable Mobility Monitoring System 120 Technical and Mobility Evaluation of the Prototype WMMS 8.3 Mobility Task Discussion As previously emphasized by the ICF model [18] and the Dimensions of Mobility from Patla and Shumway-Cook [1], accounting for the environmental factors during mobility assessment is important. Our results suggest that BlackBerry smartphones have great potential for community mobility monitoring. The integrated camera can capture information on the context / environment in which mobility events take place. Additionally, the BlackBerry had the necessary processing power to process and log data, run algorithms, collect GPS data, and take pictures, all without data loss. 8.3.1 Use of Images in WMMS Our approach of taking a photograph when a change-of-state occurred, demonstrated that mobility tasks such as taking an elevator or going up stairs could be identified from the images. For the photographs taken when the subjects took the elevator, the elevator context was identified from the images at 75.0% and 71.4% for going to the second floor and first floor, respectively. When entering the elevator, subjects usually stood and faced the door. A good image was usually obtained when the door was just starting to close. However, if an image was taken before the subject was facing the door, or if the door was already closed, the image was dark and not clear. These low quality images could be due to the BlackBerry camera not performing well under low-light conditions. A flash could have help, but the camera flash was not accessible through the Java API version 4.6. For stair ascent, the stairs context was identified in seven out of eight cases for one evaluator and all eight cases for the other evaluator. On the other hand, stairs could not be identified from images taken when walking down stairs. Since the camera was pointing forward from the pelvis, the WMMS did not provide the downward angle that would be required for viewing the stairs during downstairs walking. Using a wide-angle camera or a sphere camera could improve context identification by providing a larger view of the current environment. Having a short video of a few seconds, or being able to take multiple pictures of the same context, could potentially help in identifying the context. However, from our BlackBerry camera test (Chapter 6), a picture could only be taken every 1.5 seconds and that is with only Development of a Wearable Mobility Monitoring System 121 Technical and Mobility Evaluation of the Prototype WMMS the camera program running. When the full program for the WMMS was running, the shortest time interval to take a picture was every 3 seconds (Table 7.2). Results from images taken when walking on a ramp did not match the criterion level of accuracy. Similar to the points made above, possible reasons were the low-light condition at the ramp’s location and possibly the angle of view. In addition, when walking on a ramp, it might not be possible to see an inclination, especially if the image only shows a small section of the ramp. As suggested for stairs descent, short video and multiple pictures might contribute to better identification of the context. The car was well identified from the images taken. During mobility monitoring, this could provide contextual information on the type of vehicle the person was using (i.e., bus, train, car, etc.). As an example, if a person with mobility deficits takes the bus to go to the store or see friends instead of staying at home, this could suggest some level of community mobility independence. Our results from the image evaluation demonstrated that the walking surface (i.e., floor, pavement) could be identified from the images. From the study by Shummay-Cook et al. [21], terrain was one of the factors that differentiated an older adult with mobility disability and an older adult without such disabilities. The type of terrain is also an important factor in accidental falls (i.e., icy path, unlevel ground). Injurious falls are related to many health problems and are a leading cause of hospitalization in the elderly [194]. Adding instability detection and capturing information on the type of terrain could be a valuable feature for a WMMS to help understanding the underlying causes of falls and help with fall prevention. The use of images to capture context and environment in mobility monitoring could also help to monitor activity avoidance. Mobility disability has been characterized by a reduction in the number and type of environment challenges [60]. Activity avoidance could lead to a reduction of movement, which could lead to further deterioration in physical status and social interactions. Development of a Wearable Mobility Monitoring System 122 Technical and Mobility Evaluation of the Prototype WMMS 8.3.2 WMMS Change-of-State Detection Some of the methods used in this thesis to identify a user’s state replicate results from previous studies. For instance, Lyons et al. [149] obtained an accuracy of 97% to detect static or dynamic states using the standard deviation of the vertical axis of a thigh accelerometer. For our WMMS, we used the standard deviation of the vertical acceleration at the waist and were able to detect if the subject started/stopped moving with a sensitivity of 97.4% (± 5.3%). This is a good result, considering that the device holster was worn on a belt and not fixed-still to the person’s body. This finding suggests that a phone integrated with an accelerometer could detect changes from static to dynamic movement (i.e., start to walking, standing still, slowing down). We also used a double threshold algorithm instead of only one threshold, which provided a degree of variability in the signal and helped to decrease the number of false positive results. Changes-of-state due to postural change (i.e., stand-to-sit, sitting, lie-to-stand, etc.) were detected with a sensitivity of 97.8% (± 4.7%). These results compared favourably with previous studies, such as Karantonis et al. [9] where a 94.2% accuracy was found for detecting tasks related to postural orientation. Using threshold methods, Culhane et al. [148] detected sitting at 92%, standing at 95%, and lying at 98%. However, their results were obtained from two accelerometers (one on the trunk and one on the thigh). Even though our algorithm detected changes-of-state due to postural change, our approach was not evaluated for its accuracy to classify the posture. From our observations, our methods might not be precise enough to classify all posture. The way the WMMS was worn on the hip may have caused false positives during sitting and lying due to the device holster’s free movement, the leg pushing on the device, the person’s belt location, and sitting angle. However, our evaluation protocol provided a real-time situation where the mobility tasks were performed consecutively and freely, instead of performing discrete mobility tasks in a controlled laboratory setting [9]. Furthermore, to better validate our smartphone approach, only one accelerometer was used and our protocol did not control the fixation and location of the WMMS. Wearing the WMMS on the right hip, attached to the belt was the only requirement given to the subject. Development of a Wearable Mobility Monitoring System 123 Technical and Mobility Evaluation of the Prototype WMMS The change-of-state caused by walking on level ground to walking down stairs was detected at 100%. However, the stair intermediate landing was not detected all the time; therefore, the following walking down stairs was detected at a lower rate since it was considered the same stair descent event as the top stair section. If a subject was walking on stairs at a faster speed, the WMMS may not have enough time to detect a change within a one-second window. While the detection of stairs landing could be of interest, our currents methods did detect the entire stair descent. For walking up stairs, the WMMS performed poorly at detecting the change of state (13.3%). As with stair descent, skewness was used to detect stair ascent. The choice of the skewness feature was based on the work by Baek et al. [141], which obtained a classification rate of 93% for upstairs and 87% for down stairs. The evaluation by Baek et al. was performed on a single subject and involved the subject performing discrete tasks, as opposed to the real-world evaluation employed in this thesis. Therefore, the results from Baek et al. may have been overstated. Other differences with our methods are that the location of their accelerometer was worn on the lateral side of the pelvis instead of the front side. Baek et al. also used a 2-second window, more features, and more complex algorithms such as a neural network. To improve the stairs ascent detection, other time-domain features have been explored such as skewness of the forward axis and kurtosis (based on Baek et al. [141]), but they did not provide better results. A study by Ravi et al. [96] also suggested calculating correlation values between two axes to detect activity that involved 2D translations. Again, these values did not show improvement for detecting stairs ascent. Another method that could be explored is double-integration of the vertical acceleration to evaluate changes in height, triggering a change-of-state due to stairs or inclines. More complex algorithms could be added to the design, since the newer generation of smartphones have greatly enhanced processing power. Currently, literature is lacking on ramp detection using accelerometer signals. Therefore, the stair detection methods were explored for the ramp detection application (i.e., skewness). However, the skewness approach was poor for detecting a change of state from level ground walking to ramp ascent or descent. Since the evaluation was performed on subject with no physical disability, walking speed or gait pattern showed minimal change from walking on Development of a Wearable Mobility Monitoring System 124 Technical and Mobility Evaluation of the Prototype WMMS level ground to walking on the ramp (observed from video data). The ramp inclination angle was also moderate (approx 7-degree angle). In older populations or individuals with mobility disabilities, a slow/almost-stopping movement could be present before attempting walking up a ramp or even stairs. As mentioned earlier, our WMMS was accurate in detecting static and dynamic movement; therefore, a picture could be taken to help identifying the mobility task. Change in posture angle could be explored since pelvic tilt may be present as the person leans forward and backward during ramp ascent or descent. A change in height, such as proposed for stairs ascent, could be appropriate for larger inclines (i.e., hill). Adding other sensors could be explored as well. Sensors on the thigh or even the calf might give more biomechanical information when walking on a ramp. The light sensor was added to the WMMS to detect outdoor and indoor conditions. Our approach of selecting outdoor/indoor thresholds did not perform as well as anticipated. A change in light intensity level could have been a better measure instead of using fixed outdoor/indoor thresholds since changes could be detected on overcast/cloudy days. The smartphone approach worn at the waist might also have caused problems with the light sensor since the view could potentially be blocked by the user’s clothing. As seen in the images evaluation results, pictures could be used to detect indoors/outdoors. GPS speed was used to detect if a person was in a vehicle. For the trials where the GPS satellites were detected, the change caused by being in a vehicle was well detected. While the initiation of being in a vehicle can be identified using the camera images, WMMS classification was delayed by the 9-second sampling interval for GPS speed and the 7 m/s threshold. The main problem with the BlackBerry GPS during evaluation was the time required to detect satellites and initiate GPS data acquisition. Based on preliminary tests, the BlackBerry Bold 9000 could take 30 minutes to detect GPS satellites, depending on the exterior conditions. The BlackBerry was set to autonomous mode to detect location, which is slower but more precise than using cell-site mapping. For our WMMS, GPS speed was required for the detection of vehicle riding. Cell tower-based location could be investigated since location estimation occurs faster and would work indoors and in cloudy weather, although this method is of lower precision. Development of a Wearable Mobility Monitoring System 125 Technical and Mobility Evaluation of the Prototype WMMS 8.3.3 Limitations Some limitations of the study were that the BlackBerry Bold 9000 did not have an internal accelerometer. Since a smartphone with all necessary features was unavailable at the start of this thesis, an external board was added to the design. The external board could make the device slightly heavier and less comfortable for the user. There is also the possibility of losing the Bluetooth connection and missing important data. However, new smartphones have emerged that could solve this problem by providing raw acceleration data. GPS signals were not always present during data collection. A waiting period of more than 30 minutes to get signal was not always practical. Using cell-site methods to improve GPS detection should be explored. New smartphones could potentially perform better as well. BlackBerry Bold 9000 battery usage was 29% per hour (Table 8.1). This is not sufficient for long term monitoring because, at this rate, only 3 hours of monitoring can be expected. A larger capacity battery would be required for longer monitoring. Not using Bluetooth could potentially slow down the battery usage; however, accessing raw accelerometer data from the BlackBerry would be expected to draw additional power from the battery. BlackBerry camera performance showed that a picture could only be taken after 3 seconds (i.e., during the third one-second window). This delay may cause some images to miss details related to the mobility task. Additionally, the camera did not perform well under low light conditions, causing images to be blurry and dark. The location of WMMS on the body could be an issue for the camera and the light sensor. Since the WMMS was worn on the waist, the user’s clothes could cover the camera view and the light sensor unintentionally, especially during winter. Limitations during image evaluation were also present. All the images were always in order and the same scenes were evaluated for each trial. The evaluators could have become better at identifying the context from the pictures after evaluating results from several subjects. Development of a Wearable Mobility Monitoring System 126 Conclusion Chapter 9: Conclusion Maintaining independent mobility at home and in the community plays an important role in an individual’s independence, quality of life and health, and in the lives of their family and the people around them. Measuring mobility and the environment in which mobility events takes place can help with these roles. Our WMMS approach to respond to the need for community mobility assessment tools shows great potential. The BlackBerry handheld device proved to be a viable platform for this WMMS application. In addition to industry standard tools for development, secure communications, and image capture, the multitasking device demonstrated good capability for data capture, real-time processing, and data storage. Adding the camera to the WMMS suggested that images could help identify mobility tasks such as walking up stairs and taking an elevator. The images also helped to identify the type of ground or terrain, which is important for mobility monitoring. The algorithms developed to detect change-of-state were satisfactory; however, with increased processing power in the next generation of smartphones, more complex signal processing methods could be employed to improve results. Overall, our WMMS has good potential for community mobility monitoring. The smartphone approach provides an accessible and cost effective option that can easily be implemented in society. However, the limitations should be addressed to improve performance. Interesting future work exists for the WMMS. 9.1 Future Work Improvement to the change-of-state algorithm is necessary to detect going up stairs, the ramp, and the indoor/outdoor. Additional signal processing could be added offline to Development of a Wearable Mobility Monitoring System 127 Conclusion improve classification of the raw data. An automated process to identify context from the images can also be considered in future research. Developing a better software interface would be important, as well as post processing software for data and images, so that rehabilitation specialists could easily interpret the community mobility data. Implementing the change-of-state algorithm to the new generation of BlackBerry smartphones should be considered since new versions provide raw accelerometer data and improved camera performance. This will remove the need for the external board for the activities evaluated in this thesis. However, other external sensors could be integrated into the WMMS using the new WMMS software and Bluetooth communications, such as for pressure or electromyography analyses. Development of a Wearable Mobility Monitoring System 128 References References [1] A. E. Patla and A. Shumway-Cook, "Dimensions of mobility: Defining the complexity and difficulty associated with community mobility," Journal of Aging and Physical Activity, vol. 7, pp. 7-19, 1999. [2] Statistics Canada. (2007). Participation and Activity Limitation Survey 2006: Analytical Report. Minister of Industry, Ottawa. [Online] Available: http://dsppsd.pwgsc.gc.ca/collection_2007/statcan/89-628-X/89-628-XIE2007002.pdf [Accessed: 25 Nov. 2009]. [3] T. Lam, V. K. Noonan and J. J. Eng, "A systematic review of functional ambulation outcome measures in spinal cord injury," Spinal Cord, vol. 46, pp. 246-254, 2008. [4] R. Corrigan and H. McBurney, "Community ambulation: Environmental impacts and assessment inadequacies," Disability and Rehabilitation, vol. 30, pp. 1411-1419, 2008. [5] M. Ermes, J. Pärkkä, J. Mäntyjärvi and I. Korhonen, "Detection of daily activities and sports with wearable sensors in controlled and uncontrolled conditions," IEEE Transactions on Information Technology in Biomedicine, vol. 12, pp. 20-26, 2008. [6] C. N. Scanaill, S. Carew, P. Barralon, N. Noury, D. Lyons and G. M. Lyons, "A review of approaches to mobility telemonitoring of the elderly in their living environment," Annals of Biomedical Engineering, vol. 34, pp. 547-563, 2006. [7] M. J. Mathie, A. C. F. Coster, N. H. Lovell and B. G. Celler, "Detection of daily physical activities using a triaxial accelerometer," Medical and Biological Engineering and Computing, vol. 41, pp. 296-301, 2003. [8] D. A. Rodríguez, A. L. Brown and P. J. Troped, "Portable global positioning units to complement accelerometry-based physical activity monitors," Medicine and Science in Sports and Exercise, vol. 37, pp. S572-S581, 2005. [9] D. M. Karantonis, M. R. Narayanan, M. Mathie, N. H. Lovell and B. G. Celler, "Implementation of a real-time human movement classifier using a triaxial accelerometer for ambulatory monitoring," IEEE Transactions on Information Technology in Biomedicine, vol. 10, pp. 156-167, 2006. [10] E. Farella, A. Pieracci, L. Benini and A. Acquaviva, "A wireless body area sensor network for posture detection," in 11th IEEE Symposium on Computers and Communications, ISCC 2006, 2006, pp. 454-459. Development of a Wearable Mobility Monitoring System 129 References [11] C. Randell and H. Muller, "Context awareness by analysing accelerometer data," in The Fourth International Symposium on Wearable Computers, 2000, pp. 175-176. [12] Y. Lee and S. -B. Cho, "Extracting meaningful contexts from mobile life log," in Intelligent Data Engineering and Automated Learning - IDEAL 2007, 2007, pp. 750-759. [13] G. H. Jin, S. B. Lee and T. S. Lee, "Context awareness of human motion states using accelerometer," Journal of Medical Systems, vol. 32, pp. 93-100, 2008. [14] T. Choudhury, G. Borriello, S. Consolvo, D. Haehnel, B. Harrison, B. Hemingway, J. Hightower, P. Klasnja, K. Koscher, A. LaMarca, J. A. Landay, L. LeGrand, J. Lester, A. Rahimi, A. Rea and D. Wyatt, "The mobile sensing platform: An embedded activity recognition system," IEEE Pervasive Computing, vol. 7, pp. 32-41, 2008. [15] U. Maurer, A. Rowe, A. Smailagic and D. Siewiorek, "Location and activity recognition using eWatch: A wearable sensor platform," in Ambient Intelligence in Everyday Life, 2006, pp. 86-102. [16] S. E. Lord, K. McPherson, H. K. McNaughton, L. Rochester and M. Weatherall, "Community ambulation after stroke: How important and obtainable is it and what measures appear predictive?" Archives of Physical Medicine and Rehabilitation, vol. 85, pp. 234-239, 2004. [17] J. S. Frank and A. E. Patla, "Balance and mobility challenges in older adults: Implications for preserving community mobility," American Journal of Preventive Medicine, vol. 25, pp. 157-163, 2003. [18] World Health Organisation (WHO), International Classification of Functioning, Disability and Health: ICF, Geneva, Switzerland: World Health Organisation, 2001. [19] World Health Organisation. International Classification of Functioning, Disability and Health (ICF), World Health Organization, 2009. [Online]. Available: http://www.who.int/classifications/icf/en/ [Accessed: 18 Mar. 2009]. [20] E. Stanko, P. Goldie and M. Nayler, "Development of a new mobility scale for people living in the community after stroke: Content validity," Australian Journal of Physiotherapy, vol. 47, pp. 201-208, 2001. [21] A. Shumway-Cook, A. E. Patla, A. Stewart, L. Ferrucci, M. A. Ciol and J. M. Guralnik, "Environmental demands associated with community mobility in older adults with and without mobility disabilities," Physical Therapy, vol. 82, pp. 670-681, 2002. [22] A. M. Myers, P. J. Holliday, K. A. Harvey and K. S. Hutchinson, "Functional performance measures: Are they superior to self-assessments?" Journals of Gerontology, vol. 48, 1993. Development of a Wearable Mobility Monitoring System 130 References [23] A. Patla, "Mobility in complex environments: implications for clinical assessment and rehabilitation," Journal of Neurologic Physical Therapy, vol. 25, pp. 82–90, 2001. [24] A. Shumway-Cook, M. Baldwin, N. L. Polissar and W. Gruber, "Predicting the probability for falls in community-dwelling older adults," Physical Therapy, vol. 77, pp. 812-819, 1997. [25] J. McConvey and S. E. Bennett, "Reliability of the dynamic gait index in individuals with multiple sclerosis," Archives of Physical Medicine and Rehabilitation, vol. 86, pp. 130133, 2005. [26] L. E. Dibble and M. Lange, "Predicting falls in individuals with Parkinson disease: A reconsideration of clinical balance measures." Journal of Neurologic Physical Therapy : JNPT., vol. 30, pp. 60-67, 2006. [27] J. Jonsdottir and D. Cattaneo, "Reliability and validity of the Dynamic Gait Index in persons with chronic stroke," Archives of Physical Medicine and Rehabilitation, vol. 88, pp. 1410-1415, 2007. [28] T. Herman, N. Inbar-Borovsky, M. Brozgol, N. Giladi and J. M. Hausdorff, "The Dynamic Gait Index in healthy older adults: The role of stair climbing, fear of falling and gender," Gait and Posture, vol. 29, pp. 237-241, 2009. [29] D. M. Wrisley, G. F. Marchetti, D. K. Kuharsky and S. L. Whitney, "Reliability, internal consistency, and validity of data obtained with the functional gait assessment," Physical Therapy, vol. 84, pp. 906-918, 2004. [30] J. Howe, E. Inness, M. Verrier and J. Williams, "Development of the Community Balance and Mobility Scale (CB&M) for the Traumatic Brain Injury (TBI)," in American Congress of Rehabilitation Medicine, 1999. [31] J. -A. Howe, E. L. Inness, A. Venturini, J. I. Williams and M. C. Verrier, "The Community Balance and Mobility Scale - A balance measure for individuals with traumatic brain injury," Clinical Rehabilitation, vol. 20, pp. 885-895, 2006. [32] E. L. Inness, J. A. Howe, E. Niechwiej-Szwedo, S. Jaglal, W. E. McIlroy and M. C. Verrier, "Measuring balance and mobility after traumatic brain injury: further validation of the Community Balance & Mobility Scale (CB&M)," Archives of Physical Medicine and Rehabilitation, vol. 85, 2004. [33] K. O. Berg, S. L. Wood-Dauphinee, J. I. Williams and B. Maki, "Measuring balance in the elderly: Validation of an instrument," Canadian Journal of Public Health, vol. 83, pp. S7-S11, 1992. [34] L. Blum and N. Korner-Bitensky, "Usefulness of the Berg Balance Scale in stroke rehabilitation: A systematic review," Physical Therapy, vol. 88, pp. 559-566, 2008. Development of a Wearable Mobility Monitoring System 131 References [35] S. Mathias, U. S. L. Nayak and B. Isaacs, "Balance in elderly patients: The 'get-up and go' test," Archives of Physical Medicine and Rehabilitation, vol. 67, pp. 387-389, 1986. [36] D. Podsiadlo and S. Richardson, "The timed 'Up and Go': A test of basic functional mobility for frail elderly persons," Journal of the American Geriatrics Society, vol. 39, pp. 142-148, 1991. [37] R. O. Crapo, R. Casaburi, A. L. Coates, P. L. Enright, N. R. MacIntyre, R. T. McKay, D. Johnson, J. S. Wanger, R. J. Zeballos, V. Bittner and C. Mottram, "ATS statement: Guidelines for the six-minute walk test," American Journal of Respiratory and Critical Care Medicine, vol. 166, pp. 111-117, 2002. [38] K. Donovan, S. E. Lord, H. K. McNaughton and M. Weatherall, "Mobility beyond the clinic: The effect of environment on gait and its measurement in community-ambulant stroke survivors," Clinical Rehabilitation, vol. 22, pp. 556-563, 2008. [39] M. E. Tinetti, "Performance-orientated assessment of mobility problems in elderly patients," Journal of the American Geriatrics Society, vol. 34, pp. 119-126, 1986. [40] L. D. Abbruzzese, "The Tinetti performance-oriented mobility assessment tool," American Journal of Nursing, vol. 98, pp. 16J-16L, 1998. [41] A. Yelnik and I. Bonan, "Clinical tools for assessing balance disorders," Neurophysiologie Clinique, vol. 38, pp. 439-445, 2008. [42] B. B. Hamilton, C. V. Granger, F. S. Sherwin, M. Zielezny and J. S. Tashman, "A uniform national data system for medical rehabilitation," in Rehabilitation Outcomes: Analysis and Measurement, 1987, pp. 137-147. [43] C. V. Granger and B. B. Hamilton, "The uniform data systems for medical rehabilitation report of first admissions for 1991," American Journal of Physical Medicine & Rehabilitation, vol. 72, pp. 33, 1993. [44] K. M. Hall, N. Mann, W. M. High Jr, J. Wright, J. S. Kreutzer and D. Wood, "Functional measures after traumatic brain injury: Ceiling effects of FIM, FIM FAM, DRS, and CIQ," The Journal of Head Trauma Rehabilitation, vol. 11, pp. 27, 1996. [45] I. McDowell, Measuring Health: A Guide to Rating Scales and Questionnaires, Third ed. New York, New York: Oxford University Press, 2006. [46] L. Ferrucci, J. M. Guralnik, S. Studenski, L. P. Fried, G. B. Cutler Jr. and J. D. Walston, "Designing randomized, controlled trials aimed at preventing or delaying functional decline and disability in frail, older persons: A consensus report," Journal of the American Geriatrics Society, vol. 52, pp. 625-634, 2004. Development of a Wearable Mobility Monitoring System 132 References [47] T. Giantomaso, L. Makowsky, N. L. Ashworth and R. Sankaran, "The validity of patient and physician estimates of walking distance," Clinical Rehabilitation, vol. 17, pp. 394-401, 2003. [48] P. J. Rathouz, J. D. Kasper, S. L. Zeger, L. Ferrucci, K. Bandeen-Roche, D. L. Miglioretti and L. P. Fried, "Short-term consistency in self-reported physical functioning among elderly women: The women's health and aging study," American Journal of Epidemiology, vol. 147, pp. 764-773, 1998. [49] S. Mudge and N. S. Stott, "Outcome measures to assess walking ability following stroke: a systematic review of the literature," Physiotherapy, vol. 93, pp. 189-200, 2007. [50] M. J. Follick, D. K. Ahern and N. Laser-Wolston, "Evaluation of a daily activity diary for chronic pain patients," Pain, vol. 19, pp. 373-382, 1984. [51] R. M. P. Moore, D. Berlowitz, L. Denehy, B. Jackson and C. F. B. S. McDonald, "Comparison of pedometer and activity diary for measurement of physical activity in chronic obstructive pulmonary disease," Journal of Cardiopulmonary Rehabilitation & Prevention, vol. 29, pp. 57-61, January/February. 2009. [52] O. R. Pearson, M. E. Busse, R. W. M. Van Deursen and C. M. Wiles, "Quantification of walking mobility in neurological disorders," QJM - Monthly Journal of the Association of Physicians, vol. 97, pp. 463-475, 2004. [53] F. Pitta, T. Troosters, V. S. Probst, M. A. Spruit, M. Decramer and R. Gosselink, "Quantifying physical activity in daily life with questionnaires and motion sensors in COPD," European Respiratory Journal, vol. 27, pp. 1040-1055, 2006. [54] A. M. Jette, A. R. Davies, P. D. Cleary, D. R. Calkins, L. V. Rubenstein, A. Fink, J. Kosecoff, R. T. Young, R. H. Brook and T. L. Delbanco, "The Functional Status Questionnaire: Reliability and validity when used in primary care," Journal of General Internal Medicine : Official Journal of the Society for Research and Education in Primary Care Internal Medicine, vol. 1, pp. 143-149, 1986. [55] J. S. Brach, J. M. VanSwearingen, A. B. Newman and A. M. Kriska, "Identifying early decline of physical function in community-dwelling older women: Performance-based and self-report measures," Physical Therapy, vol. 82, pp. 320-328, 2002. [56] D. B. Reuben, L. A. Valle, R. D. Hays and A. L. Siu, "Measuring physical function in community-dwelling older persons: A comparison of self-administered, intervieweradministered, and performance- based measures," Journal of the American Geriatrics Society, vol. 43, pp. 17-23, 1995. [57] S. E. Sherman and D. Reuben, "Measures of functional status in community-dwelling elders," Journal of General Internal Medicine, vol. 13, pp. 817-823, 1998. Development of a Wearable Mobility Monitoring System 133 References [58] J. F. Fries, P. Spitz, R. G. Kraines and H. R. Holman, "Measurement of patient outcome in arthritis," Arthritis and Rheumatism, vol. 23, pp. 137-145, 1980. [59] F. Wolfe, S. M. Kleinheksel, M. A. Cathey, D. J. Hawley, P. W. Spitz and J. F. Fries, "The clinical value of the Stanford Health Assessment Questionnaire Functional Disability Index in patients with rheumatoid arthritis," The Journal of Rheumatology, vol. 15, pp. 14801488, Oct. 1988. [60] A. Shumway-Cook, A. Patla, A. Stewart, L. Ferrucci, M. A. Ciol and J. M. Guralnik, "Environmental components of mobility disability in community-living older persons," Journal of the American Geriatrics Society, vol. 51, pp. 393-398, 2003. [61] A. Shumway-Cook, A. Patla, A. L. Stewart, L. Ferrucci, M. A. Ciol and J. M. Guralnik, "Assessing environmentally determined mobility disability: Self-report versus observed community mobility," Journal of the American Geriatrics Society, vol. 53, pp. 700704, 2005. [62] Vicon Motion Systems. Available: http://www.vicon.com [Accessed: 18 Mar. 2009]. [63] H. Zhou and H. Hu, "Human motion tracking for rehabilitation-A survey," Biomedical Signal Processing and Control, vol. 3, pp. 1-18, 2008. [64] B. Rosenhahn, T. Brox, U. Kersting, A. Smith, J. Gurney and R. Klette, "A system for marker-less motion capture," Künstliche Intelligenz, vol. 20, pp. 45-51, 2006. [65] Xsens Technologies B.V. Xsens motion technologies, Xsens, [Online]. Available: http://www.xsens.com/en/home.php [Accessed: 19 Mar. 2009]. [66] Advanced Mechanical Technology Inc. Model BP400600, AMTI, [Online]. Available: http://amti.biz/ [Accessed: 18 Mar. 2009]. [67] Bertec Corporation. Gait & Biomechanics, A Movement in Force, [Online]. Available: http://www.bertec.com/gait_biomechanics.htm [Accessed: 18 Mar. 2009]. [68] Tekscan Inc. F-Scan Lite VersaTek System, Clinical and Research Solutions, Available: http://www.tekscan.com/medical/system-fscan-lite1.html [Accessed: 18 Mar. 2009]. [69] Novel. Product Information: System I emed, Novel, [Online]. Available: http://www.novel.de/productinfo/systems-emed.htm [Accessed: 18 Mar. 2009]. [70] R. Casaburi, "Activity monitoring in assessing activities of daily living," Journal of Chronic Obstructive Pulmonary Disease, vol. 4, pp. 251-255, 2007. [71] Orthocare Innovations. StepWatch, Orthocare Innovations, 2007. [Online]. Available: http://www.orthocareinnovations.com/pages/stepwatch_trade [Accessed: 11 Nov. 2009]. Development of a Wearable Mobility Monitoring System 134 References [72] E. D. de Bruin, A. Hartmann, D. Uebelhart, K. Murer and W. Zijlstra, "Wearable systems for monitoring mobility-related activities in older people: A systematic review," Clinical Rehabilitation, vol. 22, pp. 878-895, 2008. [73] A. P. Marsh, R. M. Vance, T. L. Frederick, S. A. Hesselmann and W. J. Rejeski, "Objective assessment of activity in older adults at risk for mobility disability," Medicine and Science in Sports and Exercise, vol. 39, pp. 1020-1026, 2007. [74] C. Tudor-Locke, J. E. Williams, J. P. Reis and D. Pluto, "Utility of pedometers for assessing physical activity: Convergent validity," Sports Medicine, vol. 32, pp. 795-808, 2002. [75] J. T. Cavanaugh, K. L. Coleman, J. M. Gaines, L. Laing and M. C. Morey, "Using step activity monitoring to characterize ambulatory activity in community-dwelling older adults," Journal of the American Geriatrics Society, vol. 55, pp. 120-124, 2007. [76] D. Giansanti, V. Macellari and G. Maccioni, "Telemonitoring and telerehabilitation of patients with Parkinson's disease: Health technology assessment of a novel wearable step counter," Telemedicine and e-Health, vol. 14, pp. 76-83, 2008. [77] A. Godfrey, R. Conway, D. Meagher and G. ÓLaighin, "Direct measurement of human movement by accelerometry," Medical Engineering and Physics, vol. 30, pp. 13641386, 2008. [78] Stayhealthy Inc. RT3 Research Activity Monitor, Stayhealthy, [Online]. Available: http://www.stayhealthy.com/page/view3789.html?id=products/rt3 [Accessed: 11 Nov. 2009]. [79] PAL Technologies Ltd. ActivPAL, PALTechnologies Limited, [Online]. Available: http://www.paltechnologies.com/ [Accessed: 11 Nov. 2009]. [80] C. V. C. Bouten, K. T. M. Koekkoek, M. Verduin, R. Kodde and J. D. Janssen, "A triaxial accelerometer and portable data processing unit for the assessment of daily physical activity," IEEE Transactions on Biomedical Engineering, vol. 44, pp. 136-147, 1997. [81] M. J. Mathie, A. C. F. Coster, N. H. Lovell and B. G. Celler, "Accelerometry: Providing an integrated, practical method for long-term, ambulatory monitoring of human movement," Physiological Measurement, vol. 25, 2004. [82] J. A. Levine, "Measurement of energy expenditure." Public Health Nutrition, vol. 8, pp. 1123, 2005. [83] P. Bonato, "Advances in wearable technology and applications in physical medicine and rehabilitation," Journal of NeuroEngineering and Rehabilitation, vol. 2, 2005. Development of a Wearable Mobility Monitoring System 135 References [84] E. Jovanov, A. Milenkovic, C. Otto and P. C. De Groen, "A wireless body area network of intelligent motion sensors for computer assisted physical rehabilitation," Journal of NeuroEngineering and Rehabilitation, vol. 2, 2005. [85] Y. Hao and R. Foster, "Wireless body sensor networks for health-monitoring applications," Physiological Measurement, vol. 29, pp. R27-R56, 2008. [86] E. Stuart, M. Moh and T. -S. Moh, "Privacy and security in biomedical applications of wireless sensor networks," in 1st International Symposium on Applied Sciences in Biomedical and Communication Technologies, 2008. [87] J. Lester, T. Choudhury and G. Borriello, "A practical approach to recognizing physical activities," in 4th International Conference on Pervasive Computing, 2006, pp. 116. [88] H. Chen, W. Wu and J. Lee, "A WBAN-based real-time electroencephalogram monitoring system: Design and implementation," Journal of Medical Systems, pp. 1-9, 2009. [89] E. Farella, A. Pieracci, D. Brunelli, L. Benini, B. Riccó and A. Acquaviva, "Design and implementation of WiMoCA node for a body area wireless sensor network," in Proceedings of the 2005 Systems Communications, 2005, pp. 342-347. [90] S. Farshchi, P. H. Nuyujukian, A. Pesterev, I. Mody and J. W. Judy, "A TinyOSenabled MICA2-based wireless neural interface," IEEE Transactions on Biomedical Engineering, vol. 53, pp. 1416-1424, 2006. [91] A. Milenković, C. Otto and E. Jovanov, "Wireless sensor networks for personal health monitoring: Issues and an implementation," Computer Communications, vol. 29, pp. 2521-2533, 2006. [92] E. Montón, J. F. Hernandez, J. M. Blasco, T. Hervé, J. Micallef, I. Grech, A. Brincat and V. Traver, "Body area network for wireless patient monitoring," IET Communications, vol. 2, pp. 215-222, 2008. [93] M. R. Yuce, P. C. Ng and J. Y. Khan, "Monitoring of physiological parameters from multiple patients using wireless sensor network," Journal of Medical Systems, vol. 32, pp. 433-441, 2008. [94] E. Farella, A. Pieracci, L. Benini, L. Rocchi and A. Acquaviva, "Interfacing human and computer with wireless body area sensor networks: The WiMoCA solution," Multimedia Tools and Applications, vol. 38, pp. 337-363, 2008. [95] S. -W. Lee and K. Mase, "Activity and location recognition using wearable sensors," IEEE Pervasive Computing, vol. 1, pp. 24-32, 2002. Development of a Wearable Mobility Monitoring System 136 References [96] N. Ravi, N. Dandekar, P. Mysore and M. L. Littman, "Activity recognition from accelerometer data," in Proceedings of the National Conference on Artificial Intelligence, 2005, pp. 1541. [97] Wikipedia. Smartphone, Wikipedia, The Free Encyclopedia, [Online]. Available: http://en.wikipedia.org/wiki/Smartphone [Accessed: 16 Sep. 2009]. [98] M. J. Moron, J. R. Luque, A. A. Botella, E. J. Cuberos, E. Casilari and A. DiazEstrella, "A smart phone-based personal area network for remote monitoring of biosignals," in Proceedings for the International Federation for Medical and Biological Engineering, 2007, pp. 116. [99] P. Van De Ven, J. Nelson, A. Bourke and G. O. Laighin, "A wearable wireless platform for fall and mobility monitoring," in 1st International Conference on Pervasive Technologies Related to Assistive Environments, 2008. [100] P. Roncagliolo, L. Arredondo and A. González, "Biomedical signal acquisition, processing and transmission using smartphone," Journal of Physics: Conference Series, vol. 90, 2007. [101] M. D. Bloice, F. Wotawa and A. Holzinger, "Java's alternatives and the limitations of java when writing cross-platform applications for mobile devices in the medical domain," in 31st International Conference on Information Technology Interfaces, 2009, pp. 47-54. [102] X. Zhang, D. Cao and H. Mei, "Improve the portability of J2ME applications: an architecture-driven approach," in Third International Conference on Multimedia and Ubiquitous Engineering, 2009, pp. 386-91. [103] A. F. Dalton, C. N. Scanaill, S. Carew, D. Lyons and G. Ólaighin, "A clinical evaluation of a remote mobility monitoring system based on SMS messaging," in Proceedings of the 29th Annual International Conference of IEEE Engineering in Medicine and Biology Society, 2007, pp. 2327-2330. [104] Network dictionary. WPAN:Wireless Personal Area Network Communication Technologies, Network dictionary, 2004. [Online]. Available: http://www.networkdictionary.com/wireless/WPAN.php [Accessed: 28 Apr. 2009]. [105] K. Hung, Y. T. Zhang and B. Tai, "Wearable medical devices for tele-home healthcare," in Proceedings of the 26th Annual International Conference of the IEEE Engineering in Medicine and Biology Society, 2004, pp. 5384-5387. [106] K. Hung and Y. T. Zhang, "Usage of Bluetooth in wireless sensors for telehealthcare," in Proceedings of the 24th Annual International Conference of the IEEE Engineering in Medicine and Biology, 2002, pp. 1881-1882. Development of a Wearable Mobility Monitoring System 137 References [107] W. Y. Wong, M. S. Wong and K. H. Lo, "Clinical applications of sensors for human posture and movement analysis: A review," Prosthetics and Orthotics International, vol. 31, pp. 62-75, 2007. [108] W. Zijlstra and K. Aminian, "Mobility assessment in older people: New possibilities and challenges," European Journal of Ageing, vol. 4, pp. 3-12, 2007. [109] K. Aminian and B. Najafi, "Capturing human motion using body-fixed sensors: Outdoor measurement and clinical applications," Computer Animation and Virtual Worlds, vol. 15, pp. 79-94, 2004. [110] K. M. Culhane, M. O'Connor, D. Lyons and G. M. Lyons, "Accelerometers in rehabilitation medicine for older adults," Age and Ageing, vol. 34, pp. 556-560, 2005. [111] J. J. Kavanagh and H. B. Menz, "Accelerometry: A technique for quantifying movement patterns during walking," Gait and Posture, vol. 28, pp. 1-15, 2008. [112] J. F. Knight, H. W. Bristow, S. Anastopoulou, C. Baber, A. Schwirtz and T. N. Arvanitis, "Uses of accelerometer data collected from a wearable system," Personal and Ubiquitous Computing, vol. 11, pp. 117-132, 2007. [113] H. J. Luinge and P. H. Veltink, "Measuring orientation of human body segments using miniature gyroscopes and accelerometers," Medical and Biological Engineering and Computing, vol. 43, pp. 273-282, 2005. [114] H. Lau and K. Tong, "The reliability of using accelerometer and gyroscope for gait event identification on persons with dropped foot," Gait and Posture, vol. 27, pp. 248-257, 2008. [115] J. Favre, B. M. Jolles, R. Aissaoui and K. Aminian, "Ambulatory measurement of 3D knee joint angle," Journal of Biomechanics, vol. 41, pp. 1029-1035, 2008. [116] M. N. Nyan, F. E. H. Tay and E. Murugasu, "A wearable system for pre-impact fall detection," Journal of Biomechanics, vol. 41, pp. 3475-3481, 2008. [117] D. Roetenberg, H. J. Luinge, C. T. M. Baten and P. H. Veltink, "Compensation of magnetic disturbances improves inertial and magnetic sensing of human body segment orientation," IEEE Transactions on Neural Systems and Rehabilitation Engineering, vol. 13, pp. 395-405, 2005. [118] H. S. Zhu, J. J. Wertsch, G. F. Harris, J. D. Loftsgaarden and M. B. Price, "Foot pressure distribution during walking and shuffling," Archives of Physical Medicine and Rehabilitation, vol. 72, pp. 390-397, May. 1991. [119] P. Cavanagh and J. Ulbrecht, "Clinical plantar pressure measurement in diabetes: rationale and methodology," The Foot, vol. 4, pp. 123-135, 1994. Development of a Wearable Mobility Monitoring System 138 References [120] A. D. Townshend, C. J. Worringham and I. B. Stewart, "Assessment of speed and position during human locomotion using nondifferential GPS," Medicine and Science in Sports and Exercise, vol. 40, pp. 124-132, 2008. [121] A. Le Faucheur, P. Abraham, V. Jaquinandi, P. Bouyé, J. L. Saumet and B. NouryDesvaux, "Measurement of walking distance and speed in patients with peripheral arterial disease: A novel method using a global positioning system," Circulation, vol. 117, pp. 897904, 2008. [122] P. J. Troped, M. S. Oliveira, C. E. Matthews, E. K. Cromley, S. J. Melly and B. A. Craig, "Prediction of activity mode with global positioning system and accelerometer data," Medicine and Science in Sports and Exercise, vol. 40, pp. 972-978, 2008. [123] S. E. Wiehe, A. E. Carroll, G. C. Liu, K. L. Haberkorn, S. C. Hoch, J. S. Wilson and J. D. Dennis, "Using GPS-enabled cell phones to track the travel patterns of adolescents," International Journal of Health Geographics, vol. 7, 2008. [124] G. MacLellan and L. Baillie, "Development of a location and movement monitoring system to quantify physical activity," in Proceeding for the Conference on Human Factors in Computing Systems, 2008, pp. 2889-2894. [125] Y. Michael, E. M. McGregor, J. Allen and S. Fickas, "Observing outdoor activity using global positioning system-enabled cell phones," in Lecture Notes in Computer Science (Including Subseries Lecture Notes in Artificial Intelligence and Lecture Notes in Bioinformatics), 2008, pp. 177-184. [126] N. Ueda, Y. Nakanishi, S. Matsukawa and M. Motoe, "Developing a GIS using a mobile phone equipped with a camera and a GPS, and its exhibitions," in Proceedings of the 24th International Conference on Distributed Computing Systems Workshops, 2004, pp. 414-417. [127] A. Le Faucheur, P. Abraham, V. Jaquinandi, P. Bouyé, J. L. Saumet and B. NouryDesvaux, "Study of human outdoor walking with a low-cost GPS and simple spreadsheet analysis," Medicine and Science in Sports and Exercise, vol. 39, pp. 1570-1578, 2007. [128] H. Yamazoe, A. Utsumi, K. Hosaka and M. Yachida, "A body-mounted camera system for head-pose estimation and user-view image synthesis," Image and Vision Computing, vol. 25, pp. 1848-1855, 2007. [129] Microsoft Corporation. Introduction to SenseCam, Microsoft Research, 2007. [Online]. Available: http://research.microsoft.com/en-us/um/cambridge/projects/sensecam/ [Accessed: 13 Oct. 2009]. [130] D. Byrne, B. Lavelle, A. Doherty, G. Jones and A. F. Smeaton, "Using Bluetooth and GPS metadata to measure event similarity in SenseCam images," in IMAI’07-5th Development of a Wearable Mobility Monitoring System 139 References International Conference on Intelligent Multimedia and Ambient Intelligence, 2007, pp. 1454–1460. [131] E. Berry, N. Kapur, L. Williams, S. Hodges, P. Watson, G. Smyth, J. Srinivasan, R. Smith, B. Wilson and K. Wood, "The use of a wearable camera, SenseCam, as a pictorial diary to improve autobiographical memory in a patient with limbic encephalitis: A preliminary report," Neuropsychological Rehabilitation, vol. 17, pp. 582-601, 2007. [132] A. J. Sellen, A. Fogg, M. Aitken, S. Hodges, C. Rother and K. Wood, "Do lifelogging technologies support memory for the past?: an experimental study using sensecam," in Proceedings of the SIGCHI Conference on Human Factors in Computing Systems, 2007. [133] E. L. Berry, A. Hampshire, J. Rowe, S. Hodges, N. Kapur, P. Watson, G. Browne, G. Smyth, K. Wood and A. M. Owen, "The neural basis of effective memory therapy in a patient with limbic encephalitis," British Medical Journal, 2009. [134] A. K. Dey and G. D. Abowd, "Towards a Better Understanding of Context and Context-Awareness," in CHI 2000 Workshop on the what, Who, Where, when, and how of Context-Awareness, 2000. [135] M. Tentori and J. Favela, "Activity-aware computing for healthcare," IEEE Pervasive Computing, vol. 7, pp. 51-57, 2008. [136] B. T. Korel and S. G. M. Koo, "Addressing context awareness techniques in body sensor networks," in Proceedings of the 21st International Conference on Advanced Information Networking and Applications Workshops/Symposia, 2007, pp. 798-803. [137] M. J. Morón, J. R. Luque, A. A. Botella, E. J. Cuberos, E. Casilari and A. DíazEstrella, "J2ME and smart phones as platform for a Bluetooth Body Area Network for patient-telemonitoring," in Proceedings for the 29th Annual International Conference of IEEE Engineering in Medicine and Biology Society, 2007, pp. 2791-2794. [138] M. Sekine, T. Tamura, M. Akay, T. Fujimoto, T. Togawa and Y. Fukui, "Discrimination of walking patterns using wavelet-based fractal analysis," IEEE Transactions on Neural Systems and Rehabilitation Engineering, vol. 10, pp. 188-196, 2002. [139] M. Sekine, T. Tamura, T. Togawa and Y. Fukui, "Classification of waistacceleration signals in a continuous walking record," Medical Engineering and Physics, vol. 22, pp. 285-291, 2000. [140] M. J. Mathie, A. C. F. Coster, N. H. Lovell, B. G. Celler, S. R. Lord and A. Tiedemann, "A pilot study of long-term monitoring of human movements in the home using accelerometry," Journal of Telemedicine and Telecare, vol. 10, pp. 144-151, 2004. Development of a Wearable Mobility Monitoring System 140 References [141] J. Baek, G. Lee, W. Park and B. -J. Yun, "Accelerometer signal processing for user activity detection," in Lecture Notes in Computer Science (Including Subseries Lecture Notes in Artificial Intelligence and Lecture Notes in Bioinformatics), 2004, pp. 573-580. [142] A. K. Bourke, J. V. O'Brien and G. M. Lyons, "Evaluation of a threshold-based triaxial accelerometer fall detection algorithm," Gait and Posture, vol. 26, pp. 194-199, 2007. [143] T. Yoshida, F. Mizuno, T. Hayasaka, K. Tsubota, Y. Imai, T. Ishikawa and T. Yamaguchi, "Development of a wearable surveillance system using gait analysis," Telemedicine and e-Health, vol. 13, pp. 703-713, 2007. [144] J. B. J. Bussmann, L. Damen and H. J. Stam, "Analysis and decomposition of signals obtained by thigh-fixed uni-axial accelerometry during normal walking," Medical and Biological Engineering and Computing, vol. 38, pp. 632-638, 2000. [145] K. Aminian, K. Rezakhanlou, E. De Andres, C. Fritsch, P. -F. Leyvraz and P. Robert, "Temporal feature estimation during walking using miniature accelerometers: An analysis of gait improvement after hip arthroplasty," Medical and Biological Engineering and Computing, vol. 37, pp. 686-691, 1999. [146] R. LeMoyne, C. Coroian and T. Mastroianni, "Quantification of Parkinson's disease characteristics using wireless accelerometers," in ICME International Conference on Complex Medical Engineering, 2009. [147] P. H. Veltink, H. B. J. Bussmann, W. De Vries, W. L. J. Martens and R. C. Van Lummel, "Detection of static and dynamic activities using uniaxial accelerometers," IEEE Transactions on Rehabilitation Engineering, vol. 4, pp. 375-385, 1996. [148] K. M. Culhane, G. M. Lyons, D. Hilton, P. A. Grace and D. Lyons, "Long-term mobility monitoring of older adults using accelerometers in a clinical environment," Clinical Rehabilitation, vol. 18, pp. 335-343, 2004. [149] G. M. Lyons, K. M. Culhane, D. Hilton, P. A. Grace and D. Lyons, "A description of an accelerometer-based mobility monitoring technique," Medical Engineering and Physics, vol. 27, pp. 497-504, 2005. [150] C. Ni Scanaill, B. Ahearne and G. M. Lyons, "Long-term telemonitoring of mobility trends of elderly people using SMS messaging," IEEE Transactions on Information Technology in Biomedicine, vol. 10, pp. 412-413, 2006. [151] J. B. J. Bussmann, J. H. M. Tulen, E. C. G. Van Herel and H. J. Stam, "Quantification of physical activities by means of ambulatory accelerometry: A validation study," Psychophysiology, vol. 35, pp. 488-496, 1998. Development of a Wearable Mobility Monitoring System 141 References [152] F. Foerster, M. Smeja and J. Fahrenberg, "Detection of posture and motion by accelerometry: a validation study in ambulatory monitoring," Computers in Human Behavior, vol. 15, pp. 571-583, 1999. [153] Y. Yoshida, Y. Yonezawa, K. Sata, I. Ninomiya and W. M. Caldwell, "A wearable posture, behavior and activity recording system," in Proceedings of the 22th Annual International Conference of the IEEE Engineering in Medicine and Biology, 2000, pp. 1278. [154] B. Najafi, K. Aminian, F. Loew, Y. Blanc and P. Robert, "An ambulatory system for physical activity monitoring in elderly," in Proceedings of the 1st Annual International, Conference on Microtechnologies in Medicine and Biology, 2000. [155] B. Najafi, K. Aminian, A. Paraschiv-Ionescu, F. Loew, C. J. Büla and P. Robert, "Ambulatory system for human motion analysis using a kinematic sensor: Monitoring of daily physical activity in the elderly," IEEE Transactions on Biomedical Engineering, vol. 50, pp. 711-723, 2003. [156] L. Bao and S. S. Intille, "Activity recognition from user-annotated acceleration data," Lecture Notes in Computer Science (Including Subseries Lecture Notes in Artificial Intelligence and Lecture Notes in Bioinformatics), vol. 3001, pp. 1-17, 2004. [157] H. J. Luinge and P. H. Veltink, "Inclination Measurement of Human Movement Using a 3-D Accelerometer with Autocalibration," IEEE Transactions on Neural Systems and Rehabilitation Engineering, vol. 12, pp. 112-121, 2004. [158] P. Barralon, N. Noury and N. Vuillerme, "Classification of daily physical activities from a single kinematic sensor," in Proceedings of the 27th Annual International Conference of the IEEE Engineering in Medicine and Biology, 2005, pp. 2447-2450. [159] P. Barralon, N. Vuillerme and N. Noury, "Walk detection with a kinematic sensor: frequency and wavelet comparison," in Proceedings of the 28th Annual International Conference of the IEEE Engineering in Medicine and Biology Society, 2006, pp. 1711-1714. [160] T. Hester, D. M. Sherril, M. Hamel, K. Perreault, P. Boissy and P. Bonato, "Identification of tasks performed by stroke patients using a mobility assistive device," in Proceedings of the 28th Annual International Conference of the IEEE Engineering in Medicine and Biology, 2006, pp. 1501-1504. [161] J. Pärkkä, M. Ermes, P. Korpipää, J. Mäntyjärvi, J. Peltola and I. Korhonen, "Activity classification using realistic data from wearable sensors," IEEE Transactions on Information Technology in Biomedicine, vol. 10, pp. 119-128, 2006. [162] A. Bhattacharya, E. P. McCutcheon, E. Shvartz and J. E. Greenleaf, "Body acceleration distribution and O2 uptake in humans during running and jumping," Journal of Applied Physiology Respiratory Environmental and Exercise Physiology, vol. 49, pp. 881887, 1980. Development of a Wearable Mobility Monitoring System 142 References [163] A. Cappozzo, "Low frequency self-generated vibration during ambulation in normal men," Journal of Biomechanics, vol. 15, pp. 599-609, 1982. [164] E. K. Antonsson and R. W. Mann, "The frequency content of gait," Journal of Biomechanics, vol. 18, pp. 39-47, 1985. [165] M. Sun and J. O. Hill, "A method for measuring mechanical work and work efficiency during human activities," Journal of Biomechanics, vol. 26, pp. 229-241, 1993. [166] STMicroelectronics, MEMS Inertial Sensor - High Performance 3-Axis ±2/±6g Ultracompact Linear Accelerometer, LIS344ALH Datasheet, Rev. 3. Geneva, Switzerland: STMicroelectronics, 2008. [167] J. C. Lötters, J. Schipper, P. H. Veltink, W. Olthuis and P. Bergveld, "Procedure for in-use calibration of triaxial accelerometers in medical applications," Sensors and Actuators, A: Physical, vol. 68, pp. 221-228, 1998. [168] I. Frosio, F. Pedersini and N. A. Borghese, "Autocalibration of MEMS accelerometers," IEEE Transactions on Instrumentation and Measurement, vol. 58, pp. 2034-2041, 2008. [169] T. Mineta, S. Kobayashi, Y. Watanabe, S. Kanauchi, I. Nakagawa, E. Suganuma and M. Esashi, "Three-axis capacitive accelerometer with uniform axial sensitivities," Journal of Micromechanics and Microengineering, vol. 6, pp. 431-435, 1996. [170] X. Yun, E. R. Bachmann, H. Moore IV and J. Calusdian, "Self-contained position tracking of human movement using small inertial/magnetic sensor modules," in Proceedings of the IEEE International Conference on Robotics and Automation, 2007, pp. 2526-2533. [171] S. J. Preece, J. Y. Goulermas, L. P. J. Kenney, D. Howard, K. Meijer and R. Crompton, "Activity identification using body-mounted sensors - A review of classification techniques," Physiological Measurement, vol. 30, pp. R1-R33, 2009. [172] Freescale Semiconductor, "Application Note 3461, Rev 2: Tilt Sensing using Accelerometers Sensors," pp. 2-4, [173] A. K. Bourke, K. J. O'Donovan and G. ÓLaighin, "The identification of vertical velocity profiles using an inertial sensor to investigate pre-impact detection of falls," Medical Engineering and Physics, vol. 30, pp. 937-946, 2008. [174] S. J. Preece, J. Y. Goulermas, L. P. J. Kenney and D. Howard, "A comparison of feature extraction methods for the classification of dynamic activities from accelerometer data," IEEE Transactions on Biomedical Engineering, vol. 56, pp. 871-879, 2009. Development of a Wearable Mobility Monitoring System 143 References [175] M. J. Mathie, B. G. Celler, N. H. Lovell and A. C. F. Coster, "Classification of basic daily movements using a triaxial accelerometer," Medical and Biological Engineering and Computing, vol. 42, pp. 679-687, 2004. [176] H. -Y. Lau, K. -Y. Tong and H. Zhu, "Support vector machine for classification of walking conditions using miniature kinematic sensors," Medical and Biological Engineering and Computing, vol. 46, pp. 563-573, 2008. [177] S. Wang, J. Yang, N. Chen, X. Chen and Q. Zhang, "Human activity recognition with user-free accelerometers in the sensor networks," in Proceedings of the 2005 International Conference on Neural Networks and Brain, 2005, pp. 1212-1217. [178] J. -Y. Yang, J. -S. Wang and Y. -P. Chen, "Using acceleration measurements for activity recognition: An effective learning algorithm for constructing neural classifiers," Pattern Recognition Letters, vol. 29, pp. 2213-2220, 2008. [179] Steven D. Kaehler. Fuzzy Logic - An Introduction - Part 1, Encoder - The Newsletter of Seattle Robotics Society, Available: http://www.seattlerobotics.org/Encoder/mar98/fuz/fl_part1.html#INTRODUCTION [Accessed: 12 Apr. 2009]. [180] Y. -P. Chen, J. -Y. Yang, S. -N. Liou, G. -Y. Lee and J. -S. Wang, "Online classifier construction algorithm for human activity detection using a tri-axial accelerometer," Applied Mathematics and Computation, vol. 205, pp. 849-860, 2008. [181] Wikipedia. Markov Chain, Wikipedia, The Free Encyclopedia, [Online]. Available: http://en.wikipedia.org/wiki/Markov_chain [Accessed: 12 Oct. 2009]. [182] J. He, H. Li and J. Tan, "Real-time daily activity classification with wireless sensor networks using Hidden Markov Model." in Proceedings of the Annual International Conference of the IEEE Engineering in Medicine and Biology Society, 2007, pp. 3192-3195. [183] J. Hamill and W. S. Selie, "Joint angles," in Research Methods in Biomechanics D. E. Robertson, G. E. Caldwell, J. Hamill, G. Kamen and S. N. Whittlesey, Eds. Champaign, Illinois: Human Kinetics, 2004, pp. 45-51. [184] Xsens Technologies B.V., MT Low-Level Communication Documentation, Document MT0101P, Revision H. The Netherlands: Xsens Technologies B.V, 2008. [185] Xsens Technologies B.V., MTi and MTx User Manual, Document MT0100P, Revision K. The Netherlands: Xsens Technologies B.V., 2008. [186] Xsens Technologies B.V., XM-B Technical Documentation, Document XM0101P, Revision D. The Netherlands: Xsens Technologies B.V., 2008. Development of a Wearable Mobility Monitoring System 144 References [187] Research In Motion Limited. BlackBerry Bold, BlackBerry, [Online]. Available: http://na.blackberry.com/eng/devices/blackberrybold/ [Accessed: 17 Sep. 2009]. [188] Cypress Semiconductor Corporation, PSoC Mixed Signal Array Final Data Sheet, Datasheet for CY8C27143,CY8C27243, CY8C27443, CY8C27543, and CY8C27643, Document No. 38-12012 Rev. *L. San Jose, CA: Cypress Semiconductor Corporation, 2009. [189] Free2Move AB, Low Power Bluetooth Module with Antenna, F2M03GLA Datasheet, Rev. C. Sweden: Free2move AB, 2006. [190] Avago Technologies, Miniature Surface-Mount Ambient Light Photo Sensor, ADPS-9005 Datasheet. San Jose, CA: Avago Technologies, 2007. [191] Sensirion The sensor Company, Temperature and Humidity Sensor, Datasheet SH7x, Version 4.2. Switzerland: Sensirion, 2009. [192] Wikipedia. Low-Pass Filter, Wikipedia, The Free Encyclopedia, 2006. [Online]. Available: http://en.wikipedia.org/wiki/Low-pass_filter [Accessed: 27 Nov. 2009]. [193] Research In Motion Limited, Sun Microsystems and Nokia Corporation. BlackBerry JDE API Reference: 4.6.1 Release, [Online]. Available: http://docs.blackberry.com/en/developers/deliverables/6022/package-summary.html [Accessed: 30 Oct. 2009]. [194] J. Stokes and J. Lindsay, "Major caues of death and hospitalization in Canadian seniors." Chronic Diseases in Canada, vol. 17, pp. 63-73, 1996. Development of a Wearable Mobility Monitoring System 145 Appendix A Appendix A Final schematics of the external board used for the WMMS. Development of a Wearable Mobility Monitoring System 146 Appendix A Development of a Wearable Mobility Monitoring System 147 Appendix A Development of a Wearable Mobility Monitoring System 148 Appendix A Development of a Wearable Mobility Monitoring System 149 Appendix B Appendix B Table B.1: Compiled results for each trial of the five subjects. Subject Trial# 1 2 3 1 True Positive False Positive 27 26 30 29 32 30 Total 1 2 3 2 29 30 31 47 61 51 Total 1 2 3 3 29 29 28 28 22 43 Total 1 2 3 4 26 30 34 47 18 38 Total 1 2 3 5 Total OVERALL 29 30 29 3 1 10 True False Negative Negative Sensitivity Specificity 808 11 71.05% 96.88% 807 8 768 9 Average Standard Deviation 683 9 754 7 775 7 Average Standard Deviation 967 9 820 9 887 10 Average Standard Deviation 846 10 807 7 843 4 Average Standard Deviation 917 9 883 8 914 9 Average Standard Deviation 78.95% 96.19% 76.32% 96.24% 75.44% 96.44% 4.02% 0.39% 76.32% 93.56% 81.08% 92.52% 81.58% 93.83% 79.66% 93.30% 2.91% 0.69% 76.32% 97.19% 76.32% 97.39% 73.68% 95.38% 75.44% 96.65% 1.52% 1.11% 72.22% 94.74% 81.08% 97.82% 89.47% 95.69% 80.93% 96.08% 8.63% 1.58% 76.32% 99.67% 78.95% 99.89% 76.32% 98.92% 77.19% 99.49% 1.52% 0.51% Average Standard Deviation 77.73% 2.49% 96.39% 2.20% Development of a Wearable Mobility Monitoring System 150 Development of a Wearable Mobility Monitoring System Appendix C Table C.1: Sensitivity values for each of the mobility tasks for each of the trials. Subject 1 Subject 2 Subject 3 Subject 4 Subject5 Change of State True Positive False Negative Sensitivity per mobility task 2 3 1 2 3 1 2 3 1 2 3 1 2 3 Walking on level ground 1 1 1 1 1 1 1 1 1 1 1 1 1 1 1 15 0 100.00% Stand-to-sit transition 1 1 1 1 1 1 1 1 1 0 1 1 1 1 1 14 1 93.33% Sitting 1 1 1 1 1 1 1 1 1 1 1 1 1 1 1 15 0 100.00% Sit-to-stand 1 1 1 1 1 1 1 1 1 1 1 1 1 1 1 15 0 100.00% Walking on level ground 1 1 1 1 1 1 1 1 1 1 1 1 1 1 1 15 0 100.00% Standing waiting for elevator 1 1 1 1 1 1 1 1 1 NA 1 1 1 1 1 14 0 100.00% Walking to get in the elevator 1 1 1 1 1 1 0 0 1 NA 1 1 1 1 1 12 2 85.71% Taking elevator to 2 floor 1 1 1 1 1 1 0 0 1 1 1 1 1 1 1 13 2 86.67% Walking to get out of elevator and keep walking on level ground 1 1 1 1 1 1 1 1 1 1 1 1 1 1 1 15 0 100.00% Standing waiting for elevator 1 1 1 1 1 1 1 1 1 1 1 1 1 1 1 15 0 100.00% Walking to get in the elevator 1 1 1 1 1 1 1 1 1 1 1 1 1 1 1 15 0 100.00% Taking elevator to 1 floor 1 1 1 1 1 1 1 1 1 1 1 1 1 1 1 15 0 100.00% 151 Appendix C 1 Development of a Wearable Mobility Monitoring System 1 1 1 1 1 1 1 1 1 1 1 1 1 1 1 15 0 100.00% Walking up stairs 0 0 1 0 0 0 0 1 0 0 0 0 0 0 0 2 13 13.33% Walking on stair intermediate landing (1.5 meter of level ground) 0 1 1 0 0 0 0 0 0 0 0 1 1 1 1 6 9 40.00% Walking up stairs 1 1 1 0 0 0 0 0 0 0 0 1 1 1 0 6 9 40.00% Walking on level ground 1 0 1 0 1 0 0 0 1 0 0 0 0 0 0 4 11 26.67% Walking down stairs 1 1 1 1 1 1 1 1 1 1 1 1 1 1 1 15 0 100.00% Walking on stair intermediate landing (1.5 meter of level ground) 0 0 0 1 1 1 1 1 0 1 1 0 1 1 1 10 5 Walking down stairs 0 0 0 1 1 1 1 1 0 0 1 1 1 1 1 10 5 66.67% Walking on level ground 1 1 1 1 1 1 1 1 1 1 1 1 1 1 1 15 0 100.00% Stand-to-lie transition 1 1 1 1 1 1 1 1 1 1 1 1 1 1 1 15 0 100.00% Lying 1 1 1 1 1 1 1 1 1 1 1 1 1 1 1 15 0 100.00% Lie-to-Stand transition 1 1 1 1 1 1 1 1 1 1 1 1 1 1 1 15 0 100.00% Walking on level ground 1 1 1 1 1 1 1 1 1 1 1 1 1 1 1 15 0 100.00% Walking on ramp 1 1 1 0 0 0 0 1 0 1 1 0 0 0 0 6 9 40.00% Walking on level ground 1 1 0 0 0 0 0 1 1 0 1 1 0 1 0 7 8 46.67% Transition indoor/outdoor and keep walking on level ground 0 0 0 1 1 1 1 0 0 1 1 1 0 0 0 7 8 46.67% Transition outdoor/indoor and keep walking on level ground 0 0 0 1 1 1 1 0 0 1 1 1 0 0 0 7 8 46.67% 66.67% Appendix C 152 Walking to get out of elevator and keep walking on level ground Development of a Wearable Mobility Monitoring System Transition indoor/outdoor and keep walking on level ground 0 0 0 1 0 0 1 0 0 0 0 1 0 0 0 3 12 20.00% Stand-to-sit transition to get in the car 1 1 1 1 1 1 1 1 1 1 1 1 1 1 1 15 0 100.00% Sitting in the car 1 1 1 1 1 1 1 1 1 1 1 1 1 1 1 15 0 100.00% Starts of car ride 0 1 0 0 1 1 1 1 1 0 0 1 1 1 1 10 5 66.67% Stop of car ride 0 1 0 0 NA 1 1 1 1 0 0 1 1 1 1 9 5 64.29% Sit-to-stand transition 1 1 1 1 1 1 1 1 1 1 1 1 0 0 1 13 2 86.67% Walking on level ground 0 1 1 1 1 1 1 1 1 1 1 1 1 1 1 14 1 93.33% Transition outdoor/indoor and keep walking on level ground 0 0 0 0 0 1 0 0 0 1 1 1 0 0 0 4 11 26.67% Standing 1 1 1 1 1 1 1 1 1 1 NA 1 1 1 1 14 0 100.00% Appendix C 153 Development of a Wearable Mobility Monitoring System Appendix D Table D.1: Picture evaluation results from evaluator 1. 2 3 1 2 3 1 2 3 1 2 3 1 2 3 Walking on level ground 1 1 1 1 1 1 1 1 1 0 1 1 1 1 1 15 14 93.3% Stand-to-sit transition 0 1 1 1 1 1 1 1 1 NOP IC 1 1 1 1 1 14 13 92.9% Sitting 0 1 1 1 1 1 1 1 1 1 1 1 1 1 1 15 14 93.3% Sit-to-stand 1 1 1 1 1 1 1 1 1 1 1 1 1 1 1 15 15 100.0% Walking on level ground 0 1 1 1 1 1 1 0 1 0 1 0 1 1 1 15 11 73.3% Standing waiting for elevator 1 1 1 1 1 1 1 1 1 NA 1 1 0 1 0 14 12 85.7% Walking to get in the elevator 0 0 0 0 0 0 NOP IC 0 0 NA 1 0 0 0 0 13 1 7.7% Taking elevator to 2 floor 1 1 1 0 1 1 NOP IC 1 1 1 0 1 0 1 1 14 11 78.6% Subject 2 Subject 3 Subject 4 Subject5 Change-of-State # of Success % of Success in identifying context 154 Appendix D 1 # of Picture s Subject 1 Development of a Wearable Mobility Monitoring System Walking to get out of elevator and keep walking on level ground 1 1 1 1 1 1 1 1 1 1 1 1 1 1 1 15 15 Standing waiting for elevator 1 1 1 1 1 1 1 1 1 1 1 1 1 1 0 15 14 Walking to get in the elevator 0 0 0 0 0 0 0 NOP IC 0 0 0 1 0 0 0 14 1 Taking elevator to 1 floor 1 1 1 1 1 0 1 NOP IC 1 0 1 1 1 1 1 14 12 85.7% Walking to get out of elevator and keep walking on level ground 1 1 0 1 1 1 1 1 1 0 1 1 1 1 1 15 13 86.7% Walking up stairs NOP IC NOPI C 1 NOP IC NOP IC NOP IC NOP IC 1 NOP IC NOP IC NOP IC NOP IC NOP IC NOP IC NOP IC 2 2 100.0% Walking on stair intermediate landing (level ground for approx 1.5 meter) NOP IC 1 1 NOP IC NOP IC NOP IC NOP IC NOP IC NOP IC NOP IC NOP IC 1 1 1 1 6 6 100.0% Walking up stairs 1 1 1 NOP IC NOP IC NOP IC NOP IC NOP IC NOP IC NOP IC NOP IC 1 1 1 NOP IC 6 6 100.0% Walking on level ground 1 NOPI C 1 NOP IC 0 NOP IC NOP IC NOP IC 1 NOP IC NOP IC NOP IC NOP IC NOP IC NOP IC 4 3 75.0% Walking down stairs 0 0 0 0 0 0 0 0 0 0 0 0 0 0 0 15 0 0.0% NOP IC NOPI C NOP IC 0 0 0 0 0 NOP IC 0 0 NOP IC 0 0 0 10 0 93.3% 7.1% 0.0% 155 Appendix D Walking on stair intermediate landing (level ground for approx 1.5 meter) 100.0% Development of a Wearable Mobility Monitoring System Walking down stairs 0.0% NOP IC NOPI C NOP IC 0 0 0 0 0 NOP IC NOP IC 0 0 0 0 0 10 0 Walking on level ground 1 1 1 1 1 0 0 1 1 0 1 1 1 1 0 15 11 73.3% Stand-to-lie transition 1 1 1 1 1 1 1 1 1 1 1 1 1 1 1 15 15 100.0% Lying 1 1 1 1 1 1 1 1 1 1 1 1 1 1 1 15 15 100.0% Lie-to-Stand transition 1 1 1 1 1 1 1 1 1 1 1 1 1 1 1 15 15 100.0% Walking on level ground 0 0 0 1 0 1 1 1 1 0 1 0 1 1 1 15 9 60.0% Walking on ramp 0 1 0 NOP IC NOP IC NOP IC NOP IC 1 NOP IC 0 0 NOP IC NOP IC NOP IC NOP IC 6 2 Walking on level ground 1 0 NOP IC NOP IC NOP IC NOP IC NOP IC 0 0 NOP IC 1 0 NOP IC 1 NOP IC 7 3 42.9% Transition indoor/outdoor and keep walking on level ground NOP IC NOPI C NOP IC 1 1 1 1 NOP IC NOP IC 1 1 1 NOP IC NOP IC NOP IC 7 7 100.0% Transition outdoor/indoor and keep walking on level ground NOP IC NOPI C NOP IC 1 1 0 1 NOP IC NOP IC 1 0 1 NOP IC NOP IC NOP IC 7 5 71.4% Transition indoor/outdoor and keep walking on level ground NOP IC NOPI C NOP IC 1 NOP IC NOP IC 1 NOP IC NOP IC NOP IC NOP IC 1 NOP IC NOP IC NOP IC 3 3 33.3% 156 Appendix D 100.0% Development of a Wearable Mobility Monitoring System 86.7% Stand-to-sit transition to get in the car 0 1 1 1 1 1 0 1 1 1 1 1 1 1 1 15 13 Sitting in the car 0 1 1 1 1 1 1 1 1 1 1 1 1 1 1 15 14 93.3% Starts of car ride NOP IC 1 NOP IC NOP IC 1 1 1 1 1 NOP IC NOP IC 1 1 1 1 10 10 100.0% Stop of car ride NOP IC 1 NOP IC NOP IC NA 1 1 1 0 NOP IC NOP IC 1 1 1 1 9 8 88.9% 0 1 1 1 1 1 1 1 1 1 1 1 NOP IC NOP IC 1 13 12 92.3% Walking outside on level ground NOP IC 1 1 1 1 1 1 1 1 1 1 1 1 0 1 14 13 92.9% Transition outdoor/indoor and keep walking on level ground NOP IC NOPI C NOP IC NOP IC NOP IC 0 NOP IC NOP IC NOP IC 0 0 1 NOP IC NOP IC NOP IC 4 1 25.0% Standing 1 1 1 1 1 1 1 1 1 1 NA 1 1 1 1 14 14 100.0% Total Number of Pictures 27 30 29 29 30 31 29 29 28 26 30 34 29 30 29 440 Total Number of Success 16 25 23 23 23 22 23 23 23 15 22 28 22 24 21 59.3 % 83.3% 79.3 % 79.3 % 76.7 % 71.0 % 79.3 % 79.3 % 82.1 % 57.7 % 73.3 % 82.4 % 75.9 % 80.0 % 72.4 % Sit-to-stand transition Total % of Successfully Identifying Context 333 75.7% Appendix D 157 Development of a Wearable Mobility Monitoring System Table D.2: Picture evaluation results from evaluator 2. Subject 1 Change-of-State Subject 2 Subject 3 Subject 4 Subject 5 # of Picture s # of Succes s % of Success in identifying context 2 3 1 2 3 1 2 3 1 2 3 1 2 3 Walking on level ground 0 1 0 1 1 1 1 1 1 1 1 1 1 1 1 15 13 86.7% Stand-to-sit transition 1 1 1 1 1 1 1 1 1 NOP IC 1 1 1 1 1 14 14 100.0% Sitting 1 1 1 1 1 1 1 1 1 1 1 1 1 1 1 15 15 100.0% Sit-to-stand 1 1 1 1 1 1 1 1 1 1 1 1 1 1 1 15 15 100.0% Walking on level ground 1 1 1 1 1 1 1 1 1 0 1 1 1 1 1 15 14 93.3% Standing waiting for elevator 1 1 1 1 1 1 1 1 1 NA 1 1 1 1 1 14 14 100.0% Walking to get in the elevator 0 0 0 0 0 0 NOP IC 0 0 NA 0 1 1 1 0 13 3 23.1% Taking elevator to 2 floor 1 1 1 0 0 0 NOP IC 1 1 1 1 1 0 1 1 14 10 71.4% Walking to get out of elevator and keep walking on level ground 1 1 1 1 1 1 1 1 1 1 1 1 1 1 1 15 15 100.0% Standing waiting for elevator 1 1 1 1 1 1 1 1 1 1 1 1 1 1 1 15 15 100.0% 158 Appendix D 1 Development of a Wearable Mobility Monitoring System 0 0 0 0 0 0 1 NOP IC 0 1 0 1 0 1 1 14 5 Taking elevator to 1 floor 1 1 1 0 0 0 1 NOP IC 0 0 1 0 1 1 1 14 8 Walking to get out of elevator and keep walking on level ground 1 1 0 1 1 1 1 1 1 0 1 1 1 1 1 15 13 86.7% Walking up stairs NOP IC NOPI C 0 NOP IC NOP IC NOP IC NOP IC 1 NOP IC NOP IC NOP IC NOP IC NOP IC NOP IC NOP IC 2 1 50.0% Walking on stair intermediate landing (level ground for approx 1.5 meter) NOP IC 1 1 NOP IC NOP IC NOP IC NOP IC NOP IC NOP IC NOP IC NOP IC 1 1 1 1 6 6 100.0% Walking up stairs 0 1 1 NOP IC NOP IC NOP IC NOP IC NOP IC NOP IC NOP IC NOP IC 0 1 1 NOP IC 4 4 100.0% Walking on level ground 1 NOPI C 0 NOP IC 1 NOP IC NOP IC NOP IC 1 NOP IC NOP IC NOP IC NOP IC NOP IC NOP IC 4 3 75.0% Walking down stairs 0 0 0 0 0 0 0 0 0 0 0 0 0 0 0 15 0 0.0% Walking on stair intermediate landing (level ground for approx 1.5 meter) NOP IC NOPI C NOP IC 0 0 0 0 0 NOP IC 0 0 NOP IC 0 0 0 10 0 0.0% Walking down stairs NOP IC NOPI C NOP IC 0 0 0 0 0 NOP IC NOP IC 0 0 0 0 0 10 0 0.0% Walking on level ground 1 1 1 1 1 0 0 1 1 0 1 1 1 1 0 15 11 Stand-to-lie transition 1 1 1 1 1 1 1 1 1 1 1 1 1 1 1 15 15 35.7% 57.1% 73.3% 100.0% Appendix D 159 Walking to get in the elevator Development of a Wearable Mobility Monitoring System Lying 0 1 1 0 1 1 1 1 1 1 1 1 1 1 1 15 13 86.7% Lie-to-Stand transition 1 1 1 1 1 1 1 1 1 1 1 1 1 1 1 15 15 100.0% Walking on level ground 0 0 0 0 0 1 1 1 1 0 0 0 1 1 1 15 7 46.7% Walking on ramp 0 0 0 NOP IC NOP IC NOP IC NOP IC 0 NOP IC 0 0 NOP IC NOP IC NOP IC NOP IC 6 0 0.0% Walking on level ground 1 0 NOP IC NOP IC NOP IC NOP IC NOP IC 1 0 NOP IC 0 0 NOP IC 1 NOP IC 7 3 42.9% Transition indoor/outdoor and keep walking on level ground NOP IC NOPI C NOP IC 1 0 0 1 NOP IC NOP IC 1 1 1 NOP IC NOP IC NOP IC 7 5 71.4% Transition outdoor/indoor and keep walking on level ground NOP IC NOPI C NOP IC 0 0 0 0 NOP IC NOP IC 1 1 1 NOP IC NOP IC NOP IC 7 3 Transition indoor/outdoor and keep walking on level ground NOP IC NOPI C NOP IC 1 NOP IC NOP IC 1 NOP IC NOP IC NOP IC NOP IC 1 NOP IC NOP IC NOP IC 3 3 100.0% Stand-to-sit transition to get in the car 0 1 0 1 1 1 1 1 1 0 1 1 1 1 1 15 12 80.0% 42.9% Appendix D 160 Development of a Wearable Mobility Monitoring System Sitting in the car 0 1 0 1 1 1 1 1 1 0 1 1 1 1 1 15 12 80.0% Starts of car ride NOP IC 1 NOP IC NOP IC 1 1 1 1 1 NOP IC NOP IC 1 1 1 1 10 10 100.0% Stop of car ride NOP IC 1 NOP IC NOP IC NA 1 1 0 1 NOP IC NOP IC 1 1 1 1 10 8 80.0% 0 0 1 1 0 0 1 1 1 1 1 1 NOP IC NOP IC 1 13 9 Walking outside on level ground NOP IC 1 1 0 0 1 1 1 1 1 1 1 1 0 1 15 11 73.3% Transition outdoor/indoor and keep walking on level ground NOP IC NOPI C NOP IC NOP IC NOP IC 0 NOP IC NOP IC NOP IC 0 1 1 NOP IC NOP IC NOP IC 4 2 50.0% Standing 1 1 1 1 1 1 1 1 1 1 NA 1 1 1 1 14 14 100.0% Total Number of Pictures 27 30 29 29 30 31 29 29 28 26 30 34 29 30 29 440 Total Number of Success 16 23 18 18 18 19 24 23 23 15 22 28 24 26 24 59.3 % 76.7% 62.1 % 62.1 % 60.0 % 61.3 % 82.8 % 79.3 % 82.1 % 57.7 % 73.3 % 82.4 % 82.8 % 86.7 % 82.8 % Sit-to-stand transition Total % of Successfully Identifying Context 69.2% 321 73.0% Appendix D 161 Appendix E Appendix E This appendix contains the ethics approval letters from University of Ottawa Research Ethics Board and the Ottawa Hospital Research Ethics Board. Development of a Wearable Mobility Monitoring System 162 Appendix E Development of a Wearable Mobility Monitoring System 163 Appendix E Development of a Wearable Mobility Monitoring System 164 Appendix E Development of a Wearable Mobility Monitoring System 165