1
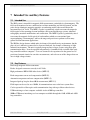
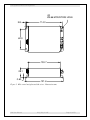
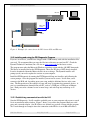
H10
MFP-25 / MFP-2.5
Magnetic Probe System
User Manual
Pyramid Technical Consultants, Inc.
1050 Waltham Street Suite 200, Lexington MA 02421 USA
US: TEL: (781) 402 1700 ♦ FAX: (781) 402-1750 ♦ EMAIL: [email protected]
Europe: TEL: +44 1273 493590
PSI System Controls and Diagnostics
1 Contents
1
Contents ..............................................................................................................................................................2
2
Table of Figures ..................................................................................................................................................5
3
Safety Information .............................................................................................................................................6
4
Models .................................................................................................................................................................8
5
Scope of Supply ..................................................................................................................................................9
6
Optional Items ..................................................................................................................................................10
7
6.1
Power supplies ..............................................................................................................................................10
6.2
Data cables....................................................................................................................................................10
6.3
Fiber-optic loop ............................................................................................................................................10
6.4
DIN rail mount ..............................................................................................................................................10
Intended Use and Key Features ......................................................................................................................11
7.1
Intended Use..................................................................................................................................................11
7.2
Key Features .................................................................................................................................................11
8
Specification......................................................................................................................................................12
9
Installation ........................................................................................................................................................18
9.1
Mounting .......................................................................................................................................................18
9.2
Grounding and power supply ........................................................................................................................19
9.3
Connection to equipment ...............................................................................................................................20
9.3.1
10
Typical setup ........................................................................................................................................20
Getting Started using the Pyramid Diagnostic Host Programs ....................................................................22
10.1
Preparing the H10 for operation ..............................................................................................................22
10.2
Installing and using the PSI Diagnostic Program ....................................................................................23
H10 User Manual
H10_UM_121105
Page 2 of 59
PSI System Controls and Diagnostics
10.2.1
Establishing communication with the H10 ......................................................................................23
10.2.2
Data tab ...........................................................................................................................................25
10.2.3
Setup tab..........................................................................................................................................29
10.2.4
Device tab .......................................................................................................................................31
10.3
Installing and using the PTC G2 Diagnostic Program ............................................................................32
10.3.1
11
12
13
14
Magnetic Measurements ..................................................................................................................................35
11.1
Measures of Magnetic Field Strength.......................................................................................................35
11.2
Field vectors .............................................................................................................................................36
11.3
Rate of Change of Magnetic Flux Density ................................................................................................37
Circuit overview ...............................................................................................................................................38
12.1
MFP-25 Probe ..........................................................................................................................................38
12.2
MFP-2.5 probe .........................................................................................................................................39
12.3
H10 Control Unit ......................................................................................................................................39
Calibration ........................................................................................................................................................41
13.1
Calibration Parameters ............................................................................................................................41
13.2
Temperature Coefficients..........................................................................................................................41
Connectors ........................................................................................................................................................43
14.1
H10 control unit front panel connectors ..................................................................................................43
14.1.1
14.2
15
Establishing communication with the H10 ......................................................................................33
Probe connection .............................................................................................................................43
Rear panel connectors ..............................................................................................................................43
14.2.1
Power input .....................................................................................................................................43
14.2.2
Fiber-optic communications ............................................................................................................44
Controls and Indicators ...................................................................................................................................45
15.1
Front panel controls .................................................................................................................................45
15.2
Rear panel controls ..................................................................................................................................45
15.2.1
15.3
Address switch ................................................................................................................................45
Front panel indicators ..............................................................................................................................45
H10 User Manual
H10_UM_121105
Page 3 of 59
PSI System Controls and Diagnostics
15.4
15.4.1
Power ..............................................................................................................................................45
15.4.2
Activity............................................................................................................................................45
15.4.3
Network...........................................................................................................................................45
15.4.4
Device .............................................................................................................................................46
15.5
16
Rear panel indicators ...............................................................................................................................45
Internal settings ........................................................................................................................................46
15.5.1
SW2 settings ...................................................................................................................................46
15.5.2
JPR1 settings ...................................................................................................................................46
Software updates ..............................................................................................................................................47
16.1
FPGA firmware updates ...........................................................................................................................47
16.2
PIC microcontroller firmware updates.....................................................................................................48
17
Versions and Compatibility .............................................................................................................................50
18
Fault-finding .....................................................................................................................................................51
19
Maintenance .....................................................................................................................................................54
20
Returns procedure ...........................................................................................................................................55
21
Support..............................................................................................................................................................56
22
Disposal .............................................................................................................................................................57
23
Declaration of Conformity ..............................................................................................................................58
24
Revision History ...............................................................................................................................................59
H10 User Manual
H10_UM_121105
Page 4 of 59
PSI System Controls and Diagnostics
2 Table of Figures
Figure 1. H10 control unit end panels. Dimensions mm. ..........................................................................................15
Figure 2. H10 control unit plan and side views. Dimensions mm. .............................................................................16
Figure 3. MFP25 and MFP-2.5 field probe geometry Dimensions mm. ..................................................................17
Figure 4. Probe orientation for a positive field reading (MFP-25 probe; +ve gain coefficient)..................................18
Figure 5. Probe orientation for a positive field reading (MFP-2.5 probe; +ve gain coefficient).................................18
Figure 6. Schematic example H10 setup. ....................................................................................................................20
Figure 7. Schematic example setup for electromagnet field control. ..........................................................................21
Figure 8. Example of a connection to the H10 via an A500 and Ethernet. .................................................................23
Figure 9. PSI Diagnostic Search Utility – adding a target IP address and port ...........................................................24
Figure 10. PSI Diagnostic Search Utility – detection in progress ...............................................................................25
Figure 11. Data tab: MFP-25 probe. ...........................................................................................................................26
Figure 12. Data tab: MFP-2.5 probe. ..........................................................................................................................26
Figure 13. Setup tab – MFP-25 probe ........................................................................................................................29
Figure 14. Setup tab – MFP-2.5 probe .......................................................................................................................30
Figure 15. Device tab, showing firmware update utility controls. ..............................................................................31
Figure 16. PTC Diagnostic G2 discovery dialog after Discover Controllers. .............................................................34
Figure 17. System pane showing an H10 connected via an A500 controller ..............................................................34
Figure 18. H10 data display in PTC Diagnostic G2 ...................................................................................................34
Figure 19. Direction convention for magnetic field lines............................................................................................36
Figure 20. Direction convention for magnetic field lines............................................................................................36
Figure 21. MFP-25 probe block schematic. ................................................................................................................38
Figure 22. MFP-2.5 block schematic. .........................................................................................................................39
Figure 23. H10 control unit block schematic. ............................................................................................................39
Figure 24. Example of MFP-20 temperature compensation. ......................................................................................42
Figure 25. Location of internal switches and jumpers. ...............................................................................................46
Figure 26. Selecting the fhex file to load. ...................................................................................................................47
Figure 27. Restart prompt after FPGA update. ...........................................................................................................48
Figure 28. Selecting the hex file to load. ....................................................................................................................49
Figure 29. Firmware upload in progress .....................................................................................................................49
H10 User Manual
H10_UM_121105
Page 5 of 59
PSI System Controls and Diagnostics
3 Safety Information
This unit is designed for compliance with harmonized electrical safety standard EN610101:2000. It must be used in accordance with its specifications and operating instructions.
Operators of the unit are expected to be qualified personnel who are aware of electrical safety
issues. The customer’s Responsible Body, as defined in the standard, must ensure that operators
are provided with the appropriate equipment and training.
The unit is designed to make measurements in Measurement Category I as defined in the
standard.
Although the H10 does not generate dangerous voltages, nor is it designed to measure directly
such voltages, in your application it may be measuring the field in electromagnets with high
voltages present. Appropriate precautions must be taken.
The unit must not be operated unless correctly assembled in its case. Only Service Personnel, as
defined in EN61010-1, should attempt to work on the disassembled unit, and then only under
specific instruction from Pyramid Technical Consultants, Inc. or their authorized distributors.
The unit is designed to operate from +24VDC power, with a maximum current requirement of
250mA. A suitably rated power supply module is available as an option.
The unit must be grounded by secure connection to a grounded conducting surface. If the unit is
mounted on an insulating surface, then one of the four mounting screws must be re-assigned as a
grounding connection.
Some of the following symbols may be displayed on the unit, and have the indicated meanings.
H10 User Manual
H10_UM_121105
Page 6 of 59
PSI System Controls and Diagnostics
Direct current
Earth (ground) terminal
Protective conductor terminal
Frame or chassis terminal
Equipotentiality
Supply ON
Supply OFF
CAUTION – RISK OF ELECTRIC SHOCK
CAUTION – RISK OF DANGER – REFER TO MANUAL
H10 User Manual
H10_UM_121105
Page 7 of 59
PSI System Controls and Diagnostics
4 Models
H10-SYS9-2T
H10 system comprising H10 control unit, MFP-25 magnetic field probe
and 9’ (2.7 m) cable.
H10-SYS22-2T
H10 system comprising H10 control unit, MFP-25 magnetic field probe
and 22’ (6.7 m) cable.
MFP-25
Precision magnetic field probe with +/- 2.5 T range.
H10-SYS9
H10 system comprising H10 control unit, MFP-2.5 magnetic field
probe and 9’ (2.7 m) cable.
H10-SYS22
H10 system comprising H10 control unit, MFP-2.5 magnetic field
probe and 22’ (6.7 m) cable.
MFP-2.5
Magnetic field probe with +/- 0.25 T range and dB/dt coil.
H10 User Manual
H10_UM_121105
Page 8 of 59
PSI System Controls and Diagnostics
5 Scope of Supply
H10 system model as specified in your order.
USB memory stick containing:
User manual
PSI Diagnostic software guide
PSI diagnostic software files
Power supply
Optional items as specified in your order.
OEM customers may not receive all the items listed.
H10 User Manual
H10_UM_121105
Page 9 of 59
PSI System Controls and Diagnostics
6 Optional Items
6.1 Power supplies
PSU24-40-1. +24 VDC 1.6 A PSU (100-250 VAC, 50-60 Hz, IEC C14 3-pin plug receptacle)
with output lead terminated in 2.1mm threaded jack.
6.2 Data cables
CAB-ST-P-x-ST Fiber-optic cable, 1 mm plastic, ST terminated, x m long.
CAB-ST-HCS-x-ST Fiber-optic cable, 200 um silica, ST terminated, x m long.
6.3 Fiber-optic loop
A200 USB to fiber-optic adaptor.
A360 fiber-optic loop controller / Ethernet adaptor.
A500 intelligent real-time controller with Ethernet interface.
A560 intelligent real-time controller with Ethernet interface.
6.4 DIN rail mount
MTG-DIN35-11462. Mounting adaptor for 35mm standard DIN rail. H10 control unit can be
mounted along or across the rail.
H10 User Manual
H10_UM_121105
Page 10 of 59
PSI System Controls and Diagnostics
7 Intended Use and Key Features
7.1 Intended Use
The H10 system is intended for magnetic field measurement, particularly in electromagnets. The
field can be monitored at rates sufficient for real-time monitoring and for field control, and the
probe design eliminates magnetic materials or conducting surfaces that would distort the
measurement of AC fields. The MFP-2.5 probe is particularly suited to measure the magnetic
fields typical of fast scanning electron beamlines such as medical therapy systems, industrial
radiography, materials modification, and sterilization. The MFP-25 probe is particularly suited
to measure the magnetic fields typical of ion beamlines which use conventional (nonsuperconducting) electromagnets, and has the range and precision to perform well in many
general field measurement applications.
The H10 has design features which make it tolerant of electrically noisy environments, but the
place of use is otherwise assumed to be clean and sheltered, for example a laboratory or light
industrial environment. The unit is typically integrated into a larger system, using fiber optic
communication links. It can be operated independently, if combined with a suitable fiber optic
loop controller and host computer. Users are assumed to be experienced in the general use of
precision electronic circuits for sensitive measurements, and to be aware of the dangers that can
arise in high-voltage circuits.
7.2 Key Features
Dual-range magnetic field measurement.
Probes designed to measure correctly in AC fields.
High performance HE244 Hall effect device (MFP-25).
Probe temperature sensor and compensation (MFP-25).
Automatic temperature and zero compensation (MFP-2.5).
Integrated pick up loop for direct dB/dt measurement (MFP-2.5).
Field inputs can be read at over 10 kHz, if communications rates to the host system allow.
Can be operated in a fiber-optic serial communication loop with up to fifteen other devices.
USB interfacing to a host computer available via the A200 loop controller.
100BaseT Ethernet interfacing to a host computer available through the A360, A500 and A560
loop controllers.
H10 User Manual
H10_UM_121105
Page 11 of 59
PSI System Controls and Diagnostics
8 Specification
MFP-25 probe
Analog signals
Magnetic flux density
Probe temperature / Hall device current source voltage
Field ranges
+/- 2.5 Tesla (+/-25 kGauss)
+/- 0.625 Tesla (+/-6.25 kGauss)
Selected by software control.
Sensitive area
< 1 mm square (1 mm2)
Field direction
Field entering the marked top surface of the probe gives a positive
field reading (see figure 4).
Absolute accuracy
Better than 0.01% of full scale of selected range at 25 C.
Temperature coefficient of
gain (negative)
< 200 ppm C-1 (temperature compensation disabled)
Temperature coefficient of
offset
< 0.05 Gauss C-1 (temperature compensation disabled)
Noise
< 0.005 % rms relative to full scale with lowest downsampling
setting.
< 50 ppm C-1 (temperature compensation enabled)
< 0.01 Gauss C-1 (temperature compensation enabled)
< 0.0005% rms relative to full scale at 100 msec averaging.
Step response
Better than 100 usec to within 0.1% of full scale deviation from
target setting for any instantaneous field step. Observed step
depends on selected downsampling.
Resolution
Smallest increment of field 0.61 Gauss (2 Tesla range), 0.15
Gauss (0.5 Tesla range) before averaging.
Linearity
0.05 % maximum deviation relative to full scale of any point from
linear fit to all points over full span.
Connector
Lemo 10-way EXG.1B.310
Probe body materials
Glass-reinforced polycarbonate, FR4 fiberglass epoxy.
Weight
60 g (2.1 oz)
Dimensions
(see figure 3)
MFP-2.5 probe
Analog signals
H10 User Manual
Magnetic flux density
H10_UM_121105
Page 12 of 59
PSI System Controls and Diagnostics
Pickup loop signal (field rate of change)
Hall sensor
Field ranges
+/- 0.25 Tesla (+/-2.5 kGauss)
+/- 0.025 Tesla (+/-250 Gauss)
Selected by software control.
Sensitive area
0.5 mm square (0.25 mm2)
Field direction
Field entering the marked top surface of the probe gives a positive
field reading (see figure 4).
Absolute accuracy
Better than 0.8% of full scale of selected range at 25 C.
Temperature coefficient of
gain
< 100 ppm C-1
Temperature coefficient of
offset
< 0.2 Gauss C-1
Step response
Better than 250 usec to within 0.1% of full scale deviation from
target setting for any instantaneous field step. Observed step
depends on selected downsampling.
Resolution
Smallest increment of field 0.08 Gauss (0.25 Tesla range), 0.008
Gauss (0.025 Tesla range) before averaging.
Linearity
0.05 % maximum deviation relative to full scale of any point from
linear fit to all points over full span.
Pickup loop sensor
Ranges
+/- 200 T s-1
+/- 20 T s-1
Selected by software control.
Sensitive area
150 mm2, five turns
Absolute accuracy
< 0.2% of full scale
Linearity
0.5 % maximum deviation relative to full scale of any point from
linear fit to all points over full span.
Temperature coefficient of
gain
< 0.05% C-1
Bandwidth
10 Hz to 50 kHz (- 3dB)
Connector
Lemo 10-way EXG.1B.310
Probe body materials
Glass-reinforced polycarbonate, FR4 fiberglass epoxy.
Weight
60 g (2.1 oz)
H10 User Manual
H10_UM_121105
Page 13 of 59
PSI System Controls and Diagnostics
Dimensions
(see figure 3)
H10 control unit
Digitization
16 bit successive approximation over full range
Sample rate
50 kSa s-1
Downsampling
Averaging from 4 to 50,000 conversions per reading
Calibration
Gain and offset values for each analog signal and each range
stored in EEPROM.
Communications to loop
controller
Fiber optic (10 Mbit/sec)
Data rate through to host
computer
1 kHz typical, up to 10 kHz in lightly-loaded networks and fast
host systems
Probe connector
Lemo 10-way EXG.1B.310
Controls
16 position rotary switch for loop address selection
Displays
Four LEDs (power, activity, network, device).
Power input
+24 VDC (+12 V, -4 V), 100 mA typical, 200 mA maximum.
Case
Stainless steel.
Case protection rating
The case is designed to rating IP43 (protected against solid
objects greater than 1mm in size, protected against spraying
water).
Weight
0.24 kg (0.55 lb).
Operating environment
0 to 35 C (15 to 25 C recommended to reduce drift and offset)
< 80% humidity, non-condensing
vibration < 0.2 g all axes (1 to 1000Hz)
Shipping and storage
environment
-10 to 50C
< 80% humidity, non-condensing
vibration < 2 g all axes, 1 to 1000 Hz
Dimensions
(see figures 1 and 2).
H10 User Manual
H10_UM_121105
Page 14 of 59
PSI System Controls and Diagnostics
Rcv
Address
CAL
STATUS
Xmit
POWER
RUN
Power
+24VDC
POWER IN
FIBER-OPTIC TX
FIBER-OPTIC RX
STATUS LEDs
ADDRESS
SELECTOR
HALL PROBE INPUT
77.5
79.9
Figure 1. H10 control unit end panels. Dimensions mm.
H10 User Manual
H10_UM_121105
Page 15 of 59
PSI System Controls and Diagnostics
4X
Ø3.66 MOUNTING HOLE
3.8
114.0
62.0
103.7
28.1
0.60
121.6
Figure 2. H10 control unit plan and side views. Dimensions mm.
H10 User Manual
H10_UM_121105
Page 16 of 59
PSI System Controls and Diagnostics
Figure 3. MFP25 and MFP-2.5 field probe geometry Dimensions mm.
H10 User Manual
H10_UM_121105
Page 17 of 59
PSI System Controls and Diagnostics
9 Installation
9.1 Mounting
The MFP probe should be mounted so that the sensitive spot is located in the field you want to
measure. It will measure the field component normal to the flat surface of the probe. The
polarity depends on the probe type. The MFP-25 probe will show a positive value for a field
vector entering on the centre of the bullseye pattern.
N
S
Figure 4. Probe orientation for a positive field reading (MFP-25 probe; +ve gain coefficient).
The MFP-2.5 probe will show a negative value for a field vector entering on the centre of the
bullseye pattern.
S
N
Figure 5. Probe orientation for a positive field reading (MFP-2.5 probe; +ve gain coefficient).
H10 User Manual
H10_UM_121105
Page 18 of 59
PSI System Controls and Diagnostics
If you have both types of probe in your system, and want them to have the same response to field
direction, then you can simply invert the calibration gain factor of one type to achieve this.
The mounting should prevent any tendency for movement or vibration, especially if the probe is
measuring a fringe field where there is field curvature. If the field has significant AC
components, the mounting should be non-conducting to avoid measurement errors due to eddy
currents.
The H10 control unit must be mounted within cable reach of the MFP probe. Two standard cable
lengths are available, 9 foot and 22 foot, with the shorter cable preferred for best noise
performance. The control unit may be mounted in any orientation, or may be simply placed on a
level surface. Four M3 clear holes are provided in the base flange on a 62 mm by 114 mm
rectangular pattern (see figure 2). A DIN rail adaptor is available for the H10 control unit.
The mounting position should allow sufficient access to connectors and cable bend radii. Leave
60mm clearance at either end for mating connectors and cable radii.
H10 system includes temperature compensation, but you will get maximum precision if the
control unit, and particularly the probe, are in a temperature-controlled environment. No forcedair cooling is required, but free convection should be allowed around the cases.
9.2 Grounding and power supply
A secure connection should be made via the H10 control unit mounting flange to local ground
potential. If the unit is mounted on an insulating surface, then one of the four mounting screws
must be re-assigned as a grounding connection.
+24 VDC power should be provided from a suitably-rated power supply with the following
minimum performance. If you purchased your H10 as an end-user, a compatible power supply
will have been provided.
Output voltage
+24 +/- 0.5 VDC
Output current
300 mA minimum, 2000 mA maximum
Ripple and noise
< 100 mV pk-pk, 1 Hz to 1 MHz
Line regulation
< 240 mV
The H10 is tolerant of line voltage in the range 18 VDC to 36 VDC, although we recommend
using a 24 V supply with reasonable output regulation, as indicated. The H10 includes an
internal automatically re-setting PTC fuse rated at 1.1 A. However the external supply should in
no circumstances be rated higher than the H10 connector limit of 5 A, and a maximum of 2.0 A
is recommended.
H10 User Manual
H10_UM_121105
Page 19 of 59
PSI System Controls and Diagnostics
9.3
Connection to equipment
9.3.1 Typical setup
Figure 6 shows a typical installation to monitor a magnetic field, in schematic form. An MFP
probe is measuring a field component normal to the flat face of the probe. It is connected to the
H10 control unit via the cable included with the H10 system. Note that this cable can be
connected either way round. The H10 is on a fiber-optic communication loop, under control of
one of the Pyramid Technical Consultants, Inc. loop controllers (A200, A360, A500, A560).
Software on the host computer displays the field readings and controls provided by the H10.
A5#0
Other
devices
H10
MFP-xx
Fiber-optic comms
+24V in
Figure 6. Schematic example H10 setup.
Once the H10 is included in such a system, it becomes practicable to implement closed-loop field
control, as illustrated in figure 7. The example shows both H10 and M10 on the same fiber optic
loop, but this is not essential. The M10 would typically be mounted on or in the power supply,
whereas the H10 must be close to the magnet; magnet and power supply may be some distance
apart. Software in the fiber optic loop controller, or in the host computer system, can control an
electromagnet power supply to reach a target as measured by the H10, using an M10 general
purpose I/O device to interface the power supply.
H10 User Manual
H10_UM_121105
Page 20 of 59
PSI System Controls and Diagnostics
A5#0
Magnet PSU
M10
+24V in
H10
MFP-xx
+24V in
Figure 7. Schematic example setup for electromagnet field control.
H10 User Manual
H10_UM_121105
Page 21 of 59
PSI System Controls and Diagnostics
10 Getting Started using the Pyramid Diagnostic Host
Programs
Usually you will use a custom application to communicate with the H10, either one you write
yourself using the software interfaces available from Pyramid Technical Consultants, Inc., or one
that is supplied by Pyramid. However you can get started immediately using one of the PSI
Diagnostic host programs. These are available for free download from www.ptcusa.com, and are
provided with the H10 for end-user customers. There are two generations of the Diagnostic
software, and the H10 is compatible with both.
PSI Diagnostic. This software supports all Pyramid products, apart from G2 devices. It allows
you to connect the H10 via an A500 controller. Ethernet communications use UDP with an
added reliability layer.
PTC Diagnostic G2. This software supports all G2 devices such as the A560, I128 and C400,
plus a growing selection of other Pyramid devices, including the H10. It allows you to connect
the H10 via an A500 or A560 controller. Ethernet communications use TCP/IP and UDP.
Both Diagnostics are standalone Windows programs which allow you to set outputs and read,
graph and log data from the H10. Their user interfaces are similar. For some applications one of
the Diagnostic programs may be adequate for all of your data acquisition needs. In any event it is
useful to understand what you can do with the Diagnostic programs, because they expose all of
the functions of the devices they connect to. Application programmers will find this useful to
help decide which functions to implement in their own host software.
It is useful to understand what you can do with the Diagnostic programs, because they expose all
of the functions of the H10. Application programmers will find it useful to help decide which
functions to implement in their host software.
10.1 Preparing the H10 for operation
Inspect the unit carefully to ensure there is no evidence of shipping damage. If there appears to
be damage, or you are in doubt, contact your supplier before proceeding.
Connect the probe to the H10 control unit using the cable supplied. Connect 24 V DC power.
The LEDs will go through a startup sequence when the power is applied. All four LEDs light,
then the power LED stays lit while the other three indicators light in sequence. When the H10
has started correctly, and prior to connecting to a controller, the power LED will remain lit and
the device LED will flash, showing that the device has automatically started measuring data.
It is simplest to start with to connect the H10 directly to a loop controller as the only device on
the loop. The address switch can be set to anything between 1 and 15. Figure 7 shows a
connection to an A500. The A500 controller has a static IP address defined by a software setting
of the first three bytes, and rear panel switches for the last byte. It is simplest if you set your PC
to an IP4 static address in the same subnet range. For example if the A500 has address
192.168.100.213, then the PC could be 192.168.100.113, with subnet mask 255.255.255.0.
H10 User Manual
H10_UM_121105
Page 22 of 59
PSI System Controls and Diagnostics
Ethernet
A500
Fiber-optic
comms
H10
+24V in
Figure 8. Example of a connection to the H10 via an A500 and Ethernet.
10.2 Installing and using the PSI Diagnostic Program
If you are an end-user, your H10 was shipped with a USB memory stick with the installation files
you need. We recommend that you copy the files into a directory on your host PC. Check the
Pyramid Technical Consultants, Inc. web site at www.ptcusa.com for the latest version.
The program runs under the Microsoft Windows operating system with the 4.0 .NET framework.
This has to be installed before the PSI Diagnostic. Most new PCs have .NET already installed.
It can be downloaded from the Microsoft web site at no charge. The Pyramid installer will
prompt you if you need to update the version on your computer.
Install the PSI Diagnostic by running the PTCDiagnosticSetup.msi installer, and following the
screen prompts. Once the program has installed, you can run it at once. It will allow you to
connect to the H10, and, depending upon your setup, multiple additional devices at the same
time. The Diagnostic uses the concepts of ports and loops to organize the connected devices. A
port is a communications channel from your PC, such as a COM port, a USB port or Ethernet
port. Each port can be a channel to one or more loops, and each loop may contain up to 15
devices.
10.2.1 Establishing communication with the H10
Start the PSI Diagnostic. It will search the available ports on your computer and present a search
list in an autodetect utility window. Figure 7 shows a case where the program found two serial
ports and a network adaptor. One IP address was defined in a previous session with the program.
We’ll work through an example where the connection to the H10 is via an A500 at IP address
H10 User Manual
H10_UM_121105
Page 23 of 59
PSI System Controls and Diagnostics
192.168.100.213. We can add this specific address to the network search to avoid the need to
broadcast to the whole LAN by typing the address followed by a colon and the standard port
number 100, as shown in the figure, and clicking “Add IP”.
Figure 9. PSI Diagnostic Search Utility – adding a target IP address and port
Check that the target port is checked for inclusion in the search and click the “Start” button. The
autodetection process will start (figure 10).
H10 User Manual
H10_UM_121105
Page 24 of 59
PSI System Controls and Diagnostics
Figure 10. PSI Diagnostic Search Utility – detection in progress
After a few seconds the program should find the H10 (plus any other devices you may have
connected). The System pane will show a tree of all the discovered devices. On the H10 control
unit itself you should see the network LED illuminate regularly to show that loop messages are
being processed.
10.2.2 Data tab
Clicking on the H10 entry in the explorer list will open the H10 window (figures 9 and 10) after a
few seconds. The screen layout details depend which probe type you are using. The device will
be acquiring data using default settings and you should see background noise values for the field
reading. The Device LED on the H10 will flash to show acquisition is in progress (it will turn
off if you abort the acquisition). You can display the signals either as a scrolling value against
time graph (like a chart recorder) or as an analog bargraph. Toggle to one of the fixed Y scales if
you want to inhibit autoscaling of the graph.
H10 User Manual
H10_UM_121105
Page 25 of 59
PSI System Controls and Diagnostics
Figure 11. Data tab: MFP-25 probe.
Figure 12. Data tab: MFP-2.5 probe.
H10 User Manual
H10_UM_121105
Page 26 of 59
PSI System Controls and Diagnostics
Select one of the fixed Y scales if you want to inhibit autoscaling of the graph. You can display
the analog signals either as a scrolling value against time graph (like a chart recorder) or as an
analog bargraph. The scope display mode looks the same as the strip chart, but the data is
displayed without scrolling for each 256 readings.
Try out the various screen controls and readouts to see their effect.
Initiate / Abort
These buttons start and stop data acquisition. Screen LEDs indicate
whether the H10 is measuring, triggered or streaming data to the controller
in fast mode. On the H10 control unit, you will see the Device LED
flashing when readings are being taken, and off when data taking is
aborted.
I/O
The analog readings displayed depend on the probe type.
For the MFP-25, analog channel one is used for the probe temperature
sensor and the Hall sensor compliance voltage (the voltage required to
establish the constant current). One or the other can be displayed. Analog
channel two is used for the field reading +/-25 kGauss (+/-2.5 T).
For the MFP-2.5, analog channel one is used for the dB/dt pickup loop
signal, and you can select a low gain (x1, +/-20 T s-1) or high gain (x10,
+/-200 T s-1) setting. Analog channel two is used for the field reading and
you can select from a +/-2.5 kGauss
The checked channels are displayed on the strip chart and scope mode
displays. For example you may wish to uncheck channel 1 so that you can
concentrate on the plotting of field. Note that this does not stop the data
being collected – both channels are always logged.
Triggers
This counter shows the number of readings made by the H10 since the last
initiate. The number of readings you can log on the host computer may be
less, depending on the number of readings you request, the averaging
period and the available data rate up to the loop controller and the host
computer.
Board temperature
This is a readback of the internal temperature of the H10 control unit in
degrees centigrade.
Buffer
The PSI Diagnostic collects data coming from the H10 into a buffer, with a
rate that is the lesser of the actual acquisition rate or the X axis rate setting.
The buffer contents can be cleared with the Clr button ( ), or can be
written to a .csv file with the save button ( ). The buffer number shows
how much data is currently in the buffer. The maximum allowed is 65535
bytes, after which the buffer wraps around to overwrite the earliest values.
You can toggle data plotting and accumulation into the buffer with the Run
Plot control (
/
). When the accumulation is halted, then the
slider is enabled, which allows you to scroll back through the data when in
strip chart mode.
H10 User Manual
H10_UM_121105
Page 27 of 59
PSI System Controls and Diagnostics
Y:
This drop-down controls the vertical scaling of the data plot. You can
select automatic scaling or various fixed proportions of the nominal 10 V
full scale.
Note that if you have both analog channels checked, you will be plotting
two different physical units at the same time, which can lead to lack of
vertical resolution. Uncheck the reading you are less interested in and set a
vertical scale for the remaining reading.
Display only
positive values
This control is enabled for fixed vertical scaling. It toggles the graphic
from a display that is symmetric around 0 to one that shows only 10% of
the vertical scale in the negative direction.
X:
This drop down controls how fast new points are added to the data plot and
the data log. For example, if your acquisition settings generate a value
every 100 msec but you have 1 second selected on this control, then every
tenth reading will be stored.
Filtering
The PSI Diagnostic can apply a filter to the plotted data to allow you to
pick small signals out of noise. This filter is independent of, and additional
to, the block averaging filtering implemented by the H10 itself. The PSI
Diagnostic filter is a simple IIR type, Yplot_N = Ynew/A + (1-1/A)Yplot_N-1,
where Ynew is the latest reading, Yplot_N is the current value to be plotted,
Yplot_N-1 is the prior plotted value and A is the averaging value from the
pull-down menu. You clear and restart the filter at any time by pressing
the reset button
.
The filtering affects the graphed data and digital displays. If you choose to
save the buffered data, you will have the opportunity to save the raw values
or the filtered values.
DC/AC
The DC/AC toggle removes the DC component from the strip chart or
scope mode graphic data, but does not affect the digital display or the
logged data.
/
Zero correction
/
When you press zero, the current values are captured and subtracted from
all subsequent readings as displayed on all the graphic and digital displays,
until you press the clear zeroes button . If you choose to save the
buffered data, you will have the opportunity to save the raw values or the
zero offset corrected values.
Differential display When this control is pressed, the graphic changes to display the difference
between successive readings. The buffered data is not affected.
Graphic mode
H10 User Manual
You can plot the data as a rolling strip chart or a bar chart (histogram). The
scope mode is a variant of the strip chart. Instead of a rolling chart, the
graphic is refreshed as a whole for each 256 samples. In histogram mode
you can place a cursor on a particular channel to read out its value.
H10_UM_121105
Page 28 of 59
PSI System Controls and Diagnostics
Clear buffered data. Values are cleared from the PSI Diagnostic data
buffer, but any acquisition in progress continues and timestamps are not
reset.
Save data buffer contents to csv file. When you click this button you will
see a drop down selection
which allows you to save either
the raw data, or the values with the PSI Diagnostic zero offset and
averaging
10.2.3 Setup tab
Click on the “Setup” tab. Here you can alter scaling, polarities, averaging and calibration values.
The details of the screen depend on the probe type.
Figure 13. Setup tab – MFP-25 probe
H10 User Manual
H10_UM_121105
Page 29 of 59
PSI System Controls and Diagnostics
Figure 14. Setup tab – MFP-2.5 probe
Trigger Points
The number of readings that the H10 will take after being initiated. If you
click the INF button, it will take readings indefinitely.
Averaging period
The two analog inputs are converted in the H10 control unit at 50 kSa/s. A
digital filter then averages the samples over the selected period to give the
final values that are transmitted back to the host system. The H10 starts up
with the integration period set to the inverse of the mains frequency, as set
on the Device tab.
Calibrate
These factors and offsets are determined during factory calibration of the
probe and H10 unit, and should not need further alteration. The green LED
by the MFP-25 probe serial number indicates that the original factory
calibration is valid, provided you have that probe connected. See section
13 for more details.
Pressing the Reset button returns all gains to defaults and offsets to zero.
Pressing the Zero button starts an automated zero offset compensation in
which the current zero values are measured for all relevant signals and
ranges, and the results are used as the offset values. The probe should be
shielded from magnetic fields before using this function.
H10 User Manual
H10_UM_121105
Page 30 of 59
PSI System Controls and Diagnostics
10.2.4 Device tab
Click on the “Device” tab. You can check the communication link status, read the H10
manufacturing serial number and verify the versions of the hardware and firmware. The page is
the same for both probe types. On the right is the firmware update utility. You can use this to
download firmware updates (.hex files) downloaded from the Pyramid Technical Consultants,
Inc. web site.
Figure 15. Device tab, showing firmware update utility controls.
Communication
The counters show details of the communications between the H10 and its
host loop controller. You can click the Reset Counters button to reset the
fields to zero.
System controls
Pressing :SAFEstate sets a mode in which the H10 goes to a defined safe
state if it does not communicate with its host controller in the timeout
period in seconds set by the :COMM:TIMEout parameter. Since the H10
is an input device only, this feature has little effect and can be ignored. If
you want to disable this feature, set the timeout to 0.
Pressing :AUTOrecover sets a state in which the H10 will attempt to restart
automatically if it detects data corruption.
The COMM:Term and COMM:Checksum controls are not used on the
H10. You can ignore them when using the PSI Diagnostic
The system controls are software password protected, so you will see a red
warning message at the bottom of the window when you use them. The
H10 User Manual
H10_UM_121105
Page 31 of 59
PSI System Controls and Diagnostics
PSI Diagnostic automatically sends the password.
Frequency
This parameter sets the averaging period that will be used by default on
power up. You should set it to the local line frequency.
SerialNumber
This is the manufacturing serial number of the H10 control unit, and should
be left unchanged.
Comm:Timeout
The time period in seconds without communications before the H10 goes
to the safe state. Set to zero if you don’t want this feature.
Select .hex file
This button starts the H10 PIC firmware update process. It opens a file
selection dialog. When you select a hex file it will start uploading to the
H10 immediately. Upon completion the H10 will restart automatically,
and you will see the new Device Version number displayed. See section ##
for more details.
Select .fhex file
This button starts the H10 FPGA firmware update process. It opens a file
selection dialog. When you select a fhex file it will start uploading to the
H10 immediately. Upon completion you will need to power cycle the H10,
which will cause the new code to be loaded. You will see the new FPGA
Version number displayed. See section ## for more details.
Reset
This button causes a full warm reset of the H10.
10.3 Installing and using the PTC G2 Diagnostic Program
The PTC Diagnostic G2 host software provides the same user functions as the PSI Diagnostic,
and has a similar look and feel, but it is built on a different software foundation. Unlike the PSI
Diagnostic, the PTC Diagnostic G2 uses the same DLL function libraries that Pyramid uses to
build user applications. These libraries can be provided to customers who want to build their
own applications. The G2 Diagnostic can often provide faster average data rates to the host by
its use of block data transfers. If you need a Diagnostic to operate the H10 in conjunction with
G2 devices such as the A560, I128, and C400, then you must use the PTC Diagnostic G2.
PTC Diagnostic G2 can coexist with the PSI Diagnostic on the same computer. Both programs
can in fact communicate with an A500 or A560 the H10 at the same time (the PSI Diagnostic
must be launched first), although this is not generally recommended, as the results could be very
confusing.
Since the two programs are similar, we shall concentrate on the differences.
Download the PTC Diagnostic G2 installer (.msi file) or find the copy on the USB memory stick
if you purchased the H10 as an end-user. We recommend that you copy the installer file into a
directory on your host PC. Check the Pyramid Technical Consultants, Inc. web site at
www.ptcusa.com for the latest version.
The program runs under the Microsoft Windows operating system with the 4.0 .NET framework.
This has to be installed before the PSI Diagnostic. Most new PCs have .NET already installed,
H10 User Manual
H10_UM_121105
Page 32 of 59
PSI System Controls and Diagnostics
or it can be downloaded from the Microsoft web site at no charge. The Pyramid installer will
prompt you if you need to update the version on your computer.
10.3.1 Establishing communication with the H10
Start the PTC Diagnostic G2. The program expects all connections to devices like the H10 be
via Ethernet ports, whether through dedicated loop controllers like the A500, A560 and A360, or
via other Ethernet-enabled devices that support slave devices, such as the I128. Unlike the PSI
Diagnostic, you do not need to specify the IP address.
When you launch the program, it will open the Discover Devices dialog. Pressing the Discover
Controllers button will give you a list of available controllers. The search will include all devices
visible on your accessible subnet, including any on the far end of a VPN link. In the following
example the search has found various controllers. If your target controller is not discovered, then
you can force it to be probed by adding its IP address specifically. Unlike the PSI Diagnostic,
you do not need to include a port number. The A60 Recovery entry is a diagnostic utility used
for some G2 devices, which you can ignore.
Note that the “Not Connected” message returned by A500 controllers can be ignored. This field
will be used in a future firmware release to show the IP address of the host device (your
computer).
H10 User Manual
H10_UM_121105
Page 33 of 59
PSI System Controls and Diagnostics
Figure 16. PTC Diagnostic G2 discovery dialog after Discover Controllers.
Highlight the target device, which is an A500 at 192.168.100.213 in this example, to enable the
Connect & Discover Subdevices button. Clicking this should result in the controller appearing in
the System area on the left, with its connected sub-devices shown.
Figure 17. System pane showing an H10 connected via an A500 controller
Clicking on the H10 entry opens a window for it, with the same basic strip chart and histogram
graphing options, and digital displays as used in the PSI Diagnostic.
(H10 support will be added to a future G2 Diagnostic release)
Figure 18. H10 data display in PTC Diagnostic G2
Checking the Auto Initiate button causes the program to automatically start data taking after you
make any change to the H10 parameters.
The Setup and Calibration buttons access areas that provide the same functions as the PSI
Diagnostic Setup tab.
The firmware update utility is accessed on the Properties area.
H10 User Manual
H10_UM_121105
Page 34 of 59
PSI System Controls and Diagnostics
11 Magnetic Measurements
11.1 Measures of Magnetic Field Strength
Hall probes measure the magnetic flux density (also called magnetic induction), but it is useful to
see how this related to other measures of the magnetic field.
There is a field around a current carrying conductor or a permanent magnet that exerts a force on
other current carrying conductors, moving charged particles, and compass needles. The force is
proportional to a measure of the field called the magnetic flux density. This is measured in teslas
(T), or kg m s-2 A-1 m-1 = kg s-2 A-1 in SI base units. One tesla is a high field by everyday
standards, and is typical of the field in the air gap of a particle beamline bending dipole
electromagnet. The old cgs unit is the Gauss, and this is still widely used.
1 T = 10e4 Gauss
1 T = 10 kGauss
The Earth’s magnetic field is around 0.5 Gauss at the surface of the Earth, varying with location
from about 0.25 to 0.65 Gauss.
It is common to describe the resistance of an energetic charged particle to being deflected by a
magnetic field by its magnetic rigidity, measured in Telsa meters (Tm). A one Tm beam in a one
T dipole field will bend with a radius of one m. An example of a one Tm beam would be 46.75
MeV protons.
The magnetic flux Φ which gives rise to the magnetic flux density is measured in Webers.
1 T = 1 Wb m-2
The old cgs unit of magnetic flux is the maxwell, but this is rarely used (1 Wb = 10e8 Mx).
You can consider that the magnetic field arises from a magnetizing field, H, which is due to the
motion of charged particles, usually electrons. In the SI system H is measured in amp per meter.
A magnetizing field H produces a magnetic flux density
B = µH
where µ is the permeability of the local medium. In vacuum the permeability µ 0 = 4π x 10-7
henry m-1. The permeabilities of other materials are expressed relative to this. In ferromagnetic
materials the relative permeability may be hundreds or thousands. Air has a relative permeability
of very nearly one, however, thus when you measure the B field with the H10 system, you also
get the H field in A m-1 after division by µ 0.
The old cgs unit for magnetizing field is the Oersted.
1 Oe = 1000/4π A m-1
and in vacuum 1 Oe creates 1 Gauss.
H10 User Manual
H10_UM_121105
Page 35 of 59
PSI System Controls and Diagnostics
11.2 Field vectors
The B field is a vector field, which you can decompose at any point into three orthogonal
components. Magnetic field lines are assumed by convention to point from the north pole to the
south pole of a magnet, A compass will point to the south pole of a magnet (thus there is a south
magnetic pole at the Earth’s magnetic north pole).
N
S
N
S
Figure 19. Direction convention for magnetic field lines
The MFP probe measures the field component that is perpendicular to the flat face of the probe,
at the position of the bulls eye mark. If you orient the MFP-25 probe so that the field vectors
point into the bulls eye, you will get a positive field reading, as shown in figure 20, where you
can also see the deflection direction of a positive ion beam for the illustrated field direction, and
the current direction in the coils of an electromagnet producing the field.
i
N
S
N
+ve field reading
MFP-25
i
S
+ve ions
Figure 20. Direction convention for magnetic field lines
H10 User Manual
H10_UM_121105
Page 36 of 59
PSI System Controls and Diagnostics
The sign of the field reading assumes you have a positive calibration gain value. Should you
wish to reverse the directionality, then you must make the gain factor negative.
11.3 Rate of Change of Magnetic Flux Density
Any conductor loop which encloses an area through which the magnetic flux is changing with
time will have a current induced in it. If the loop is not shorted, there will be a voltage induced
across the terminals that is the negative of the rate of change of B integrated over the surface area
of the loop.
V =−
d
dt
∫ B.ds
S
We can assume that the loop area is small enough that B is constant over its area, so we have
V =−
dB
A
dt
where is the area of the loop. Thus we get a direct reading of the rate of change of the field. In
the MFP-2.5 the effective area of the loop is increased by having five superimposed loops in
series, for a total area of 150 mm2.
H10 User Manual
H10_UM_121105
Page 37 of 59
PSI System Controls and Diagnostics
12 Circuit overview
12.1 MFP-25 Probe
MUX
Temp
sensor
MUX ctrl
Temp / Voltage
Current
source
Hall
device
Diff
PGA
Buff
Hall probe signal
Hall probe gain select
AGnd
+/-15 V
Probe base
Probe tip
Figure 21. MFP-25 probe block schematic.
The MFP-25 probe uses the very high performance HE244 Hall device, which provides
extremely low noise and drift. A 1 mA constant current is provided from a current source.
Current stability is ensured by a precision voltage reference and high precision resistor. The Hall
effect voltage is amplified x10 by a differential instrumentation amplifier. A following
programmable gain amplifier is ground referenced and can selected for x2 gain for the 25 kGauss
range, or x8 gain for the 6 kGauss range. The 6 kGauss range is not used by the PSI Diagnostic
software. A unity gain buffer delivers the signal to the output connector.
A temperature sensor is located at the probe tip close to the Hall device. A MUX switch selects
either the temperature signal or the compliance voltage that the current source is generating. It is
possible to use this voltage as a measure of temperature also.
Connections to the devices at the probe tip are made using screened twisted pair traces.
H10 User Manual
H10_UM_121105
Page 38 of 59
PSI System Controls and Diagnostics
12.2 MFP-2.5 probe
Loop
PGA
Diff
Loop signal
Loop gain select
Integrated
Hall
Sensor
Diff
Hall probe signal
PGA
Hall probe gain select
AGnd
+5V
Probe tip
V reg
+/-15 V
Probe base
Figure 22. MFP-2.5 block schematic.
The MFP-2.5 uses an integrated Hall sensor which has the current source and temperature
compensation included. The field signal is amplified x5 by a differential amplifier, then by either
x1 or x10 by a programmable gain amplifier.
The loop signal is amplified x64 by a differential amplifier, than by another x1 or x10 by a
programmable gain amplifier.
A regulator creates a local +5V rail from the incoming +15V.
12.3 H10 Control Unit
+/-15 V
DC-DC
+24V DC in
DC-DC
+5 V
MUX ctrl (MFP-20) /
Loop gain select (MFP-2.5)
Hall probe gain select
PCB
temp
sensor
Line
driver
Status
LEDs
Microcontroller
TX
Temp / Voltage (MFP-20) /
Loop signal (MFP-2.5)
Fiber-optic
FPGA
ADC
RX
Hall probe signal
Jpr
Addr
Diff amps
AGnd
Figure 23. H10 control unit block schematic.
H10 User Manual
H10_UM_121105
Page 39 of 59
PSI System Controls and Diagnostics
The H10 control unit is derived from the widely-used M10 general purpose I/O device. A field
programmable gate array (FPGA) handles all input output, and communicates with the PIC
microcontroller via an internal bus. The microcontroller stores calibration values in its internal
EEPROM.
The analog inputs are connected to differential amplifiers. The negative inputs are referenced to
analog ground in the probes. A 100 kSa/sec ADC multiplexes the two inputs, so that each is
sampled at 50 kSa/sec. Any ADC over-ranges are flagged and communicated to the host
computer along with the digital input bit pattern.
An on-board thermistor is used to measure the H10 board temperature. It is read by a 10-bit
ADC integrated in the PIC microcontroller. A two position jumper informs the microcontroller
what probe is connected, and a 16-position switch sets the fiber optic loop address. An internal
10-position switch is no longer used.
Incoming 24V power is fused, polarity protected and filtered. It is used to supply isolation DCDC converters which create the internal voltage rails, and provide +/-15 VDC for the probe.
H10 User Manual
H10_UM_121105
Page 40 of 59
PSI System Controls and Diagnostics
13 Calibration
13.1 Calibration Parameters
The H10 uses a number of calibration parameters to convert the raw values delivered by the ADC
(analog to digital converter) into accurate, physically meaningful readings.
Reading = Gain*Vmeas – Offset
where Vmeas is the measured signal at the ADC, and we have normalized out the nominal
conversion gain of the ADC (=216/20 bits per volt).
These parameters incorporate the conversion gains of sensors such as Hall devices, pickup loops
and temperature sensors, and the amplifier gains and offsets of the circuits in the probes and the
H10 control unit. In manufacture the probe and H10 control unit are calibrated against a
reference field probe over a wide range of fields to determine the exact calibration parameters.
The probe and H10 thus form a matched pair.
13.2 Temperature Coefficients
Hall probes work due to migration of electrons in a bulk semiconductor, and thus the signal for a
given field depends on the mobility of these electrons which in turn upon temperature. The
MFP-2.5 probe integrates temperature measurement and compensation, and the output signal is
temperature corrected. The MFP-25 probe includes a separate temperature sensor, and the
compensation is carried out in real time using coefficients stored by the H10 control unit by the
A500 loop controller that receives its data.
There are two components to the temperature compensation, a zero field offset coefficient and a
gain correction. The gain correction allows a first and second order term. A reference
temperature is recorded as part of the factory calibration. The factory calibration is linked to the
serial number of the probe. You should be sure that the probe you have connected matches the
serial number shown on the Setup tab. The green LED on the Setup table illuminates when
neither the probe serial number nor calibration coefficients have not been altered since factory
calibration.
Measurements then use the difference ∆T between the measured temperature and the reference to
correct the measured field
Bcorr = Bmeas*(1 – (again1*∆T + again2*∆T2)) - aoff*∆T
where Bmeas is the field reading before compensation, again1 and again2 are the first and second
order gain coefficients and aoff is the offset coefficient. Figure 24 illustrates how the correction
functions for the measurement of a fixed field over a typical operating temperature range.
H10 User Manual
H10_UM_121105
Page 41 of 59
PSI System Controls and Diagnostics
3.095
Field (kG)
3.090
3.085
3.080
3.075
20
25
30
35
40
45
50
55
60
Temp (C)
Uncompensated
Compensated
Figure 24. Example of MFP-20 temperature compensation.
H10 User Manual
H10_UM_121105
Page 42 of 59
PSI System Controls and Diagnostics
14 Connectors
14.1 H10 control unit front panel connectors
14.1.1 Probe connection
Ten pin Lemo EXG.1B.310 female. The connector on the MFP probes is identical.
1
8
9
2
3
7
6
10
4
5
External view on connector / solder side of mating plug. Pins numbered anticlockwise from top
left, with 9 and ten in the centre.
MFP-25 probe
1
2
3
4
5
Cable shield
Analog ground
Hall sensor signal
Hall gain select
MUX control
6
7
8
9
10
Temperature / voltage signal
Analog ground
Analog ground
+15 VDC
-15 VDC
6
7
8
9
10
Pickup loop signal
Analog ground
Analog ground
+15 VDC
-15 VDC
MFP-2.5 probe
1
2
3
4
5
Cable shield
Analog ground
Hall sensor signal
Hall gain select
Pickup loop gain select
14.2 Rear panel connectors
14.2.1 Power input
2.1 mm threaded jack. To mate with Switchcraft S761K or equivalent
Center pin: +24VDC
Outer: 0V
H10 User Manual
H10_UM_121105
Page 43 of 59
PSI System Controls and Diagnostics
14.2.2 Fiber-optic communications
ST bayonet. To mate with ST male terminated fiber optic cable. Recommended cable types 1
mm plastic (such as Avago HFBR-EUS-500) or 200 um silica (such as OCS BC03597-10 BL).
Signal: 650 nm light (red).
Transmit
Receive
(light grey) (dark grey)
H10 User Manual
H10_UM_121105
Page 44 of 59
PSI System Controls and Diagnostics
15 Controls and Indicators
15.1 Front panel controls
None.
15.2 Rear panel controls
15.2.1 Address switch
16 position rotary switch setting device address. Choice of address is arbitrary, but each device
in a fiber-optic loop system must have a unique address.
Setting
0
1-F (decimal 1 to 15)
Function
(Reserved to loop controller)
Available address settings.
15.3 Front panel indicators
None.
15.4 Rear panel indicators
Quad green LED.
Device
Network
Activity
Power
15.4.1 Power
Green LED. On = input power is present; internal DC-DC converters are running.
15.4.2 Activity
Green LED. Flashes for 100 msec when H10 has received digital output setting such as gain
change.
15.4.3 Network
Green LED. Flashes when H10 is processing messages on the fiber-optic channel.
H10 User Manual
H10_UM_121105
Page 45 of 59
PSI System Controls and Diagnostics
15.4.4 Device
Green LED. Flashes on for 100 msec with period (250 msec + averaging time) when H10 is
initiated and acquiring data.
15.5 Internal settings
We do not recommend that you open the H10 case unless specifically instructed to do so by your
supplier or Pyramid Technical Consultants, Inc. Otherwise, there are no user-serviceable parts
inside.
Figure 25. Location of internal switches and jumpers.
15.5.1 SW2 settings
Communications mode switch. Not used on the H10, reserved for future use.
15.5.2 JPR1 settings
Probe identification.
Links
None
1
2
1&2
H10 User Manual
Function
MFP-2.5 probe.
(Reserved)
(Reserved)
MFP-25 probe
H10_UM_121105
Page 46 of 59
PSI System Controls and Diagnostics
16 Software updates
The H10 has three embedded firmware releases.
Firmware
Function
FPGA (.pof file)
General logic, loop message passthrough, ADC reading and
averaging
PIC Boot (.hex file)
Boot up, code upload
PIC Application (.hex file)
Main application; calibration, range control, host communications,
SCPI instrument model.
The boot code is unlikely to require updating. It requires use of a programming adaptor. A
factory recall will be issued if an update is ever necessary. The two other codes can be updated
by upload from the host computer via the normal communications link.
16.1 FPGA firmware updates
To update the FPGA, click the “Select .fhex file” button under Upload FPGA on the Device tab,
and navigate to the relevant file. The code will then load. The process takes about 20 seconds.
Figure 26. Selecting the fhex file to load.
H10 User Manual
H10_UM_121105
Page 47 of 59
PSI System Controls and Diagnostics
When the upload is complete, you will get a prompt to power cycle the H10 in order to load the
new code.
Figure 27. Restart prompt after FPGA update.
If the FPGA upload fails for any reason such as loss of power during the upload, or data
corruption, then the H10 may not be able to communicate. In the unlikely circumstance that this
happens, it can be recovered using an FPGA programming tool and the .pof version of the FPGA
code. Contact your supplier or Pyramid Technical Consultants who will arrange for the unit to
be repaired.
16.2 PIC microcontroller firmware updates
The PIC microcontroller application code may be updated periodically to add new operating
features. New code releases will be provided by your supplier, or can be downloaded from the
Pyramid Technical Consultants, Inc. website. The hex file can be loaded using the PSI
Diagnostic host without any need to access the unit. The upload can be performed directly from
the PC host. On the Device tab, click the “Select .hex file” button and navigate to the relevant
file. The code will then load. The process takes about 20 seconds, and the H10 will start running
the new code immediately.
H10 User Manual
H10_UM_121105
Page 48 of 59
PSI System Controls and Diagnostics
Figure 28. Selecting the hex file to load.
Figure 29. Firmware upload in progress
H10 User Manual
H10_UM_121105
Page 49 of 59
PSI System Controls and Diagnostics
17 Versions and Compatibility
There are some compatibility constraints for the various versions of the H10. We recommend
the configurations shown below. However if you have H10s embedded in a complex system
running application-specific host software, you should not change your firmware or software
versions without consulting your supplier or Pyramid Technical Consultants, Inc.
H10 with MFP-2.5 probe
H10 PIC
H10 FPGA
A500 DSP
A500 FPGA
A500 Ethernet
or A560
PSI Diagnostic
or PTC G2 Diagnostic
4.0F or later
13.0.03 or later
5.43 or later
2.7.42 or later
8.5
(future option)
4.114 or later
(future option)
H10 with MFP-25 probe
H10 PIC
H10 FPGA
A500 DSP
A500 FPGA
A500 Ethernet
or A560
PSI Diagnostic
or PTC G2 Diagnostic
H10 User Manual
4.1B or later
13.0.04 or later
5.43 or later
2.7.42 or later
8.5
(future option)
4.123 or later
(future option)
H10_UM_121105
Page 50 of 59
PSI System Controls and Diagnostics
18 Fault-finding
Symptom
Possible Cause
Confirmation
Solution
Incorrect field readings
Probe orientation not as
expected
Check orientation of the probe
relative to the expected field
direction.
Orient and secure the probe.
Probe out of position
Check probe position
Locate and secure the probe.
Calibration incorrect or
corrupted
Check calibration values for
erratic values.
Contact supplier or Pyramid
Technical Consultants, Inc.
Temperature compensation
not in use.
Check compensation
parameters.
Use factory compensation
values.
Mechanical stress on probe.
Check mounting arrangement.
Mount the probe securely by
without applying bending
force.
Probe and H10 control unit are Check serial numbers against
not a matched pair.
shipping documentation.
Unstable field reading
High noise levels
H10 User Manual
Use matched pairs. Return to
Pyramid Technical
Consultants, Inc. for
recalibration if necessary.
Field is actually changing
Check field by independent
means.
Probe position is unstable in a
spatially varying field.
Check field by independent
means, or by placing the MFP
in a known stable field.
Provide a mechanically stable
probe mounting.
Integration time too short for
signal being measured
Noise level reduces with
integration period
Use an appropriate integration
time for the signal level.
H10 case not grounded.
Check continuity to local
Make dedicated ground
H10_UM_121105
Page 51 of 59
PSI System Controls and Diagnostics
ground.
Analog signals respond very
slowly
Unable to communicate with
H10
connection if mounting does
not provide this.
Field has unsuspected AC
components.
Check field by independent
means, or by placing the MFP
in a known stable field.
Line voltage pickup
Noise level drops sharply if
Keep H10 and signal cable
integration period is 16.7 msec clear of unscreened high
(60 Hz) or 20 msec (50 Hz)
current mains voltage. Use
integration periods (N/line
frequency).
Averaging period has been set
very high.
Reduce period
Filtering is enabled in the
Diagnostic host program.
Check averaging setting on the Use the correct filtering
Data tab.
setting.
Duplicate address setting
Check address against
expected address in host
software.
Communication link timeout
H10 User Manual
Set averaging appropriate to
the required time resolution
and noise levels
Use correct switch setting.
Switches can be changed
while the unit is operating.
Investigate and fix
communications issue. Use a
longer timeout setting if
necessary.
RX and TX cables cross
connected somewhere in loop.
Network LED not lit.
Correct cabling.
Fiber optics are damaged
Inspect fibers, especially the
connectors. Check light can
be seen through fiber.
Fit new fibers or re-terminate
as necessary.
H10_UM_121105
Page 52 of 59
PSI System Controls and Diagnostics
Exchange fibers and retry
Unable to connect to H10C
Using PTC G2 Diagnostic
which does not support the
H10.
Communications interruptions
Other processes on PC host
interfering with comms ports.
Use a dedicated PC with
simple configuration and
minimum number of processes
running.
PSI Diagnostic will not
connect to devices
Two copies of program
running
Run a single instance only
Random changes to
parameters
Another host program is
interacting with the same H10.
H10 User Manual
H10_UM_121105
Check Diagnostic type and
version.
Check software running on
hosts that could access the
H10.
Page 53 of 59
Use the PSI Diagnostic to
connect to the H10 until H10
support is added to the PTC
G2 Diagnostic.
Run a single host program
only.
PSI System Controls and Diagnostics
19 Maintenance
The H10 does not require routine maintenance or calibration. There are no user-serviceable parts
inside the case of the control unit.
The H10 is fitted with a 1.1 A automatically resetting positive temperature coefficient (PTC) fuse
in the 24 VDC input. No user intervention is required if the fuse operates due to overcurrent.
The fuse will reset when the overcurrent condition ends.
H10 User Manual
H10_UM_121105
Page 54 of 59
PSI System Controls and Diagnostics
20 Returns procedure
Damaged or faulty units cannot be returned unless a Returns Material Authorization (RMA)
number has been issued by Pyramid Technical Consultants, Inc. If you need to return a unit,
contact Pyramid Technical Consultants at [email protected], stating
- model
- serial number
- nature of fault
An RMA will be issued, including details of which service center to return the unit to.
H10 User Manual
H10_UM_121105
Page 55 of 59
PSI System Controls and Diagnostics
21 Support
Manual and software driver updates are available for download from the Pyramid Technical
Consultants website at www.ptcusa.com. Technical support is available by email from
[email protected]. Please provide the model number and serial number of your unit, plus
relevant details of your application.
H10 User Manual
H10_UM_121105
Page 56 of 59
PSI System Controls and Diagnostics
22 Disposal
We hope that the H10 gives you long and reliable service. The H10 is manufactured to be
compliance with the European Union RoHS Directive 2002/95/EC, and as such should not
present any health hazard. Nevertheless, when your device has reached the end of its working
life, you must dispose of it in accordance with local regulations in force. If you are disposing of
the product in the European Union, this includes compliance with the Waste Electrical and
Electronic Equipment Directive (WEEE) 2002/96/EC. Please contact Pyramid Technical
Consultants, Inc. for instructions when you wish to dispose of the device.
H10 User Manual
H10_UM_121105
Page 57 of 59
PSI System Controls and Diagnostics
23 Declaration of Conformity
H10 User Manual
H10_UM_121105
Page 58 of 59
PSI System Controls and Diagnostics
24 Revision History
The release date of a Pyramid Technical Consultants, Inc. user manual can be determined from
the document file name, where it is encoded yymmdd. For example, M10_UM_080105 would
be a M10 manual released on 5 January 2008.
Version
Changes
H10_UM_121105
First general release
H10 User Manual
H10_UM_121105
Page 59 of 59