1
Paper ###-2011
Absolutely Fabulous:
Tips on Creating a Publication-Ready Report using
ODS Absolute Layout Functionality
Gina Huff, Western Kentucky University, Bowling Green, KY
Tuesdi Helbig, Ph.D., Western Kentucky University, Bowling Green, KY
Chris James, Western Kentucky University, Bowling Green, KY
ABSTRACT
Are you using SAS but formatting in Excel or Word? Are you creating SAS output printouts just to turn right around
and re-enter the data into publishing software (i.e. Microsoft Publisher, Adobe InDesign) to create a report that is
―publication ready‖? If you’re like me, you dreamed of the day that you could create SAS Output that was Absolutely
Fabulous; output that could take you straight from SAS program to finished report. Dream no more, ODS LAYOUT
is here! Although still pre-production in version 9.2, I have found ODS LAYOUT to be a powerful, user-friendly way
of putting multiple data elements on the page. Couple that with the styling capabilities of SAS procedures and other
ODS statements and you are well on your way to creating your own Absolutely Fabulous Report.
This paper will take you on a tour of the tools I used, along with some helpful tips, words of caution, and valuable
resources. Hopefully, by the end of the paper, you will be inspired to create your own custom report in ODS
LAYOUT.
INTRODUCTION
The Office of Institutional Research (IR) at Western Kentucky University is responsible for the production and
distribution of reports that provide information on university statistics, including the university’s annual Fact Book.
Because the Fact Book needed a polished, professional appearance, information had previously been transposed
from SAS output into a Microsoft Publisher file. The
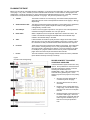
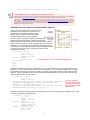
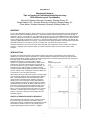
Figure 1.
Publisher file allowed me to easily position multiple
Creating a Page Template
elements on a page and offered flexibility in design choice.
Unfortunately, however, this transposition process was a
time-consuming and error-prone method. Additionally, if a
style element on a page changed, each page had to be
manually updated, making stylistic upgrades a cumbersome
process. Suffice to say, updating the annual Fact Book was
a chore that no one in the office welcomed.
With the introduction of SAS ODS LAYOUT, I decided to take
on the seemingly daunting task of creating the Fact Book in
SAS. What seemed like an insurmountable task at first
quickly became a challenging but rewarding experience,
allowing me to use the new and evolving Output Delivery
System (ODS) and incorporate it with the already powerful
and flexible SAS procedures. By taking a little extra time on
the forefront (creating the SAS program took a little longer
than our normal transposition into Publisher would have
taken), I am now looking forward to the creation of the 2011
Fact Book. Instead of days of transposition, I can simply
push the running man and watch my absolutely fabulous
publication appear…
CREATE A TEMPLATE AND STYLE PROFILE
When deadlines loom and time is scarce, planning is often
the part of the process that gets overlooked. Instead of
developing a strategy of what the page will look like and what
information we need to include, it is very tempting to just
begin programming and hope for the best. I suggest,
1
however, that when deadlines loom, a good page plan will actually save time in the long run, giving you the structure
you need to quickly place elements on the page without falling into the time-wasting chore of trial and error. Note
that even with a good page design, you will have to invest some time testing and retesting placement; however, a
good outline is worth its weight in gold when it comes to saving time and giving you a head start to success.
I am electing to use a two column format, deciding to make the left column a little wider than the right. I allow for
additional space at the right margin (we are binding the book using a 9‖ spiral). The final design template is pictured
in Figure 1, complete with measurements for columns, margin, and alleys (white space between columns).
Another important part of the planning stages is to determine fonts and other style elements. I employ the ―Keep it
Simple‖ approach to design, knowing that a clean and direct design is always a safe bet. Look at the Tips and Tidbits
below for a quick overview of some of the considerations I made when planning the style of the page.
TIPS AND TIDBITS: A Few Helpful Tips on Thoughtful Page Design
Employ the KISS Method: The acronym KISS, short for ―Keep It Simple Sweetie‖, is very important in design.
Michael Kohrs, a famous American fashion designer, suggests that you ―edit‖ your outfit—after you dress remove
one accessory to keep yourself looking sheik and understated. I propose that the same is true in print design.
Think of all the clever ―accessories‖ like clip art, fancy borders, elaborate fonts, and the like. Decide which
elements truly add to the conveyance of your message; keep the ones that add and ditch the rest.
Stick to a Grid: Just because ODS LAYOUT has complete flexibility, allowing you to stick anything anywhere on
the page, doesn’t mean you that should. Using a columnar layout like the one shown on the previous page makes
for an attractive and organized page. Readers shouldn’t have to search to find order and meaning to your layout.
Don’t Rule Out Familiar Fonts: What’s wrong with Arial and Times New Roman? Fact is, THIS paper uses Arial
throughout. Oftentimes, a familiar font provides a sense of familiarity and consistency to the reader. Since, as
SAS® programmers, we are typically outputting information deemed serious and important to our constituents, a
kitschy font may actually take away from our message. As a general rule, save Comic Sans and
for
another day.
Top to Bottom and Left to Right: In Western Culture, we read from top to bottom and left to right. Keep this in
mind when designing your page. You don’t want the eye to be directed immediately to the bottom or far right
because the reader will naturally drift right off the page. Think about how someone will read the report and design
to follow that flow.
Make Your Headlines POP:
White Space is Your Friend: You don’t want to clutter the page. It becomes very tempting to try and fit
everything on one page especially with a powerful tool like ODS LAYOUT. However, too much black on page
makes it look daunting and discourages readers from taking a closer look. As a general rule try to convey no more
than three major themes in your report. On the Fact Book page, I had a Student Profile ―block‖, a Majors/Degree
graph, and Majors/Degree Table.
People Still Photocopy: A good design prints just as well in black and white as it does in color. Color can really
enhance your publication, but don’t add color just to add color. Make sure it, too, supports the message.
Otherwise, you will end up with color that detracts rather than directs.
When Creating Tables and Graphs, Less is More: I have found no design authority that likes 3-D graphs and
charts. Keep the design simple and let the numbers tell the story. Stephen Few, an expert in presentation design
and a speaker here at the 2011 SAS Global Forum states in his white paper Designing Effective Tables and
Graphs, ―Whenever quantitative information is presented, the data itself should stand out clearly, without
distraction.‖—oh and just a quick note…I’m pretty sure he hates 3-D graphs too!
A good rule of thumb is to make your headlines/titles
50% to 3 times bigger than the regular body copy to ensure that the eye is directed there first.
One additional suggestion: Visit http://www.perceptualedge.com/examples.php for a really nice demonstration of
how Mr. Few takes charts with significant design flaws and transforms them into graphs that communicate their
intended message much more clearly. I know I took some notes on how to improve many of my charts and graphs
for future publications!
Follow your organization’s style specifications: Your organization will likely have suggested colors, typefaces,
and logo specifications. Ours is called the ―Logo User Manual‖. Since the experts in your organization have
already taken pains to find and suggest styles that match the institution’s look and feel, it only makes since to make
this your style starting point. You can always customize your color palette and/or add an accent font to enhance
your report, but remember ONLY add when it adds value to the report!
2
PLANNING THE PAGE
Before you can build an ―absolutely fabulous‖ publication, you must know what information you want to communicate
on the page. In my case, I needed to provide constituents with information on their students—demographics and
classification—as well as information on majors and degrees/credentials awarded over time. Ultimately, I decided I
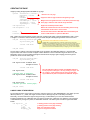
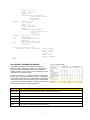
would need to incorporate the following elements on my page. They are also pictured in Figure 2.
1.
Header:
The header consists of our university logo, the section header (Departmental
Information) and the name of the department reflected on the page (i.e. Biology
Department).
2.
Student Profile Table:
This table provides demographic information on each student in the department,
including data on race, gender, full/part-time status, level (graduate or
undergraduate), and test scores.
3.
Trend Graph:
I chose to use a line graph to provide an ―at a glance‖ view of the department’s
enrollment and degrees awarded over a five year period.
4.
Detail Table:
Within a department, there are specific majors that a student can select. The
number of enrollments and degrees awarded within each individual major
needed to be reflected clearly in the table.
5.
Tabs:
I wanted readers to be able to quickly find each college section with minimal
effort and the cost of ―real‖ tabs was prohibitive to the project. Instead, I opted
for a full-bleed box that provided the desired effect without the extra expense.
6.
Footnote:
There was a need to put footnotes at the bottom of each page. Some footnotes
were constant, meaning that they were on every departmental page. Others
were page-specific, depending upon whether or not it was needed on the page.
For example, the ―program closed‖ footnote was only used on departmental
pages where there were majors that had been discontinued.
7.
Footer:
The footer needed to contain the page number and the name of the publication
(2010 Western Kentucky University Fact Book).
Figure 2.
Illustration of the Final Page Design
DECIDE HOW BEST TO ACHIEVE
YOUR GOAL USING ODS
I selected Absolute Layout but there are many
options. Some publications I have found work
well just by defining the number of columns
and using the functionality of the
STARTPAGE= option. Other publications may
work best with a gridded layout. I chose
Absolute Layout for this project for four primary
reasons:
3
1.
We had a one-page design with a
consistent layout on the page.
2.
We had a fixed number of rows for
each table.
3.
Because I knew I wanted tabs at the
margin edge, I found Absolute Layout
gave me more control to accomplish
this task.
4.
Because Absolute Layout has been in
the works a little longer, I found it to
be a little easier to work with and had
fewer bugs than Gridded Layout, at
least in its current pre-production
form.
CREATING THE PAGE
I begin by setting the appropriate OPTIONS for my page:
options
orientation = portrait
papersize = letter
nodate
nonumber
topmargin = .001in
bottommargin = .001in
leftmargin = .001in
rightmargin = .001in;
ods noproctitle;
ods escapechar = "^";
title;
footnote;
Defines an 8½ x 11 page.
Suppresses date and page numbers from appearing on pdf.
Margins have to be greater than zero. To be able to print to the edge
of the page, I define the most nominal margin allowable.
Suppresses unwanted procedure titles.
Defines the character that will call inline formatting. Select a rarely
used character like the caret (^) chosen at left.
Clear all titles and footnotes. ODS TEXT offers more flexibility and
control in ODS LAYOUT so I opted for ODS TEXT.
Next, I define the pdf output delivery system and style. Creating a pdf output is quite straightforward in SAS. It uses
a ―wrapper‖ or ―sandwich‖ method, meaning that you initiate the pdf at the beginning and then close it at the end.
ods pdf
file="q:\factbook.pdf"
style=calibri_pdf;
QUICK NOTE: PROC TEMPLATE and ODS LAYOUT
…insert code here…
CALIBRI_PDF is not a SAS supplied style, but one that I created using the parent style
PRINTER. I chose PRINTER because it was a very simple and clean style, making it quite easy
to modify. Because the use of the TEMPLATE procedure is outside the scope of this article, I
won’t go into the details of designing the template; however, I have included some remarkable
papers in the reference section that should assist you in designing your own custom templates.
ods pdf close;
The next step in creating a document using ODS Layout is similar to the ODS PDF statement. I start the ODS
Layout function and end it in a similar ―wrapper‖ method. Because I need to eliminate margins to allow for my fullbleed tabs, I have to set up the width and height for the full size of the page, again ―fudging‖ just a bit to get it to
provide me control over the entire page…
ods pdf
file="q:\factbook.pdf"
style=calibri_pdf;
ods layout start width=8.49in
height=10.99in;
…insert code here…
ods layout end;
/*Second page if desired*/
ods layout start width=8.49in
height=10.99in;
Place the ODS Layout Start code after the ODS PDF statement.
For the purposes of this paper, I am only creating one page. You
can, however, create multiple pages by calling multiple ODS
Layout Statements (start to end) within the ODS PDF “wrapper”.
…insert code here…
ods layout end;
/*End of optional second page*/
ods pdf close;
A QUICK LOOK AT ODS REGION
For each element that I want to place on the page, I define a region for it using ODS REGION. I can define up to four
different positions—x, y, width, and height—for each element, although they are not all always necessary.
Personally, I choose to define the regions using inches (in), but SAS allows you to use other measurements
including centimeters (cm), millimeters (mm), and percent of page (pct). Make sure you define the unit of measure
or SAS will define your region in pixels, an undesirable measure. The basic syntax to create a region within ODS
follows.
ods region x=___in
y=___in
width=___in
height=___in;
x = starting position on the page horizontally
y = starting position on the page vertically
width = the width of the element
height = the height of the element
4
Some may view the extreme flexibility of ODS LAYOUT, flexible enough even to overlap objects, a drawback. I,
however, view that as one of its greatest strengths. It affords me the ability to build nice looking sections on a page,
complete with borders and/or shading as well as combinations of multiple tables graphs and/or text elements.
Without the flexibility ODS LAYOUT affords, none of this would be possible. An awareness of its capability will allow
you to use it to its full extent and avoid simple overlap mistakes.
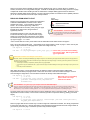
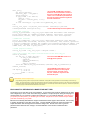
FABULOUS FROM HEAD TO FOOT
Figure 3.
Header Design
Now that I have the page setup complete and understand
a little about ODS REGION, it makes sense to tackle
Headers and Footers. In-line formatting makes this a
breeze. As I mentioned previously, a little bit of
experimentation will be necessary, but by using the page
template set up before-hand, the guesswork is
significantly reduced.
TIPS AND TIDBITS: The Value of ODS TEXT
I find that ODS TEXT is the better option when creating headers and
footers in ODS LAYOUT. Save TITLE and FOOTNOTE statements
for regular ODS output.
The Header (pictured in Figure 3 at right) will need to
include the university’s logo, a section header, a page
header, and a separator line at the bottom of the Header.
The Header will go across both columns and I know that
my logo is roughly 1‖ x 1‖ in size.
Just a reminder that this code is placed within both the ODS PDF and the ODS LAYOUT “wrappers”.
First, I will set the image (WKU logo). I have defined on the page template—shown on page 1—that I need my left
margin to begin a half inch into the page with a quarter inch margin at the top.
ods region x = 0.50 in
y = 0.25 in;
ods text = "^{style[preimage='q:\wku_logo.jpg']}"; Use the caret (^) to initiate inline formatting
and insert jpeg image. SAS recognizes both
.jpg and .gif formats.
QUICK NOTE: Be Aware of Your Margins or Lack Thereof
Remember, because I am defining the ENTIRE page (by setting the margins to .001in and defining the height and width in ODS Layout for the full page) there are
NO margins pre-set. If I define a region with a zero width and height, I will literally be at the edge of the page. Personally, I prefer having this kind of control of the
page for a few important reasons:
•
it is easier (for me at least) to conceptualize, particularly when using a page template,
•
I have control to nudge an individual table, text, or graph over into the margins a bit without affecting the entire page if either design or spacing concerns call
for it,
•
I have ability to create a full-bleed tab.
After setting the image, I use its approximate size to define the location of both the section header (titled
Departmental Information) and page header. Notice that I don’t have a need for the width and height—nor did I
when inserting the image above—because these elements are already a fixed width and height.
ods region x = 1.75 in
y = 0.40 in;
ods text = "^{style[font_face='calibri' fontsize=20pt
just=left fontweight=bold] Departmental
Information}";
Notice that I use in-line formatting
again to define several style
elements of the Header.
TIPS AND TIDBITS: Using Your Page Layout Template to Determine ODS REGION Specs
Using your page layout template and a little math will save lots of time when positioning items on the page. How did I decide to start the section and page
headers 1¾ inches in from the edge of the page? Knowing that 1½ inches were already taken up by margins (½ inch) and the jpeg image (1 inch), I added a
little white space (¼ inch) in between for a starting position of 1.75 in. Having a template took some of the guesswork out of positioning the region!
The page header uses a macro that will insert the correct department name on the page header. Because I want it
aligned with the section header, I use the same horizontal (x) location but push the vertical (y) starting point down
slightly.
ods region x = 1.75 in
y = 0.75 in;
ods text = "^{style[font_face='Calibri' fontsize=18pt just=left fontstyle=italic]
&my_dept_desc Department}";
Some may argue that this is an archaic way to create a single rule underneath the header, but I simply respond that
it was a quick and easy way. I used the line stroke on the keyboard and experimented until I had enough strokes to
go all the way across the page. Sometimes quick and easy overrides elegant…
ods region x = 0.50 in
5
y = 0.95 in;
ods text="_______________________________________________________________________";
Since I am in the groove of creating text, I can quickly
create the footer line, again using the power of ODS TEXT
and in-line formatting.
Figure 4.
Footer Design
In the code below, note that the vertical (y) position is the
same for each. The first text field is left justified and the second is right justified, giving it the proper appearance on
the page.
ods region x = 0.50 in
y = 10.50 in;
ods text="^{style[font_face='calibri' fontsize=9pt just=left fontstyle=italic]Page
^{thispage}}";
The command ^{this page} will be replaced with the page number.
If you also want the last page (as in Page __ of ___), use
^{this page} of ^{last page}.
ods region x = 0.50 in
y = 10.50 in
width = 7.25 in;
Notice that the width has been defined. Otherwise, it would right justify
to the edge of the page.
ods text="^{style[font_face='calibri' fontsize=9pt just=right
fontstyle=italic]&my_fb_year Western Kentucky University Fact Book}";
I have utilized another macro variable here to indicate year (&my_fb_year).
Because I will be running this program on an annual basis, I structured the
program so that year can be changed once with a LET Statement at the
beginning of the program and it will update throughout.
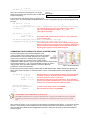
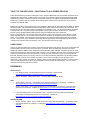
COMBINE MULTIPLE ELEMENTS TO CREATE A UNIFIED THEME
One of the advantages (and sometimes drawback) of this
project was that I had an existing design in place that constituents
had established a comfort level with and had come to depend on.
This became somewhat of a challenge when designing the
student profile section as I needed to match a rather complex
configuration of tables and text. Figure 5 at right shows all of the elements that
went into the final section. In all, I used the GSLIDE procedure to create a
unifying border, three ODS TEXT statements, and three TABULATE
procedures to create this small section.
Figure 5. Student Profile Section
The first section demonstrates creating a border using the GSLIDE procedure. PROC GSLIDE was developed by
SAS to make simple text slides, so I have been able to use it to create simple borders and backgrounds in ODS
LAYOUT.
ods region x = 0.50 in
y = 1.25 in
width = 4.75 in
height = 3.00 in;
goptions reset=all;
proc gslide cframe=black
wframe=2;
run;
quit;
The border begins ½” from the left edge as defined on the page template.
I add about ¼” from the last Header position to place the new element.
The section will be one column in width, or 4¾”.
Guesstimation came into play on this measurement. Once I determined
the size of the first table and added about an inch for white space and text,
I came up with an estimated height and tweaked as needed.
To create a border, assign a frame color (CFRAME).
Define the width of the frame using WFRAME.
TIPS AND TIDBITS: PROC GSLIDE for Borders and Backgrounds
PROC GSLIDE is a straightforward way to create borders and shaded backgrounds. As a general rule, the GSLIDE procedure should be placed before
the related output so that the border or background will be on the bottom layer, with accompanying tables and/or text layering on top of the GSLIDE
output.
After creating the border, I move on to the three text elements in the Student Profile Section. In the interest of space
and time, I am providing code and explanation for the ―Unduplicated Headcount Enrollment‖ text field only. The
other two ODS TEXT statements are straightforward and work in exactly the same way as those demonstrated in
previous sections.
6
Because I am providing a total headcount within the ODS TEXT output for each department, I must create a macro
using the CALL SYMPUT statement that creates a macro variable of the total headcount. First, I use a DATA
_NULL_ statement and do a count of the students in the department’s table. I create a macro variable that I call
MY_HEADCOUNT to put into the ODS TEXT statement.
data _null_;
set my_dept_table end=last;
count + 1;
if last then call symput("my_headcount", put(count, comma11.));
run;
%put &my_headcount;
When testing, I use the %PUT statement so that I can verify the value of
newly created macro; the value will be written to the log.
I specify the region and then define the ODS TEXT style and text passage using the macro variable I just created.
ods region x = 0.60 in
y = 2.35 in
width = 1.00 in;
ods text="^{style[font_face='calibri' fontsize=12pt just=center
fontweight=bold]unduplicated headcount enrollment ^{style[fontsize=10pt]*}:
&my_headcount}";
I use the macro &MY_HEADCOUNT created above.
TIPS AND TIDBITS: The Value of Using Macro Variables
You can easily incorporate macro variables into the ODS TEXT statement for an elegant and automated way of combining department-specific
information with static text. CALL SYMPUT and LET Statements are examples of ways you can create macro variables for use within ODS TEXT.
To create the tables in the Student Profile Section, I use a combination of procedures and style statements to create
the table formatted in the precise order and style desired.
proc format;
Create formats to transform codes into clear descriptions.
value x_race (notsorted)
Use the NOTSORTED option to delineate the order of values.
6 =
"White"
2 =
"Black"
1, 3-5 =
"Other"
7 =
"Not Supplied"
;
value $ x_gender (notsorted)
"M" =
"Male"
"F" =
"Female"
;
run;
ods region x = 1.75 in
y = 1.75 in
width = 1.60 in;
proc tabulate missing;
class race gender
/ preloadfmt order=data
The PRELOADFMT and ORDER= options must both be included
in the class statement (along with the NOTSORTED option in the
FORMAT procedure and a format assignment) for the format’s
sort order to be utilized.
style={fontweight=bold
The TABULATE procedure offers a great deal of flexibility and
fontsize=10.5pt};
control in defining styles.
Tables (gender="Gender:" race="Ethnicity:")*[style={fontweight=medium}],
all="" * ( n*f=comma11.*[style={just=c}]
colpctn="%"*f=5.1*[style={background=khaki just=c}] )
/ style={borderwidth=0}
To remove borders, you can define the STYLE in table options.
printmiss
Use the PRINTMISS option to make all values print, even if there
misstext = "0";
are no students in the category.
If there are no students in the category, this option specifies that
missings will be replaced with a zero.
keyword colpctn / style={background=khaki};
format race x_race.
This is the last step in assigning sort order using PROC FORMAT.
gender $x_gender.;
You must assign the format to the variable.
run;
7
…similar code for two additional tables are not shown…
TIPS AND TIDBITS: Using Color in ODS LAYOUT, the Rainbow at Your Fingertips
SAS ODS offers a full spectrum of color choices, supporting the Hex RGB (Red/Green/Blue) color palette. To get the Hex value for a color, SAS Support
directs users to visit http://the-light.com/colclick.html where you can pick a color and immediately get the corresponding Hex value.
SAS also has a robust listing of color names that you may use. I have found the color table provided by Lauren Haworth in her SUGI 30 paper SAS with
Style: Creating your own ODS Style Templates for RTF Output a valuable resource (http://www2.sas.com/proceedings/sugi30/132-30.pdf) . Print it and
place it where it is easily accessible. That way you will know exactly how the printed color will appear, as it is often quite different than the way the color
appears on screen. I have found the colors named and provided by SAS are adequate to handle the majority of my output needs. I use Firebrick and
Cornsilk in this and many other IR publications.
GRAPHING FOR ODS LAYOUT CAN CREATE GREAT RESULTS
I elect to use a line graph in the second column of my
publication page to provide an at-a-glance view of
enrollments and credentials awarded over time.
Keeping with a consistent style and color palette
provides needed direction in a host of options.
Figure 6.
Line Graph
As usual, I begin by defining the region for my background.
Instead of using a bordered edge, I will this time use a light
shaded background to accentuate the table. Because the new section
begins in the second column, I move horizontally (x) to 5.35 inches with
a width of 2.4 inches (as the page template prescribes) and I keep the
vertical position (y) and height the same as the previous GSLIDE outline
for a strong horizon line—a way of creating visual harmony and
organization on the page.
ods region x = 5.35 in
y =1.25 in
width = 2.40 in
height = 3.00 in;
goptions
reset=all
cback=cornsilk;
proc gslide;
note;
run;
quit;
You will define background color in the GOPTIONS statement.
The ODS TEXT statement follows the same pattern as many of the statements you have seen previously with one
exception. You may note that I reduce the font size of the asterisks (*). This is purely an aesthetic call. I feel that
the asterisks at the larger 12 point font are too bulky on the page and the slight reduction in size makes them less
obtrusive. The ease of adding another in-line format using the ESCAPECHAR (^) and style option make this and
other style adjustments very easy to make.
ods region x = 5.35 in
y = 1.50 in
width = 2.40 in;
ods text="^{style[font_face='calibri' fontsize=12pt just=center
fontweight=bold]enrollments ^{style[fontsize=10pt]*} and
credentials ^{style[fontsize=10pt]**}}";
ods text="^{style[font_face='calibri' fontsize=10pt just=center
fontweight=medium]&my_start_year.-&my_year.}";
It is easy to change the
font size of both the single
and double asterisks to ten
point within the same ODS
TEXT statement.
The GPLOT procedure is used to create the line graph and I utilize many of the style options available to me in order
to achieve a consistant and appealing look.
ods region x = 5.35 in
y = 1.95 in
width = 2.40 in
height = 2.25 in;
goptions
reset=all
ftext='albany amt'
ftitle='albany amt'
cback=cornsilk;
symbol1
interpol = join
font = marker
value = w
8
symbol2
legend1
axis1
axis2
height = 0.50 cell
color = firebrick
width=2
pointlabel=(color=firebrick
font='albany amt/bold'
height=9pt
position=top);
interpol = join
font = marker
value = u
height = 0.50 cell
color = goldenrod
width=2
pointlabel=(color=goldenrod
font='albany amt/bold'
height=9pt
position=top);
label=none
shape=symbol(3, .5);
value=(height=0.75 cell)
label=none
order=(0 to 1200 by 200);
value=(height=0.75 cell)
label=none;
proc gplot data=dept_totals;
plot total * year = enr_or_deg / cframe = white
vaxis = axis1
haxis = axis2
autovref
cvref = gray
legend = legend1;
run;
quit;
PROC REPORT ADORNED AND ADORED
Figure 7. Proc Report Table
The REPORT procedure also has great functionality and
flexibility in ODS. I opted for this output in my final table of the
page, which provides detailed enrollments and credentials
awarded by major over five years. A five year difference is also
calculated on the department totals.
In essence, the data set I am working from has an observation
for each major by term and enrollment or degree. The variables
are described in the table below. The details of the table may be
a bit difficult to explain, but the takeaway is clear—the REPORT
procedure allows maximum flexibility in creating style effects that
will transform your table into a print-ready design.
Var Name
Explanation
totals_table
Y/N field designed to separate the sections—majors and grand totals
code
Distinguishes the type of variable (major count or one of three subtotals)
major_desc
Name of the major (In-line formatting is used within the variable to get desired font size for major code)
enr_or_deg
Indicates whether the count represents the number of enrollments or the number of degrees
year
The year of the count
total
The number of students in the specified category
9
proc format;
value x_style
low -< 0 = firebrick
other = black
;
run;
You can use a FORMAT to create a color scheme. In this
example, I am using the color “firebrick” for all negative
numbers. I will assign this to the PCT_MAJ variable, a
computed variable that will show the percent increase or
percent decline over five years.
options linesize=256;
ods region x = 0.50 in
y = 4.50 in
width = 7.25 in;
proc report nowd
split="~"
style(header)={fontsize=9pt cellpadding=3};
columns totals_table code ods_desc enr_or_deg, (year, total ('5 yr diff' pct_maj));
define totals_table / noprint group order=data;
define code
/ noprint group order=data;
define ods_desc
/ group ' ' style={cellwidth=2.25in};
define enr_or_deg
/ across ' ';
define year
/ across ' ' nozero;
define total
/ analysis sum ' ';
define pct_maj
/ computed ' '
style={cellwidth=.55in foreground=x_style. (Call the format.)
borderrightcolor=black borderrightwidth=0.25pt just=c};
compute after totals_table;
line " ";
endcomp;
compute code;
if code in ("t1", "t2") then call define(_row_,
'style', 'style=[fontweight=bold
background=cornsilk]');
else if code = "t9" then call define(_row_,
'style', 'style=[fontweight=bold
background=khaki]');
endcomp;
compute pct_maj;
if substr(code, 1, 1) = "t" then do;
_c14_ = (_c13_ - _c9_) / _c9_;
_c25_ = (_c19_ - _c15_) / _c15_;
end;
endcomp;
run;
You can define a style within a
compute block. Here I am assigning a
background color of “cornsilk” to the
subtotals and a darker shade, “khaki”,
to the grand total.
The compute block is a powerful
feature of the REPORT procedure.
Here, I have used it to calculate 5 year
difference on all of the total lines
(subtotals and grand totals) by
referencing the column numbers.
TIPS AND TIDBITS: The Compute Block is Great for Styling in PROC REPORT
I found the compute block to be a powerful and flexible way to create styles customized for specific row types. I could easily define a basic background
color and medium font weight for the detail lines and then create bolder styles for subtotals and grand totals. Art Carpenter provides a thorough
overview of the compute block in his 2008 Global Forum Paper PROC REPORT: Compute Block Basics - Part I Tutorial. The paper can be found at
http://www2.sas.com/proceedings/forum2008/031-2008.pdf.
ACCENTUATE THE FOOTNOTES
ODS TEXT was again my method of choice when creating footnotes. However, a bit of complexity was added to the
creation of the footnotes because some departments needed a third footnote and some did not. I again used the
power of MACROS to create a custom fit for each department.
First, I used CALL SYMPUT in the data step to determine if there were any closed programs for the given
department.
10
data _null_;
I use the PGM_CLOSED flag to determine
set majors end=last;
whether or not a third footnote is needed in
where maj_dept = "&my_dept";
the macro variable MY_FN. If the program is
retain need_fn;
closed, I also concatenate triple asterisks to
if pgm_closed = "Y" then do;
the major description that will designate the
need_fn = "Y";
footnote created below.
maj_desc = cats(maj_desc, "***");
end;
if last and need_fn = "y" then call symputx("my_fn", "y");
run;
%let my_foot_style = style[font_face='calibri' fontsize=7pt just=left
fontweight=medium fontstyle=italic];
I create a footnote style to avoid repetitive code.
*enrollment footnote;
%let my_fn_enrollments = &my_foot_style.*Duplicated enrollments count multiple
majors and include all credential-seeking students: certificate, associate,
baccalaureate, masters, rank, specialist & doctoral. Fall stats reported.;
*credentials footnote;
%let my_fn_credentials = &my_foot_style.**Duplicated credentials count multiple
majors and include certificate, associate, baccalaureate, rank, masters, specialist
& doctoral credentials awarded. The academic year reported includes the summer, fall
& spring. For example, the 2008/09 academic year would include degrees awarded in
summer 2008, fall 2008 & spring 2009.;
*closed program footnote;
%let my_fn_closed = &my_foot_style.***Program closed.;
*this code creates the proper footnotes based on the macro &my_fn;
%macro m_footnote;
%if &my_fn = Y %then ods text =
The In-line format NEWLINE inserts a line
"^{&my_fn_enrollments}
break (¶) where specified.
^{newline}
^{&my_fn_credentials}
^{newline}
^{&my_fn_closed}";
%else ods text="^{&my_fn_enrollments}^{newline}^{&my_fn_credentials}";
%mend m_footnote;
I call the MACRO (created above). If the
department contains a closed program,
the third footnote, “Program closed”,
will print. Otherwise, only the first two
footnotes will print.
ods region x = 0.50 in
y = 9.85 in
width = 7.50 in;
%m_footnote;
QUICK NOTE: Caution on Superscripts
I began footnoting intending to use the superscript function of ODS TEXT. Although this is another great feature of In-line Formatting, it did not work in my
situation. The superscript caused an increase in the spacing between rows and the resulting numerals were simply too big. After several unsuccessful attempts
to remedy the situation and consulting the SAS Help Desk, I discovered that you ―cannot currently control the size of a superscript.‖ This has been reported and
I’m keeping my fingers crossed that it will be addressed in a future release.
FAUX CAN STILL BE FABULOUS—MAKE STAND OUT TABS
The printing cost of ―real‖ tabs can be cost prohibitive. To save money but still get an effective way to make
each college easy to find, I create ―faux‖ tabs using a full bleed. The print shop can easily print the page on
oversize paper (9‖ x 12‖) and then cut at the trim marks (8½‖ x 11‖) to create the final look. Note that if you
just print to your office printer, you will NOT get a full bleed. The pdf will re-size to fit within the pre-defined
print area as defined by your printer.
Because I have already eliminated the margins and defined the whole page in ODS LAYOUT, it is now easy
to position the tab right on the edge of the paper. I use the GSLIDE procedure to create the red box and
simple ODS TEXT code to assign the two-character college code. So that I don’t have to guess on
placement of the letters for each college, I use the SYSEVALF macro function to determine letter
placement.
11
/*get y positions for the tabs & letters*/
%let my_y = 7.00;
%let my_y2 = %sysevalf (&my_y + 0.50);
%let my_y3 = %sysevalf (&my_y + 0.75);
/*code for tabs*/
ods region x = 0.00 in
y = &my_y in
width = 0.40 in
height = 1.50 in;
goptions reset=all cback=firebrick;
proc gslide;
note;
run; quit;
ods region x = 0.00 in
y = &my_y2 in
width = 0.30 in;
ods text="^{style[font_face='calibri' fontsize=20pt just=c foreground=white
fontweight=bold]s}";
ods region x = &my_x in
y = &my_y3 in
width = 0.30 in;
ods text="^{style[font_face='calibri' fontsize=20pt just=c foreground=white
fontweight=bold]c}";
TIPS AND TIDBITS: GSLIDE Your Way to Attractive Tabs
Again, GSLIDE comes to the rescue when designing full-bleed tabs. Use a bold color to create your tab and then overlay your desired text. Because I
used a simple two digit college code, I was able to simply place one character on the first field and one character on the second field. I’m sure there are
other options to create the look YOU desire.
COMPLETE THE LOOK WITH VALUABLE LOOPS
The real power of this program is that it allows me to loop through colleges and departments, creating pages for over
50 different units at the push of the running man. This is made possible by wrapping the ODS LAYOUT code in a
macro that loops through each department, creating the page(s) desired during each loop.
proc sql noprint;
select count(*), maj_dept
into
:dcount, :mydepts separated by "#"
from
(select distinct maj_dept from
depts)
quit;
%macro my_loop;
%do k=1 %to &dcount;
%let my_dept= %scan (&mydepts, &k, #);
%let my_headers = dept;
%let my_dept_desc =
%sysfunc(putc(&my_dept, $x_dept.));
data table;
set dept_table;
where maj_dept = &my_dept;
run;
This SQL code pulls each department from a
data set call DEPTS and creates a count and
listing of them. The count and listing is then
used to loop through each dept.
The %DO loop references the department
count (DCOUNT) created in the SQL above.
The %MY_DEPT macro variable will reflect the
department currently being called in the loop.
Make sure you only pull the applicable
department in your data sets and/or
procedures. I am showing one at left for
demonstration, but I had to subset multiple
data sets for this publication.
…insert code here…
Always be sure to %END your %DO Loop and
%MEND your Macro. Aside from forgetting a
semicolon, this is probably my most frequent
goof!
%end;
%mend my_loop;
%my_loop;
TIPS AND TIDBITS: Create a Test Mode
When creating my ODS Layout Publication, I found it helpful to create a macro that would allow me to only run one specific department. That way I
didn’t have to do a full run every time I added an element. This has also come in handy for ―adhoc‖ requests. I often get a specific department that
wants as-of-today data on Fact Book information. By creating a macro that allows me to only run one department, I can quickly get the information the
department head needs.
12
TAKE IT TO THE NEXT LEVEL—FUNCTIONALITY AS A STORED PROCESS
A SAS Stored Process gives Base code writers a way to transform Base SAS code into a flexible, parameter driven
web application via the web. A SAS program can be easily converted into a Stored Process that generates ODS
output with the addition of Stored Process macro variables, including *ProcessBody, &STPBEGIN and &STPEND.
These macro variables serve as a wrapper for the SAS program so that it can be executed in many of programs
included in the SAS EBI suite.
Rather than manually including the Stored Process variables in Base SAS, IR uses SAS Enterprise Guide to develop
Stored Processes. The Stored Process Wizard in Enterprise Guide makes the development process simple. The
first step asks for the name and location (in metadata) of your Stored Process. The second step allows developers
to include SAS code. Any SAS syntax that directs ODS to create a file should be commented out. The Stored
Process macros variables initialize ODS instead of using the traditional ODS syntax (ODS PDF
FILE=‖C:\Temp\test.pdf‖). The next step asks for the execution server, source file path, source filename, output
options and data sources. The source file path and filename represent the storage information on the execution
server, not in metadata. The fourth step is where developers can integrate prompts (parameters) for the Stored
Process. This is where macro variables from the Base SAS program can be linked to prompts that allow users to
customize their selection without knowing any code. The last step is the summary page.
CONCLUSION
There is no doubt that SAS has the power to create effective publication-ready reports using some of the flexible and
powerful features we have grown to love and expect out of SAS. By incorporating style elements from PROC
TEMPLATE, PROC FORMAT, PROC TABULATE, PROC REPORT, PROC GSLIDE, and PROC GPLOT into SAS’s
powerful Output Delivery System (including ODS LAYOUT, In-Line Formatting, and ODS TEXT) and using the power
of macros to automate and customize the output, I was able to create an attractive, ready to print design directly
from SAS, eliminating the time-consuming and error-prone step of transposing information into publishing software.
Although I merely hit the tip of the surface as it relates to much of the functionality of these procedures and
statements, I hope I peaked your interest for exploring some of these powerful features and also provided you with
resources and references to be able to dig even deeper into areas of particular interest/utility. You, too, can be
absolutely fabulous using SAS ODS LAYOUT!
REFERENCES
General Design:
Few, Stephen (2010). Designing Effective Tables and Graphs. Retrieved from
http://www.perceptualedge.com/images/Effective_Chart_Design.pdf.
Krause, Jim (2004). Design Basics Index. Cincinnati, Ohio: How Design Books.
ODS:
Tilanus (2009). ―ODS 101+.‖ Proceedings of the 2009 SAS Global Forum Conference. Available at
http://support.sas.com/resources/papers/proceedings09/135-2009.pdf.
Huntley, Scott (2008). ―How to Add a Little Spice to Your PDF Output.‖ Proceedings of the 2008 SAS
Global Forum Conference. Available at http://support.sas.com/resources/papers/sgf2008/odspdf.pdf.
Lund, Pete (2008). ―PDF Can be Pretty Darn Fancy: Tips and Tricks for the ODS PDF Destination.‖
Proceedings of the 2008 SAS Global Forum Conference. Available at
http://www2.sas.com/proceedings/forum2008/033-2008.pdf.
ODS ESCAPCHAR:
Zender, Cynthia L. (2007). ―Funny ^Stuff~ in My Code: Using ODS ESCAPECHAR.‖ Proceedings of the
2007 SAS Global Forum Conference. Available at http://www2.sas.com/proceedings/forum2007/0992007.pdf.
13
ODS LAYOUT:
Mays, Rich (2007). ―ODS LAYOUT is Like an Onion.‖ Proceedings of SUGI 31. Available at
http://www2.sas.com/proceedings/sugi31/159-31.pdf.
O’Conner, Daniel and Huntley, Scott (2009). ―Breaking New Ground with SAS 9.2 ODS Layout
Enhancements.‖ Proceedings of the 2009 SAS Global Forum Conference. Available at
http://support.sas.com/resources/papers/proceedings09/043-2009.pdf.
O’Conner, Daniel and Huntley, Scott (2008). ―Custom Reporting Using ODS Layout.‖ Power Point Slides.
Available at http://support.sas.com/rnd/base/early-access/index.html.
PROC REPORT:
Carpenter, Arthur (2008). ―Proc Report: Compute Block Basics – Part I.‖ Proceedings of the 2008 SAS
Global Forum. Available at http://www2.sas.com/proceedings/forum2008/031-2008.pdf.
PROC TEMPLATE:
Haworth, Lauren (2006). ―SAS with STYLE: Creating your own ODS Style Template for RTF Output.‖
Proceedings of SUGI 30. Available at http://www2.sas.com/proceedings/sugi30/132-30.pdf.
CONTACT INFORMATION
Your comments and questions are valued and encouraged.
Contact the authors at:
Gina Huff
Office of Institutional Research
1906 College Heights Blvd.
#11011
Bowling Green, KY 42101
(270) 745-3250
[email protected]
Chris James
Office of Institutional Research
1906 College Heights Blvd.
#11011
Bowling Green, KY 42101
(270) 745-3250
[email protected]
Tuesdi Helbig, Ph.D.
Office of Institutional Research
1906 College Heights Blvd.
#11011
Bowling Green, KY 42101
(270) 745-3250
[email protected]
SAS and all other SAS Institute Inc. product or service names are registered trademarks or trademarks of SAS
Institute Inc. in the USA and other countries. indicates USA registration.
Other brand and product names are trademarks of their respective companies.
14