1
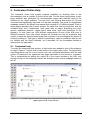
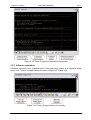
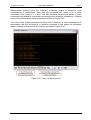
Project no.
004074
Project acronym:
NATURNET-REDIME
Project title:
New Education and Decision Support Model for Active Behaviour in
Sustainable Development Based on Innovative Web Services and
Qualitative Reasoning
Instrument:
SPECIFIC TARGETED RESEARCH PROJECT
Thematic Priority:
SUSTDEV-2004-3.VIII.2.e
D4.4 Intelligent Help System1
Due date of deliverable: 31/06/2007
Actual submission date: 05/09/2007
Start date of project: 1st March 2005
Duration: 30 months
Organisation name of lead contractor for this deliverable:
UvA
Revision: Final
Project co-funded by the European Commission within the Sixth Framework Programme
(2002-2006)
Dissemination Level
X
PU
Public
PP
Restricted to other programme participants (including the Commission Services)
RE
Restricted to a group specified by the consortium (including the Commission Services)
CO
1
Confidential, only for members of the consortium (including the Commission Services)
Authors: Jochem Liem, Floris Linnebank, Anders Bouwer, Bert Bredeweg, Elinor Bakker
Project No. 004074
NATURNET-REDIME
D4.4
Abstract
This document describes the intelligent help systems added to the Garp3 qualitative
modelling and simulation workbench. These systems aim to reduce the support required
by modellers from QR experts when modelling. Firstly, to support the regular interaction
with the program an online help system was created. From each editor in the application
a help page on the Qualitative Reasoning and Modelling (QRM) portal2 can be opened
that explains the functionality of that specific editor. Secondly, to support modellers
during model debugging, a tracer was added that shows the inferences made by Garp3
when simulating qualitative models. The tracer allows modellers to select the type of
inferences they are interested in, and allows them to determine why certain behaviour in
the simulation state graph occurs. Finally, a prototype trouble-shooter was added to the
model-building environment of Garp3, as a ‘proof of concept’. This trouble-shooter
detects possible faults in models, determines the probability that this fault actually
occurs, and gives feedback on how this issue can be resolved. The goal of troubleshooter is to solve the most frequently occurring issues modellers face without having to
use the tracer.
Document history
Version
0.1
0.2
0.3
0.4
0.5
0.6
0.7
0.8
0.9
1.0
1.1
1.2
1.3
1.4
2
Status
Structure + Abstract and Introduction
Wrote initial draft of troubleshooting section
Wrote Contextual Online Help section
Wrote draft of diagnosis (until 4.2 onward)
Feedback on vs3
Processed feedback
Wrote troubleshooting (general+rules+images)
Wrote troubleshooting: textual rule descriptions
Finalized chapters 1, 2, 4 (except two rules), 5
and 6.
Added the last two rules
Added chapter 3
Added final two rules (chapter4) + final editing
Final editing
Final editing
http://www.garp3.org
2
/ 40
Date
19/07/2007
31/07/2007
21/08/2007
21/08/2007
21/08/2007
22/08/2007
27/08/2007
28/08/2007
30/08/2007
Author
Jochem Liem
Jochem Liem
Jochem Liem
Jochem Liem
Bert Bredeweg
Jochem Liem
Jochem Liem
Jochem Liem
Jochem Liem
31/08/2007
31/08/2007
04/09/2007
05/09/2007
05/09/2007
Jochem Liem
Floris Linnebank
Jochem Liem
Floris Linnebank
Bert Bredeweg
Project No. 004074
NATURNET-REDIME
D4.4
Contents
1.
Introduction ................................................................................................................................................4
2.
Contextual Online Help.............................................................................................................................5
2.1. Contextual help ....................................................................................................................................5
2.2. The online help pages .........................................................................................................................6
2.2.1. Task description ...........................................................................................................................6
2.2.2. Task context..................................................................................................................................6
2.2.3. Tasks in this workspace ...............................................................................................................6
2.2.4. Menu options ................................................................................................................................6
2.2.5. Additional features........................................................................................................................6
2.2.6. Definitions of involved ingredients...............................................................................................6
2.2.7. Icons ..............................................................................................................................................7
2.2.8. Related tasks ................................................................................................................................7
2.2.9. Shortcuts .......................................................................................................................................7
2.2.10. Example ......................................................................................................................................7
3.
The Simulation Tracer...............................................................................................................................9
3.1. Buttons and trace levels ......................................................................................................................9
3.2. Example traces...................................................................................................................................11
3.2.1. Erroneous model, no states.......................................................................................................11
3.2.2. Loading the scenario, inequality reasoning ..............................................................................13
3.2.3. Model fragment selection, inequality reasoning .......................................................................14
3.2.4. Reasoning assumptions.............................................................................................................16
3.2.5. Derived relations.........................................................................................................................18
3.2.6. Exogenous behaviours ..............................................................................................................18
3.2.7. Influence resolution ....................................................................................................................19
3.2.8. Terminations ...............................................................................................................................20
3.2.9. Ordering ......................................................................................................................................21
3.2.10. Successor states ......................................................................................................................24
3.3. Conclusions and future research ......................................................................................................25
4.
Troubleshooting ......................................................................................................................................26
4.1. Troubleshooting viewer .....................................................................................................................26
4.2. Diagnostic Rule Format .....................................................................................................................28
4.3. Diagnostic rules..................................................................................................................................29
4.3.1. Ambiguity due to non-corresponding quantities .......................................................................29
4.3.2. Discontinuous change due to conditional influences ...............................................................30
4.3.3. Conflicting causal relations ........................................................................................................31
4.3.4. Invalid decrease (increase) in bottom (top) point value...........................................................32
4.3.5. Invalid decrease (increase) in bottom (top) zero......................................................................32
4.3.6. Same quantity with different quantity spaces ...........................................................................33
4.3.7. Invalid loop of proportionalities ..................................................................................................34
4.3.8. Consequential derivative value assignment causes conflict ...................................................34
4.3.9. Conflicting derivative value assignment and causal relation...................................................35
4.3.10. Multiple consequential value assignments on quantity .........................................................35
4.4. Troubleshooting the Riacho Fundo Model .......................................................................................36
5.
Conclusions..............................................................................................................................................38
6.
References ................................................................................................................................................39
3
/ 40
Project No. 004074
NATURNET-REDIME
D4.4
1. Introduction
Qualitative modelling is a difficult task. As a result modellers require a significant
amount of support during the development of qualitative models. During the NaturNetRedime project partners have been creating Qualitative Reasoning (QR) models about
5 case studies [1,2,3,4,5]. A large effort during the NaturNet-Redime project was
supporting the partners working on these case study models, and modellers outside of
the project.
Modellers have been supported in several ways. Firstly, several QR training
workshops have been organised [6,7,8,9]. Secondly, the partners working on the case
studies had weekly meetings of about 1.5 hours via Skype3 and VNC or FlashMeeting4
[10]. The partners sent their models and their issues beforehand, and the UvA analysed
their progress, addressed their issues, and identified other issues in the models. Thirdly,
modellers sent questions via the QRM-mailinglist [10,11] to be answered by the UvA
team (or other modellers). Finally, the mailing list and the new bug report system are
used to report bugs to be fixed by the Garp3 team.
The intelligent help system described in this document aims to make the Garp3
software more intelligent and easier to use. The system should reduce the dependency
of modellers on QR experts. The intelligent help system consists of three additions to
the Garp3 qualitative modelling and simulation workbench.
The first improvement is an online help system aimed at less experienced
modellers. This system consists of two parts. The first is an online user manual5 that
describes all the workspaces, the tasks that can be performed using specific spaces
and examples of how they are typically used. The second part is contextual awareness
within Garp3. Each workspace has a help button that brings the modeller to the
associated page in the online help system. This allows modellers to get access to the
correct documentation without having to search in a document.
The second addition to Garp3 is meant to support more experienced users during
model debugging. It is a tracer that shows the inferences made by Garp3 when
simulating qualitative models. The tracer allows modellers to select the type of
inferences they are interested in, and allows them to determine why certain behaviour in
the simulation state graph occurs.
The third addition to Garp3 is a proof of concept of a trouble-shooter that is
meant to help modellers to troubleshoot models without needing to use the tracer
(which requires some knowledge about how the reasoning works). This trouble-shooter
is the first step towards an automated debugging facility on Garp3. The trouble-shooter
is integrated with the model-building environment of Garp3. This trouble-shooter detects
possible faults in models based on a set of diagnostic rules. It then determines the
probability that this fault actually occurs during simulation. Selecting one of the possible
issues explains what the issue is, and gives feedback on how it can be resolved. The
goal of the trouble-shooter is to detect the most frequently occurring issues modellers
face without having to use the tracer, and to then suggest changes to the model that
would resolve the issue.
3
http://www.skype.com
http://flashmeeting.open.ac.uk
5
http://hcs.science.uva.nl/QRM/help/support/
4
4
/ 40
Project No. 004074
NATURNET-REDIME
D4.4
2. Contextual Online Help
The contextual online help system supports modellers by directing them to the
documentation that is relevant to their current task. For the online help system a webpage template was developed for documentation pages that describe each of the
windows in the Garp3 software. The text from user manual documents [12,13] was
converted and significantly improved to fit this new template. The result is a hyperlinked
webpage version of the Garp3 user manual that consists of 351 different pages. Each of
these pages describes the current window, the tasks that can be performed, and the
available short cuts. Furthermore, each page links to pages describing the menu
options, additional features, related tasks, used icons, and used definitions (in the
glossary). In total, there are 1330 different explanations of uses of the 818 icons in
different contexts. From each Garp3 window the modeller can use the contextual help
system to open the documentation page that is relevant to the workspace this person is
currently working in. This type of support is particularly useful to modellers who are not
yet familiar with the Garp3 software, as it describes ‘all’ the knowledge needed to
interact with the application.
2.1. Contextual help
To create the contextual help system, a help button was added to each of the windows
in Garp3. Figure 2.1 shows such a help button in the upper-right corner. The help button
was designed to look like a wise owl to have the conceptual association with the help
system. Pressing the owl opens the help page associated to the screen in a browser.
This is implemented by adding the unique id of the current window to the URL, and
having a script on the webpage redirect the browser to the correct webpage based on
this id.
Figure 2.1: A model fragment editor showing the contextual help button (the owl) in the
upper-right corner of the screen.
5
/ 40
Project No. 004074
NATURNET-REDIME
D4.4
2.2. The online help pages
The online help pages replace the user manual documents to better support modellers
in their modelling activities. To this end a new template for the help pages was
developed. This template consists of 9 different types of content. The textual
descriptions in the user manual were reused when creating the help pages, but
significant additions and improvements were made to make the documentation more
helpful. An example of one of the 351 help pages is shown in Figures 2.2 (part 1) and
2.3 (part 2).
2.2.1. Task description
The ‘Task description’ describes the task the current screen is created to support. For
example, the ‘Model fragment editor’ is used to edit the contents of model fragments.
Figure 2.2 shows the task description on the model fragment editor webpage.
2.2.2. Task context
The ‘Task context’ describes how a screen can be reached from other screens.
Additionally, links to the help pages of these other screens are included. For example,
the ‘Model fragment editor’ can be accessed from the Build tasks in the Garp3 main
menu. Figure 2.2 shows the task context on the model fragment editor webpage.
2.2.3. Tasks in this workspace
The ‘Tasks in this workspace’ section categorizes and describes the tasks that can be
performed in the current screen. Examples of categories are: Add, Edit, Delete, Save,
Change view, etc. In these categories are usually types of model ingredients, such as
Agent, Entity, Model Fragment, etc. The combination of the category and the model
ingredient constitutes the complete task, e.g. Add agent, Edit Entity, Delete model
fragment. Each of these tasks links to their own separate page describing that specific
task. In addition, this section describes how these tasks can be performed via the user
interface. Figure 2.2 shows the ‘Tasks in this workspace’ for the model fragment editor.
2.2.4. Menu options
The ‘Menu options’ enumerate all the menu options that can be found in the drop down
menu in a specific screen. Each item links to a separate page with more information
about that task. The items in ‘Menu options’ can be seen as a different representation of
the ‘Tasks in this workspace’ section. Figure 2.3 shows the ‘Menu options’ section on
the model fragment editor webpage.
2.2.5. Additional features
The ‘Additional features’ section describes characteristics of the screen that are not
tasks. Examples are colour coding, tool-tips, action buttons, conditions and
consequences, and context sensitivity. Each item links to the glossary entry that
explains the concept in more depth. Figure 2.3 shows the ‘Additional features’ section
on the model fragment editor webpage.
2.2.6. Definitions of involved ingredients
The ‘Definitions of involved ingredients section lists the names of each of the model
ingredients mentioned in the screen. Each item links to the glossary entry that explains
the concept in more depth. Examples of model ingredients are: Agent, Assumption,
Attribute, and Calculus. Figure 2.3 shows the ‘Definitions of involved ingredients’ section
on the model fragment editor webpage.
6
/ 40
Project No. 004074
NATURNET-REDIME
D4.4
Figure 2.2: Help page for the Model Fragment Editor (part 1)
2.2.7. Icons
The ‘Icons’ section is a single link to a page showing all the icons used in the editor and
describing their meaning. Figure 2.3 shows the ‘Icons’ section on the model fragment
editor webpage.
2.2.8. Related tasks
The ‘Related tasks’ section enumerates all the other tasks that can be performed on the
model ingredient that the current screen manipulates. For example, the model fragment
being edited by a model fragment editor can also be added, deleted, copied, or be
made inactive. Additionally, the ‘Related tasks’ section lists similar tasks for different
model ingredients. For example, instead of editing a model fragment in the model
fragment editor, a scenario could be edited. As in the other sections, each item links to
a page describing the task in more depth. Figure 2.3 shows the ‘Related tasks’ section
on the model fragment editor webpage.
2.2.9. Shortcuts
The ‘Shortcuts’ section lists all the key-combinations that can be used to initiate certain
tasks. For example, ‘Ctrl + S’ is short for Save model, and ‘Enter’ shows the properties
of a model ingredient. Figure 2.3 shows the ‘Shortcuts’ section on the model fragment
editor webpage.
2.2.10.
Example
The ‘Example’ section shows a screenshot of the editor and describes the usergenerated content in that editor. Figure 2.3 shows the ‘Example’ section on the model
fragment editor webpage.
7
/ 40
Project No. 004074
NATURNET-REDIME
Figure 2.3: Help page for the Model Fragment Editor (part 2)
8
/ 40
D4.4
Project No. 004074
NATURNET-REDIME
D4.4
3. The Simulation Tracer
The trace window is opened from the main Garp3 screen using the trace button pictured
in Figure 3.1. The window shows a trace of the reasoning performed by the simulation
engine while running a simulation. The tracer present in the latest version of Garp3 is
meant to support users during model development and debugging. It allows them to
determine why certain behaviour in the simulation occurs. Also, it provides general
insight in the reasoning process thereby educating the user. The tracer can show all
inferences made by the Garp3 simulation engine, but users may choose to see only the
specific types of inferences they are interested in.
Figure 3.1: Trace button
In previous versions of Garp3 a simulation tracer was present [14,15]), this tracer
however showed only part of the reasoning process and used internal, engine level
descriptions of concepts. It turned out to be of use only for advanced users and
therefore we have done a complete overhaul of the simulation tracer.
3.1. Buttons and trace levels
The user can choose from 11 inference categories that can be traced. The
corresponding buttons can be seen in the tracer window as shown in Figure 3.2.
Figure 3.2: The tracer Window
These inference categories have a loosely hierarchical structure. Running a model with
just the 'general' button on will give an overview of the reasoning process. This mode is
particularly useful for a first look at a model and will show obvious problems such as
inconsistent model fragments very clearly. More options can be added to check the
details of each inference. Still, users may choose to inspect only one specific inference
type without inspecting the ‘general’ inferences. Each inference type is printed in a
specific colour to allow easy identification. Colours have been chosen to correspond
with button colours as much as possible. Table 3.3 gives an overview of the inference
types, buttons and colours. Please note that the background of the tracer window is
black, this allows many different colours to be used that stand out very clearly.
9
/ 40
Project No. 004074
NATURNET-REDIME
Nr.: Button: Name:
1
2
3
4
5
Remarks:
D4.4
Colour:
Errors & Warnings
Always on, Displays error and
warning messages
white
Show general reasoning
status information
Displays reasoning process
overview
white
Displays addition of any model
ingredients
blue
Show search for
applicable model
fragments
Show search for
assumable model
fragments (engine default
inequality reasoning)
Show search for model
fragments still applicable
after transition
Show added
dependencies and check
on conditional inequalities
Displays reasoning
assumptions process
Displays reconsideration of
model fragments
green
turquoise
Displays inequalities (and
exogenous derivative settings,
and value branching)
bisque
6
Show inequality
reasoning details
Displays inequality reasoning
coralred
7
Show inequality
reasoning details:
derivable relations
Displays derivable relations,
after the model fragment
search and after influence
resolution
indianred
8
Show influence resolution
(using influences and
proportionalities)
Displays calculations on the
causal model
purple
9
Show search for possible
terminations
Displays terminations and
causes
gold
10
Show ordering and
removal of possible
terminations
Displays ordering process.
orange
11
Show search for
successor states (using
ordered terminations)
Displays application of
terminations, comparison with
existing states, and lists all
details of newly found states
brown
Table 3.3: Inference types, buttons and colours.
Regular buttons are also present to perform some general tasks. These are shown in
Figure 3.4 and perform the following functions: select all options, deselect all options,
inverse the selection, save the trace to a file, clear the window and close the window.
Figure 3.4: Regular task buttons
10
/ 40
Project No. 004074
NATURNET-REDIME
D4.4
3.2. Example traces
In this section the value of the tracer will be demonstrated using example traces from
existing standard models6: ‘Stove1’ and ‘Ants Garden’ [16]. The different trace option
buttons will be referred to by their number assigned in Table 3.3. Please note that a
small red triangle is always present in these examples. This cursor is part of the tracer
window and should not be confused with the arrows of the explanation boxes used.
For clarity, an overview of the flow of control through the main procedures of the
reasoning engine is given in Figure 3.5. This flow of control is largely followed in the
discussion of the example tracer output.
Figure 3.5: Main procedures in the reasoning engine.
3.2.1. Erroneous model, no states
A common situation arises when a model fragment causes a contradiction because of
inconsistent consequences. The resulting simulation has no states and a modeller
therefore finds valuable information in the tracer as to what has caused the trouble. In
the trace shown in Figure 3.6, just the ‘general’ category (nr 1) was used to inspect an
adapted version of the Stove model. As can be seen, this level of detail provides a very
informative overview of the reasoning process. The reasoning engine trace lists all
events significant at the top level and clearly indicates what went wrong. The
contradiction causes the state search to stop and since this is an important event, it is
displayed within lines.
6
http://hcs.science.uva.nl/QRM/models/
11
/ 40
Project No. 004074
NATURNET-REDIME
D4.4
Figure 3.6: Trace: Simulation with no states
From this trace we learn that 2 model fragments were accepted in the state description:
‘substance’ and ‘liquid_phase’. Also 2 model fragments were already rejected because
of invalid conditions: ‘gas_phase’ and ‘solid_phase’. Most importantly we learn that the
‘example_model_fragment’ is the culprit.
To see which statements in this model fragment cause the contradiction, the simulation
is run once again with options numbers: 1, 2 and 5 switched on. The crucial part of the
resulting trace can be seen in Figure 3.7. Note that the colour coding and indentation
ensure that the trace can be easily interpreted.
Figure 3.7: Trace: Model fragment with inconsistent consequences
The inconsistent relation is marked with a ‘#’ and it states that the amount of liquid is
zero. However, in this example model, the scenario (not shown) states that the amount
of liquid is at the point Max. Since the facts are contradictory it is now clear why the
simulation stops.
12
/ 40
Project No. 004074
NATURNET-REDIME
D4.4
3.2.2. Loading the scenario, inequality reasoning
When option 2 is switched on, the trace will show the addition of all scenario
ingredients. The result for the Stove model is shown in figure 3.8. One of the useful
points here is that when a quantity is first added to the state description, its alternative
internal name is given. This name is used in all subsequent tracer statements.
Figure 3.8: Trace: Scenario application
As shown in Figure 3.9, the definition of quantities can be brought to the surface in this
context if option nr 5 is also turned on.
Figure 3.9: Trace: Quantity definitions in the scenario
13
/ 40
Project No. 004074
NATURNET-REDIME
D4.4
And as shown in Figure 3.10, the definition of quantity values is also brought to the
surface in this case.
Figure 3.10: Trace: Value definitions in the scenario
Another level of detail is added if we turn on option nr 6 as well. Now every newly
derived fact is shown, preceded by its parent relations. This results in an elaborate trace
such as the one pictured in Figure 3.11. In this example it is derived that the
temperature is above absolute zero (‘absnil’) because it is above melting point
(‘freeze_melt’) which is above absolute zero.
Figure 3.11: Trace: Inequality reasoning
3.2.3. Model fragment selection, inequality reasoning
The model fragment selection process is traced using primarily options nr 2, 3, 4 and 5.
As in the case of scenario content addition, the procedure is outlined using a start and
end block statement. A typical trace of the stove model is given in Figure 3.12. Here we
see candidate selection based on simple ingredient conditions: entities, configurations,
14
/ 40
Project No. 004074
NATURNET-REDIME
D4.4
isa-type and parent model fragments. Selected candidates then get checked for
consistent value and inequality conditions after which the candidates are accepted or
rejected. In case of consistent but unknown conditions the decision is postponed. Note
that each proper step in the process is outlined using 2 new lines hereby ensuring
optimal readability.
Figure 3.12: Trace: Model fragment selection
In our example trace, option nr 6 is also on, displaying an interesting inequality
reasoning detail. As can be seen a contradiction is derived. The conditional inequality is:
•
Temperature >= Boilpoint (‘condense_boil’)
However it is known that:
•
Boilpoint > Temperature
And this clearly is inconsistent. The output of the tracer in this case is:
15
/ 40
Project No. 004074
•
NATURNET-REDIME
D4.4
Zero > Zero (which is indeed an inconsistent relation)
The reason for this output is that the applied transitivity reasoning [17,18] is a two-step
process. First the relations are combined into:
•
Temperature + Boilpoint > Temperature + Boilpoint
Then this result is simplified by subtracting equal parts of either side, resulting in:
•
Zero > Zero
Secondly we see that the tracer actually outputs:
•
Zero=AmountOfGas > Zero=AmountOfGas
The reason for this equality showing up is that equal quantities share a pointer (an
internal reference to the quantity, used in calculations). This mechanism [10,17] is used
for efficiency reasons and the tracer will print all quantities with a shared pointer as a
continuous equality.
3.2.4. Reasoning assumptions
The mechanism for making Reasoning Assumptions [10] is active during the model
fragment search. In Figure 3.13 its trace statements are pictured at the overview level
(only option nr 1) for a stove model with unknown temperature.
Figure 3.13: Trace: Reasoning assumptions, general view
On a more detailed level, option nr 3 displays more information on this mechanism in a
bright green colour. As can be seen in Figure 3.14, possible candidates are
reconsidered and a listing is provided of all possible reasoning assumptions before
committing to any one.
16
/ 40
Project No. 004074
NATURNET-REDIME
D4.4
Figure 3.14: Trace: Reasoning assumptions, detailed view
In case a candidate model fragment is inconsistent with the current assumption(s) it is
rejected as is shown in Figure 3.15.
Figure 3.15: Trace: Rejected possible reasoning assumption
If competing reasoning assumptions are present multiple branches are generated in the
statesearch. After completing one branch the reasoning engine jumps to the next
branch by backtracking. The resulting trace statements are shown in Figure 3.16.
17
/ 40
Project No. 004074
NATURNET-REDIME
D4.4
Figure 3.16: Trace: Backtracking on reasoning assumptions
3.2.5. Derived relations
After the search for model fragments and after the influence resolution procedure, the
tracer shows all derivable relations if option nr 7 is chosen. This listing allows the user to
gain an overview of the inequality reasoning results so far. This can be very important
information when debugging a model that has unexpected inconsistencies or results. An
example trace is given in Figure 3.17.
Figure 3.17: Trace: Derivable relations
3.2.6. Exogenous behaviours
Exogenous behaviour patterns have specific rules that govern their derivatives. These
rules assign values to the derivatives of exogenous quantities after the model fragment
search is done but before entering the influence resolution procedure. This process can
be inspected using option nr 5. An example trace taken from the Ants Garden model is
given in Figure 3.18. Note that this process can be a source of branching in the state
search.
18
/ 40
Project No. 004074
NATURNET-REDIME
D4.4
Figure 3.18: Trace: Exogenous derivative assignment
3.2.7. Influence resolution
Influence resolution is an important part of the reasoning engine. It is traceable using
option nr 8. Typical example traces are shown in figures 3.19 and 3.20.
Figure 3.19: Trace: Single influence on quantity
19
/ 40
Project No. 004074
NATURNET-REDIME
D4.4
Figure 3.20: Trace: Multiple influences on a quantity
A recent addition to the influence resolution procedure is the calculation of 2nd order
derivatives [10]. As shown in Figure 3.21, these are displayed in a similar style using the
same option.
Figure 3.21: Trace: 2nd order derivatives
3.2.8. Terminations
Using option nr 9 a trace is shown of the search for terminations. Each changing
quantity magnitude, inequality or quantity derivative triggers a termination that is
displayed accompanied by an explanation of the reasons for the change. Changing
quantities may have additional epsilon or 2nd order derivative continuity constraints
which are also displayed in this context. Note that other trace options will not reveal
more information in this context, because no inequality reasoning is actively used in this
procedure. An example trace of terminations firing is shown in Figure 3.22.
20
/ 40
Project No. 004074
NATURNET-REDIME
D4.4
Figure 3.22: Trace: Terminations
3.2.9. Ordering
The ordering procedure consists of a number of sub procedures each of which may or
may not pose additional constraints on valid or invalid combinations of terminations. All
of these procedures are traced using option nr 10. Epsilon ordering is the first applied
concept and its trace is shown in Figure 3.23.
Figure 3.23: Trace: Epsilon ordering
21
/ 40
Project No. 004074
NATURNET-REDIME
D4.4
Correspondences are an important source of information during ordering. The trace of
this sub process is shown in Figure 3.24.
Figure 3.24: Trace: Correspondence ordering
Figure 3.25: Trace: Mathematical ordering
22
/ 40
Project No. 004074
NATURNET-REDIME
D4.4
Mathematical ordering uses the inequality reasoning engine to determine valid
combinations of terminations. Note that this procedure can reveal a lot of extra
information when options 2, 4 and 5 are also selected because the details of each
combination are added to a temporary environment and tested for consistency. A typical
trace of the mathematical ordering process is shown in Figure 3.25.
The trace of the ordering procedure finishes with a listing of al valid combinations of
terminations that will be used as in transition scenarios in the search for successor
states. A typical example of such a listing is provided in Figure 3.26.
Figure 3.26: Trace: Ordering results
23
/ 40
Project No. 004074
3.2.10.
NATURNET-REDIME
D4.4
Successor states
The application of transition scenarios is very similar to the application of normal
scenarios. This part of the reasoning process is displayed at a general level using
option nr 11 and at a detailed level using options 2 and 4. Note that epsilon derivative
continuity constraints and 2nd order derivative continuity constraints are displayed at this
point just as in the termination procedure. Option nr 4 is also important in the context of
the search for successor states because it shows the checking of candidate model
fragments that were active in the previous state. A typical trace is shown in Figure 3.27.
Figure 3.27: Trace: Apply transition content
After the complete state description of a state has been determined it is compared to
existing states. Again option nr 11 controls if this process is traced. If an equal state is
found a transition to that state is returned. If no equal state is found the listing of the
new state is displayed. A trace of the comparison process and the state listing can be
seen in Figure 3.28.
24
/ 40
Project No. 004074
NATURNET-REDIME
D4.4
Figure 3.28: Trace: State comparison and state listing
3.3. Conclusions and future research
The simulation tracer provides a unique and very useful information source for the
modeller. Some ideas for future work are the integration of the tracer output in a flexible
tree structure, which can be navigated using an intelligent search component.
25
/ 40
Project No. 004074
NATURNET-REDIME
D4.4
4. Troubleshooting
The UvA accumulated and documented all their modelling support efforts (as mentioned
in the introduction). There are minutes of the Skype meetings, recordings of the
Flashmeetings, an archive of all the questions on the QRM mailing list, and the bug
report system is publicly accessible7. Based on an analysis of this material a Frequently
Asked Questions (FAQ) list has been created [10]. The ten most frequently occurring
troubleshooting issues were selected from this list. These issues are now automatically
detected by the trouble-shooter, which also advises the modeller on how the issues can
be resolved by directing them to a specific FAQ entry.
4.1. Troubleshooting viewer
The new troubleshooting viewer can be opened from the model fragment definitions
editor (see Figure 4.1). By pressing the new yellow owl button, the troubleshooting
viewer is opened (see Figure 4.2). Opening the troubleshooting viewer automatically
runs the diagnostic rules.
In the top field of the troubleshooting viewer a list is presented of the issues
found. Each issue includes a percentage (i.e. a chance), a short description of the
issue, and the key model fragment in which the issue was found. The percentage
indicates the probability that the trouble-shooter attributes to the issue it has found. A
higher percentage means that it is more likely that the issue really occurs. The issues
are ordered by percentage. The short description of the issue gives a context
independent summary of what the issue entails. Finally, the key model fragment
indicates the model fragment that includes the key model ingredient that the troubleshooter found to be causing the issue. Double-clicking on the issue opens the FAQ
page on the QRM Portal in a browser on precisely the entry that describes the
encountered issue. This FAQ entry also describes how the issue can be resolved.
In the bottom field a context-dependent description is given about an issue.
Selecting an issue in the top field shows a detailed description of the issue in the bottom
field. It mentions the quantities and dependencies that are involved in the issue and in
which model fragment they can be found. Finally, pressing the ‘Show relevant model
fragments’ button opens all the relevant model fragments that contribute to the issue.
7
http://hcs.science.uva.nl/QRM/help/bugs/
26
/ 40
Project No. 004074
NATURNET-REDIME
D4.4
Figure 4.1: The model fragment definitions editor has a new yellow owl icon that opens
the troubleshooting viewer.
Figure 4.2: An example of a model fragment editor.
27
/ 40
Project No. 004074
NATURNET-REDIME
D4.4
Figure 4.3: FAQ entry describing how to resolve the ambiguity issue.
4.2. Diagnostic Rule Format
Besides the issues of formalizing domain knowledge, modellers encounter simulation
issues caused by specific constructions of model ingredients. For example, certain
constructions can cause model fragments not to fire, or irresolvable causal relations
may exist, or ambiguity (many generated states), and even inconsistencies (nongenerated states).
We call the rule descriptions that detect the above constructions diagnostic rules.
To automatically detect issues in models the diagnostic rule format was developed.
Each diagnostic rule is formalised as a set of rule-elements. It is not possible to
determine whether an issue is really caused by the construction described in the
diagnostic rule with absolute certainty without recreating the simulation engine. Using
the simulation engine to diagnose and repair issues may be pursued in future work. The
main reason for choosing the approach presented here is that the rule-elements in a
diagnostic rule can be distributed over multiple model ingredients that do not
necessarily fire all. Therefore, each rule-element in a diagnostic rule returns a chance
between 0 and 100%. The algorithm calculates the chance of the construction in the
model really causing problems during simulation by adding the chances returned by
each of the rule-elements, and dividing this by the number of rule-elements.
The syntax of the diagnostic rules is based on the Prolog syntax. The syntax
differs since the semantics of the rules differs from Prolog. In contrast with Prolog, there
is no backtracking after a rule-element fails or applies. The reason for this is that each
diagnostic rule is based on a single key ingredient. Given this key ingredient the
algorithm determines whether the rest of the rule is true.
The diagnostic rule syntax consists of seemingly regular Prolog calls. However,
the ‘,’ character for and is replaced by ‘&’, the ‘;’ character for or is replaced by ‘|’, and
the ‘:-’ character combination for ‘if’ is replaced by ‘::-‘. This syntax distinguishes normal
Prolog calls from the diagnostic rules. Figure 4.4 shows a diagnostic rule using this
code. Before the ‘::-‘ is the name of the rule, Element is the key element, and the other
arguments are returned by the rule. After the ‘::-‘ are a set of rule-elements that describe
when the issue occurs. Each rule-element takes and returns a set of arguments. A ruleelement that revolves around a specific model ingredient usually returns a model
fragment in which that model ingredient occurs. This argument can also be used to
indicate that the model ingredient must occur in a specific model ingredient. The final
argument is a list of model fragments in which the ingredient may not occur.
28
/ 40
Project No. 004074
NATURNET-REDIME
D4.4
As can be seen from Figure 4.4 the calculations of the chances are not
represented in the diagnostic rules. This is on purpose, since the calculations would
make writing the diagnostic rules more complex. The new syntax for diagnostic rules
allows us to rewrite the rules during compilation. These rewritten rules deal with the
chances and calculation of the chance of the total diagnostic rule by adding another
argument (the chance) and equations that calculate the result of all the chances. Figure
4.5 shows the rewritten form of the rules shown in Figure 4.4. Note the use of inverse as
part of the language. Inverse is the not in the probabilistic world. If a rule-element has
30% chance, the inverse of the rule-element has 70% chance.
ambiguity(Element, MF1, QuantityEntityList) ::% proportionality between A and B / start point
proportionality(Element, Quantity1, Entity1, Quantity2, Entity2, MF1, []) &
% No correspondence between the start point and the next quantity
inverse(qsCorrespondence(Quantity1, Entity1, Quantity2, Entity2, _MF2, [])) &
% The proportionality should not go to a rate variable (optional)
%inverse(eInfluence(Quantity2, Entity2, _Quantity3, _Entity3, _MF3, [])) &
% Not another start point (not(proportionality and not(correspondence))
% rewrite: not(A and not(B)) -> not(A) or B
(
% no proportionality and A without a correspondence between _X and Q1
inverse(eProportionality(QuantityX, EntityX, Quantity1, Entity1, _MF4, [])) |
qsCorrespondence(QuantityX, EntityX, Quantity1, Entity1, _MF5, [])
) &
% find all proportional/non-corresponding quantities with A as a beginning
ambiguousChain(Element, QuantityEntityList).
Figure 4.4: A diagnostic rule describing an invalid increase in a top point value.
design:ambiguity(A, B, J, P) :(
proportionality(A, C, D, E, F, B, [], N)
-> (
inverse(qsCorrespondence(C, D, E, F, _, [], _), L)
-> (
(
inverse(eProportionality(G, H, C, D, _, [], _), I)
-> true
;
qsCorrespondence(G, H, C, D, _, [], I)
)
-> ambiguousChain(A, J, K)
-> M is I+K
)
-> O is L+M
)
-> Q is N+O
),
P is Q/4
Figure 4.5: The rewritten Prolog form of the rule shown in Figure 4.4.
4.3. Diagnostic rules
The following sections describe each of the implemented diagnostic rules. A description
of the diagnostic rule is given, and the actual diagnostic rule code and some model
fragments containing the issue are shown. Note that the rule-elements in each
diagnostic rule are actually function calls that hide more implementation details.
4.3.1. Ambiguity due to non-corresponding quantities
The ambiguity rule detects the non-corresponding quantities related by a proportionality.
The construction potentially generates many states, one for each combination of values
of the non-corresponding quantities. The total amount of states could become the cross
product of the values of each quantity (given only these model fragments). If each of the
quantities is in an interval and changing, the number of successor states would be 2^q –
1 (where q is the number of unrelated quantities), since at least one quantity changes,
but each quantity can change both with and without the others.
29
/ 40
Project No. 004074
NATURNET-REDIME
D4.4
The rule searches for a proportionality (key element) between Q1 and Q2,
without a correspondence between Q1 and Q2. Furthermore, there cannot be a
proportionality without a correspondence from QX to Q1 (i.e. there cannot be another
start point for the chain of proportionalities). This is logically written as
not(proportionality AND not(correspondence)), and rewritten as not(proportionality) OR
correspondence. Given this construction, the rule searches for a chain of noncorresponding correspondences beginning at the key element. The target of
proportionalities cannot be determined by an operator relation (plus or minus), as this
would remove the ambiguity. The ambiguity rule is shown in Figure 4.6. A model
fragment on which the rule fires is shown in Figure 4.7.
Adding correspondences between the non-corresponding quantities, or
determining their value using operator relations can resolve this issue.
ambiguity(Element, MF1, QuantityEntityList) ::% proportionality between A and B / start point
proportionality(Element, Quantity1, Entity1, Quantity2, Entity2, MF1, []) &
% No correspondence between the start point and the next quantity
inverse(qsCorrespondence(Quantity1, Entity1, Quantity2, Entity2, _MF2, [])) &
% The proportionality should not go to a rate variable (optional)
%inverse(eInfluence(Quantity2, Entity2, _Quantity3, _Entity3, _MF3, [])) &
% Not another start point (not(proportionality and not(correspondence))
% rewrite: not(A and not(B)) -> not(A) or B
(
% no proportionality and A without a correspondence between _X and Q1
inverse(eProportionality(QuantityX, EntityX, Quantity1, Entity1, _MF4, [])) |
qsCorrespondence(QuantityX, EntityX, Quantity1, Entity1, _MF5, [])
) &
% find all proportional/non-corresponding quantities with A as a beginning
ambiguousChain(Element, QuantityEntityList).
Figure 4.6: The ambiguity rule
Figure 4.7: An example of a model fragment causing ambiguity.
4.3.2. Discontinuous change due to conditional influences
The discontinuous change due to conditional influences rule detects opposing
influences of which one is removed by a conditional inequality. If this influence is
dominant, removal will make the other influence dominant, causing a change in
derivative (from increasing to decreasing, or the other way around). This can be illegal,
since it may break the continuity rule (the derivative should first become zero).
There are three possible ways this construction can occur (Figure 4.8). Firstly,
there is a net-negative influence with a conditional inequality on its target quantity and a
net-positive influence without one. Secondly, the net-positive influence can have the
inequality, but the net-negative can have none. Finally, both influences can have an
inequality, but they are on different values (i.e. the influences do not disappear at the
same time). Figure 4.9 shows two model fragments on which the first variant of the rule
applies.
conditional_influences_discontinuous_change(Element,
[[Quantity1, Entity1, MF],[Quantity2, Entity2, MF],[Quantity3, Entity3,
MF2],[Quantity2, Entity2,MF2]], MF) ::netNegInfluence(Element, Quantity1, Entity1, Quantity2, Entity2, MF, []) &
30
/ 40
Project No. 004074
NATURNET-REDIME
D4.4
netPosInfluenceOn(Quantity3, Entity3, Quantity2, Entity2, MF2, [MF]) &
inequality(Quantity2, Entity2, _Type, _Value, MF, []) &
inverse(inequality(Quantity2, Entity2, _Type2, _Value2, MF2, [])).
conditional_influences_discontinuous_change(Element,
[[Quantity1, Entity1, MF],[Quantity2, Entity2, MF],[Quantity3, Entity3,
MF2],[Quantity2, Entity2,MF2]], MF) ::netNegInfluence(Element, Quantity1, Entity1, Quantity2, Entity2, MF, []) &
netPosInfluenceOn(Quantity3, Entity3, Quantity2, Entity2, MF2, [MF]) &
inequality(Quantity2, Entity2, _Type, _Value, MF2, []) &
inverse(inequality(Quantity2, Entity2, _Type2, _Value2, MF, [])).
conditional_influences_discontinuous_change(Element,
[[Quantity1, Entity1, MF],[Quantity2, Entity2, MF],[Quantity3, Entity3,
MF2],[Quantity2, Entity2,MF2]], MF) ::netNegInfluence(Element, Quantity1, Entity1, Quantity2, Entity2, MF, []) &
netPosInfluenceOn(Quantity3, Entity3, Quantity2, Entity2, MF2, [MF]) &
inequality(Quantity2, Entity2, Type, Value, MF2, []) &
inequality(Quantity2, Entity2, Type2, Value2, MF, []) &
inverse(equivalentInequality(Quantity2, Entity2, Type, Type2, Value, Value2)).
Figure 4.8: The discontinuous derivative change rule
Figure 4.9: Two influences that potentially cause a discontinuous chance.
4.3.3. Conflicting causal relations
The conflicting causal relations rule detects occurrences of influences and
proportionalities on the same quantity. This is construction is always ambiguous, since
the proportionality determines the target quantity based on the derivative of the source
quantity, while the influence determines the derivative of the target quantity based on
the magnitude of the source quantity. There is no way to determine which causal
relation is dominant. The rule is shown in Figure 4.10, while an example of this
construction is shown in Figure 4.11.
conflicting_causal_relations(Element, [[Quantity1, Entity1, MF1],[Quantity2, Entity2,
MF1],[Quantity3, Entity3, MF2],[Quantity2, Entity2, MF2]], MF1) ::proportionality(Element, Quantity1, Entity1, Quantity2, Entity2, MF1, []) &
eInfluence(Quantity3, Entity3, Quantity2, Entity2, MF2, []).
Figure 4.10: The conflicting causal relations rule.
Figure 4.11: Two model fragments with conflicting causal relations.
31
/ 40
Project No. 004074
NATURNET-REDIME
D4.4
4.3.4. Invalid decrease (increase) in bottom (top) point value
The invalid decrease in bottom point value, and the invalid increase in top point value
rules detect instances where influences potentially cause quantities to increase in the
maximum or decrease in the minimum point value of a quantity space (but not zero, see
also next section). Figure 4.12 shows the rules, and Figure 4.13 shows a model
fragment where Ecological integrity potentially increases in the top point value.
The decrease in bottom point value rule searches for a net-negative influence
between Q1 and Q2. The lowest value of Q2 should be a point. There should not be a
net-positive influence on Q2, and there should not be a conditional inequality on Q2 that
removes the negative influence before it reaches the lowest point value.
The increase in top point value rule searches for a net-positive influence between
Q1 and Q2. The top value of Q2 should be a point. There should not be a net-negative
influence on Q2, and there should not be a conditional inequality on Q2 that removes
the positive influence before it reaches the top point value.
The issue can be resolved by having a feedback (proportionality) on the
influence, causing it to decrease when Q2 reaches the top or bottom point value. A
directed value correspondence to Q1 can indicate that the influence has no effect once
Q2 reaches zero.
decrease_in_bottom_point_value(Element, [[Quantity1, Entity1, MF],[Quantity2, Entity2,
MF]], Quantity2) ::netNegInfluence(Element, Quantity1, Entity1, Quantity2, Entity2, MF, []) &
bottomPointValue(Quantity2, Entity2) &
inverse(netPosInfluenceOn(_Quantity3, _Entity3, Quantity2, Entity2, _MF2, [])) &
inverse(inequalityGreaterThanBottom(Quantity2, Entity2, MF, [])).
increase_in_top_point_value(Element, [[Quantity1, Entity1, MF],[Quantity2, Entity2,
MF]], Quantity2) ::netPosInfluence(Element, Quantity1, Entity1, Quantity2, Entity2, MF, []) &
topPointValue(Quantity2, Entity2) &
inverse(netNegInfluenceOn(_Quantity3, _Entity3, Quantity2, Entity2, _MF2, [])) &
inverse(inequalitySmallerThanTop(Quantity2, Entity2, MF, [])).
Figure 4.12: The decrease (increase) in a bottom (top) point value rules.
Figure 4.13: A model fragment potentially causing an invalid increase in top point value
of Ecological integrity.
4.3.5. Invalid decrease (increase) in bottom (top) zero
The invalid decrease in zero, and the invalid increase in zero rules detect instances
where influences potentially cause quantities to increase in zero (as the maximum
value) or decrease in zero (as the minimum value) of a quantity space. Figure 4.14
32
/ 40
Project No. 004074
NATURNET-REDIME
D4.4
shows the rules, and Figure 4.15 shows a model fragment where ‘Number of’ potentially
decreases in zero.
The decrease in zero rule searches for a net-negative influence between Q1 and
Q2. The bottom value of Q2 should be zero. There should not be a net-positive
influence on Q2, and there should not be a conditional inequality on Q2 that removes
the negative influence before it reaches zero.
The increase in zero rule searches for a net-positive influence between Q1 and
Q2. The top value of Q2 should be zero. There should not be a net-negative influence
on Q2, and there should not be a conditional inequality on Q2 that removes the positive
influence before it reaches the zero.
The issue can be resolved by having a feedback (proportionality) on the
influence, causing the resulting influence go to zero when Q2 reaches zero. A directed
value correspondence to Q1 can indicate that the influence has no effect once Q2
reaches zero.
Notice that this rule relates to the rule discussed in the previous section. They are
handled separately because zero has a special status in the reasoning engine, and
because the Garp3 software has different ‘system preferences’ to alleviate the
constraints on increasing and decreasing while being at extreme magnitudes.
decrease_in_bottom_zero(Element, [[Quantity1, Entity1, MF],[Quantity2, Entity2, MF]],
Quantity2) ::netNegInfluence(Element, Quantity1, Entity1, Quantity2, Entity2, MF, []) &
zeroBottomValue(Quantity2, Entity2) &
inverse(netPosInfluenceOn(_Quantity3, _Entity3, Quantity2, Entity2, _MF2, [])) &
inverse(inequalityGreaterThanBottom(Quantity2, Entity2, MF, [])).
increase_in_top_zero(Element, [[Quantity1, Entity1, MF],[Quantity2, Entity2, MF]],
Quantity2) ::netPosInfluence(Element, Quantity1, Entity1, Quantity2, Entity2, MF, []) &
zeroTopValue(Quantity2, Entity2) &
inverse(netNegInfluenceOn(_Quantity3, _Entity3, Quantity2, Entity2, _MF2, [])) &
inverse(inequalitySmallerThanTop(Quantity2, Entity2, MF, [])).
Figure 4.14: The decrease (increase) in a bottom (top) zero point value rules.
Figure 4.15: A model fragment in which Number of potentially decreases in zero.
4.3.6. Same quantity with different quantity spaces
The same quantity different quantity space rule searches for quantities that have
different quantity spaces in different model fragments. This issue is detected, because
quantities with the same name but with different quantity spaces cannot be unified. It is
probably not what the modeller had in mind. Figure 4.16 shows the rule and Figure 4.17
shows two model fragments for which the issue occurs.
same_quantity_different_qs(Element, Quantity, Entity, MF1, MF2) ::quantity(Element, Quantity, Entity) &
nonEqualQS(Quantity, Entity, Quantity, Entity, MF1, MF2, []).
Figure 4.16: The same quantity different quantity spaces rule.
33
/ 40
Project No. 004074
NATURNET-REDIME
D4.4
Figure 4.17: Two model fragments in which Qtwo occurs with different quantity spaces.
4.3.7. Invalid loop of proportionalities
The proportionality loop rule detects chains of proportionalities that end at the
beginning. This construction is irresolvable for the simulation engine, as each quantity
requires the derivative of the previous quantity to be determined in order to determine
its own derivative. Figure 4.18 shows the proportionality rule code, and Figure 4.19
shows an adapted version of the tree and shade model that has a proportionality loop in
it.
This issue can be resolved by removing one of the proportionalities.
proportionality_loop(Element, MF1, QuantityEntityModelFragmentList) ::proportionality(Element, _Quantity1, _Entity1, _Quantity2, _Entity2, MF1, []) &
full_proportionality_loop(Element, QuantityEntityModelFragmentList).
Figure 4.18: The invalid loop of proportionalities rule.
Figure 4.19: An adapted version of the tree and shade model causing an invalid loop of
proportionalities.
4.3.8. Consequential derivative value assignment causes conflict
The multiple consequential derivative value assignments conflict rule searches for
quantities that have multiple derivative value assignments on them as a consequence. If
these model fragments fire at the same time, an inconsistency would result, since a
quantity cannot have multiple derivative values at the same time. Figure 4.20 shows the
rule, and Figure 4.21 shows 3 model fragments with a value assignment on different
derivatives as a possible example of the problem detected by this rule.
By having different assumptions for each value assignment, or having the
derivative value assignments as conditions (which makes the simulator assume that the
quantity has that particular value) this issue can be resolved.
derivative_value_assignments_consequences(Element, Quantity, _Entity, ModelFragments)
::derivativeAssignment(Element, Quantity, Entity) &
differentDerivativeAssignments(Quantity, Entity, ModelFragments).
Figure 4.20: The multiple conflicting consequential derivative value assignments rule.
34
/ 40
Project No. 004074
NATURNET-REDIME
D4.4
Figure 4.21: Three model fragments with different derivative value assignments.
4.3.9. Conflicting derivative value assignment and causal relation
The conflicting consequential derivative value assignment and causal relation rule
detects derivative value assignments on quantities that are also influences by a causal
relation in some way. It searches for a consequential derivative value assignment on Q
as a key ingredient, and either a proportionality or an influence on Q. Since the netresult of the causal relation can be positive, stable or negative, it potentially clashes with
the derivative value assignment. Figure 4.22 shows the rule, and Figure 4.23 shows a
model fragment with a derivative value assignment and an influence on Qone as a
possible example of the problem detected by the rule.
derivative_value_assignment_plus_causal(Element, Quantity, Entity, [[QuantityX,
EntityX, MF1],[Quantity, Entity, MF1]]) ::derivativeAssignment(Element, Quantity, Entity) &
(
eProportionality(QuantityX, EntityX, Quantity, Entity, MF1, []) |
eInfluence(QuantityX, EntityX, Quantity, Entity, MF1, [])
).
Figure 4.22: The conflicting derivative value assignment and causal relation rule.
Figure 4.23: A model fragment with a derivative value assignment and an influence on
Qone.
4.3.10.
Multiple consequential value assignments on quantity
The multiple consequential value assignments on a quantity rule searches for quantities
that have multiple value assignments on them as a consequence. If these model
fragments fire at the same time, an inconsistency would result, since a quantity cannot
have multiple values at the same time. Figure 4.24 shows the rule, and Figure 4.25
shows 4 model fragments with a value assignment on different magnitudes.
By having different assumptions for each value assignment, or having the value
assignments as conditions (which makes the simulator assume that the quantity has
that particular value) this issue can be resolved.
35
/ 40
Project No. 004074
NATURNET-REDIME
D4.4
multiple_consequence_value_assignments_on_quantity(Element, QuantityName, EntityName,
ModelFragments) ::valueAssignment(Element, QuantityName, EntityName) &
differentValueAssignments(QuantityName, EntityName, ModelFragments).
Figure 4.24: The multiple consequential value assignments on quantity rule.
Figure 4.25: Four different model fragments with different value assignments causing
inconsistencies.
4.4. Troubleshooting the Riacho Fundo Model
During its development the trouble-shooter was tested on the latest version of the case
studies models in the NaturNet-Redime project. The results were used to refine the
diagnostic rules.
Figure 4.2 shows the results for running the trouble-shooter on the Riacho Fundo
model (version March 16th, 2007). Thirty ‘issues’ were found. Figure 4.2 highlights one
of those, namely the rule referring to ‘87.5% Non-corresponding proportional quantities
potentially cause ambiguity (R08 manure influences fertility)’. This issue was found
because of the following situation. In the model fragment R08c (Figure 4.26) Rural rf:
Fertility is set to be proportional to Cattle: Manure, and in model fragment R17 (Figure
4.27) the Crop: Resource inflow is set to be proportional to Rural rf: Fertility. This
potentially allows for a whole set of states referring to all the possible combinations of all
values for Manure, Fertility and the Resource inflow (the latter only if ‘Amount of Water’
remains unset).
Figure 4.26: Model fragment ‘R08c manure influences fertility’
36
/ 40
Project No. 004074
NATURNET-REDIME
D4.4
Figure 4.27: Model fragment ‘R17 resource inflow for crop production’
Another issue that was found is ‘75% Potentially invalid decrease in bottom zero (S02
aggregation process)’ (not shown in Figure 4.2.). The model fragment involved is shown
in Figure 4.28. The explanation is as follows. The influence from Particle aggregation
rate potentially causes Level of aggregation to decrease in zero when Particle
aggregation rate has the value Min. This is potentially an invalid state of behaviour that
should be prevented from occurring. That is, when Level of aggregation reaches zero
the influence form Particle aggregation rate should cease to exist.
Figure 4.28: Model fragment: ‘S02 aggregation process’
This experiment with the well-developed Riacho Fundo model shows that the troubleshooter is a useful addition to Garp3 to identify issues during modelling. It can help
modellers to critically think and rethink modelling choices made. However, not all issues
found by the trouble-shooter need to be model flaws. It may well be that case that the
modeller created certain ‘features’ on purpose and it may also be the case that the
trouble-shooter found non-existing problems. After all, the trouble-shooter implements a
heuristic approach to support modellers in finding problems. To ultimately discover
whether a fault exists, the best method is to run the simulation engine and inspect the
simulation results.
37
/ 40
Project No. 004074
NATURNET-REDIME
D4.4
5. Conclusions
The intelligent help system in Garp3 consists of three aspects that make the software
more intelligent and easier to use. The online help system directs modellers to the
correct documentation based on their current task. For this system a new web-based
user manual has been developed. The tracer shows the inferences made by Garp3
when simulating qualitative models. The tracer provides modellers the means to
accurately pinpoint why models show certain behaviour. The trouble-shooter helps
modellers to debug models without needing to use the tracer (which requires some
knowledge about how the reasoning works). This trouble-shooter is the first step
towards an automated debugging facility for Garp3. The trouble-shooter detects
possible faults in models based on a set of rules. It then determines the probability that
this fault actually occurs during simulation. The trouble-shooter also gives feedback on
how the issue can be resolved. An experiment with the Riacho Fundo case model
shows that the trouble-shooter can be useful to identify issues in complex models.
38
/ 40
Project No. 004074
NATURNET-REDIME
D4.4
6. References
1. Eugenia Cioaca, Bert Bredeweg, Paulo Salles, Tim Nuttle. A Garp3 Model of
Environmental Sustainability in the Danube Delta Biosphere Reserve based on
Qualitative Reasoning Concept. 21st International Workshop on Qualitative
Reasoning (QR'07). Chris Price (eds.), pages 7-16, Aberystwyth, Wales, U.K.,
26-28 June, 2007.
2. Elena Nakova, Bert Bredeweg, Paulo Salles, Tim Nuttle. A Garp3 model of
environmental sustainability in the River Mesta (Bulgaria). 21st International
Workshop on Qualitative Reasoning (QR'07). Chris Price (eds.), pages 87-95,
Aberystwyth, Wales, U.K., 26-28 June, 2007.
3. Richard Noble, Tim Nuttle, Paulo Salles. Integrative qualitative modelling of
ecological and socio-economic aspects of river-rehabilitation in England. 21st
International Workshop on Qualitative Reasoning (QR'07). Chris Price (eds.),
pages 96-101, Aberystwyth, Wales, U.K., 26-28 June, 2007.
4. Paulo Salles, Bert Bredeweg, Ana Luiza Rios Caldas, Tim Nuttle. Modelling
sustainability in the Riacho Fundo water basin (Brasília, Brazil). 21st International
Workshop on Qualitative Reasoning (QR'07). Chris Price (eds.), pages 147-160,
Aberystwyth, Wales, U.K., 26-28 June, 2007.
5. Andreas Zitek, Susanne Muhar, Sabine Preis, Stefan Schmutz. The riverine
landscape Kamp (Austria): an integrative case study for qualitative modeling of
sustainable development. 21st International Workshop on Qualitative Reasoning
(QR'07). Chris Price (eds.), pages 212-217, Aberystwyth, Wales, U.K., 26-28
June, 2007.
6. Bouwer, A., Bredeweg, B., Liem, J., and Salles, P. 2006. 1st NNR user group
workshop on using QR technology , Naturnet-Redime, STREP project co-funded
by the European Commission within the Sixth Framework Programme (20022006), Project no. 004074, Project Deliverable Milestone M7.2.1.
7. Nuttle, T., Liem, J., Bouwer, A., Bredeweg, B., and Salles, P. 2006. 2nd NNR
user group workshop on Qualitative Reasoning and Modelling, Naturnet-Redime,
STREP project co-funded by the European Commission within the Sixth
Framework Programme (2002-2006), Project no. 004074, Project Deliverable
Milestone M7.2.2.
8. Liem, J., Bouwer, A., Bredeweg, B., Salles, P. and Bakker, B. 2007. 3rd NNR
user group workshop on Qualitative Reasoning and Modelling, Naturnet-Redime,
STREP project co-funded by the European Commission within the Sixth
Framework Programme (2002-2006), Project no. 004074, Project Deliverable
Milestone M7.2.3.
9. Bredeweg, B., Salles, P., Bertels, D., Rafalowicz, J., Bouwer, A., Liem, J. 2007.
Fourth NNR user group workshop on Qualitative Reasoning and Modelling,
Naturnet-Redime, STREP project co-funded by the European Commission within
the Sixth Framework Programme (2002-2006), Project no. 004074, Project
Deliverable Milestone M7.2.4.
10. Bouwer, A., Liem, J., Linnebank, F., and Bredeweg, B. 2007. Analysis of
Frequently Asked Questions and Improvements to the Garp3 Workbench,
Naturnet-Redime, STREP project co-funded by the European Commission within
the Sixth Framework Programme (2002-2006), Project no. 004074, Project
Deliverable Milestone D4.2.3.
11. J. Liem, B. Bredeweg and A. Bouwer, 2005. QR Subportal First Release,
Naturnet-Redime, STREP project co-funded by the European Commission within
39
/ 40
Project No. 004074
NATURNET-REDIME
D4.4
the Sixth Framework Programme (2002-2006), Project no. 004074, Project
Deliverable Report D3.3.
12. Bouwer, A., Liem, J., and Bredeweg, B. 2005. User Manual for Single-User
Version of QR Workbench, Naturnet-Redime, STREP project co-funded by the
European Commission within the Sixth Framework Programme (2002-2006),
Project no. 004074, Project Deliverable Report D4.2.1.
13. E. Bakker, A. Bouwer, J. Liem, and B. Bredeweg, 2006. User Manual for
Collaborative QR model building and simulation workbench, Naturnet-Redime,
STREP project co-funded by the European Commission within the Sixth
Framework Programme (2002-2006), Project no. 004074, Project Deliverable
Report D4.2.2.
14. Bredeweg, B., Bouwer, A., and Liem, J. 2006. Single-user QR model building
and simulation workbench , Naturnet-Redime, STREP project co-funded by the
European Commission within the Sixth Framework Programme (2002-2006),
Project no. 004074, Project Deliverable Report D4.1.
15. Bredeweg, B., Bouwer, A., Jellema, J., Bertels, D., Linnebank, F., and Liem, J.
Garp3 - A new Workbench for Qualitative Reasoning and Modelling. 20th
International Workshop on Qualitative Reasoning (QR-06), C. Bailey-Kellogg and
B. Kuipers (eds), pages 21-28, Hanover, New Hampshire, USA, 10-12 July 2006.
16. P. Salles, B. Bredeweg and N. Bensusan. 2006. The ants' garden: Qualitative
models of complex interactions between populations. Ecological Modelling,
Volume 194, Issues 1-3, pages 90-101.
17. Linnebank, F. 2004. Common Sense Reasoning. Master thesis, University of
Amsterdam, Amsterdam, The Netherlands.
18. Simmons, R. 1986. “Commonsense” Arithmetic Reasoning, Proceedings of
AAAI-86, p.118-124, Philadelphia, California.
40
/ 40