1
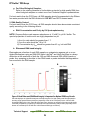
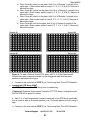
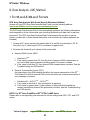
User Manual / Handbook
2
™
RT Profiler PCR Array System
Pathway-Focused Gene Expression Profiling
Using Real-Time PCR
See Purchaser Notification for limited use license and warranty information (page 41).
Part #1022A
Version 5.01
9/16/2010
2
RT Profiler PCR Array System
Pathway-Focused Gene Expression Profiling Using Real-Time PCR
User Manual
(For Catalog Numbers Prefixed by: PAHS, PAMM, PARN,
PADM, and PAQQ)
QIAGEN Catalog # 330231, 330111, 330131
Ordering and Technical Service Contact Information:
•
•
•
•
Tel:
Fax:
On-line Order:
E-MAIL:
1-888-503-3187 (US)
301-682-9200 (outside US)
1-888-465-9859 (US)
301-682-7300 (outside US)
www.SABiosciences.com
[email protected] (to place an order)
[email protected] (for technical support)
You may place orders by fax, e-mail or from our website. Each order should include the
following information:
•
•
•
•
•
Your contact information (name, phone, email address)
Product name, catalog number and quantity
Purchase order number or credit card information (Visa or MasterCard)
Shipping address
Billing address
For more information, visit us at www.SABiosciences.com
SABiosciences, A QIAGEN Company
6951 Executive Way, Suite 100
Frederick, MD 21703
USA
2
CONTENTS
I.
Background and Introduction
4
II.
Materials Provided
8
III.
Additional Materials Required
10
IV.
Complementary Products
12
V.
Protocol
13
A.
RNA Preparation and Quality Control
15
B.
RT2 First Strand Kit
19
C.
Performing Real-Time PCR
a. For 96-well and 384-well Formats
b. For 100-well Rotor-Gene Q 100
21
28
Data Analysis
a. For 96-well and 384-well Formats
b. For 100-well Rotor-Gene Q 100
32
34
D.
VI.
Troubleshooting and Frequently Asked Questions
Appendix: Modified Protocol for Housekeeping Gene PCR Arrays
3
37
39
RT2 Profiler™ PCR Arrays
I. Background and Introduction
Real-time reverse transcription (RT) PCR is the most sensitive and reliable method for
gene expression analysis. Its wide dynamic range makes real-time RT-PCR the preferred
choice for the simultaneous quantification of both rare and abundant genes in the same
sample. The RT2 Profiler PCR Array takes advantage of real-time PCR performance and
combines it with the ability of microarrays to detect the expression of many genes
simultaneously. RT2 Profiler PCR Arrays are designed to analyze a panel of genes related
to a disease state or biological pathway. The product is especially suitable for researchers
who are more familiar with or prefer real-time PCR technology but are looking for the multigene profiling capabilities of a microarray.
To complete the PCR Array procedure, start by converting your experimental RNA
samples into first strand cDNA, the template for the polymerase chain reaction, using our
RT2 First Strand Kit. (See Figure 1 for an overview of the PCR Array procedure.) Then, mix
your template with one of our instrument-specific and ready-to-use RT2 qPCR Master
Mixes. Aliquot the mixture into each well of the same plate containing pre-dispensed genespecific primer sets. Perform PCR, and finally, determine relative expression with your
real-time instrument and the ∆∆Ct method.
Each array contains a panel of 96 or 384 primer sets for a thoroughly researched set of 84
or 370 relevant, pathway- or disease-focused genes, plus five housekeeping genes and
three RNA and PCR quality controls. The 96-gene PCR Arrays are available in a 96-well
plate format, a 100-well Rotor-Disc format, and a 384-well plate format, containing either
one or four replicates, respectively, of the 96-primer set panel. (See Figure 2 for the layout
of typical PCR Arrays.) The PCR Array 384HT products (catalog numbers greater than
3000) contain a 370-gene panel in a 384-well plate format. SABiosciences’s qPCR
Assays, Master Mixes, and first strand kit have been optimized hand-in-hand for SYBR®
Green real-time RT-PCR detection, providing the PCR Arrays with superior sensitivity and
wide linear dynamic ranges. The simplicity of the PCR Arrays also makes them accessible
for routine use in every research laboratory.
Benefits of the RT2 Profiler PCR Arrays:
Pathway Focused: Profile the expression of a panel of genes relevant to a pathway or
disease state.
Simple and Accurate: Simple real-time PCR procedure provides high sensitivity and
wide dynamic range.
Designed for Routine Use: Bring expression profiling to any lab with a real-time PCR
instrument.
Combine microarray profiling capabilities with realreal-time PCR performance!
Technical Support:
[email protected]
4
www.SABiosciences.com
Version 5.01
(4x96)
Technical Support:
888.503.3187 (US)
5
301.682.9200
RT2 Profiler™ PCR Arrays
Figure 2C. Layout of the Cataloged Pathway-Focused Rotor-Gene Q Rotor-Disc 100 PCR Array
Figure 2A: Layout of the 96-Gene 96-Well and 384-Well PCR Arrays
Wells A1 through G12 contain a real-time PCR assay for genes from the same biological
pathway or the same disease state or genes that are otherwise functionally-related.
The product information included with each cataloged PCR Array contains a list of the
pathway-focused and housekeeping genes on the array.
Housekeeping Assay Panel: Wells
H1 through H5 contain a housekeeping gene panel to
normalize PCR Array data.
Genomic DNA Controls (GDC): Well H6 contains the Genomic DNA Control (GDC).
Reverse Transcription Controls (RTC): Wells H7 through H9 contain replicate Reverse
Transcription Controls (RTC).
Positive PCR Controls (PPC): Wells H10 through H12 contain replicate Positive PCR Controls
(PPC).
The 384-well (4 x 96) format of the PCR Arrays includes four replicates of the same 96well format, in which each two-by-two set of wells (wells labeled 1 - 4 in gray above)
contains the same primer set represented by the 96-well designations.
Technical Support:
[email protected]
6
www.SABiosciences.com
Version 5.01
Figure 2B: Layout of the PCR Array 384HT
Wells A1 through P10 (1-370) each contain a real-time PCR assay for genes from the
same biological pathway or the same disease state or genes that are otherwise
functionally-related.
The product information included with each cataloged PCR Array contains a list of the
pathway-focused and housekeeping genes on the array.
Housekeeping Assay Panel: Wells P12 through P15 contain a housekeeping gene panel to
normalize PCR Array data.
Genomic DNA Controls (GDC): Wells P16 through P18 contain replicate Genomic DNA
Controls (GDC).
Reverse Transcription Controls (RTC): Wells P19 through P21 contain replicate Reverse
Transcription Controls (RTC).
Positive PCR Controls (PPC): Wells P22 through P24 contain replicate Positive PCR Controls
(PPC).
Figure 2C: Layout of the 100-Well Rotor-Gene Q Rotor-Disc 100 PCR Array
The 96 real-time assays found in the 96-well PCR plate-based arrays are located in wells 1
through 96 of the Rotor-Gene Q ring (plate A1-A12 Ring 1-12, plate B1-B12 Ring 1324, etc.). To maintain data analysis compatibility, wells 97-100 do not contain real-time
assays but will contain master mix to account for weight balance.
RT2 Profiler PCR Array Controls - Definitions
The Genomic DNA Control (GDC) is an assay that specifically detects non-transcribed
genomic DNA contamination with a high level of sensitivity. The Reverse Transcription
Control (RTC) tests the efficiency of the RT2 First Strand Kit (C-03) reaction with a primer
set detecting the template synthesized from the kit’s built-in external RNA control. The
Positive PCR Control (PPC) tests the efficiency of the polymerase chain reaction itself
using a pre-dispensed artificial DNA sequence and the primer set that detects it.
The sets of replicate control wells (GDC, RTC, & PPC) also test for inter-well, intra-plate
consistency.
Custom PCR Arrays have your specified layout, and the product information literature
enclosed with the array reiterates that layout and the genes included.
Technical Support:
888.503.3187 (US)
7
301.682.9200
RT2 Profiler™ PCR Arrays
II. Materials Provided:
The PCR Arrays are available in 8 different plate formats, each tailored to a specific subset
of real-time PCR instruments & associated blocks. Formats A, C, D, and F are 96-well
plates, Formats E & G are 384-well plates, Format R are 100-well discs, and Format H is
96 x 96 Chip compatible.
Format
A
C
D
For Real-Time Instruments
ABI “standard” blocks: 5700, 7000, 7300, 7500, 7700, 7900HT,
ViiA™ 7 (96-well block)
Bio-Rad: iCycler®, iQ5, MyiQ, MyiQ2, Chromo4 (MJ Research)
Eppendorf: MasterCycler® ep RealPlex® 2, 2s, 4, 4s
Stratagene: Mx3005p®, Mx3000p®
Takara: TP-800
ABI: 7500 FAST block, 7900HT FAST block, StepOnePlus™,
ViiA™ 7 FAST block
Bio-Rad: CFX96™, Opticon® and Opticon 2 (MJ Research)
Stratagene: Mx4000®
Plate
96-well
96-well
96-well
E
ABI: 7900HT (384-well block), ViiA™ 7 (384-well block)
Bio-Rad: CFX384™
384-well
F
Roche: LightCycler 480 96-well block
96-well
G
Roche: LightCycler 480 384-well block
384-well
H
Fluidigm BioMark
96x96 Chip
QIAGEN Rotor-Gene Q
100-well
Rotor-Disc
100
R
NOTE: The format of the PCR Array is indicated by the last letter of the catalog number.
Be sure that you have the correct PCR Array format for your instrument before starting the
experiment.
The 96-well Plate and 100-well Disc PCR Arrays (Formats A, C, D, F, and R) are shipped
in sets of 2, 12, or 24, while the 384-well PCR Arrays (Formats E and G) are shipped in
sets of 4. The PCR Array 384HT is shipped in sets of 2, 12, or 24. The PCR Array Plate
Format H is shipped in a Format A plate in solution (on ice).
Each PCR Array shipment includes the arrays and either 12 optical thin-wall 8-cap strips
(Formats A & D), 1 optical adhesive film (Formats C, E, F, and G), or 1 Rotor-Disc heat
sealing film (Format R) per array.
Each 96x4 Format 384-Well PCR Array (Formats E & G) also includes one set of 4 384EZLoad™
Covers (Catalog #PA-384) for each PCR Array provided in the package.
NOTE: Each 384EZLoad™ Cover is for a Single Use ONLY.
Technical Support:
[email protected]
8
www.SABiosciences.com
Version 5.01
Shipping Conditions:
•
•
PCR Arrays in formats A, C, D, E, F, G, and R are shipped at Room Temperature (RT), on
Dry Ice (DI), or Blue Ice (BI) depending on destination & accompanying products.
PCR Arrays in format H are shipped on dry ice or blue ice packs.
Storage Conditions: Keep plates and system components at -20ºC for long-term storage.
When stored properly at -20°C, their quality is gua ranteed for 6 months.
Technical Support:
888.503.3187 (US)
9
301.682.9200
RT2 Profiler™ PCR Arrays
III. Additional Materials Required:
A. RNA Isolation: See Page 15 for specific recommendations.
B. High-quality, nuclease-free H2O. Do NOT USE DEPC H2O.
C. RT2 First Strand Kit (Cat. No. C-03/330401)
MANDATORY for a Complete and Successful Experiment
For Reverse Transcription Control Detection (RTC, Wells H7 through H9)
D. SABiosciences RT2 qPCR Master Mix
MANDATORY for a Complete and Successful Experiment
Be sure to pick the correct one for the instrumentation in your laboratory.
1. 96-Well & 384-Well (96 x 4 Format) Block PCR Arrays
RT2 SYBR Green / ROX qPCR Master Mix: Specifically designed for:
•
•
•
•
ABI 5700,7000, 7300, 7500 (Standard & FAST), 7700, 7900HT 96-well block (Standard
& FAST) and 384-well block, StepOnePlus
Eppendorf Mastercycler ep realplex 2/2S/4/4S
Stratagene Mx3000p, Mx3005p, Mx4000
TaKaRa TP-800
Catalog Number
Size
PA-012/ 330520
For 2 96-well RT2 Profiler PCR Arrays
PA-012-12/ 330522 For 12 96-well RT2 Profiler PCR Arrays
PA-012-24/ 330523 For 24 96-well RT2 Profiler PCR Arrays
PA-012-8/ 330521
For 4 384-well RT2 Profiler PCR Arrays
2
RT SYBR Green / Fluorescein qPCR Master Mix: Specifically designed for:
•
Bio-Rad iCycler, iQ5, MyiQ, MyiQ2
Catalog Number
Size
PA-011/ 330510
For 2 96-well RT2 Profiler PCR Arrays
PA-011-12/ 330512 For 12 96-well RT2 Profiler PCR Arrays
PA-011-24/ 330513 For 24 96-well RT2 Profiler PCR Arrays
PA-011-8/ 330511
For 4 384-well RT2 Profiler PCR Arrays
RT2 SYBR Green qPCR Master Mix: Specifically designed for instrumentation
that does not require a reference dye:
•
•
•
Bio-Rad CFX96, CFX384, Chromo4, Opticon 2
Roche LightCycler 480 (96-well & 384-well)
All Others
Catalog Number
PA-010/ 330500
PA-010-12/ 330502
PA-010-24/ 330503
PA-010-8/ 330501
Size
For 2 96-well RT2 Profiler PCR Arrays
For 12 96-well RT2 Profiler PCR Arrays
For 24 96-well RT2 Profiler PCR Arrays
For 4 384-well RT2 Profiler PCR Arrays
2. 100-Well Ring PCR Array for QIAGEN Rotor-Gene Q 100 (“R” Plate Format:
Rotor-Disc 100)
RT2 FAST SYBR Green / ROX qPCR Master Mix: Specifically designed for:
•
QIAGEN Rotor-Gene Q
Technical Support:
[email protected]
10
www.SABiosciences.com
Version 5.01
Catalog Number
PA-042/ 330620
PA-042-12/ 330622
PA-042-24/ 330623
Size
For 2 100-well RT2 Profiler PCR Arrays
For 12 100-well RT2 Profiler PCR Arrays
For 24 100-well RT2 Profiler PCR Arrays
3. PCR Array 384HT
The PCR Array 384HT two (2), twelve (12), and twenty-four (24) packs (Formats E & G)
require a quantity of two (2) of the correct master mixes for your instrument of the size for
the corresponding 96-well PCR Array packs (2 X PA-01# or 2 X PA-01#-12 or 2 X PA-01#24).
4. Custom PCR Arrays: 330131
Custom PCR Arrays are available in a number of formats, allowing the customer to choose
the number of genes to study and the number of sample replicates that may be needed.
Please select a master mix package size that provides sufficient volume for your samples.
E. Equipment:
1. For recommendations on specific real-time instrumentation (thermal cyclers with
fluorescent detection), see the list of master mixes and plate formats above.
NOTE: The PCR Arrays can only be used in 96-well and 384-well real-time PCR
instruments. PCR Arrays can not be used in the Cepheid SmartCycler® or the Roche
LightCycler 2.0.
2. Calibrated Multi-Channel Pipettor
3. RNase / DNase-free pipette tips and tubes
Technical Support:
888.503.3187 (US)
11
301.682.9200
RT2 Profiler™ PCR Arrays
IV. Complementary Products:
A. RT2 RNA QC PCR Array (Optional):
Pick the correct catalog number for your species of interest (see below) and the
correct plate format for the instrument in your lab. (See table on Page 8.)
Human RT2 RNA QC PCR Array
Mouse RT2 RNA QC PCR Array
Rat RT2 RNA QC PCR Array
Cat. No. PAHS-999 (330291)
Cat. No. PAMM-999 (330291)
Cat. No. PARN-999 (330291)
B. XpressRef™ Universal Total RNA:
Universal RNA to control PCR conditions is available from the following species:
Human XpressRef™ Universal Total RNA
Mouse XpressRef Universal Total RNA
Rat XpressRef Universal Total RNA
Cat. No. GA-004 / 338112
Cat. No. GA-005 / 338114
Cat. No. GA-006 / 338116
C. FFPE/Paraffin Block Applications
a. RNA Extraction Kit: PA-023/330471
b. FFPE PreAMP cDNA Synthesis Kit: C-07/330461
c. FFPE PreAMP Primer Mixes: PFX-####/330151
D. RT2 PCR Array Loading Reservoir: PA-027/338162
Technical Support:
[email protected]
12
www.SABiosciences.com
Version 5.01
V. Protocol:
Please read through this entire protocol before beginning your experiment.
RNA samples are very sensitive to RNase digestion; therefore, wear gloves and maintain
an RNase-free work area while performing this protocol.
NOTE: Master Mix and First Strand Synthesis Considerations
The performance of our RT² Profiler PCR Arrays is only guaranteed with SABiosciences
RT² qPCR Master Mixes and the RT2 First Strand Kit. Therefore, the use of the complete
RT² Profiler PCR Array System is absolutely essential for obtaining accurate real-time
PCR profiling results.
The chemically-modified and tightly controlled HotStart enzyme and other proprietary
chemical components in our RT2 qPCR Master Mixes uniquely provide more accurate
SYBR Green results by preventing the amplification of primer dimers and other nonspecific products. They also help ensure high amplification efficiencies even for those
genes that are the most difficult to amplify. When we test other sources of enzymes with
our PCR Arrays, we frequently see primer dimers and other non-specific products that
confound SYBR Green-based real-time PCR detection. Because each instrument uses a
different reference dye to normalize their optics, be sure that you use the correct master
mix for the instrumentation in your laboratory.
The RT2 First Strand Kit includes a proprietary buffer to eliminate any residual genomic
DNA contamination in your RNA samples before it can be amplified into secondary
products that would otherwise cause false positive signals. The Reverse Transcription
Controls (RTC) on the PCR Array can only be evaluated with the built-in external RNA
control of the RT2 First Strand Kit. These controls do not yield results when used with other
sources of reverse transcriptases or first strand synthesis kits. The buffer components and
the magnesium concentration in our RT2 First Strand Kit are also more compatible with our
PCR master mixes than other enzymes or kits providing the PCR Arrays with maximum
levels of sensitivity with ng to µg amounts of total RNA.
Technical Support:
888.503.3187 (US)
13
301.682.9200
RT2 Profiler™ PCR Arrays
NOTE: Preparing a Workspace Free of DNA Contamination
For accurate and reproducible PCR Array results, it is very important to avoid
contamination of the assay with foreign DNA. Any DNA contamination will artificially inflate
the SYBR Green signal yielding skewed gene expression profiles and false positive
signals. The most common sources of DNA contamination are the products of previous
experiments spread into the air of your working environment. Please follow the
recommendations below on how to set up and maintain a working environment free of
DNA contamination.
1. Wear gloves throughout the procedure. Use only fresh PCR-grade reagents (H20) and
lab ware (tips and tubes).
2. Physically separate the workspaces used for PCR setup and post-PCR processing or
non-PCR operations. Decontaminate your PCR workspace and lab ware (pipettor
barrels, tube racks, etc.) before each new use with UV light to render any
contaminating DNA ineffective in PCR through the formation of thymidine dimers or
with 10% bleach to chemically inactivate and degrade any DNA.
3. Close all tubes containing PCR products once you are finished adding or removing
volumes. Before discarding any lab ware (tips or tubes) containing PCR products or
other DNA, treat with 10% bleach.
4. Do not remove the PCR Array plate from its protective sealed bag until immediately
ready to use. Do not leave lab ware (tubes and tip boxes) exposed to the air for long
periods of time.
5. Do not open any previously run and stored PCR Array plate. Removing the thin-wall 8cap strips or the adhesive film from PCR Arrays releases PCR product DNA into the air
where it will contaminate and confound the results of future real-time PCR experiments.
Technical Support:
[email protected]
14
www.SABiosciences.com
Version 5.01
A. RNA Preparation and Quality Control:
High quality RNA is ESSENTIAL for obtaining good real-time PCR results.
The most important prerequisite for any gene expression analysis experiment is
consistent, high-quality RNA from every experimental sample. Therefore, the sample
handling and RNA isolation procedures are critical to the success of the experiment.
Residual traces of proteins, salts or other contaminants will either degrade the RNA or
decrease the efficiency of (if not block completely) the enzyme activities necessary for
optimal reverse transcription and real-time PCR performance.
1. Recommended RNA Preparation Methods:
High quality total RNA for your real-time PCR experiment must be prepared using one of
the following methods, each specific for your biological sample:
a. Cultured Cells:
Use the Qiagen RNeasy® Mini Kit (Catalog # 74104).
• You must perform the recommended on-column DNase treatment step (RNaseFree DNase Set: 79254).
b. Tissue Samples:
i. First, extract RNA from the tissue using the QIAzol/TRIzol® protocol. Be sure to
use a sufficient amount of QIAzol/TRIzol reagent. During homogenization, add a
volume of reagent at least ten times greater than the tissue volume.
ii. After the ethanol precipitation step, further clean up the RNA using the Qiagen
RNeasy Mini Kit (Catalog # 74104).
• You must perform the recommended on-column DNase treatment step (RNaseFree DNase Set: 79254).
c. Formalin-fixed Paraffin-embedded (FFPE) Samples:
i. Please refer to protocol for SABiosciences RT2 FFPE RNA Extraction Kit
(Catalog # PA-023/330471)
d. Small Samples Yielding Less than 100 ng Total RNA:
i. Please refer to protocol for Molecular Devices® PicoPure® RNA Isolation Kit
(Catalog # KIT0204)
e. Whole Blood Samples:
i. Before RNA preparation, red blood cells (RBC) must be removed from whole
blood samples using a density gradient centrifugation medium (for example,
Lymphoprep®, Greiner Bio-One, Catalog # 1031966).
ii. The white blood cell fraction is then used for RNA isolation with the Qiagen
RNeasy® Mini Kit (Catalog # 74104).
• You must perform the recommended on-column DNase treatment step.
iii. Alternatively, the PAXgene™ Blood RNA Kit (Qiagen, Catalog # 762164) can
also be used to prepare total RNA from whole blood samples.
f. Total RNA Isolated Using a Phenol-Based Method:
If you have already prepared total RNA from any biological source material using
a phenol-based method (such as QIAzol,TRIzol®, RNAzol, etc.), you must clean
up the RNA with the Qiagen RNeasy® Mini Kit (Catalog # 74104).
• You must perform the recommended on-column DNase treatment step (RNaseFree DNase Set: 79254).
Technical Support: 888.503.3187 (US)
301.682.9200
15
RT2 Profiler™ PCR Arrays
g. For Other Biological Samples:
Refer to the existing literature to find isolation protocols for high-quality RNA from
other biological samples or contact one of our Technical Support representatives.
For best results from the PCR Array, all RNA samples should be suspended in the RNasefree water provided with the RNA Isolation kit. DO NOT use DEPC-treated water!
2. RNA Quality Control:
For best results from the PCR Array, all RNA samples should also demonstrate consistent
quality according to the following criteria:
a. RNA Concentration and Purity by UV Spectrophotometry
NOTE: Prepare dilutions and measure absorbance in 10 mM Tris, pH 8.0 buffer. The
spectral properties of nucleic acids are highly dependent on pH.
i) A260:A230 ratio should be greater than 1.7.
ii) A260:A280 ratio should be 1.8 to 2.0.
iii) Concentration by A260 should be greater than 40 µg / ml total RNA
b. Ribosomal RNA band integrity
Electrophorese a fraction of each RNA sample on a denaturing agarose gel or on an
Agilent BioAnalyzer using an RNA 6000 Nano LabChip® and verify that there is a sharp
distinction at the small side of both the 18S and 28S ribosomal RNA (rRNA) bands or
peaks. Any smearing or shoulder to the rRNA bands or peaks indicates that degradation
has occurred in the RNA sample.
A
B
MW RNA
28S
18S
Figure 3: Good Ribosomal RNA Band Integrity Is Important for Optimal PCR Array Results.
Panel A displays an Agilent BioAnalyzer electropherogram of a high-quality total RNA preparation
showing sharp peaks without shoulders (especially to the left of each peak) for the 18S and 28S
ribosomal RNA (left to right). Panel B, right-hand lane, displays an analysis of the same high-quality
total RNA preparation by agarose gel electrophoresis demonstrating sharp bands (especially at the
bottom of each band) for the 28S and 18S ribosomal RNA (top to bottom).
Technical Support:
[email protected]
16
www.SABiosciences.com
Version 5.01
Because some contaminants are difficult to detect by simply looking at RNA integrity and
can be missed by UV spectrophotometry, it is essential to choose the proper RNA isolation
method for your biological sample as described above.
For reliable data from RT2 Profiler PCR Arrays & RT2 qPCR Primer Assays, a RNA
Integrity Number (RIN) of 7 or higher is recommended.
NOTE: Consistent RIN values across multiple samples within each experiment are
desirable for reliable quality data comparisons.
NOTE: Samples with degraded RNA, such as from FFPE blocks/slides, with RINs less
than 7, may be of sufficient quality, but the final PCR Array/ Primer Assay (or gene
expression) data must be checked for quality by the research investigator.
c. The RT2 RNA QC PCR Array (Optional):
The RT2 RNA QC PCR Array and the RT2 First Strand Kit (each sold separately) test
for a number of RNA quality control parameters including:
• High and low housekeeping gene expression levels
• Reverse transcription and polymerase chain reaction efficiency
• Genomic and general DNA contamination
The RNA QC PCR Arrays are particularly useful for researchers who are unsure of
their RNA isolation technique. Follow the recommendations for the use and
interpretation of the RT2 RNA QC PCR Array found in the RT2 RNA QC PCR Array
User Manual.
3. Genomic DNA Contamination:
Eliminating genomic DNA contamination is essential for obtaining optimal real-time
gene expression profiling results using the PCR Array. The Genomic DNA Control in
each PCR Array specifically tests for genomic DNA contamination in each sample
during each run. A GDC threshold cycle value less than 35 indicates the presence of a
detectable amount of genomic DNA contamination that should be addressed.
We highly recommend performing the on-column DNase treatment step in the Qiagen
RNeasy® Mini Kit (Catalog # 74104) followed by using the RT2 First Strand Kit (C-03) to
remove any and all residual contamination from your RNA samples.
i.
Amount Considerations:
The PCR Array System yields results with as little as 25 ng or as much as 5 µg total
RNA per array. The new RT2 Nano PreAMP and RT2 FFPE PreAMP technologies
allow for gene expression analysis from as little as 1 ng of total RNA (or 100 ng RNA
from FFPE samples). Please refer to the corresponding user manuals for additional
information.
The optimal amount of starting material depends on the relative abundance of the
transcripts of interest. Lower abundance transcripts require more RNA; higher
Technical Support:
888.503.3187 (US)
17
301.682.9200
RT2 Profiler™ PCR Arrays
abundance transcripts require less RNA. Greater amounts of input total RNA yield a
greater number of positive calls; that is, genes expressed in the linear dynamic range of
the method. Lower amounts of input total RNA yield a smaller number of positive calls
and increase false negative calls.
The use of the RT2 First Strand Kit (C-03/330401) maximizes the number of positive
calls at low amounts (25 ng) of total RNA over other sources of reverse transcriptase
and first strand synthesis kits. For successful results and maximum positive call rates,
we recommend that first time users try starting with 1.0 µg of total RNA for 96-well plate
format, 0.8 µg of total RNA for 100-well Rotor-Disc format, 400 ng of total RNA for 384well (4 x 96) plate format, and 1.0 ug of total RNA for 384-well HT plate format PCR
Array. It is also important to use a consistent amount of total RNA for all samples in a
single experiment to be characterized and compared.
Technical Support:
[email protected]
18
www.SABiosciences.com
Version 5.01
2
B. RT First Strand Kit: C-03/330401
NOTE: The use of SABiosciences’s RT2 First Strand Kit (Cat. No. C-03/330401) is critical
for detecting the Reverse Transcription Controls (RTC, Wells H7-H9) and for obtaining the
best results from the PCR Array. (See Pages 11 and 15 for more information)
NOTE: RNA samples must meet the standards of integrity and purity from protein,
organics, and genomic DNA contamination described on the previous two pages.
NOTE: Use the same amount of total RNA in this reaction for every sample. First time
users are recommended to start with 1.0 µg of total RNA for 96-well plate format, 0.8 µg of
total RNA for 100-well Rotor-Disc format, 400 ng of total RNA for 384-well (4 x 96) plate
format, and 1.0 ug of total RNA for a 384-well HT plate format PCR Array. Lower amounts
of total RNA than 100 ng will dramatically increase the false negative rate of the PCR
Array method.
NOTE: Scientists using the Fluidigm BioMark Real-Time PCR System: Please refer to
the specification sheet for the “RT2 First Strand Kit – BioMark” (Cat. # C-10/330431) for
first-strand cDNA synthesis protocol and for sample/plate preparation instructions.
NOTE: Do not use DEPC treated H2O. Use high-quality, nuclease-free H2O. If you are
not sure whether your RNase, DNase-free water has been DEPC treated, please check
with the supplier.
NOTE: Carefully pipette reagents from reagent tubes, starting with pipette tip at top of
tube and working down slowly.
1. Briefly (10-15 seconds) spin down all reagents.
2. Prepare the Genomic DNA Elimination Mixture**:
a. For each RNA sample, combine the following in a sterile PCR tube:
Total RNA
GE** (5X gDNA Elimination Buffer)
H2O to a final volume of
25.0 ng to 5.0
2.0
10.0
µg
µl
µl
**The RT2 First Stand Kit (C-03) is not compatible with the chemicals in Ambion’s
DNA-free™ kits. If your RNA sample has been treated with Ambion’s DNA-free™
reagents, please call SABiosciences Technical Support at 1-888-503-3187.
b. Mix the contents gently with a pipettor followed by brief centrifugation.
c. Incubate at 42°C for 5 min.
d. Chill on ice immediately for at least one minute.
3. Prepare the RT Cocktail:
RT Cocktail
BC3 (5X RT Buffer 3)
P2 (Primer & External Control Mix)
RE3 (RT Enzyme Mix 3)
H2O
Final Volume
Technical Support:
1 reaction
4 µl
1 µl
2 µl
3 µl
10 µl
888.503.3187 (US)
19
2 reactions
8 µl
2 µl
4 µl
6 µl
20 µl
301.682.9200
4 reactions
16 µl
4 µl
8 µl
12 µl
40 µl
RT2 Profiler™ PCR Arrays
4. First Strand cDNA Synthesis Reaction:
a. Add 10 µl of RT Cocktail to each 10-µl Genomic DNA Elimination Mixture.
b. Mix well but gently with a pipettor.
c. Incubate at 42°C for exactly 15 min and then immediately stop the reaction by
heating at 95°C for 5 minutes.
d. Add 91 µl of H2O to each 20-µl of cDNA synthesis reaction. Mix well.
e. Hold the finished First Strand cDNA Synthesis Reaction on ice until the next step or
store overnight at -20°C.
5. RNA Quality Control Check (Optional):
If desired, proceed to characterize a small aliquot (6 µl) of the diluted cDNA template
on the correct species-specific and instrument-specific RT2 RNA QC PCR Array
following the instructions provided in its User Manual. Save the remainder at – 20°C.
Technical Support:
[email protected]
20
www.SABiosciences.com
Version 5.01
C. Performing Real-Time PCR
1. 96-well & 384-well Block Formats
NOTE: The use of SABiosciences’s RT2 qPCR Master Mixes is critical for obtaining the
most accurate results from the PCR Array. Be sure to use the correct master mix for your
instrument before continuing with this protocol (See Pages 8 and 9).
NOTE: An incorrectly chosen PCR Array plate format will not properly fit into your real-time
PCR instrument, and its use will damage the instrument. Be sure you have the correct
PCR Array format for your instrument before continuing with this protocol (See Page 7).
NOTE: The accuracy and precision of your pipetting determine the consistency of your
results. Be sure that all of your micro-pipettors are calibrated before beginning this
procedure. Also, make sure to not introduce any bubbles into the wells of the PCR Array.
NOTE: If unsure of your RNA quality or isolation technique, examine the quality of your
RNA before this step using SABiosciences’s species- and instrument-specific RT2 RNA
QC PCR Arrays (See Page 15).
NOTE: Do not use DEPC treated H2O. Use high-quality, nuclease-free H2O. If you are
not sure whether your RNase, DNase-free water has been DEPC treated, please check
with the supplier.
NOTE: If precipitates are present in the Master Mix tubes, please contact a technical
applications scientist at 1-888-503-3187or [email protected] for further
instructions.
NOTE: Carefully pipette reagents from reagent tubes, starting with pipette tip at top of
tube and working down slowly.
1. Briefly (10-15 seconds) spin down all reagents.
2. Experimental Cocktail Preparation (for Custom PCR Arrays & Plate H (BioMark)
PCR Arrays, see NOTES below):
Mix the following components in a 5-ml tube or a multi-channel reservoir:
96-well
384-well (4x96)
Plate Format:
Plate Format Designation: A, C, D, & F
E&G
2X SABiosciences RT2 qPCR Master Mix
1350 µl
550 µl
Diluted First Strand cDNA Synthesis
102 µl
102 µl
Reaction
H2O
1248 µl
448 µl
Total Volume
2700 µl
1100 µl
384HT
E&G
2000 µl
102 µl
1898 µl
4000 µl
NOTE: This recipe provides an excess volume of ONLY ~ 290 µl (for the 96-well format) to
allow for multiple pipetting. Very carefully add the cocktail to the PCR Array precisely as
described below to ensure that each well receives the required volume.
Technical Support:
888.503.3187 (US)
21
301.682.9200
RT2 Profiler™ PCR Arrays
NOTE: If you did not perform RNA quality control with a RT2 RNA QC PCR Array, save the
remainder of 9 µl of the cDNA synthesis reaction at -20°C in case y ou need to perform one
later for troubleshooting purposes.
CUSTOM PCR ARRAY NOTE: Prepare Experimental Cocktail for each sample by
calculating enough of each component based on the PCR Array layout selected. Please
prepare an excess of 10% for pipetting error.
Fluidigm BioMark Format H Plates: Please refer to the RT2 cDNA Synthesis Kit –
BioMark (Cat #C-10/330431) for instructions on how to set up your plates.
3. Loading the PCR Arrays
Please select your PCR Array Format for loading instructions.
NOTE: Change pipet tips following each addition to avoid any cross-contamination
between the wells or reactions.
NOTE: If using robotic instrumentation for loading PCR Arrays, please contact the
SABiosciences Technical Support Team for PCR Array plate specifications.
a. Loading the 96-Well PCR Array Formats A, C, D, or F
i. CAREFULLY remove the PCR Array from its sealed bag.
ii. (Optional): Dispense Experimental Cocktail to RT2 PCR Array Loading
Reservoir (PA-027/338162) to assist in loading.
iii.Add 25 µl of the Experimental Cocktail to each well of the PCR Array, preferably
from a reservoir with an eight-channel pipettor (or a twelve-channel pipettor but
only using eight tips).
iv.Proceed to the next section (STEP 3) on “Performing Real-Time PCR Detection”.
b. Loading the 384-Well PCR Array Formats E or G:
NOTE: Each 384-well plate characterizes four samples in separate sets of 96-wells
staggered from one another by only one well. The spacing between the tips of standard
multi-channel pipettors will allow you to properly skip rows or columns when adding each
sample. Be sure to load each sample into the correct set of wells. Use Figure 4 as a guide.
i. CAREFULLY remove the PCR Array from its sealed bag.
ii. (Optional): Dispense Experimental Cocktail to RT2 PCR Array Loading Reservoir
(PA-027/338162) to assist in loading.
iii. Load sample cocktails to appropriate wells of the PCR Array, preferably from a
reservoir with an eight- channel pipettor (or a twelve-channel pipettor but only
using eight tips), using the provided 384EZLoad™ Covers (Catalog #PA384/338125) and the figure below as a guide.
Technical Support:
[email protected]
22
www.SABiosciences.com
Version 5.01
a. Place Cover #1 (white) on the plate. Add 10 µL of Sample 1 cocktail to the
open wells. (Odd number wells of rows A, C, E, G, I, K, M & O). Remove &
discard the cover.
b. Place Cover #2 (yellow) on the plate. Add 10 µL of Sample 2 cocktail to the
open wells. (Even number wells of rows A, C, E, G, I, K, M & O). Remove &
discard the cover.
c. Place Cover #3 (black) on the plate. Add 10 µL of Sample 3 cocktail to the
open wells. (Odd number wells of rows B, D, F, H, J, L, N & P). Remove &
discard the cover.
d. Place Cover #4 (red) on the plate. Add 10 µL of Sample 4 cocktail to the
open wells. (Even number wells of rows B, D, F, H, J, L, N & P). Remove &
discard the cover.
Sample #1
Sample #2
Sample #3
Sample #4
Figure 4: To load a 384-well format PCR Array, add 10 µl of the Experimental
Cocktail from each numbered sample into the staggered wells with the same
number as indicated in the figure.
ii. Proceed to the next section (STEP 3) on “Performing Real-Time PCR Detection”.
c. Loading the PCR Array 384HT
i. CAREFULLY remove the PCR Array from its sealed bag.
ii. (Optional): Dispense Experimental Cocktail to RT2 PCR Array Loading Reservoir
(PA-027/338162) to assist in loading.
iii. Add 10 µl of the Experimental Cocktail to each well of the PCR Array, preferably
from a reservoir with an 8-channel pipettor (or a 12-channel pipettor but only using 8
tips).
iv. Proceed to the next section (STEP 3) on “Performing Real-Time PCR Detection”.
Technical Support:
888.503.3187 (US)
23
301.682.9200
RT2 Profiler™ PCR Arrays
d. Loading Custom Format PCR Arrays
i. CAREFULLY remove the PCR Array from its sealed bag.
ii. (Optional): Dispense Experimental Cocktail to RT2 PCR Array Loading Reservoir
(PA-027/338162) to assist in loading.
iii. Add each Sample Experimental Cocktail to each well of the PCR Array.
i. 25 µl per well for 96-well Custom PCR Arrays
ii. 10 µl per well for 384-well Custom PCR Arrays.
iv. Proceed to the next section (STEP 4) on “Performing Real-Time PCR Detection”.
4. Performing Real-Time PCR Detection:
ATTENTION Users of Bio-Rad and Eppendorf Real-Time Instruments: Prior to
initiating the run, please make sure your instrument has been calibrated to use clear, flat
optical caps with PCR Array plates.
NOTE: Be sure to follow the manufacturer’s instructions for the proper operation and
maintenance of your real-time instrument.
a. CAREFULLY but tightly seal the PCR Array with the optical thin-wall 8-cap strips
(Formats A and D) or with the optical adhesive film (Formats C, E, F, and G).
b. Centrifuge the plate for 1 full minute at room temperature at 1000 g to remove
bubbles. Visually inspect the plate from underneath of the plate to ensure no
bubbles are present in each well.
NOTE: Bubbles remaining in the bottom of the wells of a PCR Array will
interfere with results.
c. Place the plate on ice while setting up the PCR cycling program below.
d. Place one plate in your real-time thermal cycler. If recommended by your
instrument’s user manual, use a compression pad with the optical film-sealed plate
formats.
NOTE: PCR Arrays containing experimental cocktail may be store at -20°C wrapped in
aluminum foil for up to one week until ready to run.
e. Enter and run the appropriate program for your real-time instrument (below). If
prompted by your instrument software, select “Absolute Quantitation” to begin.
Technical Support:
[email protected]
24
www.SABiosciences.com
Version 5.01
Use a two-step cycling program for the following instrumentation:
ABI: 5700, 7000, 7300, 7500, 7700,
7900HT, StepOnePlus, ViiA 7
Bio-Rad: iCycler, iQ5, MyiQ, MyiQ2,
CFX96*, CFX384*
Eppendorf*: Mastercycler ep realplex 2,
2S, 4, 4S
Stratagene: Mx3000p, Mx3005p, Mx4000p
Cycles
1
Duration
10 minutes1
15 seconds
Temperature
95°C
95°C
40
1 minute2
60°C
*Attention Bio-Rad CFX96 & CFX384 Users:
• Adjust the ramp rate to 1°C/sec.
**Attention Eppendorf Mastercycler ep realplex 2, 2S, 4, and 4S Users:
• For the Silver Thermoblock: Adjust the ramp rate to 26%.
• For the Aluminum Thermoblock: Adjust the ramp rate to 35%.
• Please refer to the Instrument Setup Guide at
http://sabiosciences.com/pcrarrayprotocolfiles.php for detailed setup
instructions.
Use an extended two-step cycling program for the following instrumentation:
Cycles
1
Roche***: LightCycler 480
45
Duration
10 minutes1
15 seconds
1 minute2
Temperature
95°C
95°C
60°C
***Attention Roche LightCycler 480 Users: Adjust the ramp rate to 1°C/sec. Please
refer to the Instrument Setup Guide at
http://sabiosciences.com/pcrarrayprotocolfiles.php for more information on other
REQUIRED changes to settings for Melt Curve Acquisition.
Use a three-step cycling program for the following instrumentation:
Bio-Rad: Opticon, Opticon 2, Chromo 4
(MJ Research)
Takara: TP-800
All other instruments
1
2
3
Cycles
1
40
Duration
10 minutes1
15 seconds
30 to 40
seconds2,3
30 seconds
Temperature
95°C
95°C
55°C
72°C
The 10-minute step at 95°C is required to activate the HotStart DNA polymerase.
Detect and record SYBR Green fluorescence from every well during the annealing step
of each cycle.
Different instruments need different lengths of time to detect the fluorescent signal.
Choose the appropriate time for the annealing step (55°C) for your instrument.
NOTE: For additional help with instrument setup, see our Instrument-Specific Setup
Instructions and Protocol Files at: www.SABiosciences.com/pcrarrayprotocolfiles.php
Technical Support:
888.503.3187 (US)
25
301.682.9200
RT2 Profiler™ PCR Arrays
e. Calculate the threshold cycle (Ct) for each well using the instrument’s software.
NOTE: For Roche LightCycler 480 Users, there are two options available to analyze
your data.
1.
Use the second derivate max setting & there is no need to set a
threshold, OR
2.
Use “Fit Points” and follow instruction ii below.
i.
To define the Baseline, choose the Automated Baseline option if your instrument has
the Adaptive Baseline Function (check with instrument manual or manufacturer, if
unsure). If it does not have the adaptive baseline function, you will need to set the
baseline manually. Use the Linear View of the amplification plots to determine the
earliest visible amplification. Set the instrument to use the readings from cycle number
two (2) through two (2) cycles before the earliest visible amplification, but no more than
cycle 15. The earliest amplifications usually will be visible between cycles 14 and 18.
ii. Manually define the Threshold Value by using the Log View of the amplification plots
and place it above the background signal but within the lower one-third to lower onehalf of the linear phase of the amplification plot.
*IMPORTANT: Ensure that the thresholds are the same across all PCR Array runs
in the same analysis. The absolute position of the threshold is less critical than its
consistent position across arrays. If the RNA sample quality has been adequately
controlled, the cycling program has been executed properly, and the thresholds
have been defined correctly, then the value of CtPPC should be 20 ± 2 across all of
your arrays or samples. If not, see the Troubleshooting and FAQ section.
iii. Export the resulting threshold cycle values for all wells to a blank Excel spreadsheet for
use with the SABiosciences PCR Array Data Analysis Template Excel or Web-based
Utilities.
ii. Excel-based PCR Array Data Analysis Templates available for 96-well,
384-well (4x96), 384HT, and Custom PCR Array formats available at:
1. http://sabiosciences.com/pcrarraydataanalysis.php
iii. Web-based PCR Array Data Analysis Software at:
1. http://sabiosciences.com/pcrarraydataanalysis.php
Technical Support:
[email protected]
26
www.SABiosciences.com
Version 5.01
5. Recommended Quality Control: Dissociation (Melting) Curve
For instrument-specific melt curve analysis settings, please refer to the corresponding
Instrument Setup Guide for your instrument at:
http://sabiosciences.com/pcrarrayprotocolfiles.php
NOTE: If you decide not to obtain the dissociation curve immediately, save the plates
wrapped in aluminum foil at -20°C as is, in case yo u need to perform this operation at a
later point in time for troubleshooting purposes. When ready, simply warm the plate to
room temperature, place it into your real-time instrument, and run the melting program
described above.
NOTE: Be sure to visually inspect the plate after the run for any signs of evaporation from
any of the wells. If evaporation is observed, make a note of which wells so that you may
qualify your data analysis appropriately.
NOTE: DO NOT open any previously run and stored PCR Array plate. Removing the thinwall 8-cap strips or the adhesive film from PCR Arrays releases PCR product DNA into the
air where it will contaminate and confound the results of future real-time PCR experiments.
See also the Note on “Preparing a Workspace Free of DNA Contamination”.
General Protocol:
Run a melting curve program immediately after the above cycling program, and generate a
first derivative dissociation curve for each well in the entire plate using your instrument’s
software. No more than one peak should appear in each reaction at temperatures greater
than 80°C. If your instrument does not have a defau lt melting curve program, run the
following program instead:
95°C, 1 min; 65°C, 2 min (OPTICS OFF); 65°C to 95°C
Technical Support:
888.503.3187 (US)
27
at 2°C / min (OPTICS ON).
301.682.9200
RT2 Profiler™ PCR Arrays
2. 100-well “R” Format PCR Array on Rotor-Disc 100 for
Rotor-Gene Q
NOTE: The use of SABiosciences’s RT2 FAST qPCR Master Mixes is critical for obtaining
the most accurate results from the PCR Array. Be sure to use the correct master mix for
your instrument before continuing with this protocol (See Pages 8 and 9).
NOTE: The accuracy and precision of your pipetting determine the consistency of your
results. Be sure that all of your micro-pipettors are calibrated before beginning this
procedure. Also, make sure to not introduce any bubbles into the wells of the PCR Array.
NOTE: If unsure of your RNA quality or isolation technique, examine the quality of your
RNA before this step using SABiosciences’s species- and instrument-specific RT2 RNA
QC PCR Arrays (See Page 15).
NOTE: Do not use DEPC treated H2O. Use high-quality, nuclease-free H2O. If you are
not sure whether your RNase, DNase-free water has been DEPC treated, please check
with the supplier.
NOTE: If precipitates are present in the Master Mix tubes, please contact a technical
applications scientist at 1-888-503-3187or [email protected] for further
instructions.
NOTE: Carefully pipette reagents from reagent tubes, starting with pipette tip at top of
tube and working down slowly.
1. Briefly (10-15 seconds) spin down all reagents.
2. Experimental Cocktail Preparation
Mix the following components in a 5-ml tube:
Array Format:
Array Format Designation:
2X SABiosciences RT2 Fast SYBR Green/Rox PCR Master Mix
Diluted First Strand cDNA Synthesis Reaction
H2O
Total Volume
100-well
R
1150 µl
102 µl
1048 µl
2300 µl
NOTE: This recipe provides an excess volume of ONLY ~300 µl (for the 100-well R
format). Very carefully add the cocktail to the PCR Array precisely as described below to
ensure that each well receives the required volume.
NOTE: If you did not perform RNA quality control with a RT2 RNA QC PCR Array, save the
remainder of 9 µl of the cDNA synthesis reaction at -20°C in case y ou need to perform one
later for troubleshooting purposes.
Technical Support:
[email protected]
28
www.SABiosciences.com
Version 5.01
3. Loading the Rotor-Gene Q Rotor-Disc 100 PCR Array
NOTE: Change pipet tips following each addition to avoid any cross-contamination
between the wells or reactions.
a. CAREFULLY remove the PCR Array from its sealed bag and slide the array into
the Rotor-Disc 100 loading block using the tab at position A1 and the tube guide
holes.
b. Manually dispense 20 µl of the Experimental Cocktail into wells 1 through 100 of
the PCR Array (although wells 97-100 do not contain assays, their loading is
essential for optimized balancing of the Rotor-Gene Q 100 PCR array).
Alternatively, manual additional of the Experimental Cocktail can be avoided by
using the QIAgility, a compact benchtop instrument that provides rapid, highprecision PCR setup (please contact a technical applications scientist at 1-888-5033187or [email protected] for further information).
c. Proceed to the next section (STEP 4) on “Performing Real-Time PCR Detection
using the Rotor-Gene Q”.
4. Performing Real-Time PCR Detection using the Rotor-Gene Q:
NOTE: Be sure to follow the manufacturer’s instructions for the proper operation and
maintenance of your real-time instrument.
f. CAREFULLY seal the Rotor-Gene Q 100 PCR Array with the Rotor-Disc heat
sealing film using the Rotor-Disc heat sealer. Allow one minute to pass, and remove
excess sealing film.
g. Insert Rotor-Gene Q 100 PCR Array into Rotor-Disc 100 rotor. Subsequently attach
the Rotor-Disc 100 locking ring.
h. Insert loaded rotor with attached locking ring into Rotor-Gene Q real-time PCR
machine.
NOTE: PCR Arrays containing experimental cocktail may be store at -20°C wrapped in
aluminum foil for up to one week until ready to run.
i.
Enter and run the appropriate program (below).
QIAGEN: Rotor-Gene Q 100
Cycles
1
40
1
2
Duration
10 minutes1
10 seconds
30 seconds2
Temperature
95°C
95°C
60°C
The 10-minute step at 95°C is required to activate the HotStart DNA polymerase.
Detect and record SYBR Green fluorescence from every well during the annealing step
of each cycle.
NOTE: For additional help with instrument setup, see our Instrument-Specific Setup
Instructions and Protocol Files at: www.SABiosciences.com/pcrarrayprotocolfiles.php
Technical Support:
888.503.3187 (US)
29
301.682.9200
RT2 Profiler™ PCR Arrays
f. Calculate the threshold cycle (Ct) for each well using the instrument’s software.
*NOTE: For more details on data analysis parameters specific for the Rotor-Gene
Q, please consult the Rotor-Gene Q Manual.
iv. To define the Baseline:
a. Select Dynamic Tube (default analysis setting) to ensure the average
background of each well is determined just before amplification commences.
b. Optional) Select Ignore First. Fluorescent signal from the initial cycles may
not be representative of the remainder of the run. Thus, better results may be
achieved if the initial cycles are ignored. Up to 5 cycles can be ignored.
c. (Optional) Select Noise Slope Correction. Selection of this option can
improve data whose baseline (initial cycles) is noticeably sloped. Noise Slope
Correction improves the data when raw data backgrounds are observed to
slope upward or downward before the takeoff point (Ct).
*IMPORTANT: Ensure that all selections remain consistent across all PCR Array
runs in the same analysis.
v. Manually define the Threshold Value by using the Log View of the amplification plots
and place it above the background signal but within the lower one-third to lower onehalf of the linear phase of the amplification plot.
*IMPORTANT: Ensure that the thresholds are the same across all PCR Array runs
in the same analysis. The absolute position of the threshold is less critical than its
consistent position across arrays. If the RNA sample quality has been adequately
controlled, the cycling program has been executed properly, and the thresholds
have been defined correctly, then the value of CtPPC should be 14 ± 2 across all of
your arrays or samples. If not, see the Troubleshooting and FAQ section.
vi. Export the resulting threshold cycle values for all wells to a blank Excel spreadsheet for
use with the SABiosciences PCR Array Data Analysis Template Excel or Web-based
Utilities.
i. Excel-based PCR Array Data Analysis Templates available for 96-well,
384-well (4x96), 384HT, Rotor-Gene Q, and Custom PCR Array formats
available at:
1. http://sabiosciences.com/pcrarraydataanalysis.php
ii. Web-based PCR Array Data Analysis Software at:
1. http://sabiosciences.com/pcrarraydataanalysis.php
Technical Support:
[email protected]
30
www.SABiosciences.com
Version 5.01
5. Recommended Quality Control: Dissociation (Melting) Curve
For Rotor-Gene Q melt curve analysis settings, please refer to the corresponding
Instrument Setup Guide for your instrument at:
http://sabiosciences.com/pcrarrayprotocolfiles.php
NOTE: Be sure to visually inspect the Rotor-Gene Q Ring after the run for any signs of
evaporation from any of the wells. If evaporation is observed, make a note of which wells
so that you may qualify your data analysis appropriately.
NOTE: DO NOT open any previously run and stored PCR Array rings. Removing the
adhesive film from PCR Arrays releases PCR product DNA into the air where it will
contaminate and confound the results of future real-time PCR experiments.
See also the Note on “Preparing a Workspace Free of DNA Contamination”.
General Protocol:
Run a melting curve program immediately after the above cycling program, and generate a
first derivative dissociation curve for each well in the entire plate using your instrument’s
software. Melt curve analysis can be added during creation of the Rotor-Gene Q qPCR
program. No more than one peak should appear in each reaction.
Technical Support:
888.503.3187 (US)
31
301.682.9200
RT2 Profiler™ PCR Arrays
D. Data Analysis: ∆∆Ct Method
1. For 96-well & 384-well Formats
PCR Array Data Analysis Web Portal (Excel & Web-based Utilities)
Access our free PCR Array Data Analysis Web Portal from the following address:
http://www.SABiosciences.com/pcrarraydataanalysis.php
The PCR Array Data Analysis Web Portal automatically performs the following calculations
and interpretation of the control wells upon including threshold cycle data from a real-time
instrument. The PCR Array Data Analysis Web Portal presents the results in a tabular
format, a scatter plot, a three-dimensional profile, and a volcano plot (when replicates are
included).
1. Change all Ct values reported as greater than 35 or as N/A (not detected) to 35. At
this point, any Ct value equal to 35 is considered a negative call.
2. Examine the threshold cycle values of the control wells.
a. Genomic DNA Control (GDC):
i. Calculate CtGDC.
ii. If the value is greater than 35, then the level of genomic DNA contamination is
too low to affect gene expression profiling results. No action is needed.
iii. If the value is less than 35, then genomic DNA contamination is evident. See the
Troubleshooting and FAQ section.
b. Reverse Transcription Control (RTC):
Any impurities in your RNA sample that affect the reverse transcription of the RT2
First Strand Kit’s built-in external RNA control also affect the reverse transcription of
your messages of interest.
i. Calculate ∆Ct = AVG CtRTC – AVG CtPPC.
ii. If this value is less than 5, then no inhibition is apparent.
iii. If this value is greater than 5, then evidence of impurities that inhibited the
reverse transcription phase of the procedure is evident. See the Troubleshooting
and FAQ section.
NOTE: For RT2 Nano PreAMP and RT2 FFPE PreAMP Users
Please refer to corresponding user manuals for correct settings and GDC, PPC, and RTC
values.
Technical Support:
[email protected]
32
www.SABiosciences.com
Version 5.01
c. Positive PCR Control (PPC):
Any impurities in your RNA sample that affect the PCR amplification of the positive
control also affect the PCR amplification for your messages of interest.
The average CtPPC value should be 20 ± 2 on each PCR Array and should not
vary by more than two cycles between PCR Arrays being compared.
ii. Larger differences in average CtPPC values between samples indicate the
presence of different amounts of PCR amplification inhibitors in each sample
and that all of the RNA samples require further purification.
iii. An average value of CtPPC that is consistently greater than 22 for all of your
samples may indicate a problem with the cycling conditions or may simply be
indicative of the relative sensitivity of your instrument. See the Troubleshooting
and FAQ section.
i.
3. Calculate the ∆Ct for each pathway-focused gene in each plate.
∆Ct = CtGOI –CtAVG HKG
NOTE: Choosing the right normalization factor
The expression level of the housekeeping genes chosen for normalization in the ∆∆Ct
method must not be influenced by your experimental conditions. If one or more such genes
have been previously identified by independent means and if the PCR Array reproduces
those results, use the average of their Ct values in the equation above. If an appropriate
housekeeping gene has not been previously identified, use the average Ct value of all
housekeeping genes. Or, simply use zero (0) in the place of the average of HK genes’ Ct
for each group to be compared, and rely on the consistency in the quantity and quality of
your original input total RNA across your groups to effectively normalize your results.
4. When biological and/or technical replicates are performed, calculate the average ∆Ct
value of each gene (each well) across those replicate arrays for each treatment
group.
5. Calculate the ∆∆Ct for each gene across two PCR Arrays (or groups).
∆∆Ct = ∆Ct (group 2) - ∆Ct (group 1)
Where group 1 is the control and group 2 is the experimental
6. Calculate the fold-change for each gene from group 1 to group 2 as 2 ^ (-∆∆Ct).
OPTIONAL: If the fold-change is greater than 1, then the result may be reported as a fold
up-regulation. If the fold-change is less than 1, then the negative inverse of the result may
be reported as a fold down-regulation. The fold-change ratios may also be reported as is.
(Optional) Go From Fold Change to Biology in Minutes with the New GeneWeb Tool
– Go to http://geneweb.sabiosciences.com
Technical Support:
888.503.3187 (US)
33
301.682.9200
RT2 Profiler™ PCR Arrays
2. For 100-well “R” Format PCR Array on Rotor-Disc 100 for
Rotor-Gene Q
PCR Array Data Analysis Web Portal (Excel & Web-based Utilities)
Access our free PCR Array Data Analysis Web Portal from the following address:
http://www.SABiosciences.com/pcrarraydataanalysis.php
The PCR Array Data Analysis Web Portal automatically performs the following calculations
and interpretation of the control wells upon including threshold cycle data from a real-time
instrument. The PCR Array Data Analysis Web Portal presents the results in a tabular
format, a scatter plot, a three-dimensional profile, and a volcano plot (when replicates are
included).
1. Change all Ct values reported as greater than 33 or as N/A (not detected) to 33. At
this point, any Ct value equal to 33 is considered a negative call.
2. Examine the threshold cycle values of the control wells.
d. Genomic DNA Control (GDC):
i. Calculate CtGDC.
ii. If the value is greater than 33, then the level of genomic DNA contamination is
too low to affect gene expression profiling results. No action is needed.
iii. If the value is less than 33, then genomic DNA contamination is evident. See the
Troubleshooting and FAQ section.
e. Reverse Transcription Control (RTC):
Any impurities in your RNA sample that affect the reverse transcription of the RT2
First Strand Kit’s built-in external RNA control also affect the reverse transcription of
your messages of interest.
i. Calculate ∆Ct = AVG CtRTC – AVG CtPPC.
ii. If this value is less than 5, then no inhibition is apparent.
iv. If this value is greater than 5, then evidence of impurities that inhibited the
reverse transcription phase of the procedure is evident. See the Troubleshooting
and FAQ section.
Technical Support:
[email protected]
34
www.SABiosciences.com
Version 5.01
f. Positive PCR Control (PPC):
Any impurities in your RNA sample that affect the PCR amplification of the positive
control also affect the PCR amplification for your messages of interest.
The average CtPPC value should be 14 ± 2 on each PCR Array and should not
vary by more than two cycles between PCR Arrays being compared.
ii. Larger differences in average CtPPC values between samples indicate the
presence of different amounts of PCR amplification inhibitors in each sample
and that all of the RNA samples require further purification.
iii. An average value of CtPPC that is consistently greater than 16 for all of your
samples may indicate a problem with the cycling conditions or may simply be
indicative of the relative sensitivity of your instrument. See the Troubleshooting
and FAQ section.
i.
3. Calculate the ∆Ct for each pathway-focused gene in each plate.
∆Ct = CtGOI –CtAVG HKG
NOTE: Choosing the right normalization factor
The expression level of the housekeeping genes chosen for normalization in the ∆∆Ct
method must not be influenced by your experimental conditions. If one or more such genes
have been previously identified by independent means and if the PCR Array reproduces
those results, use the average of their Ct values in the equation above. If an appropriate
housekeeping gene has not been previously identified, use the average Ct value of all
housekeeping genes. Or, simply use zero (0) in the place of the average of HK genes’ Ct
for each group to be compared, and rely on the consistency in the quantity and quality of
your original input total RNA across your groups to effectively normalize your results.
4. When biological and/or technical replicates are performed, calculate the average ∆Ct
value of each gene (each well) across those replicate arrays for each treatment
group.
5. Calculate the ∆∆Ct for each gene across two PCR Arrays (or groups).
∆∆Ct = ∆Ct (group 2) - ∆Ct (group 1)
Where group 1 is the control and group 2 is the experimental
6. Calculate the fold-change for each gene from group 1 to group 2 as 2 ^ (-∆∆Ct).
Technical Support:
888.503.3187 (US)
35
301.682.9200
RT2 Profiler™ PCR Arrays
NOTE: Detailed Mathematical Explanation of ∆∆C
∆∆ t Data Analysis Method
Due to the inverse proportional relationship between the threshold cycle (Ct) and the
original gene expression level, and the doubling of the amount of product with every cycle,
the original expression level (L) for each gene of interest is expressed as:
To normalize the expression level of a gene of interest (GOI) to a housekeeping gene
(HKG), the expression levels of the two genes are divided:
To determine fold change in gene expression, the normalized expression of the GOI in the
experimental sample is divided by the normalized expression of the same GOI in the
control sample:
The complete calculation is as follows:
Technical Support:
[email protected]
36
www.SABiosciences.com
Version 5.01
VI. Troubleshooting and FAQs
A. Troubleshooting:
1. Removal of Genomic DNA Contamination:
You must perform the on-column DNase treatment step included in the protocol of
Qiagen’s RNeasy Mini Kit (Catalog # 74104). You must also then use SABiosciences’s
RT2 First Strand Kit (C-03/330401) with its genomic DNA elimination step.
If the genomic DNA contamination proves difficult to remove, fold-changes in gene
expression may still be obtained. However, it will then be very important to validate any
results for individual genes by a separate more rigorous real-time PCR analysis that
includes a “minus RT” control.
Apparent genomic DNA contamination may also indicate evidence of more general DNA
contamination of other reagents, tips, and tubes. See the Note about Preparing a
Workspace Free of DNA Contamination at the beginning of the protocol in this User
Manual. The No Template Control (NTC) in the RT2 RNA QC PCR Array provides a sense
of how well your technique minimizes the introduction of general DNA contamination into
your assay system.
2. Improving Poor Reverse Transcription Efficiency:
Double-check the A260:A280 and A260:A230 ratios of your RNA samples and be sure to
perform the dilutions for spectrophotometry in RNase-free Tris pH 8.0 buffer. If necessary,
re-purify your RNA samples with a spin-column based clean up method, such as Qiagen’s
RNeasy Mini Kit (Catalog # 74104), with the subsequent RNase-Free DNase Set: 79254.
3. Improving Poor PCR Amplification Efficiency:
Different instruments have different levels of sensitivity. If an average CtPPC value of 20 ± 2
is difficult to obtain for your instrument, the observed average CtPPC value should be
acceptable as long as it does not vary by more than two cycles between PCR Arrays being
compared.
Be sure that the initial heat activation step at 95°C had been lengthened to 10 minutes
from the shorter time in the default program. Be sure that all other cycle parameters also
have been correctly entered according to the recommendations in this User Manual. Also,
double check the quality of your RNA as described in “Evidence of Poor Reverse
Transcription Efficiency” above.
Technical Support:
888.503.3187 (US)
37
301.682.9200
RT2 Profiler™ PCR Arrays
B. Frequently Asked Questions:
1. Will pipetting error affect the PCR Array results?
The passive reference dyes in the master mixes, such as ROX and Fluorescein, are used
by the real-time PCR systems to normalize variation from well to well. Therefore, these
systems tolerate volume variations caused by pipetting error and evaporation.
2. How can I prevent the evaporation of reaction volume from the wells?
Be sure to carefully and completely seal the PCR Array with the optical thin-wall 8-cap
strips or the optical adhesive film before placing it into your thermal cycler. Also, be sure to
use a compression pad with the plate formats using the optical film seal (Formats C, E, F
and G) as directed by the manufacturer of your real-time PCR instrument.
3. How reliable are the results from the RT2 Profiler PCR Array?
Assuming the use of good, consistent experimental technique, real-time PCR methods
such as the PCR Array provide very reproducible results. To insure the reliability of your
results and to reliably detect smaller fold changes in gene expression from the PCR Array,
the performance of replicate determinations (such as biological triplicates) is highly
recommended. The Data Analysis Template available from our website for the PCR Array
uses your replicate PCR Array data to calculate t-test p values and to generate a “Volcano
Plot” illustrating the statistically significant fold-changes in gene expression.
4. Can I use cDNA synthesized from a first-strand kit from another manufacturer?
If your cDNA template is not synthesized using an SABiosciences RT2 First Strand Kit,
cDNA from 500 ng to 5 µg total RNA may be used.
If the cDNA synthesis reaction volume was:
o 20 µl or more, add H2O to the synthesized cDNA to increase the volume to 111
µl, and proceed as directed in Section B, Step 4e.
o less than 20 µl, add H2O to the synthesized cDNA to increase the volume to 20
µl and proceed as directed in Section B, Step 4d.
5. Do I need to prepare my reactions or pre-mix on ice?
You can prepare your reactions at room temperature. Since the SABiosciences RT2
Master Mixes include a Hot-Start DNA Polymerase that is active only upon heat activation,
you can be assured that no non-specific amplification results will be produced.
If you have additional questions, please check our website
(www.SABiosciences.com) for a more complete listing of Frequently Asked
Questions (FAQs), or call our Technical Support Representatives at 1-888-503-3187
or 301-682-9200.
Technical Support:
[email protected]
38
www.SABiosciences.com
Version 5.01
Appendix: Modified Protocol for Housekeeping
Gene PCR Arrays
A. First Strand cDNA Synthesis
Perform a first strand cDNA synthesis reaction for each sample to be characterized on
the array including one sample representing your biological or experimental control.
B. Perform Real-Time PCR:
1. Experimental Cocktail Preparation:
Mix the following components in a 1-ml tube or a multi-channel reservoir:
2X SABiosciences RT2 qPCR Master Mix
337.5 µl
Diluted first strand cDNA synthesis reaction
27 µl
H2O
310.5 µl
Total volume
675 µl
2. Adding samples to PCR Array:
NOTE: Organize your sample loading onto the arrays very carefully making sure to
characterize each sample in duplicate and to include a replicate of the control sample on
each plate. For example, up to four samples can be characterized in duplicate on a single
array or duplicate determinations may be made on two separate arrays for larger numbers
of samples.
Samples
Housekeeping Genes
A
B
C
D
E
F
G
H
1
G1
G1
G1
G1
G1
G1
G1
G1
2
G2
G2
G2
G2
G2
G2
G2
G2
3
G3
G3
G3
G3
G3
G3
G3
G3
4
G4
G4
G4
G4
G4
G4
G4
G4
5
G5
G5
G5
G5
G5
G5
G5
G5
6
G6
G6
G6
G6
G6
G6
G6
G6
7
G7
G7
G7
G7
G7
G7
G7
G7
8
G8
G8
G8
G8
G8
G8
G8
G8
9
G9
G9
G9
G9
G9
G9
G9
G9
10
G10
G10
G10
G10
G10
G10
G10
G10
11
G11
G11
G11
G11
G11
G11
G11
G11
12
G12
G12
G12
G12
G12
G12
G12
G12
Figure 5: Layout of the Housekeeping Genes PCR Arrays.
C. Data Analysis by the ∆Ct Method
1. For each sample, average the duplicate determinations of the Ct values from each
sample for each housekeeping gene.
2. For each housekeeping gene, calculate the ∆Ct, or, in other words, the difference
between the gene’s Ct value in each experimental sample and the same gene’s Ct
value in the control sample.
Technical Support:
888.503.3187 (US)
39
301.682.9200
RT2 Profiler™ PCR Arrays
3. Choose the housekeeping genes with the smallest ∆Ct value across the samples of
interest to normalize the results of your future RT-PCR experiments for input total
RNA loading. More than one housekeeping gene may be chosen for your analyses.
Simply monitor the expression of all of these housekeeping genes, and use their
average Ct value as the normalization factor for each sample.
Technical Support:
[email protected]
40
www.SABiosciences.com
Version 5.01
RT2 Profiler™ PCR Arrays
NOTICE TO PURCHASERS
•
This product is intended for research purposes only and is not intended for drug or diagnostic purposes or for human use. Use of
kit components for reproduction of any primer pair mix, to modify kit components for resale or to use RT2Profiler PCR Arrays to
manufacture commercial products without written approval of SABiosciences Corporation is expressly prohibited.
PRODUCT WARRANTY
•
This warranty limits our liability to the replacement of this product in the event the product fails to perform due to any manufacturing
defect. SABiosciences Corporation makes no other warranties of any kind, expressed or implied, including without limitation,
warranties of merchantability or fitness for a particular purpose. SABiosciences Corporation shall not be liable for any direct,
indirect, consequential or incidental damages arising out of the use, the results of use or the inability to use this product.
LIMITED LICENSE STATEMENTS
•
Use of this product is covered by one of more of the following US patents and corresponding patent claims outside the US:
5,079,352, 5,789,224, 5,618,711, 6,127,155, 5,677,152 (claims 1 to 23 only), 5,773,258 (claims 1 and 6 only), 5,407,800,
5,322,770, 5,310,652, 5,994,056, 6,171,785, and claims outside the US corresponding to US Patent No. 4,889,818. The purchase
of this product includes a limited, non-transferable immunity from suit under the foregoing patent claims for using only this amount
of product for the purchaser’s own internal research. No right under any other patent claim (such as apparatus or system claims in
US Patent No. 6,814,934) and no right to perform commercial services of any kind, including without limitation reporting the results
of purchaser’s activities for a fee or other commercial consideration, is conveyed expressly, by implication, or by estoppel. This
product is for research use only. Diagnostic uses under Roche patents require a separate license from Roche. Further information
on purchasing licenses may be obtained by contacting the Director of Licensing, Applied Biosystems, 850 Lincoln Centre Drive,
Foster City, California 94404, USA.
•
This product is provided under an agreement between Molecular Probes, Inc. and SABiosciences and the manufacture, use, sale,
or import of this product is subject to one or more of U.S. Patent Nos. 5,436,134; 5,658,751 and corresponding international
equivalents, owned by Invitrogen Corp. The purchase of this product conveys to the buyer the non-transferable right to use the
purchased amount of the product and components of the product in research conducted by the buyer, where such research does
not include testing, analysis or screening services for any third party in return for compensation on a per test basis. The buyer
cannot sell or otherwise transfer (a) this product (b) its components or (c) materials made using this product or its components to a
third party or otherwise use this product or its components or materials made using this product or its components for Commercial
Purposes. Commercial Purposes means any activity by a party for consideration and may include, but is not limited to: (1) use of
the product or its components in manufacturing; (2) use of the product or its components to provide a service, information, or data;
(3) use of the product of its components for therapeutic, diagnostic or prophylactic purposes; or (4) resale of the product or its
components, whether or not such product or its components are resold for use in research. For information on purchasing a
license to this product for purposes other than research, contact Molecular Probes, Inc., Business Development, 29851 Willow
Creek Road, Eugene, OR 97402 Tel: (541) 465-8300, Fax: (541) 335-0504.
•
The purchase of this product includes a limited, non-transferable license under specific claims of U.S. Patent Nos. 6,174,670,
6,569,627 and 5,871,908, owned by the University of Utah Research Foundation or Evotec Biosystems GmbH and licensed to
Idaho Technology, Inc. and Roche Diagnostics GmbH, to use only the enclosed amount of product according to the specified
protocols. No right is conveyed, expressly, by implication, or by estoppel, to use any instrument or system under any claim of U.S.
Patent Nos. 6,174,670, 6,569,627 and 5,871,908, other than for the amount of product contained herein.
•
Patent Pending.
TRADEMARKS
•
RT2 Profiler PCR Array, RT2 Real-Time, RT2 Nano PreAMP, RT2 FFPE PreAMP, XpressRef, 384EZLoad, SABiosciences, and the
SA logo are trademarks of SABiosciences Corporation. ABI, ROX, StepOnePlus, and ViiA 7 are registered trademarks of Applera
Corporation. Opticon 2, Chromo4, iQ5, iCycler, CFX96, CFX384, and MyiQ are registered trademarks of Bio-Rad Laboratories, Inc.
LabChip is a registered trademark of Caliper Life Sciences. LightCycler is a registered trademark of Roche Applied Sciences.
SmartCycler is a registered trademark of Cepheid. SYBR is a registered trademark of Molecular Probes. TRIzol is a registered
trademark of Invitrogen. Mastercycler is a registered trademark of Eppendorf. Mx3000P, Mx3005P, and Mx4000 are registered
trademarks of Stratagene. RNeasy is a registered trademark of Qiagen N.V.
Technical Support:
888.503.3187 (US)
41
301.682.9200
RT2 Profiler™ PCR Arrays
NOTES
Technical Support:
[email protected]
42
www.SABiosciences.com
Version 5.01
NOTES
Technical Support:
888.503.3187 (US)
43
301.682.9200
2
™
RT Profiler PCR Array User Manual
Part #1022A
Version 5.01
1062756: 7/1/2010
9/16/2010