1
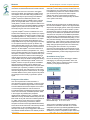
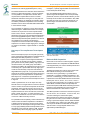
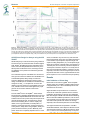
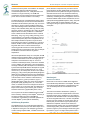
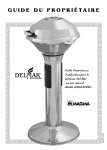
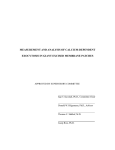
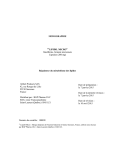
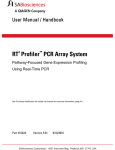
Methods
Nuclear Receptor Signaling | The Open Access Journal of the Nuclear Receptor Signaling Atlas
Quantitative real-time PCR protocol for analysis
of nuclear receptor signaling pathways
Angie L. Bookout and David J. Mangelsdorf
Corresponding Author: [email protected]
Howard Hughes Medical Institute, Department of Pharmacology, University of Texas Southwestern Medical Center, Dallas, TX, USA
A major goal of the Nuclear Receptor Signaling Atlas (NURSA) is to elucidate the biochemical and physiological
roles of nuclear receptors in vivo. Characterizing the tissue expression pattern of individual receptors and
their target genes in whole animals under various pharmacological conditions and genotypes is an essential
component of this aim. Here we describe a high-throughput quantitative, real-time, reverse-transcription PCR
(QPCR) method for the measurement of both the relative level of expression of a particular transcript in a
given tissue or cell type, and the relative change in expression of a particular transcript after pharmacologic
or genotypic manipulation.This method is provided as a standardized protocol for those in the nuclear receptor
field. It is meant to be a simplified, easy to use protocol for the rapid, high-throughput measurement of
transcript levels in a large number of samples. A subsequent report will provide validated primer and probe
sequence information for the entire mouse and human nuclear receptor superfamily.
Received Novemeber 4th, 2003; Accepted December 12th, 2003; Published December 23rd, 2003 | Abbreviations: GAPDH: Glyceraldehyde
3-phosphate dehydrogenase; GOI: Gene of interest; GSRP: Gene-specific reverse primer; PCR: polymerase chain reaction; QPCR: Quantitative
real-time PCR; Tm: Amplicon melting temperature | Copyright © 2003, Bookout and Mangelsdorf. This is an open-access article distributed under the
terms of the Creative Commons Non-Commercial Attribution License, which permits unrestricted non-commercial use distribution and reproduction in
any medium, provided the original work is properly cited.
Cite this article: Nuclear Receptor Signaling (2003) 1, e012
Introduction
Characterizing the tissue expression pattern of individual
receptors and their target genes in whole animals under
various pharmacological conditions and genotypes is one
of the aims of the Nuclear Receptor Signaling Atlas
(NURSA). Here we describe a high-throughput
quantitative, real-time, reverse-transcription PCR (QPCR)
method for the measurement of both the relative level of
expression of a particular transcript in a given tissue or
cell type, and the relative change in expression of a
particular transcript after pharmacologic or genotypic
manipulation.
#N808-007, and 0.08µg/µl random hexamers from Roche
Molecular Biochemicals, cat. #1034731.
QPCR Assay
384-well Optical Reaction Plate are obtained from ABI
®
(cat. #4309849). Sybr Green PCR MasterMix is obtained
from Sigma (St. Louis, MO; cat. #S4438). 8-well PCR
tube-strips are obtained from CLP, San Diego, CA; cat.
#3426.8A) and the optical adhesive cover from ABI (cat.
#4313663 or 4311971).
Methods
SYBR® Green I versus TaqMan® -based Assays
Reagents and Instruments
Thermal cycler
Although several instruments are now available, we chose
to use the Applied Biosystems (ABI, Foster City, CA)
7900HT instrument because of its high-throughput
capacity, its potential for use with robotics, and its
relatively widespread availability in the field. The 7900HT
is a rapid cycling instrument, with a single run lasting
approximately 2 hours. The instrument allows the use of
either 96-well or 384-well plates. The protocols employed
herein use the 384-well format.The instrument also allows
for the addition of a robotic plate loader arm, which
enables unattended operation throughout the day.
RNA and cDNA preparation
RNA STAT-60 was obtained from Tel-Test, Inc.,
Friendswood, TX; cat. #CS-502). RNase-free DNase I
was obtained from Roche Molecular Biochemicals,
Indianapolis, IN; cat. #776785. 1X First Strand Buffer,
10mM DTT and SuperScript RTII reverse transcriptase,
were obtained as a kit from Invitrogen, Carlsbad, CA, cat.
#18064-014. 2mM dNTPs were obtained from ABI, cat.
www.nursa.org
There are two types of fluorescence monitoring
®
chemistries available for use on the ABI 7900HT, SYBR
®
Green, and TaqMan [Applied Biosystems, 2003]. The
®
first employs the DNA-intercalating dye, SYBR Green I
as the reporter fluorophore. It works like ethidium bromide
by binding double-stranded DNA, which is the product of
the PCR. As the reaction cycle progresses, the instrument
monitors and records the increase in fluorescence over
®
time. The SYBR Green assay only requires a validated
primer pair in addition to the regular PCR components.
®
The TaqMan chemistry utilizes FRET (fluorescence
resonance energy transfer) technology. It requires the
use of an additional type of primer, called a probe, which
is labeled with a fluorescent reporter dye on its 5′ end
and a 3′ quencher dye. While the probe is still intact, the
5′ and the 3′ dyes are in close proximity, and the
fluorescent signal is quenched via FRET. As the PCR
product is synthesized, the probe, which sits on a specific
sequence in a region between the forward and reverse
primers, is cleaved by the nuclease activity of the Taq
polymerase. As the 5′ reporter dye is released, it
continuously fluoresces. One probe is cleaved for every
NRS | 2003 | Vol. 1 | DOI: 10.1621/nrs.01012 | Page 1 of 7
Methods
Q-PCR analysis of nuclear receptor expression
PCR product made during the reaction, and the machine
records the concomitant fluorescence increase over time.
There are pros and cons to each of the chemistries
®
employed for QPCR. One advantage of SYBR Green
®
over TaqMan is that the initial assay preparation only
requires a few days for primer design and validation.
®
TaqMan requires the additional synthesis of the
dual-labeled probe after the validation of the potential
®
primer set using SYBR Green. The probe synthesis
usually takes 2-3 weeks, and is expensive relative to the
cost of the primers. The increasing availability of validated
®
TaqMan primer-probe sets from several vendors may
eventually bring the costs of this method down.
®
In general, TaqMan has been considered to be more
sensitive when detecting low copy numbers (<10 copies)
because of its ability to resolve the signal of a single copy
of template [Wittwer et al., 1997]. However, in most cases
the sensitivity of the instrument is limited to >10 copies
of template due to stochastic effects [Morrison et al.,
®
1998]. SYBR Green may have a slight edge in sensitivity
at >10 copies because the reporter dye binds to any
double-stranded DNA present in the reaction, and does
not require a probe-cleavage event for the fluorescence
®
detection, as does TaqMan . The result is detection of
the PCR product at earlier cycles [Wittwer et al., 1997].
This is especially important in the case of low-abundance
transcripts (>10 copies), where the number of PCR cycles
required for fluorescence detection above background
®
might be beyond the range of cycles in the TaqMan , but
®
not the SYBR assay. The double-stranded DNA binding
®
property is also a disadvantage of SYBR Green over
®
TaqMan because non-specific products and mRNAs
with high sequence identity may be detected. One
®
additional advantage of TaqMan is that the probe offers
an added layer of specificity in addition to the forward
and reverse primers. The probe sequence must exactly
match the target sequence to which it binds, as a single
nucleotide difference in the probe sequence will prevent
the cleavage event necessary to generate a reporter
signal.
level among tissues and treatment conditions (also
observed in northern blots). However, because of its very
high expression, the concentration of starting template
in a QPCR assay must be low, and the detection of the
gene of interest may be lost at the lower template
quantity. The choice of the endogenous reference,
therefore, should be determined empirically and based
on the system under study.
Primers
Perhaps the most important factor of QPCR analysis is
the choice and validation of primers. The oligonucleotide
sequences must be highly specific, which may be difficult
when dealing with isoforms or splice-variants. A primer
set that has been used in conventional, end-point analysis
PCR may not be sufficient for quantitative measurements.
The primer set must pass a set of validation parameters,
as described later. One drawback of QPCR over northern
analysis is that QPCR cannot detect the quality (i.e., the
size) of an RNA message, the number of differently sized
messages (e.g., splice-variants), or their expression levels
relative to each other. One way around this problem is to
design sub-type-specific primer sets, but unfortunately
this strategy still does not result in any information
concerning the overall quality of the transcripts. For this
reason, it is worth investing the time to confirm the quality
of the template RNA by northern analysis against a known
transcript.
Quantitative Assay Types
Each of the following sections describes the detailed
®
methodology for performing both SYBR Green and
®
TaqMan assays. Figure 1 depicts the order of events
necessary to employ these techniques.
Endogenous Normalizer
One of the experimental controls included in a
gene-expression assay is the loading, or internal control.
It is used to normalize the signal value of each sample
so that the differences between samples are the result
of a real biological difference and not because of
inconsistent loading. Housekeeping genes are the typical
choice due to their mostly consistent expression levels
in all cell types. Glyceraldehyde 3-phosphate
dehydrogenase (GAPDH), β-actin, cyclophilin, and 18S
rRNA are commonly used. Both GAPDH and β-actin have
been shown to vary with numerous conditions [Suzuki et
al., 2000], and are not the best choice. Cyclophilin
expression is equal among most tissues, with the
exception of heart and muscle (unpublished observation).
These tissues show lower levels of the transcript relative
to other tissues, so the normalized values for the
transcript under study may be exaggerated. 18S may be
the preferred standard because of its relatively invariant
www.nursa.org
Figure 1. Typical work-flow for designing and implementing
Real-Time PCR assays. See text for more details
There are three quantitative methods: the absolute
standard curve, the relative standard curve, and the
comparative cycle time (Ct) methods [Applied Biosystems,
2003]. Herein, we describe methods for the relative
standard curve and the comparative Ct (also called ΔCt)
NRS | 2003 | Vol. 1 | DOI: 10.1621/nrs.01012 | Page 2 of 7
Methods
methods. For discussion concerning the absolute
standard curve method [Applied Biosystems, 1997].
The relative standard curve method is used to assess the
amount of a particular transcript in a group of samples.
It is comparable to a multiple-tissue northern blot. It
requires that a template dilution series of a cDNA
standard be included for each gene on each plate. For
relative quantitation, the template concentration values
are arbitrary. Quantities interpolated from the resulting
standard curve are used to calculate relative mRNA levels
in each unknown sample.
Q-PCR analysis of nuclear receptor expression
containing a polyA sequence will be amplified, and
incomplete, or partially degraded RNA will not be detected
in the subsequent QPCR assay.
Use of the GSRP appears attractive at first, since a
specific target will be amplified. This can be potentially
problematic, however, because the RT efficiency of each
transcript has to be taken into consideration. Also, RNA
secondary structure may prevent the efficient RT of a
specific target, and would also have to be taken into
consideration.
The comparative Ct method (or ΔCt) is used to assess
relative changes in mRNA levels between two samples,
and does not require the use of the template dilution
series. It does, however, require that the amplification
efficiencies of the genes to be compared (described later)
be the same [Applied Biosystems, 1997]. Cycle times,
rather than interpolated template quantities, are used for
the calculations. An example of employing the
comparative Ct method would be the comparison of the
expression of a nuclear receptor target gene in wild-type
vs. receptor-null animals, or ligand-treated vs. untreated
animals.
One-step vs. Two-step Reverse Transcriptase
PCR
Reverse transcription (RT) is the enzymatic process by
which complementary DNA (cDNA) is synthesized by an
RNA-dependent DNA polymerase, i.e. reverse
transcriptase. It requires a small oligonucleotide DNA
primer. There are several types of primers, including
gene-specific reverse primers (GSRP), oligo-(d)Ts, and
random hexamers, also called p(dn)6. The GSRP is
specific to the cDNA to be synthesized, and may be used
to selectively RT a specific RNA transcript. Oligo-(d)Ts
consist of short stretches of thymines and selectively
+
target RNAs with a polyA tail, or any polyA tract. Random
hexamers are mixtures of 6 base-pair primers with varying
sequences. They randomly bind their complementary
RNA sequences. A schematic representation of the
various types of priming for reverse transcription is shown
in Figure 2.
cDNA is synthesized in one or two steps. One-step
RT-PCR is done in a single reaction in which the reaction
mixture contains the reverse transcriptase and the PCR
polymerase. Here, both the RT primer and one of the
PCR primers is a GSRP. Two-step RT-PCR involves two
separate reactions for the RT and the PCR, and the RT
primer is either oligo-(d)Ts, or random hexamers. The
RT reaction is carried out at 42°C to reduce or inhibit the
occurrence of RNA secondary structure.
For quantitative RT-PCR (QPCR), random hexamers are
used to ensure the efficient amplification of all RNAs in
a sample. Because the primer sequences are random
and, therefore, can bind anywhere along the RNA, there
is a very high probability that all transcripts will be reverse
transcribed at near 100% RT efficiency (ABI, personal
communication). When using oligo-(d)Ts, only RNAs
www.nursa.org
Figure 2. Representation of RNA priming for reverse transcription.
See text for more details
RNA and cDNA Preparation
Please refer to the sections “Q-PCR supplies, reagents
and stock solutions” and “Preparation of cDNA Standards”
in the Supplementary File 1 for the detailed protocols and
worksheets for this section.
Total RNA is prepared from cells or frozen tissues with
RNA STAT-60 according to the manufacturer′s
instructions. For a typical assay, 4µg of total RNA is
treated with a 1:5 dilution of RNase-free DNase I in the
presence of 4.2mM MgCl2 in a final volume of 20µl. This
is performed in 0.2ml thin-walled PCR tubes in a standard
thermocycler at 37°C, 30 min., 75°C, 10 min., and 4°C
hold. The reverse-transcription mix consisting of 1X First
Strand Buffer, 10mM DTT, 200U of SuperScript RTII
reverse transcriptase, 2mM dNTPs and 0.08µg/µl random
hexamers is then added directly to the tubes with the
DNAse-treated RNA for a final volume of 100µl.
The cDNA synthesis is carried-out in the thermocycler at
25°C for 10 min., 42°C for 50 min., 72°C for 10 min., and
4°C hold. Following the reverse-transcription,
DEPC-treated H2O is added to the unknown samples to
bring the volume to 200µl, and the cDNA concentration
to 20ng/µl. (Note that samples used as cDNA standards
are not diluted prior to making the 5-fold dilution series
used in primer validation and standard curve assays.)
This will result in enough template cDNA to test
approximately 40 QPCR targets.
NRS | 2003 | Vol. 1 | DOI: 10.1621/nrs.01012 | Page 3 of 7
Methods
Q-PCR analysis of nuclear receptor expression
Figure 3. Primer set validation. (a) Example of a valid primer set for mouse LXR- α using SYBR® Green. The presence of a single peak in the
dissociation curve and the -3.3 slope and 0.99 R2 value of the standard curve plot are indicative of a good set of primers. (b) Example of an invalid
primer set for mouse HSD due to the amplification of non-specific products, as indicated by the presence of multiple peaks in the dissociation curve.
This may be an effect of non-specific priming or primer dimerization. Note that the slope of the standard curve plot (-3.2) is within the acceptable range
of a valid primer set, but the dissociation curve renders this set of primers unacceptable. (c) Example of an invalid primer set for mouse PNR due to
poor amplification. Note the unacceptable slope (-2.28) in the standard curve plot, and the presence of multiple peaks in the dissociation curve.
QPCR Primer Design for Assays using the ABI
7900HT
QPCR assays rely on a set of universal cycling conditions.
The thermocycle, as well as the buffer conditions (MgCl2,
salts, dNTPs, Taq DNA polymerase) will always be the
same. One of the few parameters that does vary is the
QPCR primer set. Because of this, the design and the
pre-validation of the primers are essential to generate
reliable data.
The nucleotide sequence and mRNA exon structure for
each gene of interest are obtained from the NCBI Locus
Link database [NCBI, 2003]. Ideally, the reference
sequence (RefSeq) is obtained and used for primer
design. If a RefSeq is not available, the GeneBank entry
that gives an “NM_” or “complete cds” is used. If the
mRNA to genomic alignment is not available from Locus
Link, a BLAST search of the mRNA against the proper
genome can be used to determine intron/exon
boundaries.
®
®
For both SYBR Green and TaqMan -based assays,
Primer Express™ Software (Applied Biosystems) is used
®
to design the TaqMan MGB Probe and Primer sets. The
software returns a list of primer and probe sequences as
matched primer/probe sets, and primers are chosen
based on their binding sites. In order to amplify only
mRNA, and not genomic DNA, the PCR product, or
amplicon, should span the intron junction between two
®
exons [Ambion, 2001]. When using TaqMan , ideally, the
probe should sit across the junction. Minimally, each
primer should sit in completely separate exons. In some
www.nursa.org
cases, the software may not return any sets that meet
these criteria initially. In this case, two design parameters
in the software may be adjusted, amplicon length and
amplicon melting temperature (Tm). The amplicon length
should be a minimum of 50 base-pairs, and maximum of
150 base-pairs, and if necessary, should be adjusted in
10 base-pair increments. Amplicon Tm′s usually start at
85C and can be adjusted upward to a maximum of 95C,
especially in the case of GC-rich target sequences. Once
the primers have been chosen, a general BLAST of each
primer sequence is run to ensure their unique specificity.
Results
Initial Validation of Primer Sets
®
Please refer to the sections “SYBR Green Template
®
Titration Assay” and “TaqMan Template Titration Assay”
in Supplementary File 1 for the detailed protocols and
worksheets for this section.
Oligonucleotides are purchased from a commercial
vendor at the small-scale synthesis with the minimum
purification. We purchase our primers from Integrated
DNA Technologies at 25nM scale with standard desalting.
We have found that additional purification, such as HPLC,
is not necessary and only adds to the cost of each primer.
The small-scale synthesis also adds to the savings,
especially in the case that the primers do not work initially.
The oligonucleotides are resuspended to 100µM in
sterile-filtered ddH2O, and an aliquot is diluted to 2.5µM.
The forward and reverse 2.5µM primers are then mixed
at a 1:1 ratio for use in subsequent assays. In the past,
NRS | 2003 | Vol. 1 | DOI: 10.1621/nrs.01012 | Page 4 of 7
Methods
Q-PCR analysis of nuclear receptor expression
matrix tests, in which several combinations of different
forward and reverse primer concentrations are assayed,
were used to determine optimal final primer
concentrations [Morrison et al., 1998]. We have found
that this is no longer necessary, as 150nM final
concentration each of forward and reverse primers has
proven to be a universal condition in our assays.
To validate the primers, a template titration assay is done.
For human transcripts, we use the Universal Reference
Total RNA from BD Clontech (Palo Alto, CA). For mouse
transcripts, a mixture of equal quantities of RNA from
each of the following tissues is used: adrenal, whole brain,
embryo, heart, intestine, kidney, liver, lung, muscle, ovary,
pancreas, placenta, macrophage, skin, testis, and white
adipose tissue. The assay consists of a 5-fold dilution
series of cDNA reverse-transcribed from the universal
RNA (50ng, 10ng, 2ng, 0.4ng, 0.08ng, 0.016ng), and 2
control samples: a no template control (NTC), and a no
reverse transcriptase (-RT) control. Amplification of the
NTC sample indicates the presence of primer-dimer
formed during the reaction. The difference in cycle time
between the NTC and the experimental samples must
be greater than seven to ensure that the assay is
monitoring specific fluorescence of the experimental
sample (personal communication, ABI). The -RT sample
is included to confirm the absence of genomic
amplification.
After the template titration assay run is complete, the ABI
7900HT instrument software, SDS2.1, will plot a standard
curve and a dissociation curve for each target gene. A
valid primer set should have a slope of –3.3 and a
correlation coefficient (R2-value) >0.95 for the standard
curve. In addition, the dissociation curve should appear
as a single “stacked” peak at the amplicon Tm determined
by the Primer ExpressTM software. Examples of a typical
standard curve plot for a valid primer set (e.g., using
mouse LXR-α), an invalid primer set due to non-specific
priming (e.g., using mouse hydroxysteroid dehydrogenase
[HSD]), and an invalid primer set due to poor amplification
(e.g., using mouse PNR) are shown in Figure 3.The slope
of the standard curve is indicative of PCR efficiency
(formula 1, Figure 4), given by formula 2, Figure 4
[Applied Biosystems, 2001]. The slope can be affected
by template quality, pipetting errors, etc., and for this
reason, a standard curve for the endogenous reference
gene is always run on the same plate. The difference in
slopes of the reference gene and the gene of interest
should be less than 0.1 [Applied Biosystems, 1997].
®
Once a primer set has been validated using the SYBR
®
Green chemistry, switching to the TaqMan chemistry is
as simple as adding the probe at 250nM final
concentration, and switching to the buffer optimized for
®
use with TaqMan probes (ABI cat. #4324018).
QPCR Assay Preparation
The QPCR assay is run in a 384-well Optical Reaction
Plate with 10µl final volume per well. Each sample is run
in triplicate for each gene to be assayed. The reaction
®
consists of 25ng template cDNA, 1X SYBR Green PCR
www.nursa.org
MasterMix and 150nM each of forward and reverse
primer. Reaction components are pre-mixed in 8-well
PCR tube-strips and then pipetted with a multi-channel
pipette into the reaction plate. Premixing the components
decreases the amount of user-introduced variation by
ensuring a homogeneous mix of template and primers,
and also by minimizing the number of pipettes, which can
introduce bubbles and/or aerosol contaminants, into the
optical plate itself [Applied Biosystems, 2001]. The plate
is then covered with an optical adhesive cover and
centrifuged to bring the liquid to the bottom of the wells
of the plate.
Figure 4. Formulas for Q-PCR calculations See text for more details.
Data Analysis
Standard Curve Method
®
Please refer to the sections “SYBR Green Standard
®
Curve QPCR Assay Worksheet” and “TaqMan Standard
Curve QPCR Assay Worksheet” in Supplementary File
1 for the detailed protocols and worksheets for this
section.
The instrument software calculates the quantity of
transcript in each unknown sample based on the linear
regression formula of the standard curve, and data are
exported as a tab-delimited text file. Further data analyses
are done using Microsoft Excel, or another comparable
program. For each sample, the quantity of the gene of
interest (GOI) and the reference gene (reference) are
determined in triplicate, and from these values, the
average transcript quantity (avg), the standard deviation
of the average (stdev), and the coefficient of variation
(formula 3, Figure 4) of the average is determined, given
by formula 4, Figure 4. A single outlier point that has a
NRS | 2003 | Vol. 1 | DOI: 10.1621/nrs.01012 | Page 5 of 7
Methods
Q-PCR analysis of nuclear receptor expression
value >17%CV may be removed from the calculations.
To determine the mRNA level in each unknown sample,
the gene of interest is normalized to the reference gene,
e.g. 18S rRNA, to account for cDNA loading differences
and calculated using formula 5, Figure 4. The resulting
normalized values are plotted as a bar graph ± the
standard deviation (formula 6, Figure 4), given by formula
7, Figure 4. An example of LXR- α expression in 38
mouse tissues is shown in Figure 5.
Figure 5. Expression profile for mouse LXR- α generated using the
standard curve method. The relative levels of the mRNA transcript
are shown (S.D. (from triplicate readings). 18S rRNA was used as the
normalizer gene so that the level of LXR- α may be compared between
tissue types.
Comparative Ct, or ΔΔCt Method
Please refer to the sections “SYBR Green ΔΔCt QPCR
®
Assay Worksheet” and “TaqMan ΔΔCt QPCR Assay
Worksheet” in Supplementary File 1 for the detailed
protocols and worksheets for this section.
®
For each of the 3 replicates of a sample, the average
cycle time (Ct), the standard deviation (stdev), and the
coefficient of variation (formula 3, Figure 4) is calculated,
given by formula 4, Figure 4. Outlier points >4%CV are
removed from the calculations. For each sample, the
average Ct of the GOI (avg. CtGOI) is normalized to the
average Ct of the reference gene (avg. Ctref) for the same
sample to calculate the normalized Ct for the GOI (formula
8, Figure 4) using formula 9, Figure 4. The standard
deviation of the ΔCt is calculated using formula 10, Figure
4. The calibrator is chosen to be the sample, the tissue,
the gene, or the control group to which the others will be
compared. For example, in an experiment in which
wild-type mice are compared to knockout mice, the
calibrator would be the wild-type mouse sample. The
ΔΔCT, or calibrated value, for each sample is given by
formula 11, Figure 4. The stdev ΔΔCt is the same as stdev
ΔCt. The fold-induction for each sample relative to the
(-ΔΔCt)
calibrator = 2
. The resulting induction values are
usually plotted as a bar graph. The measure of
experimental error is the standard deviation of the mean
(stdevfold change ), given by formula 12, Figure 4. If there
are multiple samples in multiple treatment groups, the
average the fold induction for each group is plotted. The
biological variance is the standard error of the mean,
given by formula 13, Figure 4. An example is shown in
Figure 6, where the induction of SREBP-1c expression
is compared between wild-type mice fed control vehicle
or one of a number of typical nuclear receptor ligands.
www.nursa.org
Figure 6. Typical experiment in which wild-type male mice were
treated with several different nuclear receptor agonists. The relative
changes in mRNA expression for known receptor target genes, in this
case SREBP-1c, an LXR target gene, were measured using the
comparative Ct method. (a) SREBP-1c expression plotted for each of the
animals (S.D. Each color represents a different experimental group (n=4
animals). (b) SREBP-1c expression plotted as averages of the fold
changes for the 4 animals in each treatment group shown in (a) (SEM.
Note that the SREBP-1c transcript increases relative to control (VEH) in
the animals treated with an RXR agonist (LG268), an LXR agonist (T1317),
or both LG269 and T1317 together (T+LG). Note that ligands for PPARα (fenofibrate), PPAR- γ (troglitazone), FXR (CDCA), PXR (PCN), and
CAR (TCPOBOB) have no effect on the level of the SREBP-1c message
relative to control.
Discussion
Here, we have described a simple to use, yet effective
real time QPCR methodology. The protocols and the
worksheets provided are intended to introduce and
standardize the assay for researchers in the nuclear
receptor field, but may be applied to any field of study. In
a subsequent publication, a complete set of QPCR
®
primers and TaqMan probes for all mouse and human
nuclear receptors will be reported.
Supplementary Material
Supplementary File 1: Q-PCR Protocols and
Worksheets.
Acknowledgements
We thank all current and former lab members for invaluable critique and
discussions concerning the development of these techniques, in addition
to the labor involved with the animal studies. We also thank Applied
Biosystems for the technical support. Any questions or suggestions
concerning the downloadable materials are encouraged and should be
addressed to Angie Bookout at [email protected]. DJM is
an investigator of the Howard Hughes Medical Institute. This work was
funded in part by the NIH NURSA grant number NIDDK: U19DK62434.
References
Ambion. (2001) The Top 10 Most common quantitative PCR pitfalls
Technotes Newsletter 8.
http://www.ambion.com/techlib/basics/rtpcr/topten.html
Applied Biosystems. (1997) Relative Quantitation Of Gene Expression:
ABI PRISM 7700 Sequence Detection System: User Bulletin #2: Rev B
( Applied Biosystems)
Applied Biosystems. (2001) ABI Prism 7900HT User Manual
NRS | 2003 | Vol. 1 | DOI: 10.1621/nrs.01012 | Page 6 of 7
Methods
Q-PCR analysis of nuclear receptor expression
Applied Biosystems. (2003) Essentials of Real Time PCR
http://docs.appliedbiosystems.com/pebiodocs/00105622.pdf
Morrison, T. B., Weis, J. J. and Wittwer, C. T. (1998) Quantification of
low-copy transcripts by continuous SYBR Green I monitoring during
amplification Biotechniques 24, 954-8.
NCBI. (2003) Locus Link http://www.ncbi.nlm.nih.gov/LocusLink
Suzuki, T., Higgins, P. J. and Crawford, D. R. (2000) Control selection
for RNA quantitation Biotechniques 29, 332-7.
Wittwer, C. T., Herrmann, M. G., Moss, A. A. and Rasmussen, R. P.
(1997) Continuous fluorescence monitoring of rapid cycle DNA
amplification Biotechniques 22, 130-1.
www.nursa.org
NRS | 2003 | Vol. 1 | DOI: 10.1621/nrs.01012 | Page 7 of 7