1
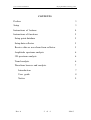
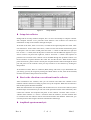
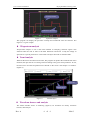
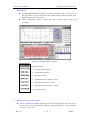
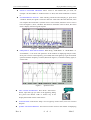
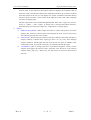
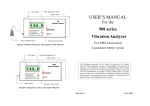
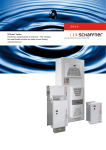
User’s manual of MCMe2.0
Beijing SENDIG Technology LTD.
BEIJING SENDIG TECHNOLOGY, LTD.
USER’S MANUAL
For the
MCMe2.0
The information that provided in this Manual is believed to be reliable.
However, Sendig Technology assumes no responsibility for inaccuracies or
omissions. Sendig Technology assumes no responsibility for the use of this
information, and all use of such information shall be entirely at the user's
own risk. Specifications are subject to change without notice. No patent
rights or licences to any of the functions described are implied or granted to
any third party. Sendig Technology does not authorise or warrant any Sendig
Technology product for use in life support devices or systems.
E-mail:
[email protected], [email protected]
Fax: +86 10 82895320
Telephone: +86 10 82895321,
+86 10 82895320
Address: International Science and Technology ChuangYe Garden, ShangDi, Beijing, P. R. China,
Post code: 100085
Rev. A
1 of 9
2006-3
User’s manual of MCMe2.0
Beijing SENDIG Technology LTD.
CONTENTS
Preface
3
Setup
3
Instructions of buttons
4
Instructions of functions
5
Setup point database
5
Setup data collector
5
Receive data or waveform from collector
5
Amplitude spectrum analysis
6
3D spectrum analysis
6
Trend analysis
6
Waveform browse and analysis
7
Introduction
7
User guide
8
Notice
9
Rev. A
2 of 9
2006-3
User’s manual of MCMe2.0
Beijing SENDIG Technology LTD.
MCMe 2.0 operation manual
Preface
Sendig-900 is a series of instrument that used for condition monitoring and faults diagnosis of
machinery. Shortly after its born, it gains the consumers’ trust because of its powerful function
and convenient operation.
This program provides a variety of tools and technologies to make your manipulation of
Sendig-900 even easier and more efficient. It constructs a database system to store and
manage the vibration information that collected from spots, which solved successfully the
matter of memory lack. Powerful graphics display and data processing function can show the
vibration waveforms and spectrum that stored in the files. Through calling the fault diagnosis
expert system, it can instruct the causes of faults and means of maintenance.
Setup
1.
2.
Install
All the program components of MCMe2.0 software are compressed into a folder named
MCMe2.0, which has an executable file (Setup.exe) and several cab files. MCMe2.0 folder
can be found in the root directory of CD-ROM. It contains reference database,
communicating program, diagnosis expert system (if it is ordered) and so on.
The following steps are to install this software.
Firstly, insert the CD into CD-ROM. Then enter its root directory and find the MCMe2.0
folder, enter it.
Secondly, double click setup.exe file. And then follow step by step the indication displayed
on the screen.
If the installation accomplished, a shortcut icon that named mcme2.0 will appear on the
desktop. Double click it and will run the program.
Uninstall
It is recommended that move the software from your computer by running uninstall program
from control panel. If the software is corrupted, it is necessary to remove the software firstly
before you reinstall it. Otherwise, the software may not work normally.
Instructions of buttons
The main form is showed as figure-1. On the top of main form, there is a toolbar that has
several buttons. The functions of these buttons are introduced as followings.
Rev. A
3 of 9
2006-3
User’s manual of MCMe2.0
Beijing SENDIG Technology LTD.
Figure-1
Main form
Setup the point database
Transfer the parameters to collector
Receive the signal of vibration transferred from the collector
Receive the signal of waveform.
Manage the vibration database.
Plot the 3D spectrum.
Waveform browse.
Call the fault diagnosis system.
View the help file.
Quit from the system.
Introductions of functions
Setup point database
This program provides a database that manages the points and machines of plants. You can
setup all the points of the machines that need to be monitored. And, if it is needed, print it in
the form of report. Its interface is showed as Figure-2.
Rev. A
4 of 9
2006-3
User’s manual of MCMe2.0
Beijing SENDIG Technology LTD.
Figure-2
Setup database
Setup data collector
Sendig-900 can be setup without computer, but it is more conveniently to setup the collector
with computer because of its powerful visual function. This software can transfer the
information of setup to the collector through serial port.
At the left of the form, there is a text box, in which all the registered plants are listed. Click
one and select it. In the center of the form, a center text box lists all the measurement points
of this plant. You can select wanted points and click “>” button to add them into right text
box. If click “>>” button, then all the points of center box will be added into right box. If you
want to remove one point from right box, select it and click “<” button. The sequence of
point that are to transfer to the collector can be modified through the “up/down” buttons. All
the five buttons are placed between the center box and the left box. When all the needed
points are fixed on, please connect correctly the computer and the collector through the serial
port and power on the collector. Then you may transfer it to the collector by clicking the
Setup button.
At the bottom of form, there are 3 buttons (Redo, Setup, and Close). If you dissatisfied with
your setting, you may do it again by clicking the “Redo” button. At last, when all are finished,
click the close button and quit from the window.
Receive the vibration or waveform from the collector
After transferred to the collector, then you can measure and collect the vibration of the
machine with the collector according to points set by the computer. What must be noticed is
that all these points should be measured.
When the measurement was completed, and the data also were saved in the collector (about
the detail steps of measurement you can refer to the operation manual of the instrument), then
connect the collector and computer and power on the collector. Click the menu “receive /
vibration from collector” or “receive / waveform from the collector”, and the vibration data
or waveform from the collector will be received and stored in the database. Afterwards, you
can analysis these data using the functions introduced as followings.
Amplitude spectrum analysis
Rev. A
5 of 9
2006-3
User’s manual of MCMe2.0
Beijing SENDIG Technology LTD.
Actual spectrum
Reference spectrum
Figure-3
Spectrum analysis
This program can display the spectrum envelope that transferred from the collector. The
Figure-3 is a given sample.
3D spectrum analysis
3D-spectrum analysis is one of the main methods of analyzing vibration signals. This
software takes the time or date as the third dimension and shows vividly the change of
spectrum in a special period. So it can be used to analyze the trend of vibration faults.
Trend analysis
When all the factors are taken into account, this program can predict the remainder life of the
machine, then plot the curve of change trend according to the given alarm parameter. At last,
the trend curve and the life predicted are showed on the screen. The sample is as follows.
(Figure-4)
Alarm line
Trend curve
Measure result
Figure-4
Trend analysis
Waveform browse and analysis
The whole interface shows as following (figure-5). Its functions are mainly waveform
browser, data analysis.
Rev. A
6 of 9
2006-3
User’s manual of MCMe2.0
1.
Beijing SENDIG Technology LTD.
Introduction:
WAVEFORM BROWSER: Display waveforms of all data listed in the list box on
the right bottom of the screen. Show their Collection Time, REVS, Signal Type,
Signal Characteristic Value and etc.
DATA ANALYSIS: Analyze original data; find machines faults quickly and
accurately.
Figure-5
Waveform browser interface
Analysis methods:
Auto-correlation analysis
Time-domain diagnosis
Waveform analysis
Amplitude spectrum analysis / zoom
Power spectrum analysis / zoom
Logarithm spectrum analysis / zoom
Cepstrum analysis.
2.
Waveform browser’s user guide:
SELECT DATA FILE: Before analyzing waveform, firstly input data file. You can use
mouse cursor to select a data file by pointing its name in the list box . It can be selected
with “up”/ “down” keys.
Rev. A
7 of 9
2006-3
User’s manual of MCMe2.0
Beijing SENDIG Technology LTD.
SELECT ANALYSIS METHOD: Move cursor to the method that you want, for
example “AUTO-CORR” or “WAVE-ANAL” or other, then click left button to confirm
it.
SET REFERENCE SIGNAL: After selecting a data file and analyzing it, press down
<Set-Ref> button, the signal is saved for reference. Then select the other data file, users
can compare this result with it (current curve’s color is black, reference curve’s color is
blue. See Figure-6). Now, <Set-Ref> has turned to <Del-Ref>. Press it down, the screen
doesn’t display reference signal anymore
. Figure-6 Reference and current spectrum
FREQUENCY SPECTRUM ZOOM: When doing “AMP-SPEC” or “POW-SPEC” or
“LOG-SPEC”, it can zoom into spectrum. In the window of displaying analysis result,
firstly move cursor to the frequency you wanted, then click right key to get the zoomed
spectrum with the frequency as midst (showed as Figure-7). If click the left key again, it
will be back.
Figure-7
Spectrum zoom
FILE NAME FILTRATION: Press down <File Filter>
button, input file type you want in the appearing dialog
box, point at the button <OK> or <Enter> key. It can
display these kinds of files in the list box
File filter
ONLINE HELP: Press down <help> icon on right top of the screen, users can view the
help file.
QUERY ANALYSIS RESULT: You can move mouse cursor to the window of displaying
Rev. A
8 of 9
2006-3
User’s manual of MCMe2.0
Beijing SENDIG Technology LTD.
analysis result. At the bottom of the analysis window, it displays the coordinate value of
where the cursor. If click mouse left key, the fixed label will show up, in order to compare
with other points on the curve. It can display two signals’ coordinate value when having
reference signal. Click the <next> button on the right top of the screen when analyzing
waveform to change pages.
The above operations can be realized through keyboard. With “left”/ “right” keys to move
cursor, or <“Shift” + “left”/ “right”> to quickly move. (Except time-domain analysis);
When analyzing waveform with <Page Up>, <Page Down> to change pages.
3.
Notice
DISPLAY BY SCREEN: When analyze waveform, it collects 1024 points, one-screen
displays 400, and the waveform needs to be displayed by three screens. The process
will realize by pressing the <next> button.
DATA FILES: After running the software, first input data file. Then after selecting an
analysis method, it should select signal type, that is to say, every time changing
analysis method, it should input data file from the list box again. In addition, after
minimizing a result, if you want to resume, you need point the data file again.
INTERVALS: How to change intervals in time-domain diagnosis: Firstly, run the
software until appear the intervals value. Secondly, move the focus to the analysis
window. Lastly, with “up”/ “down” key, not with cursor to increase or decrease the
intervals.
Rev. A
9 of 9
2006-3