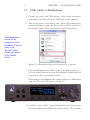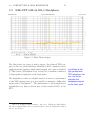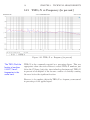
1
Invicta DAC Owner’s Manual
Resonessence Labs
Contents
Introduction
iii
1 Quick Start Guide
1.1 USB Audio to Headphones . . . . . . . . . . . . . . . .
1.2 SD-Card to Amplifier and Speakers . . . . . . . . . . . .
2 Resonessence Invicta User Guide
2.1 Checking the Mains Voltage . . . .
2.2 A Note on Output Levels . . . . .
2.3 Front Panel Controls . . . . . . . .
2.4 Rear Panel Connectors . . . . . . .
2.5 Calibrating the Headphone Levels
2.6 Digital Data Sources . . . . . . . .
2.6.1 SD Card . . . . . . . . . . .
2.6.2 Digital Data Inputs . . . .
2.6.3 USB . . . . . . . . . . . . .
2.7 Updating Firmware . . . . . . . . .
.
.
.
.
.
.
.
.
.
.
3 Technical Measurements
3.1 20Hz FFT 0dB 44.1kS/s . . . . . . .
3.2 1kHz FFT 0dB 44.1kS/s . . . . . . .
3.3 7kHz FFT 0dB 44.1kS/s . . . . . . .
3.4 20kHz FFT 0dB 44.1kS/s . . . . . .
3.5 1kHz FFT -90dB 44.1kS/s at 16bits
3.6 1kHz FFT -90dB 44.1kS/s at 24bits
3.7 1kHz FFT -140dB 44.1kS/s . . . . .
3.8 1kHz FFT 0dB 44.1kS/s Headphone
i
.
.
.
.
.
.
.
.
.
.
.
.
.
.
.
.
.
.
.
.
.
.
.
.
.
.
.
.
.
.
.
.
.
.
.
.
.
.
.
.
.
.
.
.
.
.
.
.
.
.
.
.
.
.
.
.
.
.
.
.
.
.
.
.
.
.
.
.
.
.
.
.
.
.
.
.
.
.
.
.
.
.
.
.
.
.
.
.
.
.
.
.
.
.
.
.
.
.
.
.
.
.
.
.
.
.
.
.
.
.
.
.
.
.
.
.
.
.
.
.
.
.
.
.
.
.
.
.
.
.
.
.
.
.
.
.
.
.
.
.
.
.
.
.
.
.
.
.
.
.
.
.
.
.
.
.
.
.
.
.
.
.
.
.
.
.
.
.
.
.
.
.
.
.
.
.
.
.
.
.
1
2
3
.
.
.
.
.
.
.
.
.
.
5
5
6
7
7
7
8
8
9
10
11
.
.
.
.
.
.
.
.
15
16
17
18
19
20
21
22
23
ii
CONTENTS
3.9
3.10
3.11
3.12
3.13
3.14
3.15
3.16
3.17
3.18
3.19
3.20
3.21
3.22
Full Spectrum Jitter Test . . . . . . . .
Reduced Spectrum Jitter Test at 16bits
Reduced Spectrum Jitter Test at 24bits
Jitter Test Detail . . . . . . . . . . . . .
Frequency Response at 44.1kS/s . . . .
Frequency Response at 192kS/s . . . . .
DNR vs DC Offset . . . . . . . . . . . .
Linearity in 24bit Mode . . . . . . . . .
Time Domain Response -90dB . . . . .
Inter-modulation Distortion Test . . . .
Swept Frequency Low Level Noise Test .
THD+N vs Frequency (in dB) . . . . .
THD+N vs Frequency (in percent) . . .
Cross-Talk vs Frequency . . . . . . . . .
.
.
.
.
.
.
.
.
.
.
.
.
.
.
.
.
.
.
.
.
.
.
.
.
.
.
.
.
.
.
.
.
.
.
.
.
.
.
.
.
.
.
.
.
.
.
.
.
.
.
.
.
.
.
.
.
.
.
.
.
.
.
.
.
.
.
.
.
.
.
.
.
.
.
.
.
.
.
.
.
.
.
.
.
.
.
.
.
.
.
.
.
.
.
.
.
.
.
.
.
.
.
.
.
.
.
.
.
.
.
.
.
.
.
.
.
.
.
.
.
.
.
.
.
.
.
24
25
26
27
28
29
30
31
32
33
34
35
36
37
4 Notes on Audio Engineering
4.1 The Sense of Hearing . . . . . . . . . . . . . .
4.2 About Common DAC Specifications . . . . .
4.2.1 Decibels (dB) in Audio Measurements
4.2.2 Dynamic Range . . . . . . . . . . . . .
4.2.3 Signal to Noise Ratio . . . . . . . . .
4.2.4 Frequency Response and Slew Rate . .
4.3 Fourier Analysis . . . . . . . . . . . . . . . .
4.4 Switching and Linear Power Supplies . . . . .
4.5 An Invicta from 1935 . . . . . . . . . . . . . .
.
.
.
.
.
.
.
.
.
.
.
.
.
.
.
.
.
.
.
.
.
.
.
.
.
.
.
.
.
.
.
.
.
.
.
.
.
.
.
.
.
.
.
.
.
.
.
.
.
.
.
.
.
.
39
39
43
44
45
46
47
50
52
53
5 System Components
5.1 Inside the Invicta . . . . . . . . . . . . . . . . . . . . . .
5.2 Notes on Components . . . . . . . . . . . . . . . . . . .
55
55
58
6 Specifications
59
Bibliography
61
Introduction
Music means so much to the human soul. The sounds and songs that
accompany us through our lives reflect the emotion of forgotten times,
re-inspire us to dream as we did before, hasten our heart beat, and
flood over us with rekindled emotions. We were ready for the music revolution: transistor radios of the 1960’s began the change, and
through cassette players to portable CDs and to the early MP3 players, we reveled in the music of the late 20th century. The digital music
revolution unfolded and showed us how to create, deliver and experience a choice of music unimaginable even a few years before. We are
immersed in music: in our cars, on our phones, in our ears as we walk
the streets. We owe this to the fabulous combination of digital and
analog electronics: digital to flawlessly transport and store our music,
yet still and always, analog to render it to our ear. We all know what
the three letters “DAC” mean - Digital to Analog Converter - the key
element in the digital music device and a part of the revolution.
Up until this point in time there has always been a trade-off in digital audio - the technology was not quite up to it, and commercial
realities intruded. Costs had to be appropriate for the mass market.
CDs squeezed as much data onto the disk as they could, sampling at
44.1khz was barely mathematically justified, but the digital was difficult and expensive, better to use a steep analog filter than sample
faster. And the choice of 16bit encoding; who could dispute that 16
bits of resolution was not more than enough to beat the performance
of the vinyl records? Early MP3 players used an admirably clever encoding scheme that put a tempting number of tracks on a relatively
small FLASH memory card. This enabled a generation of profitable
products, but few would argue that MP3 was anything more than an
acoustic illusion, burying detail of the music behind louder sounds in
the assumption that the human ear would not miss it.
iii
The Invicta is an
Audio DAC at a
performance level
that makes it a
milestone in the
evolution of digital
audio.
iv
The Invicta DAC
plays uncompressed
music in 24bit
format up to
192kS/s.
This far exceeds the
performance levels
of MP3.
INTRODUCTION
As the 21st century begins, the technology of digital music leaps forward. It is no longer necessary to compromise the artist by compressing
her music. The older trade-offs are no longer relevant. We can embed
unadulterated perfection into the digital domain and, at a time of our
choosing, recreate every essence of the living sound. You will never go
back; hearing 24 bit music sampled at 192khz preserved and rendered
bit-perfect without compression is an unforgettable experience. The
mind builds an audio picture so intense in detail, so clearly spatially
resolved, that the listener is inclined to disbelieve the eyes in favor of
the ears that are telling him he is at a different place and time. The
audio reality exceeds that of the vision, and the listener is transported
into the time and place of the recorded performance.
A rational reader should be skeptical of such claims of great benefit from
yet more technological power because, many times, the art of audio
engineering has rested more upon the engineering than the art. To even
suggest that the ear can benefit from resolutions higher than 16 bits is
controversial: what experiment supports the assertion that 24 bits are
perceived as any improvement on 16 bits? Why ever exceed 20khz of
bandwidth when we know that we cannot hear a 20khz signal? And
does not the rigor of mathematical analysis teach that 44.1khz sampling
can indeed preserve 20khz - so where does any further technological
benefit lie? What shall we conclude about the obfuscation that sigmadelta (Σ∆) modulators apply to the signal - are they not just another
MP3-like slight-of-hand designed to reduce the manufacturer’s costs?
Indeed it is true that in the race to exploit the exploding market for
personal audio devices, rationalizations such as these (no need for more
than 16bits, no need for high sampling rates, use of low cost Σ∆ based
DACs etc) have driven mass-market designs.
Careful science
shows that the ear is
a remarkable and
subtle instrument.
Immeasurable
differences can be
perceived by skillful
listeners.
To excel in audio engineering and design is a challenging task. It is
challenging because the reality of it differs from that which is suggested
by a simple analysis. The reality is that individuals with audiophile
credentials (so called “golden ears”) do exist, and one can be trained
to listen critically to music and discern faults and imperfections that a
casual listener does not hear. Some audio enthusiasts are outstanding in
their ability to note differences that the engineer cannot find. Scientific
double-blind tests confirm over and over again that two digital audio
devices with identical specifications of noise, dynamic range, bandwidth
and distortion can be reliably distinguished by the human ear. There
is certifiably something that the ear perceives that our measurement
v
apparatus does not. Indeed, there are examples of outstanding audio
designs where the skilled engineer has deliberately failed to optimize
a certain parameter (the most common being signal to noise ratio)
because listening tests consistently show that the lower quality design
(as measured by the instrumentation) sounds better. All the high-end
audio manufacturers employ staff trained to listen to new products
and they only accept a design that passes a listening test. And the
important point is this: these listening tests confirm that the high
amplitude resolution (24 bits) and high sampling rate (96k or 192k)
make a huge difference to the perception of the audio rendered by the
digital device.
To understand Resonessence is to understand this: what if the most
technically advanced device was also the one that produced the best results in listening tests? What if a device could absolutely and verifiably
dominate in the technical measurements of signal to noise, dynamic
range and distortion, jitter, in response flatness, in linearity of group
delay, in out of band noise, in the subtleties of transient response and
uniformity of noise in operating space, and yet also excel in listening
tests? What if it could conform to expectations of modern interfaces,
USB, SPDIF, word sync and add yet more such as SD Card based
audio? The Invicta is this product.
You are now in possession of the Resonessence Invicta DAC and you can
confirm all the assertions above. Connect the Invicta to your quality
amplifier and speakers, or use high quality headphones from the front
panel, and listen for yourself. The Invicta is capable of rendering 24 bit
audio at 192khz from all sources, the most convenient probably being
the SD card. Relish your first experience of our product - we hope you
find it enjoyable. This document is your guide. In the second section
we describe how to use the Invicta in your system - all you need to
know to get the best out of your purchase.
Refer to the first section for a quick start guide; this should be sufficient
to show how to get the Resonessence Invicta running with either USB
or the SD-Card.
The third section is the technical detail including everything measurable about the Invicta – those aspects that can be technically measured
are reported here so that you can be assured you are in possession of a
technically excellent product – the best we know how to build. You will
note that we discuss unusual parameters over and above the industry
The Resonessence
Invicta DAC is
technically superior,
but more
importantly, it
sounds better
because it is
designed with
feedback from
audiophiles, not just
from
instrumentation
measurements.
vi
INTRODUCTION
standard measurements. These are based on our experiments where we
have discovered a correlation between what the audiophile trained listener perceives as good, and a measurable parameter or design aspect.
In section four of this user guide we share what we have learned as we
have grown in the audio field. There are pitfalls and aspects of audio
shared here that you may find helpful. For example, the use of Fourier
analysis is ubiquitous for audio, but sometimes its faults and foibles are
not sufficiently explained. Also, the Invicta uses the ESS Sabre32 DAC
as the core element. This is a complex device that has many aspects of
a Σ∆ modulator, but claims some difference. The manufacturer calls it
a HyperStream modulator – you may be interested to know what that
is and why it does not suffer from sigma-delta modulator problems.
Finally, there are some so-called secrets of design in audio that are not
really secrets – all the good manufactures know them – we think it may
be helpful to explain them to our customers because we find that many
audio enthusiasts who appreciate the Invicta product also appreciate
the technical details.
Chapter
1
Quick Start Guide
Check the Mains Voltage The Invicta product is configured for the
prevailing mains voltage at the delivery address, however as a precautionary measure, first confirm that the voltage setting on the power
entry module on the back of the Invicta corresponds to the mains voltage in your region.
Take care to confirm
that the voltage
setting is correct for
your mains supply.
Figure 1.1: The mains voltage is visible on the power entry module
The selected voltage is visible to the left of the power switch, in this
picture 115V is selected. If the selected voltage is incorrect, refer to
section 2.1
1
2
CHAPTER 1. QUICK START GUIDE
1.1
USB Audio to Headphones
1. Connect the power and USB interface cable on the rear panel,
and connect the other end of the USB cable to the computer.
2. Turn on the power to the Invicta unit. After a short interval the
computer should recognize the Invicta and it will be available in
the system “Sound” dialog. Select this as the Default Device.
The Resonessence
Invicta will be
recognized by the
Windows OS and be
listed in the
“Sounds” Dialog.
Choose the Invicta
as the Default
Device.
Figure 1.2: Resonessence Invicta is registered as a Speaker
3. Plug the headphones into either of the ¼'' headphone plugs A or
B on the front panel and activate the headphone output with the
button above the corresponding socket.
When using two headphones the volume level may be different in
each one. To correct this refer to section 2.5.
4. Press the “Source Select” button (right-hand of the four buttons
below the display) until USB is the selected source. The red light
1.2. SD-CARD TO AMPLIFIER AND SPEAKERS
3
in the bottom left1 will indicate that the system is waiting for USB
data to be available from the computer. Any music now played
on the computer is routed to the Invicta and played through the
headphones.
1.2
SD-Card to Amplifier and Speakers
1. Connect the power cable on the rear panel and turn on the power.
2. Connect the XLR or RCA rear connectors to the Power Amplifier
input ports on your audio amplifier.
3. Insert an SD-Card containing the source you wish to play: the
display will show “SDHC Card Inserted”
4. The default configuration is to take data from the SD-Card. Rotate the multi-function knob to select the track you wish to play.
5. Press the multi-function knob and the track will start to play,
press again to pause, rotate to change the volume level.
1
That is, the USB Status lights in the bottom left, “USB Status” Figure 2.3
4
CHAPTER 1. QUICK START GUIDE
Chapter
2
Resonessence Invicta User Guide
2.1
Checking the Mains Voltage
The Invicta uses a linear power supply as opposed to a switching power
supply1 and consequently requires the user to set the expected mains
voltage.
The Invicta does not
contain an
automatically
adapting
switch-mode power
supply: they make
too much noise.
You must set the
mains voltage by
rotating the fuse
holder.
Figure 2.1: The mains voltage is visible on the power entry module
The selected mains voltage is visible on the power entry module (PEM)
at the rear of the unit. The Invicta is configured for the mains voltage
1
Refer to section 4.4 for more details
5
6
CHAPTER 2. RESONESSENCE INVICTA USER GUIDE
of the shipping address, but if the system is shipped elsewhere or if the
mains voltage needs to be changed, then carefully open the fuse door,
extract and re-insert the fuse holder appropriately to select the new
voltage.
Choose 230V or
115V - whichever is
closest to your
mains voltage.
Figure 2.2: Drawing showing the fuse door and fuse holder
Close the door and verify that the expected voltage (230V or 115V) is
visible in the window.
2.2
The output
amplitudes of the
Invicta are designed
to drive typical
power amplifier
input levels, not
pre-amplifier input
levels.
A Note on Output Levels
The Invicta output levels are designed to drive a power amplifier input
and are therefore higher than commonly used for the Analog Inputs of
audio equipment that combines pre-amplification with a power amplifier. Take care not to overdrive your audio equipment inputs. Ideally,
use the power amplifier input on your equipment, not the auxiliary analog inputs.
The XLR differential output amplitude for 0dB is 5V rms and the RCA
output amplitude for 0dB is 2.5V rms. This is typically higher than
the levels expected at the Analog Input of many home audio devices
because the Invicta is designed to drive a power amplifier input.
The Invicta at power-up presets the volume level to −30dB.
2.3. FRONT PANEL CONTROLS
2.3
7
Front Panel Controls
Figure 2.3: Invicta front panel controls
2.4
Rear Panel Connectors
Figure 2.4: Invicta rear panel connections
2.5
Calibrating the Headphone Levels
Invicta has two headphone output jacks to enable two sets of headphones to be used simultaneously. The Volume Control dial will adjust
the volume to both the left and right headphone jacks when turned.
The left and right headphone control buttons allow you to calibrate
the volume control for each pair of headsets. If the volume is too low
or two high for one set of headsets, hold down the headphone control
button above the headphone jack and adjust via the Volume Control
dial and then release.
Headphones can
have different
sensitivities. Follow
the procedure here
to set the levels to
be the same so that
two people can
listen at the same
time.
8
2.6
Invicta processes
digital input data
from one source and
sends the analog
reconstruction to all
outputs at the same
time.
CHAPTER 2. RESONESSENCE INVICTA USER GUIDE
Digital Data Sources
The Invicta plays from one data source at a time, the selected data
source is sent to each output simultaneously. Therefore, you can listen
via the headphones or via the RCA or XLR outputs at the same time.
2.6.1
SD Card
The SD-Card reader will read files from a Class-10 SD-Card in WAV
file format. The file can be of up to 192kS/s and 24bit data width.
Insert the SD Card and press the “Source Select” button (right most
of the four buttons) until the SD-Card source is selected. The selected
source is visible in the bottom right of the display area. Rotate the
multi-function knob to select the track name you wish to play – as the
knob rotates, the track is visible in the upper left area of the display.
Playback from the
SD-Card maybe
Paused, Rewound
and Fast Forwarded
from the front panel
buttons.
Press the multi-function knob to start playing and then adjust the
volume with the multi-function knob.
To stop playback, press the multi-function knob again.
Invicta will play each track on the SD Card in sequence until the end
of the last track on the card.
To pause a track, press the pause button. To re-start, press the pause
button a second time or press the center of the Volume/Multi-Functional
dial.
You can rewind gradually through a track by holding down the Rewind
button. The track will restart automatically as soon as the button is
released. To quickly rewind to the beginning of a track, press and
release the rewind button once. To rewind to the beginning of the
sequence of tracks on the SD Card, press the rewind button twice in
quick succession.
You can Fast-Forward gradually through a track by holding down the
Fast-Forward button. The track will restart automatically as soon as
the button is released. To quickly Fast-Forward to the end of a track,
press and release the Fast-Forward button. To Fast-Forward to the
end of the sequence of tracks on the SD Card, press the rewind button
twice in quick succession
2.6. DIGITAL DATA SOURCES
2.6.2
9
Digital Data Inputs
The Invicta accepts digital data in the Sony/Philips Digital Interface
Format (S/PDIF) from three different sources. Each data source may
transmit up to 192kS/s data at up to 24 bits. The Invicta recognizes
the data rate, bit width etc. and configures appropriately without any
user interaction. The data rate being processed is indicated on the
front panel LEDs.
Invicta accepts only uncompressed stereo data and mutes in the presence of compressed data. De-emphasis following the RIAA specification
is applied if the pre-emphasis bit is set in the S/PDIF data stream.
Digital data sources are galvanically isolated via transformers (or inherently as in the case of the TOSLINK) to prevent unexpected ground
or other current flow which can create hum2.
• BNC (AES3id) S/PDIF Inputs
Two selectable 75Ω BNC connectors are transformer coupled and
internally terminated for connection to a 75Ω co-axial (single
ended) cable. Select either of the BNC data sources by pressing
the right most “Source Select” button until “BNC-1” or “BNC-2”,
as appropriate, is visible in the display window3 .
The BNC S/PDIF in a managed 75Ω environment is optimum for
relatively long distance (significantly greater than one hundred
meters) digital data transmission.
The outer shells of the BNC connectors are isolated: they float
relative to the chassis potential in order to prevent ground currents and preserve the galvanic isolation.
• AES/EBU S/PDIF Input
An AES/EBU (Audio Engineering Society / European Broadcast
Union) female XLR connector is transformer coupled and internally terminated for connection to a nominally 110Ω differential
shielded twisted-pair (STP) cable. Select the AES/EBU data
source by pressing the right most “Source Select” button until
“AES/EB” is visible in the display window.
2
Note that the screen of the AES/EBU digital data cable is at chassis potential.
The third BNC input labeled “Sync” on the back panel is currently unused and
is provided in anticipation of a future firmware update.
3
The Invicta has the
TOSLINK Optical
connection that is
probably the easiest
to use in a consumer
application. The
BNC and AES/EBU
inputs conform to
professional
expectations of
format and electrical
isolation and are less
common in
consumer
equipment.
If an RCA style
SPDIF connector is
a necessity, use a
commercially
available BNC to
RCA converter on
one of the BNC
ports.
10
CHAPTER 2. RESONESSENCE INVICTA USER GUIDE
Although differential and conveniently sharing the wiring of analog XLR style connectors, impedance levels and losses of the
AES/EBU digital connection standard limit its application to
distances of less than a few tens of meters.
The screen terminal of the AES/EBU XLR is at chassis potential:
the twisted pair within the cable is galvanically isolated from this
screen by the internal transformer.
• TOSLINK Optical S/PDIF Input TOSHiba-LINK is an optical connection as defined by Toshiba Corporation. The Invicta expects the optical fiber to carry the S/PDIF data format
(not PCM). TOSLINK is provided primarily for consumer applications, but similarly to the BNC and AES/EBU, Invicta will
accept the same framing and bit standards (responding to the
pre-emphasis and compressed bits) as on the other digital data
sources. Select the TOSLINK data source by pressing the right
most “Source Select” button until “TOSX” is visible in the display
window.
2.6.3
USB
For a “Quick start”
to using the USB
see section 1.1.
The USB (Universal Serial Bus) interface is perhaps the most popular,
and certainly the most requested, interface format. The convenience of
integration into the personal computer, access to on-line content and
the familiarity of the unified Windows or Mac user interface make it
an appealing and practical means to access digital music.
Don’t forget to
select USB as the
signal source with
the “Source Select”
button.
The Invicta may be connected via the standard Type-B connector on
the back panel to a USB-24 port on the computer. Upon connection,
and when powered on, the operating system will recognize Invicta as
an audio device. Selecting the Invicta as the output device allows any
player (such as Windows Media Player etc.) to be used, and tracks
selected within that application will be streamed via USB to the unit.
Note that the volume control still operates on the data, and the VU
meter shows the output signal level.
Select the USB as the data source by pressing the right most “Source
Select” button until “USB” is visible in the display window.
4
Invicta expects a “Hi-Speed” USB port, that is a USB 2.0 port.
2.7. UPDATING FIRMWARE
11
In USB mode, the Invicta master clock is the timing source and data
from the computer is requested and buffered to maintain synchronization. Clearly, if the player application on the computer ceases to send
data, Invicta will stop playing and the USB underflow light (bottom
left of the front panel) will glow red to indicate this condition. Also,
depending on the detail of the player application, a request to pause in
the application may result in the repetition of the last sample point, a
series of zero values, or no data at all being present on the USB bus.
If no data is present, the buffer will underflow and the indicator light
illuminate, but if the other conditions of repeated value or series of zero
values are detected then the VU meter is adjusted to show no signal.
2.7
Updating Firmware
There are three separate firmware modules in the Invicta:
• The firmware that controls the USB Interface (referred to as the
“USB Firmware” or “USB Fw”).
• The code that runs within the configurable hardware engine (referred to as the “Micro-Controller Code” or “MCU Fw”)
• The configuration code that creates the configurable hardware
engine in the Invicta (referred to as the“FPGA Code” or “FPGA”)
To update any or all of these software modules:
1. Connect the power cord to the unit and a USB cable to the
MSWindows computer. Turn on the unit – within a few seconds
Windows will recognize the device
2. Before updating, verify that the Invicta is not being used by any
application. For example, Skype may have found and used the
Invicta as the sound output device. If any program is using the
Invicta, update may fail. To be sure, temporarily select another
output device as the default Windows sound device.
3. Double click on the provided dfu.exe application. The following
dialog box will open:
All elements of the
Invicta are
programmable.
From time to time
Resonessence may
upgrade features by
providing new
firmware modules.
12
CHAPTER 2. RESONESSENCE INVICTA USER GUIDE
Figure 2.5: The Firmware Upgrade Utility Dialog Box
4. If you wish to update the USB Interface Firmware, click the button named “Update USB Fw” and in the file dialog box choose
the appropriate file. The file has the type “iic”.
The USB interface
(a silicon chip from
Cypress
Semiconductor) can
be upgraded if
necessary.
5. After a few seconds, the USB firmware will be updated. The
internal device handling the USB is from Cypres Semiconductor,
and a reminder to cycle the power will appear:
Figure 2.6: USB Firmware Upgrade Completed
6. Turn off the power to the Invicta, wait a few seconds for Windows
to un-register the device, then turn on the Invicta again.
2.7. UPDATING FIRMWARE
13
7. If you wish to update the Micro Controller Code, click the button
named “Update MCU Fw” and in the file dialog box choose the
appropriate file. Often the name “MCU” will be part of the file
name. The file has the type “bin”.
8. After a few seconds, the MCU firmware will be updated. The
following dialog appears:
The MCU is the
main controller of
the Invicta. It is
micro-code running
within a high
performance Field
Programmable Gate
Array (FPGA).
Figure 2.7: MCU Firmware Download Completed
9. Click “OK” and turn off the power to the Invicta once more, wait
a few seconds for Windows to un-register the device, then turn
on the Invicta again.
10. If you wish to update the FPGA Code, click the button named
“Update FPGA” and in the file dialog box choose the appropriate
file. Often the name “FPGA” will be part of the file name. The
file has the type “bin”.
11. After a few seconds the FPGA Code will be updated. The following dialog appears:
The FPGA itself
may be upgraded to
add extra features
and operation codes
to the MCU.
14
CHAPTER 2. RESONESSENCE INVICTA USER GUIDE
Figure 2.8: FPGA Code Download Completed
12. Click “OK” and turn off the power to the Invicta once more, wait
a few seconds for Windows to un-register the device, then turn
on the Invicta again.
Chapter
3
Technical Measurements
All measurements are taken with the Audio Precision Model 2722. Below is a typical graph produced by the instrument with notation of
the elements of the graph. Many of the graphs are in the frequency
domain, that is, they are Fourier Transforms (sometimes referred to as
Fast Fourier Transforms or FFT’s). Refer to section 4.3 for details on
the FFT.
Figure 3.1: Annotated example of a typical AP2722 graph
15
16
CHAPTER 3. TECHNICAL MEASUREMENTS
3.1
20Hz FFT 0dB 44.1kS/s
Figure 3.2: 20Hz Signal Sampled a4 44.1kHz (as from a CD)
The Invicta shows
low harmonic
distortion in the
20Hz test. No high
harmonic terms are
present and no
evidence of spurious
tones.
This FFT of a 20Hz signal shows no roll-off for low frequencies and very
low distortion up to high harmonics. Testing near the low frequency
end of the frequency range can also expose spurious tones (often called
idle tones) that some forms of Σ∆ modulators are susceptible to.
Refer to the 1kHz result on the next page for more details of the FFT
based tests.
3.2. 1KHZ FFT 0DB 44.1KS/S
3.2
17
1kHz FFT 0dB 44.1kS/s
Figure 3.3: 1kHz Signal Sampled at 44.1kS/s (as from a CD)
The FFT of a 1kHz signal is the most commonly used technical measurement. This is the Invicta creating a single tone at 1kHz from
digital data delivered at a rate of 44.1kS/s which is the rate encoded
on a CD. The main component measured by the AP2722 is the 0dB
signal at 1kHz – everything else is an artifact of the reproduction. The
first thing we observe is that there is a “noise floor” below −140dB and
there are “spikes” sticking out of that noise floor to about −120dB.
Close inspection shows that the highest ones are 3kHz and 5kHz –
these are the 3rd and 5th harmonic of the 1kHz applied. “Harmonic”
is the term used to describe simple multiples of the main signal and
harmonics are desirable characteristics of musical instruments: they
give the musical instrument its characteristic sound, as from a Clarinet or Oboe. However, in an electronic device, harmonics of the main
signal are unwanted: they represent failures on the part of the electronic device to create just the main signal provided in the digital data
stream. The electronic device is sometimes specified by the Total Harmonic Distortion (THD) which is the ratio of the main signal to the
sum of all the harmonic terms, but more commonly the specification
of Total Harmonic Distortion plus Noise (THD+N) because this can
more easily be measured.
The FFT at 1kHz
shown here
demonstrates that
the Invicta has a
THD+N of
−114dB.
18
CHAPTER 3. TECHNICAL MEASUREMENTS
3.3
7kHz FFT 0dB 44.1kS/s
Figure 3.4: 7kHz Signal Sampled at 44.1kS/s (as from a CD)
The harmonics are
remaining at the
same very low
amplitude for each
frequency tested.
The Invicta has no
frequency dependent
distortion.
The FFT of a 7kHz signal will have a third harmonic component close
to the upper end of the band when a 44.1kS/s data rate is used. That
harmonic is just visible here; it remains of low amplitude and nothing anomalous is occurring. The fifth harmonic is not present and no
evidence of it “reflecting back” below the 20kHz bandwidth is present.
Note that the third harmonic of the 7kHz tone is not increased in
amplitude – it is the same amplitude as was present in 20Hz and 1kHz
tests. This demonstrates that there is no hint of non-linear limiting
(slew rate or similar) in the DAC.
No “rumble” – low frequency artifacts – are visible in the frequencies
below 7kHz.
3.4. 20KHZ FFT 0DB 44.1KS/S
3.4
19
20kHz FFT 0dB 44.1kS/s
Figure 3.5: 20kHz Signal Sampled at 44.1kS/s (as from a CD)
Applying a 20kHz signal in the 44.1kS/s data rate stresses the band
limiting digital filter (sometimes called the “Anti-Aliasing” filter). The
44.1kHz data rate is a legacy of the CD era and is just about as low a
sampling rate as can be used while retaining a 20kHz bandwidth.
Because the sample rate is so low, the data stream carrying a 20kHz
signal must also be carrying a 44.1kHz − 20kHz = 24.1kHz signal as
well. This is a mathematical consequence of the low sample rate and is
an “image” of the 20kHz signal. The task of the digital band limiting
filter is to remove this artifact and render the signal into a substantially
higher sample rate domain for further processing. The performance
of the digital band limiting filter can be assessed by looking for the
24.1kHz artifact. It is a very low: < −120dB.
The digital
anti-aliasing filter is
explored in this
FFT: it is working
very well,
suppressing the alias
tone to less than
< −120dB.
20
CHAPTER 3. TECHNICAL MEASUREMENTS
3.5
1kHz FFT -90dB 44.1kS/s at 16bits
Figure 3.6: Low Level 1kHz Signal Sampled at 44.1kS/s 16bits
The noise floor is
flat and entirely due
to quantization
noise in the
incoming data. No
idle tones are
present.
If the amplitude of the main tone is reduced we can expect the harmonics to disappear into the noise floor. This test applies a small signal
(−90dB) to the DAC and verifies that all the harmonics are gone.
In this situation the noise floor is determined by the larger of the DAC
inherent noise and the quantization noise of the incoming data stream.
Since this is a 16 bit data stream the quantization noise far exceeds any
inherent DAC noise: this results in a flat and undisturbed noise floor
at the −130dB level and this is entirely due to the use of 16 bit data.
Certain forms of Noise Shaping loop (often simply called Σ∆ modulators) suffer from anomalous patterns that persist in the loop. These are
called “idle tones” or “limit cycles” and are self-sustained perturbations
in the almost chaotic state variables that do not die away with time.1
No idle tones are visible in this data.
1
To some degree, idle tones correspond to annoying “rattles” that your car may
make but only when going at certain speeds. It is important to put the DAC into a
state that encourages these idle tones to verify they are not present.
3.6. 1KHZ FFT -90DB 44.1KS/S AT 24BITS
3.6
21
1kHz FFT -90dB 44.1kS/s at 24bits
Figure 3.7: Low Level 1kHz Signal Sampled at 44.1kS/s 24bits
As in the 16 bit test on the previous page, there is no evidence of lowlevel harmonic distortion in this −90dB test. However, the data stream
has about 46dB lower quantization noise and is now below the level of
the DAC. Consequently, the noise floor in this graph is entirely due
to the inherent noise in the DAC itself. The noise floor is now about
−155dB and any very low level idle tones or other anomalies would be
visible. There are none.
This is in large part due to the ESS Sabre DAC used in the Invicta. It
has a noise shaping loop which differs in detail from a conventional Σ∆
modulator (the manufacturer calls it a “HyperStream” modulator).2
The signals at the −140dB level below 500Hz are harmonics of the
mains cycle (60Hz in this case) getting into the signal path probably
through electro-magnetic induction. −140dB is an exceptionally low
level of power line interference.
2
The HyperStream modulator adds a third constraint to the noise shaping loop.
It and the Σ∆ modulator must quantize the signal in amplitude and time while
shaping the noise, but the HyperStream also constrains the loop dynamics to fix the
feedback frequency. This makes it virtually impossible for self-sustained low level
oscillations (idle tones) to persist in the loop.
The DAC noise floor
is visible in a
low-level FFT with
24bits. It is free
from idle tones and
spurious responses.
22
CHAPTER 3. TECHNICAL MEASUREMENTS
3.7
1kHz FFT -140dB 44.1kS/s
Figure 3.8: Very Low Level 1kHz Signal Sampled at 44.1kS/s 24bits
The Invicta has a
very low noise floor:
so low that a signal
of only 0.2µV can
be clearly seen in
the output.
This FFT is approaching the limit of the instrumentation used to measure the Invicta. Here, a very low level −140dB signal is applied in
the 24 bit data stream. This generates a signal of only 0.2µV rms at
the output3 . Note that once again there is no evidence of idle tones or
spurious response.
Close examination of this graph supports the assertion on the previous
page: the −140dB tones in the sub 500Hz region are now clearly seen
to be power line induced noise. Due to the logarithmic X-axis used in
this plot, they can be confirmed to be 60, 180 and 300Hz – harmonics
of the Canadian power line frequency (60Hz) where this Invicta was
measured.
3
It is a testament to the engineering expertise in the AP2722 that it can resolve
such a low level signal.
3.8. 1KHZ FFT 0DB 44.1KS/S HEADPHONE
3.8
23
1kHz FFT 0dB 44.1kS/s Headphone
Figure 3.9: Head Phone Output
The Invicta has two types of analog output: the balanced XLR outputs on the rear (with subsidiary unbalanced RCA outputs for those
applications that require a single ended output) and a pair of standard
¼'' TRS sockets (“Headphone Jack” sockets) for convenient connection
to high quality headphones on the front panel.
The headphone sockets are slightly inferior in terms of performance
to the XLR outputs, since it is not possible to maintain a differential
signal path to headphones4 . The performance to the headphones is
nevertheless very high as shown here in this standard 1kHz 16 bit
FFT
4
There is no industry standard means to drive stereo Headphones differentially.
The three terminal TRS connector standard allows only Left, Right and Common
wires to the head set.
In addition to the
high performance
XLR outputs on the
rear, the Invicta
provides dual
headphone outputs
on the front panel.
24
CHAPTER 3. TECHNICAL MEASUREMENTS
3.9
Full Spectrum Jitter Test
Figure 3.10: Jitter Test - full spectrum
Jitter is the error in
a timing signal:
jitter in a DAC
means that the
digital data is
reproduced at the
wrong time. This
can be heard as a
“muddiness” or lack
of precision in the
sound stage.
After THD and Noise, the parameter that has a large effect on perceived
quality is the jitter. Jitter refers to the variation in the time of the
digital sample.
To test for jitter, a carefully constructed series of sample points are
passed to the DAC. These sample points are at exactly the sample
rate (often notated as f s) divided by four, and imposed upon them
is a variation in just the least significant bit (LSB) at about 230Hz 5 .
Consequently the FFT has a large signal at 11.025kHz and a tiny
square wave signal6 .
Jitter may be assessed by inspecting the widening (i.e. “spreading”
at the base) of the main tone and any widening of the harmonics
of the 230Hz signal. The above graph confirms the presence of the
230Hz square wave at −90dB, but does not show sufficient detail of
the 11.025kHz signal. On the next page more detail is provided.
5
The low level tone is actually at f s/192 or 229.6875Hz
The square wave signal measures just below −90dB because the LSB is taken
to be the LSB at the 16 bit data width – again as from a CD. The “real” LSB of the
Invicta system is that of a 24bit data width, but this Jitter test is conventionally
done at the 16 bit level. Refer to [1] for details.
6
3.10. REDUCED SPECTRUM JITTER TEST AT 16BITS
3.10
25
Reduced Spectrum Jitter Test at 16bits
Figure 3.11: Jitter Test - detail in f s/4 region 16 bit data
To see the effect of jitter, this graph is the same as the one on the
previous page but zoomed-in to the region of f s/4 or about 11kHz.
The main tone is
very well resolved:
Jitter on the internal clock of the DAC causes a widening or spreading there is very little
at the base of the main tone. That spreading may be significant in indication of
some DACs - the bottom of the 11kHz tone may spread to cover the “spreading” which
would indicate jitter.
two harmonics of the 230Hz tone that are nearby.
This data shows very little spreading at the base of the main tone –
nowhere near impinging upon the adjacent harmonics of the 230Hz
signal. This shows that the jitter is exceptionally low.
26
CHAPTER 3. TECHNICAL MEASUREMENTS
3.11
Reduced Spectrum Jitter Test at 24bits
Figure 3.12: Jitter Test - detail in f s/4 region 24 bit data
The data width does
not affect the jitter
test: both 16 and 24
bits show excellent
jitter specification.
This is the jitter test for 24 bit data. It shows the same result as at
16 bits; there is very little indication of spreading in the tone. Note
the interesting thing about the jitter test set up: because the data in
the digital stream is phase locked to the sample rate(that is to say, the
encoded frequency is an exact division of the sample rate, f s/4 in this
case) there is no quantization noise present, to any arbitrary level in
the digital data7 . The fact that this is 24 bits has made no difference
to the result, as expected.
7
This absence of quantization noise is not particularly surprising: any square
wave encoded in the data stream will exercise only two codes (the upper and the
lower level of that square wave). Furthermore, if the frequency is an exact division
of the sample rate, the same pattern of bits will emerge from the band-limiting filter
over and over again. Therefore, there is no mechanism to spread the quantization
energy into a wide band and the noise floor is that inherent to the DAC itself,
independent of the bit width.
3.12. JITTER TEST DETAIL
3.12
27
Jitter Test Detail
Figure 3.13: Jitter Test - detail in f s/4 region of the spectrum
This is the Jitter test in the region of the 11.025kHz signal. Note
the width of the main signal: it is narrow and nowhere near intruding
onto the surrounding 220Hz harmonics.This indicates that the Invicta
internal reconstruction clock is good. It exhibits very low phase noise.
We can assume that the recording studio has an essentially perfect
timing source (often referred to as a “clock” in the electronic system)
and the digital samples have been taken precisely where they should
have been in time.
If, however, the DAC used to recreate the analog signal has a badly
defined clock – a badly defined timing source – then the precision is lost.
Remarkably perhaps, listening tests show that the skilled audiophile
will be able to hear a degradation in the sound quality unless the DAC
clock is exceptionally good.
The DAC clock is an example of where engineering judgment and audiophile experience diverge. The engineer is inclined to think that jitter
of 0.1% of the unit interval (the sample rate) is a good clock. Listening
tests prove that the audiophile can hear artifacts down to < 0.001% of
the unit interval.
The narrow width of
the main signal
shows that the
Invicta has an
excellent
reconstruction clock
and will not suffer
from phase noise
induced quality
reduction.
(Refer to [1] for
many more notes on
jitter).
28
CHAPTER 3. TECHNICAL MEASUREMENTS
3.13
Frequency Response at 44.1kS/s
Figure 3.14: Frequency Response at 44.1kS/s
The Invicta has less
than −1dB roll-off
with the 20kHz
band for 44.1kS/s
rate.
In fact, the roll-off is
measured to be
−0.25dB.
In the 44.1kHz sample rate, 20kHz is the target maximum audio bandwidth8 . Within that bandwidth, the system ideally has a perfectly flat
frequency response.
This graph shows the Invicta system has about 0.25db roll off at 20kHz
– well within the acceptable limit.
8
From a theoretical point of view, the digital data has an absolute limit of
22.05kHz, but this mathematical limit can never be reached because the bandlimiting filter to remove the adjacent alias signal would have to be infinitely steep.
3.14. FREQUENCY RESPONSE AT 192KS/S
3.14
29
Frequency Response at 192kS/s
Figure 3.15: Frequency Response at 192.kS/s
As mentioned in the reference [3], it is now known that the human
ear delivers sounds of up to at least 50kHz to the brain. While not
consciously reported as perceptible, such sounds may nevertheless contribute to the listening experience – there is some evidence from listening tests to support this assertion.
Fortunately, advancing technology has brought higher sample rates and
higher resolution to the audiophile: music can now be acquired in 24bit
format with as high as 192kS/s data rate. The common mathematical
limit of 22.05kHz is now broken since these data rates can support
signals to 80kHz or higher.
This graph shows that the Invicta has a −3dB bandwidth exceeding
80kHz.
When provided with
192kS/s data rate
the Invicta achieves
a −1dB bandwidth
of 50kHz and a
−3dB bandwidth of
over 80kHz.
30
CHAPTER 3. TECHNICAL MEASUREMENTS
3.15
DNR vs DC Offset
Figure 3.16: Dynamic Range vs. DC Input
A phenomenon seen
in Noise Shaping
Modulators is tightly
controlled in the
Invicta: it has very
little degradation of
DNR with DC input.
Noise shaping control loops (Σ∆ modulators and the HyperStream
modulator in the ESS Sabre DAC used in Invicta), exhibit an interesting phenomenon: the dynamic range measured as the signal to noise
ratio for a quiet input is not independent of the DC input condition9 .
The change in DNR with DC Offset can be quite profound; as much
as a degradation of 20dB. This graph shows that the Invicta and its
internal ESS DAC exhibit a small degradation of about −6dB for even
a large (more than 90%) DC offset.
9
In fact, as reference [2] explains, the phenomenon extends to more than just the
DC offset, but to any constant derivative applied as input to the noise shaping loop.
3.16. LINEARITY IN 24BIT MODE
3.16
31
Linearity in 24bit Mode
Figure 3.17: Linearity of Response with Changing Input Amplitude
Linearity, when applied to a DAC, potentially has two meanings. The
first, used in instrumentation, interprets “linearity” as the degree to
which the DC transfer characteristic (from linear input code to output
parameter) corresponds to a straight line. However, “linearity” to the
audio engineer describes how the output amplitude at some given (nonzero) frequency matches that of the applied input amplitude. The two
should match exactly, and the deviation of measured output amplitude
from the ideal straight line is shown in this graph.
The output amplitude matches that expected from the input amplitude
within a tiny fraction of a dB from 0dB all the way down to −130dB.
The output
amplitude matches
the input amplitude
very accurately;
down to −130dB.
This is a very good
result.
32
3.17
CHAPTER 3. TECHNICAL MEASUREMENTS
Time Domain Response -90dB
Figure 3.18: Time Domain Response for Small Signal
The time domain
response resolves a
small signal (1LSB
at 16 bits) and has
a symmetrical
response.
This graph shows the Invicta response to a small, three-level signal
applied to the input. The signal is ±1LSB around zero at 16 bits.
Despite the small signal, the output is clearly resolved and the waveform
noise is low and the response symmetrical.
3.18. INTER-MODULATION DISTORTION TEST
3.18
33
Inter-modulation Distortion Test
Figure 3.19: Inter-modulation Distortion
Harmonic Distortion of a single input tone gives rise to spurious signals
at multiples of the input frequency. For example, a 1kHz signal will
generate a second harmonic at 2kHz, a third harmonic at 3kHz etc.
In an audio DAC, the bandwidth is limited, typically to 20kHz, and
so a simple test for harmonic distortion above 10kHz will not generate
visible errors: all the harmonics are 20kHz or more, hence outside the
bandwidth and not seen.
Although invisible to a single tone, harmonic distortion will “mix” (that
is, mathematically multiply) with any other signal in the input and can
be made to create in-band products that are visible. Specifically, the
third order products (such as 2f 1 − f 2 and 2f 2 − f 1) cause distortion
products adjacent to the frequencies f 1 and f 2, as are visible in the
graph above.
In the graph above, 19kHz and 20kHz tones are applied simultaneously and distortion products at 17kHz, 18kHz, 21kHz and 22kHz
are visible. These spurious tones show the distortion of the 19kHz
and 20kHz signals even though those distortion products are far out
of band.
Inter-modulation
products are small in
the Invicta, being
less than −120dB.
They are no more
than the distortion
products measured
at low frequencies.
34
3.19
CHAPTER 3. TECHNICAL MEASUREMENTS
Swept Frequency Low Level Noise Test
Figure 3.20: Frequency Sweep Noise Test
The noise level of
Invicta can be
explored as a filter
passes over a very
low level tone. Once
the filter moves off
the tone, the noise
drops quickly to a
low level indicating
a very low noise.
The noise of the DAC may be assessed by injecting a certain low level
signal and sweeping a narrow band filter through that signal. In the
ideal case, if the filter were perfect and the DAC had no noise, there
would be no output signal at all until the filter passed over the low level
signal frequency.
The results on this graph approximate that situation. In three cases
the input signal was −90dB and in one case the input signal was
−120dB. In all cases the peak signal is the expected one, either −90dB
or −120dB as input10 .
10
Refer to various articles in Stereophile magazine for a more detailed explanation
of this somewhat specialized test.
3.20. THD+N VS FREQUENCY (IN DB)
3.20
35
THD+N vs Frequency (in dB)
Figure 3.21: THD+N vs. Frequency (in dB)
Total Harmonic Distortion plus Noise can be conveniently measured if
a sharp notch (band reject) filter is placed over the input tone. The
filter will remove the input tone and the RMS value of everything out of
the filter then represents both the noise and any harmonics present11 .
If an input tone is swept across the audio band and a similarly swept
notch filter tracks that signal, then the output will be the THD+N vs
Frequency. This is the method used here and the resulting graph shows
how distortion and noise vary with frequency12 .
11
Because of this convenient method – namely the notch filter over the input tone
– THD+N is much easier to measure than THD on its own. This is why most audio
measurements report THD+N and not just THD.
12
This is an important test because certain forms of DAC may show an anomalously low THD+N in the 1kHz region where THD+N is conventionally measured.
The Invicta THD+N
never exceeds
−114dB for all
frequencies in the
audio band.
36
3.21
CHAPTER 3. TECHNICAL MEASUREMENTS
THD+N vs Frequency (in percent)
Figure 3.22: THD+N vs. Frequency (in percent)
The THD+N of the
Invicta is less than
0.0002% for all
frequencies in the
audio band.
THD+N is also commonly reported as a percentage figure. This was
appropriate when the state-of-the-art created THD+N numbers just
below the 1% figure, but today, since technology has improved, THD+N
in percent is less helpful: it has become a matter of carefully counting
the zeros before the significant fraction.
However, to be complete, this is the THD+N vs. frequency as measured
in percentage of the applied signal.
3.22. CROSS-TALK VS FREQUENCY
3.22
37
Cross-Talk vs Frequency
Figure 3.23: Cross-talk vs Frequency
Cross-talk is the undesirable tendency of one data channel (for example,
the Left channel) to “feed-through” or cross-talk into the other channel
(Right channel). This is an important parameter for those audio systems that recover the stereo information from certain compound signals
(such as the V-groove in a vinyl recording, or the multiplex signal in
an FM transmission), but in modern digital technology the data source
can be assumed to have a perfect separation of channels.
Measuring cross-talk in a modern digital system such as a DAC will
expose any failure in the design to retain this separation of digital data.
Cross talk in a modern system reflects a finite power supply rejection,
or a less than perfect arrangement of ground signals in the system.
The graph above shows cross-talk vs. frequency. Its slight rise suggests
a capacitive coupling; nevertheless, this measurement of no worse than
−130dB even at 20kHz is a good result.
Cross talk in the
Invicta is excellent:
it remains below
−130dB for all
frequencies.
38
CHAPTER 3. TECHNICAL MEASUREMENTS
Chapter
4
Notes on Audio Engineering
4.1
The Sense of Hearing
We have evolved the remarkable sense of hearing over millions of years.
Each of us has the ability to detect variations in pressure traveling as
waves in the air around us. The human ear is an astonishing sensor
of these sound pressure waves: the pressure difference may cause our
eardrum to move less than the diameter of a hydrogen atom, and yet
this tiny disturbance is accurately delivered to our conscious mind to
allow us to act upon it. The dynamic range of hearing is breathtaking,
being very much higher than the range of vision. The ratio of the
smallest perceptible energy to the highest tolerable energy is about
130dB, which is ten trillion to one or 1013 .
It is commonly thought that the human ear detects sounds in the frequency range of a few Hertz to 20kHz. This is supported by experiments
where test subjects are asked, “Can you hear this sound?” and 20kHz is
the highest frequency where a person with good hearing will report that
they can hear it. However, we now know that this is misleading: if a
subject is placed in a brain scanning device we can show that the brain
is responding to sounds up to about 50kHz.[3] It is simply that the
conscious mind is not aware of sounds above 20kHz but something in
the brain does register the higher frequencies. Although not presented
to the conscious mind as an audible tone, the presence or absence of
higher frequencies does have a measurable effect, and we may speculate
39
Experiments show
that the ear delivers
information to the
brain up to 50kHz,
not 20kHz as
commonly assumed.
40
The ear is an active
device: each hair of
the Cochlea that
responds to sound,
also has muscle cell
attached that the
brain uses to “tune”
and adapt the
hearing process.
Processing of
sounds takes place
below the level of
conscious awareness.
CHAPTER 4. NOTES ON AUDIO ENGINEERING
that this phenomenon is one source of the listener’s perception that a
system resolving these higher frequencies “sounds better” in listening
tests than one that renders only 20kHz of bandwidth.
Another common opinion now proved wrong, is that the ear is a passive
device similar to a microphone, faithfully translating sound pressure
into some internal format that the brain can use. In fact the ear’s
interaction with the brain is far more complex. The cochlear is an active
amplifying device[4, 5] consisting of at least two mechanisms: the socalled outer hair cells and the inner hair cells. The outer hair cells are
known to be adaptive, each has a little “motor”[6] attached that tunes
the reception and this is how the ear achieves its remarkable frequency
resolution - a resolution far higher than a set of simple resonators could
achieve[7]. We may speculate that the active nature of the hearing
process supports the conclusion that audiophiles have an ability to
sensitize their hearing, the brain taking an active role in the listening
process.
The sophistication of human hearing far exceeds that of other animals,
bats being a notable exception. Some animals hear higher frequencies.
Birds and frogs are known to posses specific neural processing of audio
signals to find mating calls buried in what would otherwise be random
noise. But the human sense of hearing is remarkable: the ear and
brain are one, perception arises in the higher evolved regions of the
brain where audio signals have been “spike encoded”[8] and filtered into
elemental representations of music and spoken words. It is likely that
the human ability to speak arises at this higher level where the mind is
working on significantly pre-processed signals. We may speculate that
music appreciation also operates at this higher level. An imperfection or
fault in rendition of recoded music will propagate up to this higher level
and be perceived as “something wrong” with the sound, but the detail
of that error has been suppressed by the unconscious pre-processing.
This will give rise to apparently meaningless assertions of the audiophile
such as, “I listen to the ’gaps’ between the sounds” or, “it is the noise
’behind’ the transient that is important”.
In these higher centers of the brain the sounds and sights are integrated
into one whole, and surprisingly perhaps, experiments show that the
eyes can effect the ears and cause the ears to “line up” the three dimensional audio image they create with the eyes[9]. This is no doubt why
audiophiles commonly close their eyes to appreciate fine music.
4.1. THE SENSE OF HEARING
41
The ear’s ability to resolve signals in time is equally remarkable: we can
easily calculate that a resolution angle of five degrees in sound location
corresponds to less the 50µS in time difference1 . Clearly, therefore, the
brain is able to process at least the difference in arrival time of audio
signals on a time scale significantly less than 100µS.
Given this degree of sophistication in our sense of hearing, we can only
marvel at the fact that audio engineers can record sound at all. Who
would imagine that the vibrations of a speaker cone, driven through
necessarily imperfect electronics, picking up a signal from a transducer
following a v-shaped scratch in the surface of a vinyl record would work
as well as it does? Who would imagine that a microphone could do a
tolerable job of transposing sound pressure into an electronic signal that
meets the quality level the ear expects? Perhaps, in fact, none of these
things (vinyl records, speakers, microphones) work well at all - perhaps
all the magic lies in the ear which extrapolates across errors, fills in imperfections and delivers to our conscious mind a remarkably consistent
audio picture where a great many “details” are actually psycho-acoustic
“patches” over an imperfect signal.
There is a great deal to support this latter hypothesis. The existence
of MP3 players essentially proves it: in MP3 encoding the sound signal is perversely distorted from its pure original, but the perversion is
carefully constructed to match the ear’s ability to extrapolate detail, to
fill in the missing structure. There can be no surprises, no unexpected
detail in MP3 music - they are simply not there. You will not be moved
to comment on fine detail in the MP3 playback, that detail is in your
head - your own ultra-sophisticated audio processing has cleaned up
the MP3 signal to an acceptable level.
However, there is an even more remarkable example of the pre-processing
power of the human ear. In our modern world we have moved on from
the outstanding technology of the Victorian era that brought us color
TV via electrons moving in the vacuum of a CRT tube, to the visually
more stunning (but technically lower resolution) image on Plasma or
LCD TVs. These new TVs appeal due to their flatness: we hang them
conveniently as we might hang a picture on our wall.
However, flat TVs do not provide enough room to include a quality
1
Assuming the speed of sound is 340m/s and the ears are separated by 15cm,
then for a 5◦angle resolution we have an additional path length of 0.013 = 0.15 ∗
sin(2π 5̇/360) meters which represents 0.013/340 seconds or 38µS.
The hearing process
is able to
extrapolate missing
details.
42
CHAPTER 4. NOTES ON AUDIO ENGINEERING
loud-speaker. The low end (sub 200Hz) response of a typical flat TV
loud-speaker is not just poor, it is almost completely absent. It is mechanically unable to re-create a sound less than 200Hz or so without
significant attenuation. To try to compensate for this, some early designs boosted the bass response causing the drive signal to rise as the
frequency rolled off. But this does not work - the speaker simply starts
to distort more and it is not a viable solution.
Certain forms of
“Bass Enhancement”
create acoustic
illusions that fool
the brain into
thinking tones are
present when they
are not.
The Audiophile, the
lover of fine music,
is able to attune his
or her hearing to a
degree above the
inexperienced
listener, and can
indeed hear
differences between
various DAC
technologies.
The solution that is now used in next-generation small loudspeaker design exploits the sophisticated pre-processing of the human ear. It is
found that when a low frequency signal of say 100Hz is presented to
a listener he will, of course, respond that he hears 100Hz. But astonishingly, if the fundamental of that 100Hz is removed, leaving only its
harmonics, the listener will still report that he hears 100Hz, despite
the fact that no signal at 100Hz is present! This is a testament to
the power of the ear and brain - something is profoundly wrong with
the signal received by the ear: it is missing its fundamental. But the
brain and ear “know” that it must be there because its harmonics are
present - and remarkably, below the level of the conscious mind, this
missing fundamental is added back into the signal and the conscious
mind hears the 100Hz signal2 . The TV DSP engine implements this
psycho-acoustic “trick” and creates appropriate harmonics to send to
the speaker. The speaker is not required to process any signal less than
about 200Hz, but the listener hears the sound of 100Hz or lower emerging from the speaker. It is a remarkable example in the audio domain
of a phenomenon used extensively in the video world: the electronics
is exploiting what is known of the brain’s processing of the senses and
this creates effective and commercially desirable home electronics.
All this understanding of the process of hearing should help us appreciate the audiophile: when he tells us that he can hear the difference between a sigma-delta modulator and a non-oversample DAC, we should
not be dismissive. It is likely that he is attuned to some subtle aspect
2
The knowledgeable reader will question this: how can the signal pattern from
the 100Hz with missing fundamental be distinguished from a signal of 300Hz (the
first harmonic actually present)? The answer is that it can because the relative
amplitude of the harmonics is different. The 100Hz with no fundamental has a tone
at 500Hz (its fifth harmonic) in addition to its 300Hz tone of the third harmonic.
But the real signal at 300Hz has no 500Hz component: its third harmonic (the first
one) is at 900Hz. The brain can apparently easily recognize and sub-consciously
sort out this difference. The 100Hz with no fundamental is perceived as 100Hz, the
300Hz is perceived as 300Hz, despite the fact they share a common 300Hz tone.
4.2. ABOUT COMMON DAC SPECIFICATIONS
43
of the hearing process that we may miss, and any amount of comparing
typical audio measurements (frequency response, THD, etc) may not
capture the distinction.
In fact, the typical technical measurements do not capture the subtleties. Many years of testing, many trials of various techniques have
taught us, here at Resonessence Laboratories, that second and third order effects (over an above the common measurements) are what make
a great audio DAC as opposed to a good audio DAC.
First we excel at the common specifications, then we endeavor to excel
in the areas that make a great DAC. We do not make devices that
exploit any psycho-acoustic artifacts, rather we aim to deliver to the
audiophile ear the most perfect rendition of the sound that is technically
possible. The audiophile does not listen to us - we listen and learn from
the audiophile.
4.2
Both is better:
technical excellence
and that attention
to the audiophile
that make an
outstanding DAC.
About Common DAC Specifications
Audio engineers strive to please the customer and deliver verified high
quality components to the discerning listener. To differentiate their
products (and perhaps justify a higher selling price), the engineer will
document the performance of the product using industry standard instrumentation. Consequently, specifications provided are those that
the instrumentation can measure: if the machine cannot measure it,
it cannot be listed in the technical specifications table. This is obviously scientifically justified, since otherwise the competition to create
the best audio devices would degenerate into matters of opinion rather
than of verifiable measurements.
But what is the best course of action when the audio engineer is persuaded that a scientifically verifiable difference (in double-blind testing)
does actually exist and that this does not correlate to any technical
measurements? This is a difficult situation since this difference between the good and the excellent audio product cannot be reduced to
a specification. Are we simply to trust that the respected customer
(or reviewer) has no bias and does posses the hearing acuity needed
to appreciate our products? The answer, in the current state of the
measurement art, is yes - that is exactly what we are going to do - the
final judgment lies in the ear of the audiophile.
Read the
Specifications, but
then listen to the
Invicta through your
favorite amplifier or
headphones.
44
CHAPTER 4. NOTES ON AUDIO ENGINEERING
However, Resonessence would like to promote development of the audio
measurement art and to this end share our current understanding of
where technical measurements may fail to capture the audiophile’s perception of quality. Please be assured that the following notes on why
these technical measurements may fail to do justice to the listener is in
no way designed to justify a less than perfect technical measurement
of the Invicta DAC: you will find the Invicta to excel in the technical
measurements.
The decibel is a
logarithmic unit and
is one tenth of a
bel, which indicates
a factor of 10 in
power.
dB = log10 (P101/P 2)) .
4.2.1
Decibels (dB) in Audio Measurements
The range of sounds that the human ear can perceive is staggering.
The loudest sound (which is painful) has more than 1,000,000,000,000
times more energy that the quietest sound (which is just perceptible in
ideal conditions). For such a large dynamic range a logarithmic scale
is appropriate and audio engineers use a term developed in the early
20th century called the “decibel”, which is one tenth of a “bel”. A
“bel” is never used on its own, even from its earliest conception, the
decibel (a tenth of one bel) was proposed as the basic unit since this
was approximately the loss in signal over one mile of telephone cable
and was thought to be the minimum change in amplitude that a listener
would notice. One bel is a ratio of ten to one, and so one decibel is a
ratio of 100.1 in power.
Given that one decibel (dB) is a tenth of the logarithm of the power,
when we review a graph showing performance of an audio system we
can immediately conclude that power changes by a factor of ten for
every ten decibels. For example, should we decide to listen to our
favorite rock band at 0dB and then to our favorite classical guitarist
at −40dB, the difference in energy delivered to our ear is 10,000 to 1,
because −40dB is a ratio of 1040/10 or 104 or 10,000 to 1. And −40dB
is not that quiet: unless we have ruined our ears in early life actually
listening to rock at 0dB 3 , we will be able to hear to maybe −90db,
which is an energy ratio to the 0dB rock band of 1,000,000,000 to 1.
In the electronic system, the voltage (which is usually the parameter processed as analogous to the displacement of the microphone and
speaker diaphragm in the electronic representation of music) encodes
not the energy, but the square root of energy. Consequently, when the
3
Which the author, sadly, has done.
4.2. ABOUT COMMON DAC SPECIFICATIONS
45
audio engineer considers decibels he has in mind that 20dB (not 10dB)
corresponds to a factor of ten in voltage. This means that when the
audio DAC is processing, for example, 0dB as 1V rms, it will process
−40dB as one hundredth of 1V rms or 10mV rms. We may rightly
conclude that in order to achieve the −130dB DNR of the Invicta, the
4V rms 0dB output must have a voltage noise of less than 1.25µV rms
since this is 4 ∗ 10−130/20 .
In audio measurements of a DAC such as the Invicta, dB, a dimensionless unit is expressing the ratio to the full scale that the DAC can
produce. Full-scale is 0dB and −20dB is one tenth of the full scale voltage which, when applied to your headphones or speakers, will produce
1/100 of the energy that full scale would produce.
4.2.2
dB’s can be
confusing: they
actually refer to
power and ten of
them make a factor
of ten in power level.
But electronic audio
devices process volts
and energy is volts
squared, so in volts
it takes 20dB to
make every factor of
ten!
Dynamic Range
This parameter attempts to capture the ratio of the loudest signal to
the quietest signal. The loudest signal is limited by the electronics to
a certain voltage, it may be as much as 4Vrms. The quietest signal is
limited by noise within the electronics and may be as little 1µ Vrms.
Dynamic Range is commonly specified by the acronym “DNR”.
There is a “trick” that certain audio devices employ to reduce the noise
and hence improve the dynamic range: the electronic system monitors
the signal level, and when it detects silence, it shuts down certain noise
making elements in the system and a technical measurement will show
a very low noise. However, this “muting” of components is judged to
be an unfair comparison since the silence may be “in the background,
behind” a musical element in the program. If the electronic system was
unable to enter this “shutdown”mode, what then would be the dynamic
range? Surely this more accurately represents the listeners perception.
Consequently, in order to prevent a spurious shutdown in those devices
(which are admittedly pretty rare these-days) the DNR test is done
in the presence of a small (−60dB) tone at 1kHz. The measurement
equipment removes this small tone and adds up all the other energy
in the signal and reports this sum, in ratio to the 0dB signal, as the
Dynamic Range.
Dynamic Range is a
measure of the
signal to noise that
you could, in
principle, if you had
perfect hearing, hear
in the presence of
music. If the brain
succeeds in listening
to the “gaps” (to the
silence between the
music) this is the
noise level it would
hear.
46
CHAPTER 4. NOTES ON AUDIO ENGINEERING
4.2.3
Signal to Noise is
something of an
abstraction: it is not
necessarily what you
can hear in any
music program. It is
simply the degree to
which the system is
silent when no
music is playing.
The Invicta does not
use any tricks to
artificially improve
SNR.
Signal to Noise Ratio
This parameter attempts to capture the ratio of the loudest signal to the
quietest signal in a similar way to the Dynamic Range measurement.
But unlike DNR, Signal to Noise is assessed by simply measuring the
output with no signal applied and expressing this as a ratio to a reference level – in the case of a DAC, the reference level is full-scale. Signal
to noise is commonly specified by the acronym “SNR”.
Note that if the device is employing some sort of muting, this may
activate and make the SNR appear very high. It should be said that
the muting trick is not entirely without merit, since it will reduce any
hiss from speaker when the volume level is loud and the music (vinyl,
tape or CD) has finished playing.
Given this description, you may well be surprised to see that the Invicta
has an SNR that slightly exceeds its DNR: does this imply it uses a
muting trick to reduce noise? The answer most assuredly is no - no
such muting trick is employed. The Invicta and other high performance
audio devices have a very high dynamic range and that dynamic range
is limited by a phenomenon that causes the noise floor (as measured
with no signal) to rise slightly in the presence of a signal.
This phenomenon comes from two sources. The first is the noise shaping loop of the ESS Sabre DAC itself. It, like all noise shaping loops, is
a strongly non-linear device (non-linear in the mathematical sense, bordering on the chaotic) and the noise characteristic differs very slightly
with signal level: the noise is slightly lower from the ESS Sabre DAC
when it has no signal to process. This reduced noise is accurately delivered to the XLR connectors on the back of the Invicta because we
take great care to introduce the absolute minimum of additional noise
in the signal path. Our signal path noise is so low that the Sabre DAC
noise change is visible in the specifications.
Another source of noise in the presence of the signal only becomes
apparent at very low noise levels and that is due to the finite gain of
the op-amps used in the signal path. As the op-amp is forced to deviate
from equilibrium to drive its own internal dominant pole capacitor (and
perhaps the output load), its own noise level can rise. However, we see
no evidence of this second source of noise in the Invicta4 .
4
Probably because the ADI797 op-amp used in the signal path has a DC bootstrapped compensation capacitor (and it has an additional AC-coupled feedback
4.2. ABOUT COMMON DAC SPECIFICATIONS
4.2.4
47
Frequency Response and Slew Rate
To what degree can the sound pressure waves that we hear be translated
into electronic form and reproduced? To answer this question in its
most basic sense requires us to understand the limitation of any system
that attempts to process the analog of a “real-world” parameter in some
other domain. This rather grand-sounding assertion is not difficult to
understand if we break it down into its component parts. An example
will help.
Suppose (prior to our high-tech world where we may make a phone call)
that we want to know the temperature on an island a few miles from
our research base on the mainland. To do this, we employ an attendant
on the island and give him a flag that he may set to a certain height on
a flag-pole that we can just see from the base. We tell our attendant
that the lowest point on the flag pole is to represent zero degrees (0◦C)
and the highest point is to represent one-hundred degrees (100◦C).
Each day he sets the flag to the appropriate height and we, being able
to see it from our base, can then know the temperature on the island.
The height of the flag has become analogous to the temperature: the
height is an analog of the temperature. It is the height we see, not the
temperature itself, but since the height is analogous to the temperature,
we can note the temperature on the island.
Where does this system of making an analog of the “real-world” parameter (temperature) in the other domain (height of the flag) fail,
and what artifacts is it prone to experience?
It should be obvious where the first problem may lie: what if the temperature goes to -10◦C? This is beyond the range of the analogous
quantity and the system fails. Similarly above 100◦C. This primary
failure mode contributes to limited dynamic range. But another potential failure relates to how quickly the flag can be raised or lowered.
It should be no problem to get a temperature reading each day: the
attendant can easily set the flag once each day, but what if we need to
know the temperature every ten seconds?
Asking for the temperature every ten seconds causes a problem because
it is difficult for the attendant to raise and lower the flag so frequently.
Hence there is a frequency limitation in this analogous system - it
path) that vastly reduces the deviation from equilibrium in the input pair of JFETS.
Frequency response
and Slew rate are
explained by analogy
to a simple system
in this section.
48
CHAPTER 4. NOTES ON AUDIO ENGINEERING
cannot communicate changes in the temperature that occur faster than
the attendant can raise and lower the flag. Any variation occurring on
a timescale less than about ten seconds is not capable of representation
in the flag height system due to a bandwidth limitation.
Analog systems
exhibit a non-linear
phenomenon called
Slew Rate limiting.
It can appear as an
amplitude
dependent frequency
response and the
human ear may be
able to detect this
imperfection.
Note that this has nothing to do with the system being digital: this
is a analog system we are discussing here. There is no encoding of
the height into a number, no discrete time at which the attendant can
operate—in principle he can continuously adjust the height of the flag
to any arbitrary accuracy. This is an analog system, but clearly it has
a finite bandwidth.
But that is not all: what exactly prevents the attendant being able to
change the flag every ten seconds? We can imagine that it is due to
the need to pull the rope as quickly as possible from one height to the
next, and no matter how he tries, that rope can only move through his
hands at a certain speed. This gives rise to an interesting phenomenon
called “slew rate limitation” that makes frequency response (in an analog system) a non-linear parameter. If asked how quickly he can signal a
change in temperature the complete answer is this: if required to move
just a few centimeters, as will be the case if the temperature changes a
little, he can probably move the flag as fast as once every two seconds.
But, if asked to move the flag over five meters or so, much further than
before, he can change the flag only every ten seconds.
The frequency response in therefore non-linear: it depends on how
large a change we are considering. In the realm of electronics there is
a strong tendency when asked, “What is the bandwidth of your system?”, to answer with what is more accurately called the small-signal
bandwidth—that bandwidth where the flag need move only a little in
our analogy. Any deviation from this bandwidth due to large signals is
referred to as “slew-rate limitation”5 .
These two parameters, bandwidth and slew rate, are available for all
op-amps produced today and the op-amp manufacturer expects the
engineer to realize that the op-amp will not in fact show the bandwidth
5
In fact, the situation is even a little more abstracted than this suggests. The
small signal bandwidth is that bandwidth that would be present with an infinitesimally small signal—a mathematical abstraction due to the CAD (Computer Aided
Design) tools used when designing a circuit. SPICE, the common design tool, performs AC analysis using a linearized model. True bandwidth analysis must use a
less commonly available, but more advanced, method called Periodic Steady State
(PSS) analysis.
4.2. ABOUT COMMON DAC SPECIFICATIONS
49
specified in the presence of large signals where slew-rate limitation is
dominant.
In audio equipment, if an input signal of fixed amplitude is swept from
10Hz to 50kHz and the output signal amplitude measured vs. this input
frequency, then surely we have captured the frequency response of our
audio device. Indeed we have, and it is likely that the bandwidth was
around 20kHz. But we may ask this: when the bandwidth started to
roll-off, was this due to the generation of harmonics at 40kHz, 60kHz
etc. (the multiples of the input signal) or did the output signal reduce
in amplitude without generating harmonics?
If it was the former case, that is, if harmonics were generated, then we
are likely suffering not from limited bandwidth per-se, but from slew
rate limitation. In this case it is almost certain that the bandwidth
is not independent of the signal amplitude: it will appear higher for a
lower input signal6 .
Consequently, two systems of equal bandwidth, at a given signal level,
may differ in detail. One may show a bandwidth limitation independent
of amplitude and generate negligible distortion even as the bandwidth
rolls off. The second system may show a variation of bandwidth with
signal amplitude and generate harmonic content as the bandwidth rolls
off. Given our increasing understanding of the human ear, it is almost
certain that the audiophile will hear these systems that have the same
technical specification of bandwidth, differently7 .
6
Even this is not as clear as it may be and a full analysis must ask: “How did
you measure the output signal when you were sweeping the input?”. If the output
signal amplitude was measured only at the input frequency, then the energy in the
harmonics was not considered. We may well ask, “How does the ear perceive a finite
bandwidth?”. It may perceive an attenuation as the ratio of the output signal to the
input signal at that given frequency, but it may perceive attenuation as the ratio of
total energy output (including harmonics) to the input energy.
7
Again, the knowledgeable reader will question this in at least two aspects.
Firstly, surely this analysis is flawed since the system with a bandwidth dependent
on amplitude will show a higher distortion and therefore a true A-B comparison of
this phenomenon is not possible: the posited systems must differ in distortion specification and hence how can they be a fair comparison for the bandwidth issue? The
answer is that in an audio system, distortion is specified up to a certain bandwidth.
For example, the sum of the energy in harmonics up to 22kHz is compared to the
fundamental and this is reported as the THD (Total Harmonic Distortion). Despite
the name, this is only the “total” up to a given bandwidth, not the true total. Also,
commonly, the THD test is done at 1kHz input signal. In a digital system, THD can
be the true total due to the phenomenon of aliasing, but in an analog system, those
high harmonics can go unaccounted for in THD. And, for this particular case of lim-
Slew Rate induced
distortion may not
show up in the
output of the
system as distortion,
but it does begin to
roll-off the in-band
fundamental.
Consequently, it
makes a non-linear
(amplitude
dependent)
frequency response.
50
4.3
CHAPTER 4. NOTES ON AUDIO ENGINEERING
Fourier Analysis
Fourier Analysis is the use of a procedure that takes a signal expressed
in time and transforms it to one expressed in frequency. This “Fourier
Transform” is but one of a class of similar mathematical transforms that
can change the representation of something reversibly from one form
to another. Fourier transforms are common in audio applications. We
may ask about the amplitude of our music, its start and stop time and
so forth. These are all parameters of its expression in the time domain.
It is interesting also to ask about its lowest frequency component, its
highest frequency component and so forth; these are parameters of its
expression in the frequency domain. In other words, of its Fourier
transform.
This section
describes a simple
analogy to Fourier
Analysis.
Fourier transforms may be appreciated by a simple analogy. Imagine
that the consumption of electricity in New York was recorded every few
minutes by the utility company for a period of some years. This electricity consumption record could be analyzed and a surprising amount
could be learned. For example, we could ask, “What is the variation
of electricity consumption in each day?”. The daily variation would
be significant as lights come on in the evening and meals are cooked.
We could ask, “What is the variation of electricity consumption per
week?”. The weekly variation would show the difference of weekend
consumption. Similarly, the yearly variation would show the temperature since heaters are on more in the winter. It is possible that evidence
for global climate change would be present in the year to year variation.
This method of asking, “What component in this data changes every
day/week/year?”, is Fourier analysis: the representation of the data as
the amplitude of cycles of various lengths.
It is well known (and has been since the early 19th century) how to
find the components of any frequency in any data set, but a particularly
efficient means to rapidly search for all frequency components at the
same time, did not come into general use until the mid 1960’s and the
ited bandwidth, the harmonics are always high, since the bandwidth is presumably
somewhere near 20kHz at least. Secondly, what meaning do higher harmonics above
the bandwidth have—the bandwidth is limited (that’s the whole point) and this removes them does it not? Actually, not necessarily. It depends on where in the signal
chain the slew-rate limited bandwidth is occurring. It can be that the output stages
are not slew-rate limiting, but the earlier stages are. In this case the harmonics of
the slew rate limiting element are passed to the headphones or speakers, and despite
being higher frequency, we now know the brain perceives them at some level.
4.3. FOURIER ANALYSIS
51
advent of digital computers8 .
Certain parameters, frequency response is the obvious one, are clearly
descriptions of the frequency domain representation of a signal, but
others, such as distortion, are best appreciated in the frequency domain as well9 . Distortion in the time domain is a deviation from the
ideal amplitude that varies with the amplitude itself. Distortion in the
frequency domain is conveniently collected into multiples (harmonics)
of the fundamental signal and so is easy to appreciate, visualize and
compare.
Analysis in the
Frequency Domain
is essential to
uncover artifact and
quality issues in an
Audio system...
Having explained the significance of Fourier Analysis, it is probably a
surprise to realize that the graphs that we see (including the ones presented in this document) are not the Fourier Transforms of the signal!
They cannot be, because in the frequency domain a signal is not a real
quantity: it becomes a complex quantity (in the mathematical sense)
having both phase and amplitude. The graphs we produce on the measurement machines, and print in documents such as this one, are just
the amplitude component of the complex quantity at that frequency.
The absence of phase information in the plots we see makes it impossible
to correlate the perceived clarity of the music, its tone, precision and
“warmth” with the graphs. One system that may sound pleasing to
the ear may have a certain pattern of harmonic content (as from a
tube amplifier) identical to another system, but the second system may
sound bad. This is because the frequency plots do not show the relative
phases of the harmonic content.
The situation is even further compounded by the fact that the phase
may vary non-linearly with amplitude of the signal, and it may not
even be a “static” quantity: it conceivably may vary with time10 which
8
This “invention” of what is called the Fast Fourier Transform (or just FFT)
has occurred at least two times in recent years and neither was actually new. It is
remarkable to note that FFT, as it is called today, was known to Gauss (a brilliant
German mathematician 1777—1855) in 1805.
9
Noise is interesting since it can be appreciated in both the time domain and
frequency domain in just about the same way: as a random deviation around the
zero point.
10
This suggestion, that the phase of a given harmonic may vary with time, may
sound unlikely, but a pleasing Guitar amplifier exhibits a “collapse” (voltage drop)
of the tube based rectifier circuit when a large power output is called for. The power
supply recovers over many milliseconds and during that time the tube amplifier is
undoubtedly experiencing a changing frequency response which will translate into a
time dependent phase shift.
... but bear in mind
that a Frequency
Domain plot is not
the whole story: no
phase information is
present.
52
CHAPTER 4. NOTES ON AUDIO ENGINEERING
the brain is likely to interpret as a modulation of the distance to the
sound source.
Instrumentation based on high performance ADCs gathering a record
of data can preserve both phase and amplitude and further can capture
the time dependent aspects. Instrumentation based on a swept filter
and RMS meter cannot capture phase or time variation.
4.4
Switching power
supplies are low cost
and efficient – but
they are virtually
impossible to use in
noise sensitive
applications because
they radiate
electro-magnetic
energy with high
slew rate and high
frequency.
Switching and Linear Power Supplies
The cost and weight of “magnetics”, that is inductors and transformers,
can be relatively high, particularly when the frequency at which they
operate must be low. Classically, a power supply operating at 50Hz
(the mains supply in Europe for example) needs to be relatively large,
heavy and expensive. How much better power supplies could be if they
could run at a rate of 100’s of kHz. Indeed they would be better: the
faster that the circuit operates the less the size, the lower the cost of
the magnetics that it needs. Hence the commercial pressure to develop
a new kind of power supply: the switching power supply.
All new things win in the market place when they have just sufficient
functionality, and crucially, lower price. But if they can add a benefit
at the same time, then their adoption will be rapid. A switching power
supply manages all three and its additional functionality is the ability
to operate from 115V to 250V without user intervention.
In consumer electronics the art and manufacture of switching power
supplies is so advanced that rarely does a manufacturer bother to design
a new one. Stock switching power supplies in consumer electronics are
today a commodity item provided by the subcontractor: you may have
your product assembled in the Far East and the contractor will provide
his own low cost power supply for your product.
Switching power supplies have enabled low cost, good quality consumer
audio and, together with Class-D chips, a 7.1 surround sound home
theater may be purchased for less than the price of the early DVD
players.
Why, then, not use a Switching Power Supply every time? Sadly, the
very things that enable the switching supply to work, namely high
operating frequency, good efficiency and low cost magnetics, prevent its
4.5. AN INVICTA FROM 1935
53
use in high precision, very low noise circuits. The high frequency aspect
radiates electro-magnetic noise in the vicinity and the high efficiency
means fast slew rates and high currents, which again contributes to
high emissions. The unit may be enclosed in a metal box, the IO may
be inductively snubbed, but experience shows that despite great efforts,
the noise will somehow break out and be detectable in the low noise
circuity.
For all these reasons, Resonessence uses conventional, low operating
frequency (mains frequency) magnetics. Still decoupled with series inductors, and smoothed with vastly over specified capacitors11 , the linear power supply feeds high performance linear regulators to distribute
power12 .
4.5
An Invicta from 1935
It seems that the name “Invicta” has been used for an electronic audio
device for many years. In approximately 1935 the name was used on a
tube (valve) radio, notable because of its use of eight preset stations.
Figure 4.1: Tuning window of the “Invicta” 1935 tube radio
This example of the Invicta is from the Amgueddfa Ceredigion Museum
11
Because electrolytic capacitors are the weak spot in long term life
But even these high performance regulators are not sufficient: they are supported with discrete and additionally filtered devices that handle the primary current flow. The off-the-shelf high performance regulator chip is used for its internal
reference, current limit and closed loop controller only.
12
Invicta uses
enhanced linear
power regulation for
the lower noise
possible.
“Invicta” has been
used as the name of
electronic audio
devices before: it is
visible on this 1935
tube radio.
54
CHAPTER 4. NOTES ON AUDIO ENGINEERING
in Aberystwyth, Wales. Resonessence Labs express their thanks to J
J Danks (Jez) of the Aberystwyth Museum for kindly providing access
and photographs of the 1935 Invicta13 .
Electronic
components have
changed beyond all
recognition since
1935 but, even
today, the circuits
designed by the
pioneers of radio are
still used.
Tube radios, such as
the Invicta pictured
here, used amplifier
configurations in
tube technology
that are in use as
transistor
configurations today.
Figure 4.2: The Invicta tube radio from 1935
13
Resonessence Labs has no connection to the manufacturer of this radio, but we
were pleased to see that the name “Invicta” was associated with an electronic device
as long ago as 1935.
Chapter
5
System Components
5.1
Inside the Invicta
Digital and Analog
sections inside the
Invicta are carefully
separated. Metal
walls prevent
electro-magnetic
coupling.
Figure 5.1: Invicta Internal Components
55
56
CHAPTER 5. SYSTEM COMPONENTS
• Invicta uses a linear power supply and a toroidal transformer.
This helps to reduce induced noise and ensures that any high current paths are, at most, moving at the mains supply frequency.
The toroidal transformer helps contain any electro-magnetic fields
generated. All the capacitors are over-specified in order to increase lifetime and each regulator chip is noise-reduced by addition of a discrete buffering stage such that power supply currents
actually flow in well-controlled discrete devices.
The analog signal
paths are separated
onto small,
individual boards.
Ground currents for
each board (XLR,
Headphone etc.) are
managed separately.
Figure 5.2: Analog boards
• To maintain the performance of the ESS Sabre DAC, its power
supply is generated locally on a separate board. This is key to
management of ground currents and power supply induced noise.
On that same board, amplification and signal conditioning circuits associated with the particular function (XLR or Headphone)
are assembled in a crafted current environment. Supply, ground
and signal currents are managed separately – a ground plane is
not used, but a flooded area on the board is present to define
boundary conditions for any electro-magnetic induction. To a
first order, no current flows in this flooded area1 .
• The digital engines of the Invicta are a series of MicroBlaze2 soft
processor cores instantiated as needed in the Invicta FPGA. The
cores run independently and microcoded routines handle all user
1
Experience teaches that the ground plane is not used to carry any DC currents:
these DC currents are sufficient to induce ground coupling at measurable levels.
Rather, it is better to provide discrete traces on the board to mange current flow
precisely and leave the “ground plane” as a magnetic and electric field shield.
2
“MicroBlaze” is the name for the Xilinx soft processor core created within the
multi-million gate FPGA of the Invicta.
5.1. INSIDE THE INVICTA
57
IO and rear panel interfaces. Critical audio paths in the digital
engine are “hardcoded” meaning that the bit widths, truncation
errors and so forth are all managed.
• Invicta uses an OLED (Organic Light Emitting Diode) display
to reduce noise. The more common VFDs (Vacuum Fluorescent
Display) are bright and clear, but require a relatively high drive
voltage and switching speed which tend to radiate noise. OLED
displays operate with low level signals and experience shows that
noise can be managed more effectively with this type of display.
• The master clock of the Invicta is a precision, ultra-low phase
noise oscillator. The precise phase and frequency relationships
of these clocks to the audio stream is crafted to best exploit the
Asynchronous Sample Rate Converter in the ESS DAC. The resulting audio signal actually exceeds the performance of the industry standard measurement machines as verified by an ultrahigh performance ADC. This graph shows non-A-weighted (wideopen bandwidth to 96kHz) THD+N of the ES9018 in the Invicta
vs. the outstanding AP2722 signal generator.
Figure 5.3: Invicta ES9018 compared to Audio Precision AP2722
The clock (timing
source) is critical.
Although the Sabre
DAC has on-chip
re-synchronization
to its master clock,
higher performance
can be achieved by
controlling the
relative phase of the
system and the DAC
clocks.
58
CHAPTER 5. SYSTEM COMPONENTS
5.2
Notes on Components
Passive components can easily be overlooked. They seem insignificant
compared to the complexity and time taken to construct the DAC,
USB or Micro-Controller but, it would be a mistake to underestimate
the impact that a poor choice in passive components can have.
Modern specialist
Surface Mount
Components have
the performance
needed for Invicta
and they have less
inductance, and
hence, lower noise
than through-hole
components.
The first high quality audio products were characterized by throughhole high performance passives: typically the German WIMA capacitors
were used and they did indeed justify the excellent reputation that they
acquired. Non-inductive resistors were a necessity and the skilled audio
engineer could pass judgment on a design before even turning it on – he
simply visually inspected the board and saw if the manufacturer knew
what he was doing3 .
The Invicta uses surface mount components. These are not common
surface mount, but specially selected low inductance and high linearity
versions. For example, a common surface mount capacitor would ruin
the THD, but the special high linearity types do have the performance
needed.
3
Even the DAC’s had a certain look to them: a 28 pin TSSOP or similar became
associated with high quality. The outstanding ESS Sabre DAC did not fit this
pre-conception and it was initially dismissed as unlikely to succeed. That has now
changed; the ESS Sabre DAC is the acknowledged leader in DAC technology.
Chapter
6
Specifications
These specifications are a summary of the data collected and presented
in Chapter 3, the Technical Measurement section.
Figure 6.1: Invicta Dimensions
59
These specifications
are a summary - you
may refer to the
detailed results in
Chapter 3.
60
CHAPTER 6. SPECIFICATIONS
Specification
General
Value
Width
Depth
Height
22.0 (8.66)
28.2 (11.10)
5.0 (1.97)
4.4 (1.73)
2.9 (6.4)
110 - 130
220 - 250
1.0
30
WAV, AIFF
Weight
Operating Voltage
Fuse Rating
Power Consumption
SD Card File Format
Units
cm (in)
cm (in)
cm (in)
cm (in)
kg (lb)
V AC
V AC
Amp
Watts
Notes
Including feet
Without feet
60Hz, 115v setting
50Hz, 230v setting
Fast, 250V, 1.25in
Up to 192kS/s, 24bit
XLR Output
Amplitude
Impedance
Distortion + Noise
Dynamic Range
Frequency Response
4.6 ±5%
156 ±1%
< -110
< 0.00032
> 125
−0.25
−1.0
−3.0
Vrms
Ω
dB
%
dB
dB
dB
dB
2.3 ±5%
78 ±1%
< -110
< 0.00032
> 120
−0.25
−1.0
−3.0
Vrms
Ω
dB
%
dB
dB
dB
dB
5.1 ±5%
1.0 ±1%
< -100
< 0.001
> 118
−0.25
−1.0
−3.0
Vrms
Ω
dB
%
dB
dB
dB
dB
At 0dB volume
1kHz
A-weighted
at 20kHz 44.1kS/s
at 50kHz 192kS/s
at 80kHz 192kS/s
RCA Output
Amplitude
Impedance
Distortion + Noise
Dynamic Range
Frequency Response
At 0dB volume
1kHz
A-weighted
at 20kHz 44.1kS/s
at 50kHz 192kS/s
at 80kHz 192kS/s
Headphone Output
Amplitude
Impedance
Distortion + Noise
Dynamic Range
Frequency Response
At 0dB volume
1kHz unweighted into 60Ω
A-weighted
at 20kHz 44.1kS/s
at 50kHz 192kS/s
at 80kHz 192kS/s
Bibliography
[1] Julian Dunn and Ian Dennis
The Diagnosis and Solution of Jitter-related Problems in Digital
Audio Systems
http://www.nanophon.com/audio/diagnose.pdf
[2] Martin Mallinson and Dustin Forman
Technical Details of the Sabre Audio DAC
http://www.esstech.com/PDF/sabrewp.pdf
[3] Tsutomu Oohashi et al
Inaudible High-Frequency Sounds Affect Brain Activity: Hypersonic Effect
American Physiological Society, Journal of Neurophysiology,
June 2000 vol. 83 no. 6 3548-3558. Available on line as
http://jn.physiology.org/content/83/6/3548.full
[4] Dallos, P., Popper, A. N. & Fay, R. R The Cochlea Springer, New
York, 1996.
[5] Kennedy et al
Force generation by mammalian hair bundles supports a role in
cochlear amplification
Nature, vol 433, 24 February 2005, p 880 Summary available at
http://www.ncbi.nlm.nih.gov/pubmed/15696193
[6] Zheng et all
Prestin is the motor protein of cochlear outer hair cell
Nature, vol 405, 11 May 2000, page 149. Document available at
http://www.columbia.edu/cu/biology/courses/w3004/Recitation_8.pdf
61
62
BIBLIOGRAPHY
[7] Y. Bitterman et al
Ultra-fine frequency tuning revealed in single neurons of human
auditory cortex
Nature, vol 451, 10 January 2008, page 197. Summary available
at
http://www.ncbi.nlm.nih.gov/pubmed/18185589
[8] Evan C. Smith and Michael S. Lewicki
Efficient auditory coding
Nature Vol 439, 23 February 2006, page 978. Document available
at
https://camtools.cam.ac.uk/access/content/group/
d4fe6800-4ce2-4bad-8041-957510e5aaed/Public/
3G3/SmiLew_Nature_06.pdf
[9] Norimichi Kitagawa and Shigeru Ichihara
Hearing visual motion in depth
Nature Vol 416, 14 March 2002, page 172. Document available at
http://wexler.free.fr/library/files/
kitagawa%20(2002)%20hearing%20visual
%20motion%20in%20depth.pdf