1
GeoLogik Software’s
GeoLogik TRT
User manual
Thermal Response Test Analysis Software
05/2011
END-USER LICENSE AGREEMENT
FOR GEOLOGIK SOFTWARE’S TRT Software
IMPORTANT-READ CAREFULLY
This GeoLogik Software GmbH End-User License Agreement (“EULA”) is a legal agreement between you (either an individual or a single entity) (“LICENSEE”) and
GeoLogik Software GmbH for the software product(s) accompanying this EULA, which include(s) computer software and may include "online" or electronic
documentation, associated media, and printed materials ("SOFTWARE PRODUCT").
By installing, copying, or otherwise using the SOFTWARE PRODUCT or any UPDATES (as defined below), you agree to be bound by the terms of this EULA. If you do
not agree to the terms of this EULA, do not install, copy, or use the SOFTWARE PRODUCT, and promptly return the entire unused SOFTWARE PRODUCT to your
place of purchase for a full refund.
In addition, by installing, copying, or otherwise using any updates or maintenance releases that you have received as part of the SOFTWARE PRODUCT
(''UPDATES''), you agree to be bound by the additional license terms that accompany such UPDATES. If you do not agree to the additional license terms that
accompanies such UPDATES, you may not install, copy, or use such UPDATES.
SOFTWARE PRODUCT LICENSE
Copyright laws and international copyright treaties, as well as other intellectual property laws and treaties protect the SOFTWARE PRODUCT. The SOFTWARE
PRODUCT is licensed, not sold. The SOFTWARE PRODUCT consists of product documentation, sample applications, tools and utilities, and miscellaneous technical
information, (individually identified as "COMPONENT" and collectively as "COMPONENTS"). The rights regarding the COMPONENTS of the SOFTWARE PRODUCT
are described below unless otherwise indicated.
1. GRANT OF LICENSE. GeoLogik Software GmbH grants to you as an individual a personal, nonexclusive, nontransferable license to make and use copies of the
SOFTWARE PRODUCT in the manner provided below. If you are an entity, GeoLogik Software GmbH grants to you the right to designate one individual within your
organization to have the right to use the SOFTWARE PRODUCT in the manner provided below. You may use this SOFTWARE PRODUCT on a networked system
provided that the number of SOFTWARE PRODUCT users on the network at one time does not exceed the number of licensed copy(ies)of the SOFTWARE
PRODUCT. GeoLogik Software GmbH retains title and ownership of the SOFTWARE PRODUCT or any copy.
2. COPY RESTRICTIONS. This SOFTWARE PRODUCT and the accompanying COMPONENTS are copyrighted. Unauthorized copying of the SOFTWARE
PRODUCT, including any part of the SOFTWARE PRODUCT that has been modified, merged, or included with other software, or of the COMPONENTS is expressly
forbidden. You may be held legally responsible for any copyright infringement that is caused or encouraged by your failure to abide by the terms of this EULA. Subject
to these restrictions, you may make one (1) copy of the SOFTWARE PRODUCT solely for backup purposes. You must reproduce and include the copyright notice on
the backup copy. You may not copy the printed materials accompanying the SOFTWARE PRODUCT, or print multiple copies of any user documentation.
3. USE RESTRICTIONS. As the LICENSEE, you may use the SOFTWARE PRODUCT on one computer at one time and place. You may not distribute copies of the
SOFTWARE PRODUCT to others. You may not modify, adapt, translate, reverse engineer, decompile, disassemble, or create derivative works based on the
SOFTWARE PRODUCT. You may not modify, adapt, translate, or create derivative works based on the written materials without the prior written consent of GeoLogik
Software GmbH.
4. TRANSFER RESTRICTIONS. This SOFTWARE PRODUCT is licensed only to you, the LICENSEE, and may not be transferred to anyone without the prior written
consent of GeoLogik Software GmbH. Any unauthorized transferee of the SOFTWARE PRODUCT shall be bound by the terms and conditions of this EULA. Enabling
others to use your registration code(s) or serial number(s) is strictly prohibited. In no event may you transfer, assign, rent, lease, sell, or otherwise dispose of the
SOFTWARE PRODUCT on a temporary or permanent basis except as expressly provided herein.
5. TERMINATION. This EULA is effective until terminated. This EULA will terminate automatically without notice from GeoLogik Software GmbH if you fail to comply
with any provision of this EULA. Upon termination you shall destroy the written materials and all copies of the SOFTWARE PRODUCT previously licensed to you.
6. UPDATES AND UPGRADES. GeoLogik Software GmbH may create, from time to time, updated versions of the SOFTWARE PRODUCT. At its option, GeoLogik
Software GmbH will make such updates available to the LICENSEE. If the SOFTWARE PRODUCT is being licensed to you as an update or upgrade to a SOFTWARE
PRODUCT previously licensed to you, you must destroy the SOFTWARE PRODUCT previously licensed to you, including any copies resident on your hard-disk
drive(s) within sixty (60) days of the purchase of the license to use the update or upgrade.
7. SUPPORT SERVICES. GeoLogik Software GmbH may provide you with support services related to the SOFTWARE PRODUCT ("Support Services"). Use of
Support Services is governed by the GeoLogik Software GmbH policies and programs described in the user manual, "online" documentation, and/or GeoLogik
Software GmbH provided materials. Any supplemental items provided to you as part of the Support Services shall be considered part of the SOFTWARE PRODUCT
and subject to the terms and conditions of this EULA. With respect to technical information you provide to GeoLogik Software as part of the Support Services,
GeoLogik Software may use such information for its business purposes, including for product support and development. GeoLogik Software will not utilize such
technical information in a form that personally identifies you.
8. COPYRIGHT. All title and copyrights in and to the SOFTWARE PRODUCT, the accompanying printed materials, and any copies of the SOFTWARE PRODUCT, are
owned by GeoLogik Software GmbH The SOFTWARE PRODUCT is protected by copyright laws and international treaty provisions. Therefore, you must treat the
SOFTWARE PRODUCT like any other copyrighted material except that you may either (a) make one copy of the SOFTWARE PRODUCT solely for backup or archival
purposes, or (b) install the SOFTWARE PRODUCT on a single computer provided you keep the original solely for backup or archival purposes. You may not copy the
printed materials accompanying the SOFTWARE PRODUCT.
9. UPDATE LICENSE TERMS. Additional license terms may accompany UPDATES. By installing, copying, or otherwise using any UPDATE, you agree to be bound by
the terms accompanying each such UPDATE. If you do not agree to the additional EULA terms accompanying such UPDATES, do not install, copy, or otherwise use
such UPDATES.
DISCLAIMER OF WARRANTY
NO WARRANTIES.
THE SOFTWARE PRODUCT IS PROVIDED "AS IS" WITHOUT WARRANTY OF ANY KIND. TO THE MAXIMUM EXTENT PERMITTED BY APPLICABLE LAW,
GEOLOGIK SOFTWARE GmbH AND ITS SUPPLIERS DISCLAIM ALL WARRANTIES, EITHER EXPRESS OR IMPLIED, INCLUDING, BUT NOT LIMITED TO,
IMPLIED WARRANTIES OF MERCHANTABILITY AND FITNESS FOR A PARTICULAR PURPOSE AND ANY WARRANTY AGAINST INFRINGEMENT, WITH
REGARD TO THE SOFTWARE PRODUCT. THIS LIMITED WARRANTY GIVES YOU SPECIFIC LEGAL RIGHTS. YOU MAY HAVE OTHERS, WHICH VARY FROM
STATE/JURISDICTION TO STATE/JURISDICTION.
CUSTOMER REMEDIES.
GEOLOGIK SOFTWARE GmbH’s ENTIRE LIABILITY AND YOUR EXCLUSIVE REMEDY SHALL NOT EXCEED THE PRICE PAID FOR THE SOFTWARE
PRODUCT.
NO LIABILITY FOR DAMAGES.
TO THE MAXIMUM EXTENT PERMITTED BY APPLICABLE LAW, IN NO EVENT SHALL GEOLOGIK SOFTWARE GmbH OR ITS SUPPLIERS BE LIABLE FOR
ANY DAMAGES WHATSOEVER (INCLUDING, WITHOUT LIMITATION, DAMAGES FOR LOSS OF BUSINESS PROFITS, BUSINESS INTERRUPTION, LOSS OF
BUSINESS INFORMATION, OR ANY OTHER PECUNIARY LOSS) ARISING OUT OF THE USE OF OR INABILITY TO USE THIS GEOLOGIK SOFTWARE GmbH
PRODUCT, EVEN IF GEOLOGIK SOFTWARE GmbH HAS BEEN ADVISED OF THE POSSIBILITY OF SUCH DAMAGES. BECAUSE SOME
STATES/JURISDICTIONS DO NOT ALLOW THE EXCLUSION OR LIMITATION OF LIABILITY FOR CONSEQUENTIAL OR INCIDENTAL DAMAGES, THE ABOVE
LIMITATION MAY NOT APPLY TO YOU.
MISCELLANEOUS. This Disclaimer and Limitation of Liability are governed by the laws of Germany. If this product was acquired outside Germany, then local law may
apply.
Should you have any questions concerning this EULA, or if you desire to contact GeoLogik Software GmbH for any reason, please contact in writing:
GeoLogik Software GmbH
Ferbornstr. 19a
35619 Braunfels
Germany
Content
3
Content
Teil I First Steps
6
1 Installation
................................................................................................................................... 6
2 Introduction
................................................................................................................................... 7
3 Customizing
...................................................................................................................................
the title block
8
Teil II Reference
10
1 Data entry
................................................................................................................................... 10
Entering BHE
.........................................................................................................................................................
data
11
Send BHE
..................................................................................................................................................
to Profil Tec
12
Entering Flow
.........................................................................................................................................................
rate
13
Entering Heat
.........................................................................................................................................................
power
13
Entering Temperatures
......................................................................................................................................................... 14
Filtering data
..................................................................................................................................................
points
15
Importing.........................................................................................................................................................
logger data
15
2 Analysis ................................................................................................................................... 19
Calculation
.........................................................................................................................................................
of Borehole Thermal Resistance
19
Calculation
.........................................................................................................................................................
of Thermal conductivity and Heat capacity
20
Effective ..................................................................................................................................................
radius
22
3 Printing reports
................................................................................................................................... 23
Teil III Tutorial
26
1 Entering ...................................................................................................................................
and importing data
26
2 Creating ...................................................................................................................................
the documentation
30
3 Determining
...................................................................................................................................
Thermal resistance
32
4 Calculating
...................................................................................................................................
underground parameters
33
5 Printing reports
................................................................................................................................... 34
Teil IV Appendix
38
1 Technical...................................................................................................................................
Support
38
2 References
................................................................................................................................... 38
Index
© 2011 GeoLogik Software GmbH
39
Part
I
6
GeoLogik TRT
1
First Steps
1.1
Installation
System Requirements
Windows XP, Vista or higher
At least 50 MB free hard disk space
Mouse or other pointing device
Installing GeoLogik TRT
Installing GeoLogik TRT on a Local Drive from CD:
Insert the CD-ROM in the CD-ROM drive. Navigate to the folder TRT on the CD and run
SETUP.EXE
Installing GeoLogik TRT on a Local Drive Using a Downloaded EXE:
Navigate to the folder containing the downloaded file.
Double-click the downloaded file to begin the installation process.
The installation file is digitally signed to protect it from unauthorized modifications.
The installation program guides you through the installation process.
Installing GeoLogik TRT requires that you be logged into an account that has
Administrator rights.
Registration
Registration is required to use the software as full version.
Under Windows Vista / Windows 7 GeoLogik TRT must be started with Administrator
rights to successfully complete the registration process. To do this right click on the
GeoLogik TRT program icon and select Run as administrator from the popup menu. If
prompted by UAC, then click on Yes to apply permission to allow the program to run with
full permission as an administrator.
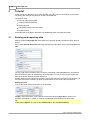
Click on Help | About and afterwards on the link Register.
Enter your Company name and Licence number. The licence number has 4 blocks with
4 characters each:
© 2011 GeoLogik Software GmbH
First Steps
7
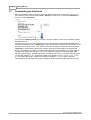
Close the Register dialog with OK and you should see a message that the registration was
successful::
Click on OK in the message box and click once more in the About window to close it. You
must restart GeoLogik TRT to use it as full version.
1.2
Introduction
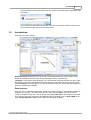
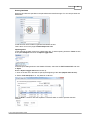
GeoLogik TRT User interface:
Navigation panel: In this panel you can see all performed analyses and common tasks; at the
bottom by clicking on Tests the view changes allowing to select a different TRT.
Tab pages: The program has 6 tab pages. It is a good idea to work through them from left to right.
Depending on the active page different elements appear on that page. The picture above shows
the page Analysis. On that page you can see the Analysis graph, the Results panel and additional
panels for formatting the diagram.
Data structure
GeoLogik TRT is a file based application, similar to a word processing or spreadsheet software. A
single file, i.e. a project, can contain several TRTs and boreholes (BHE). There is no need to
create a new file for every TRT, you can simply select Test | New TRT to add a TRT to the project.
If you create a new TRT the program automatically adds a new BHE. Click on Select BHE on the
page Thermal Response Test to open a dialog for managing the BHEs.
© 2011 GeoLogik Software GmbH
8
1.3
GeoLogik TRT
Customizing the title block
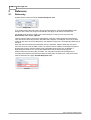
After the installation name and logo of GeoLogik Software appear in the title block. To set your
own company name and logo select Tools | Options from the menu, go to the tab Reports and
look for the panel Title block:
In the text box Company name you can enter your own company name. Click on Font to change
font style and size.
In the Logo panel you can select a graphic file. We recommend a Windows Bitmap (BMP) with a
resolution of at least 300 dpi. If Small Logo is selected the graphic will show up as a square on the
left side of the company name. Your graphic should also be square, otherwise it will be stretched.
If Big Logo is selected the entries under company name will not be displayed. Instead the full
space is occupied by the graphic. The aspect ratio depends on the settings for the page margins.
The title block always has a height of 2.5 cm, the width of the graphic is half of the page width
minus the page margins. Example calculation: The paper size is A4 (21 cm width), left margin is 2
cm and right margin is 1 cm. Therefore the width of the graphic is 9 cm ( (21 cm - 2 cm - 1 cm) /
2 ). The aspect ratio (width : height) of the graphic should be 9 : 2.5, e.g. 1080 x 300 pixel.
The settings for the title block are program settings and will not be saved along with the TRT file.
© 2011 GeoLogik Software GmbH
Part
II
10
GeoLogik TRT
2
Reference
2.1
Data entry
All data use the units from the tab Thermal Response Test.
Setting units
If you realize during data entry that a wrong unit was selected, uncheck the Convert box and
change to the correct unit. Keep in mind that the units apply to all data in the active TRT.
The default units (which are used if you create new files or TRTs) can be set on the tab
Environment under Tools | Options.
There are three pages to enter the measurements: Flow rate, Power level and Temperatures.
They all have the same layout with a data table and a diagram. The diagram serves as a visual
control for the data. Click on a data point in the diagram to jump to the corresponding data entry in
the table.
GeoLogik TRT uses the decimal separator set up in Windows. With the Enter-key the cursor
moves to the next cell in the table. There is no need to enter the data in chronological sequence,
because the program sorts the data by time. Duplicated points of time are not allowed. If
duplicated time values occur only the first will be taken and the others will be ignored.
All time values are time since the Test Start. The Test Start is defined as the beginning of
recording measurements and must be before the heat power is switched on. This point of time
must be entered on the page Thermal Response Test:.
Test start
© 2011 GeoLogik Software GmbH
Reference
2.1.1
11
Entering BHE data
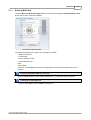
The panel Borehole Heat Exchanger (BHE) is located on the tab page Thermal Response Test
and is used to enter construction details.
Panel Borehole Heat Exchanger
The following parameters are used in the calculation of results:
r: Radius of borehole
L: Tube length
d: Outer diameter of tube
s: Tube wall thickness
Fluid
Type of BHE
In case of a coaxial BHE also the inner tube diameter di and the inner wall thickness si are
required.
Entering additional data for the BHE
Click on Additional data to enter location information (x, y, altitude) and grout material.
Selecting an existing BHE
Click on Select BHE to show all BHEs in the project.
© 2011 GeoLogik Software GmbH
12
GeoLogik TRT
BHEs in project
The currently selected BHE is marked with a green icon. To select another BHE double click
it or select it with the mouse and click on Select in the menu. This window is also used to
create a new BHE or to delete an existing BHE.
2.1.1.1
Send BHE to Profil Tec
A BHE can be transferred to the borehole logging software Profil Tec. If you select Tools | Send
BHE to Profil Tec a dialog will prompt you for the target location:
Selecting destination of the BHE in Profil Tec
Either a new Profil Tec file is created or the borehole is appended to an existing Profil Tec file. In
any case the program prompts you to specify a file name. If the option Open file after create is
checked Profil Tec will open after the process is finished and display the selected file.
The following data will be transferred:
Name and location of BHE
Depth and diameter of borehole
Grout material
Tube
if you have selected Create new file the project details (project name, project number, client) will
be transferred too.
The scale of the borehole will be set in a way that it fits on a A4 sized page.
Optimizing the well completion diagram in Profil Tec:
- if the labels for grout material and borehole overlap click on Align labels (wizard icon).
- if the label for the grout material reads Zementation. Click on it an uncheck Default Labeling in
© 2011 GeoLogik Software GmbH
Reference
13
the panel Appearance.
This function required a licensed version of Profil Tec 6.3 or higher.
2.1.2
Entering Flow rate
The flow rates are entered on the page Flow rate:
Flow rate
For a simple case select constant and enter the flow rate in the text box next to it.
The data table becomes active if you select variable.
The instrument position of the flow meter is used by the program when calculating the power level
from difference in temperatures. This is because both density and specific heat capacity are
functions of temperature, and depending on the instrument position the values will be calculated
using either inlet or outlet temperatures.
2.1.3
Entering Heat power
The Heat power is entered on the page Power level:
Power level
For a simple case select Constant power level and enter the value next to it. If Variable power
© 2011 GeoLogik Software GmbH
14
GeoLogik TRT
level is selected the table becomes active.
If you do the analysis later on you can select if the power level is taken from the measurements
entered here of if it is calculated by using the differences in temperatures.
Enter the times for Power on and Power off because they are required. Time values must be
given in Time since Test start.
In case of variable power level it is required that a data point with t
2.1.4
Power off is given in the table.
Entering Temperatures
Temperatures are entered on the page Temperatures.
Temperatures
A required input is the Undisturbed ground temperature.
If In/Out is selected the table contains data triples, i.e. measurements containing time, inflow and
outflow temperatures. If the data for a point of time is incomplete (if either inflow or outflow is
missing) the data will no be accepted by the program and are deleted on the next refresh of the
table.
T (in) means inflow, i.e. the fluid entering the BHE. T (out) means outflow, i.e. the fluid leaving the
BHE.
The data is automatically sorted by time, regardless of the input sequence. If duplicated time
values the program informs you about it and deletes the duplicates.
The columns T(ln) and T(lin) display the logarithmic and linear temperature difference to the
underground. The column Q contains the power level, which is calculated using the T(in) and T
(out) values, assuming a averaged flow rate.
If Reference reading is selected the table contains time - temperature values. This can be used to
document other relevant parameters, e.g. the outside air temperature.
© 2011 GeoLogik Software GmbH
Reference
2.1.4.1
15
Filtering data points
The button Filter is located above the table. It is used to enable or disable filtering of the data
points. If the filter is enabled the color of the button changes to inform the user that not all the data
points are visible.
Filter enabled
If you click on the small triangle on the right side of the button the command Filter settings
becomes visible. If you select it the following dialog appears:
Now you can select the Filter type, which can be By change in time or By change in value.
Enter a applicable in the text box next to it.
2.1.5
Importing logger data
A logger data file contains the measurements in the format of Date, Time and Measured Data. The
data must be in chronological sequence, starting with the earliest time. Click on Import Logger
data above the table or in the task panel to start the process. After you have selected the file the
Import Logger data wizard appears.
Die Messungen müssen in chronologischer Reihenfolge vorliegen. Um diese zu importieren
klicken Sie auf Logger-Daten importieren im Aufgaben-Panel oder auf eine die Schaltfläche
Importieren von Logger-Daten oberhalb der Eingabetabellen. Es öffnet sich dann der Dialog zur
Auswahl der Logger-Datei und danach der Import-Assistent.
© 2011 GeoLogik Software GmbH
16
GeoLogik TRT
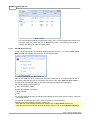
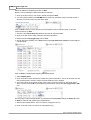
Import Logger data, first step
In the first step you specify the beginning of the data using the Import starts at row text box. To
do this you can also simply click on a row in the table. Also the Test start is displayed and you can
modify that value if is is not correct. Click on Next to continue.
Selecting separators
During the next step separators used to split the data into separate columns are selected. Date
and time must be in separate columns.Click on Next to continue.
© 2011 GeoLogik Software GmbH
Reference
17
Selecting the date column
Now click on the column containing the date information. The Date format can be set in the combo
box in top right corner if it is different from the date format set in Windows. D means day, M means
month and Y means year. Click on Next to continue to select the applicable column for the Time.
Like the date column simply click on the column containing the Time information.Click on Next to
continue.
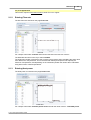
Importing Flow rate
To import flow rate data select the Import flow rate checkbox. Ensure that the correct unit is
selected in the combo box in the top right corner. Then click on the column containing the flow rate
information.
Below the table you can see the panel Filter. The meaning of Import all should be clear. If you
select By difference in time or By difference in value and enter a difference the program will
import data points only if the difference from the previously imported data point is reached.
Typically this will reduce the number of data points imported, often making the analysis clearer.
Click on Next to continue to importing Heat power data. This screen works exactly like the one
before: Check the box if you want to import, set the correct unit, click on the column with the data.
Click on Next to continue with importing temperatures.
© 2011 GeoLogik Software GmbH
18
GeoLogik TRT
Importing temperatures
Now you have to click twice, because the first click will select the Temperature (in) and the second
the Temperature (out). If you have selected the wrong column, simply click a third time to select
Temperature (in) again, and a forth time for the Temperature (out), and so on.
Click on Next to continue with importing reference reading (e.g. the outside air temperature). That
screen works like the screens before.
Click on Next to start the importing process. The process indicator keep you informed about the
import and show the number of imported data points:
Completion of import
Click on Close to end the Import wizard.
© 2011 GeoLogik Software GmbH
Reference
2.2
Analysis
2.2.1
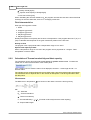
Calculation of Borehole Thermal Resistance
19
The Thermal Resistance is calculated at the time of the first fluid exchange in the BHE after the
heating power is switched on. It is your task to specify this point of time. The program suggests a
time, based on the volume and the flow rate:
with
VolS: Volume of tube
VolG: Volume of TRT device
V: Flow rate; if a variable flow rate is given the program uses an averaged value.
The equitation used to calculate the Thermal Resistance RB is
with
QH: Heat flow
R:
logarithmic mean temperature difference at the time of fluid exchange
This equitation looks quite simple, but we want to explain some details here too:
Logarithmic mean temperature difference
The logarithmic mean temperature difference
is defined as
with
V:
Temperature in
R:
Temperature out
U:
Temperature of undisturbed underground
Heat flow
The Heat flow QH is defined as
mit
Q: Heating Power [W]
H: Tube length [m]
Heating Power
The Heating Power Q is calculated by using the temperature difference.
with
© 2011 GeoLogik Software GmbH
20
GeoLogik TRT
: Density of fluid [kg/m³]
CP: Specific heat capacity of fluid [kJ/kg/K]
V: Flow rate of fluid [m³/s]
When calculating the Thermal resistance RB the program uses the flow rate at the time of the fluid
exchange or the next value later; there is no averaging of flow rate.
Fluid characteristics
GeoLogik TRT supports 5 fluids:
1. Water
2. Propylene glycol 25%
3. Propylene glycol 33%
4. Ethylene glycol 25%
5. Ethylene glycol 33%
Density and specific heat capacity are functions of temperature. If the program takes the T (in) or T
(out) to calculate them depends on the given Instrument position for the flow rate.
Density of fluid
The program uses a polynomial within a temperature range of 0 to 100°C.
Specific heat capacity of fluid
Within a temperature range of 0 to 100°C the program uses a polynomial of 1. degree. Table
interpolation is used for water.
2.2.2
Calculation of Thermal conductivity and Heat capacity
The calculation can be done using either line source of cylinder source model. To switch the
model click on the link at the bottom of the results panel.
If the cylinder source is used the ration L/D is displayed, whereas L = tube length and D = 2 x
effecive radius.
The cylinder source model required much more CPU power, thus the program might react slower.
The calculation time to depends also on the number of data points. It can be a good idea to filter
the data points.
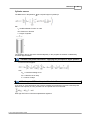
Line source
The Difference in temperature
is a function of the radius r and time t and is given by
with
QH : Heat flow
RB : Thermal resistance
: Thermal conductivity
a : Thermal diffusivity =
/ CP (Thermal conductivity/volumetric heat capacity)
Ei : Exponential integral
© 2011 GeoLogik Software GmbH
Reference
21
Cylinder source
The Difference in temperature
at z=0 (half height of cylinder) is
with
I0: modified Bessel-Function 0. order
Erf: Gauss error function
L: Length of cylinder
The equitation above cannot be solved analytically. In the program the solution is obtained by
numerical approximation.
Variable heat power calculation - applying the principles of super position
For a line source applies:
with
QH1 = Heat flow starting at t=0
QHi = Heat flow of i-th step
n = number of steps
What happen if "Fit to data points" is clicked?
If you click on "Fit to data points" the program modifies the parameters Thermal conductivity and
Specific heat capacity in a way, that the sum of squared errors is minimized:
GeoLogik TRT uses a numerical optimization algorithm.
© 2011 GeoLogik Software GmbH
22
2.2.2.1
GeoLogik TRT
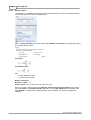
Effective radius
The difference in temperature between Fluid and underground is a function of the radial distance r.
In the results panel the utilized r is displayed (1).
Click on Change method (2) to show the the dialog Method of calculation. The following options
are available for the radius:
r(e) U-tube:
r(e) Double-U-tube:
with
d = outer diameter of tube
s = wall thickness of tube
Radius of borehole
Diameter of tube: r = d
Custom value: You can enter your own value for r here..
When you create a new analysis using Analysis | Determine Thermal parameters the program
uses r(e) U-tube or r(e) Double-U-tube, depending on the Type of BHE already selected. If the
Type of BHE is changed later, existing analyses are not effected. You need to change them
manually.
© 2011 GeoLogik Software GmbH
Reference
2.3
23
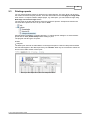
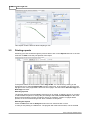
Printing reports
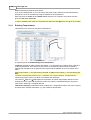
You can view and select reports for printout on the page Reports. The zoom factor can be set in
the combo box above the print preview. There are also buttons for the Full page and Page width
zoom factors. If a report contains multiple pages, e.g. data report, you can browse through using
Next Page and Previous Page buttons.
The tree view on the left side allows to select the reports for printout. All reports checked in the
tree view will be printed as soon as you click on Print.
Printing begins immediately, no dialog will show, To change printer settings or to select another
printer click on File | Printer Setup before starting to print.
The program has two types of reports:
Data
Analyses
The data report show all recorded data in chronological sequence. Data for Heat power and fluid
flow rate also appear in the data report if they are variable. When tey are constant the values are
shown in the header section of the report.
Data report with temperatures, flow rates and power levels
© 2011 GeoLogik Software GmbH
Part
III
26
3
GeoLogik TRT
Tutorial
In this Tutorial you will learn how to enter the data of an TRT and how the analysis is performed.
The data in this example are based on a really conducted test.
The steps in detail:
Entering and importing data
Creating the documentation
Determining RB
Calculating underground parameters
Printing reports
All sample files are located in the folder TRT\SAMPLES under the Public files folder.
3.1
Entering and importing data
Start the program GeoLogik TRT. After start up the program already contains an empty file and
project.
On the page Thermal Response Test enter the following information into the panels Project and
TRT:
The only "real hard" information which is used for calculating is the Test start value, because all
time information is given as elapsed time since test start. For now you do not have to enter the
value given above, because it will be set later on.
All other entries can be changed as you like, because they serve as information only. However, do
not leave them blank, because it is easier to located them on the report if they are filled out.
Setting the units
Look for the panel Units and set them as shown below:
Length is used for location of the borehole and the tube length. Länge (Dia) is used for the
geometry of the BHE, i.e. radius of borehole and diameter and wall thickness of the tube.
Tip:
Under Tools | Options you can set the default units on the page Environment.
© 2011 GeoLogik Software GmbH
Tutorial
27
Entering BHE data
Geometry and fluid are specified in the panel Borehole Heat Exchanger. For our sample enter the
data below:
In that case we use a Double-U type BHE and Water as fluid.
That is all for now on the page Thermal Response Test.
Importing data
In this example the data comes from a data logger file. To start importing locate the Tasks section
in the panel Analyses and click on Import Logger data.
In the File open dialog browse to the SAMPLES folder, select the file TRT Tutorial.TXT and click
on Open.
Now the Import Logger data wizard shows up.
1. Click on the 4th row in the table to specify the beginning of the data (Import starts at row).
2. Set the Test start (t=0) to 13. July 2008 at 17:08:00 h.
Click on Next to continue. Now the separator is selected which is used to split the data into
columns.
© 2011 GeoLogik Software GmbH
28
GeoLogik TRT
Select the Tab as a separator and click on Next.
Now the column holding the date information is selected.
1. Click on the first column. The column header changes to Date.
2. You can keep the Date format DD.MM.YY if it shows up, otherwise change it to that format. It
will import correctly even if the year has 4 digits.
Click on Next. Now the column with the time information must be selected. Click on the 2nd
column and then on Next.
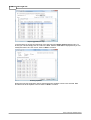
1. Check the box Import Flow rate because we want to import that data.
2. Click on the 3rd column which holds the flow rate information.
3. Ensure that the Unit [logger file] is set to m³/h.
4. We will not import all data. In the Filter section select By difference in data and enter 0.02 m³/
h as threshold.
Click on Next to continue with importing the Heating power.
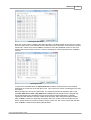
1. Select Import power.
2. Click on the last column because it contains the power information. This is not obvious from the
first measurements, since the values are quite small and even negative.
3. The power values in the logger file are given in kW. That is the reason for the small values.
Since we have selected W in the beginning of that lesson change the Unit [logger file] to kW
now.
We are going to import all data points. So just leave the default Filter settings to Import all. Click
on Next to continue with importing the temperatures.
1. Select Import temperatures. The is no need to change the Unit °C.
2. Click on the 4th column to select it as Temperature (in).
© 2011 GeoLogik Software GmbH
Tutorial
29
3. Click on the 5th column to select it as Temperature (out).
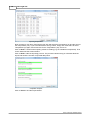
We will also import all temperature data, so you do not have to change the Filter setting. Click on
Next to continue with importing reference reading. There is no data for it, so uncheck Import
reference reading and click on Next to start the import.
The last screen will inform you about the success of the import process:
Click on Close to exit the Import Logger data wizard.
Flow rate
Back in the main window go to the page Flow rate. It looks like this:
If it is not already set change the Instrument position to before heater.
Power level
Go to the page Power level. If you scroll down in the data table you will find out that the Power is
switch on at about 41 min and switched off at 3817 min. Enter this two values in the text boxes
above the table:
© 2011 GeoLogik Software GmbH
30
GeoLogik TRT
Temperatures
Go to the page Temperatures. Enter 12.1 °C as the Undisturbed ground temperature.
Resize the window to have a better look at the data table.In the column Q the program displays the
Power based on the difference in temperatures. Rows where the data is within the heating period
appear in a different color.
By now all required data is entered into the program. The next lesson shows how to create the
documentation of the TRT.
3.2
Creating the documentation
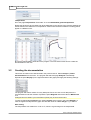
This lesson is based on the data entered in the previous lesson. Select Analysis | Create
documentation from the menu. The program will select the page Analysis automatically.
Expand the panel Display (on the right hand side of the graph) and apply the following settings:
The program will draw a marker for every data point. Since we have a lot of data points it is
recommended to hide the markers. Expand the panel Diagram and set the value of Marker size
to 0.
Changes become visible if you hit the Return (Enter) key of leave the text box.
To show a legend select bottom for the option Legend, which is also in the panel Diagram. In
case the legend overlaps with the graph increase the value for Lower margin, e.g. to 15 mm.
Axis scaling
The temperature axis scales from 10 to 30 °C, which is a good range for the sample data.
© 2011 GeoLogik Software GmbH
Tutorial
31
Eventually the intervals of the axis labeling are "not nice", e.g. every 4 °C (10, 14, 18, etc.). To
change this set the Major unit in the panel Temperature axis to 4.
Change the Value format to 0.0 to display only one digit after the decimal separator.
The Value format uses 0 for a digit which is displayed always. The # is used for an optional digit.
The dot . is used as the placeholder for the decimal separator set up in Windows.
On the Time axis the Maximum is set to Auto, thus the maxium value displayed is 7000. Change
it from Auto to 6000 and enter 6 as the Major unit. Now every 1000 a number label is displayed.
Expand the panel Power axis and change the Major unit to 4 and the Maximum to 8000 W.
In the panel panel Flow Axis change the Major unit to 3 and the Maximum to 1,5 m³/h.
Report preview
The diagram now looks pretty clear. Go to the Reports tab and have a look at the Print preview.
Select the Documentation from the tree view:
Sometimes the axis label draw beyond the frame:
In that case go back to the Analysis tab, open the panel Diagram and increase the value for the
Left Margin, e.g. to 25 mm. Go back to the print preview, it should look like this:
© 2011 GeoLogik Software GmbH
32
3.3
GeoLogik TRT
Determining Thermal resistance
This lessen continues the previous chapter. Select Analysis | Determine RB from the menu. The
program changes to the Analysis tab, and the diagram looks quite good already. Now you can
1. shift the straight line by clicking on it and holding down the left mouse button to change time for
the first fluid exchange, or
2. entering a numerical value for the time of the first fluid exchange
3. change the Device volume (TRT device + tubes to the BHE); the default volume is set under
Tools | Options on the Device tab. This value is used to calculate the theoretical duration and
has no direct impact on the calculation of RB.
© 2011 GeoLogik Software GmbH
Tutorial
33
As described in the previous chapter you can change axis scaling and preview the report.
3.4
Calculating underground parameters
This lesson is based on the data entered in the previous lesson. Select Analysis | Determine
Thermal parameters from the menu. The program will select the page Analysis automatically.
Now you can:
1. Perform an automatic Fit. This will change Thermal Conductivity and Volumetric Heat
Capacity in a way that deviation from the data points is minimized. Click on Fit now to do it.
2. The Thermal Conductivity can be changed by entering a numerical value in text box. You can
also use the slider control below the text box. The graph is updated automatically. In the semilog
view below the change of the thermal conductivity changes the slope of the straight line section.
3. The same applies to the Volumetric Heat Capacity. In the semilog view below the change of
the Volumetric Heat Capacity will shift the line vertically. The button with the padlock on it will
lock a parameter, so it will not change if a automatic Fit is performed.
4. Click on Change RB to select a Thermal resistance or to enter it.
5. If you click on Change method a dialog will show up providing options for the calculation. For
example, the program can either calculate the heating power from the differences in
temperatures or use directly measured data. Also the value for the effective radius can be set
here.
6. Another option is to define an analysis time range. This allows you to select a different interval
in time; by default the program uses the time after the first fluid exchange as a starting point,
and the power off of the heater as the ending point.
7. You can also change the calculation model here. The default model is the line source. Be
aware that the program becomes slower if you select the cylinder source, since the calculation
is more time consuming.
8. Click on Comments to write remarks for the analysis.
© 2011 GeoLogik Software GmbH
34
GeoLogik TRT
This chapter ends the lessons about analyzing a TRT.
3.5
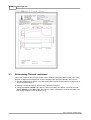
Printing reports
Assuming you have worked through the previous lesson click on the Reports tab now. In the tree
view click on Data to see the print preview of the report:
In the picture above the zoom factor is set to Page width. You can do this by clicking on the
appropriate icon or selecting Page width from the combo box. In the preview you can see in the
top right corner of the page that the document has 9 pages. Use the buttons Previous Page and
Next Page to browse.
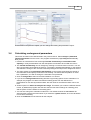
Selecting a printer
The program starts to print immediately if the Print icon is clicked, no dialog is shown. If you want
to select a different printer or change the print settings select File | Printer Setup from the menu.
Do this now and select a printer you want to use for our example. A total of 12 pages will be
printed, so we recommend using a PDF driver instead of a real printer.
Selecting the reports
Check the Data node and the Analyses node in the tree view and click on Print.
In case you are printing to a PDF driver: The program will create 4 documents, one for the data
© 2011 GeoLogik Software GmbH
Tutorial
35
report and one for each analysis (we have 3 of them). Some PDF drivers provide an option to
conflate these documents into a single document, so you have to distribute only one PDF file for
the TRT.
© 2011 GeoLogik Software GmbH
Part
IV
38
GeoLogik TRT
4
Appendix
4.1
Technical Support
Technical support for GeoLogik TRT can be obtained
on our website www.geologik.com
via phone +49 - (0) 64 42 - 96 21 73
via E-mail [email protected]
Desktop-Sharing
We also provide desktop sharing as a special service to getting support. You need to have an
Internet connection to use it. During a desktop sharing session the screen content is transferred,
either your screen to GeoLogik or vice versa. The conversation takes place via phone.
To start a desktop sharing session select Help | Desktop-Sharing from the menu and follow the
instructions.
4.2
References
Loose, P. (2007): Erdwärmenutzung.- 2. Aufl., C. F. Müller, Heidelberg.
© 2011 GeoLogik Software GmbH
Index
Index
-PPDF 34
Power level 13
Printer setup 23
Printing 23, 34
Profil Tec 12
Propylene glycol 19
-Aair temperature
14
-CCylinder source model
20
Radius 22
Reduce data points
Register 6
Reports 23
-DData report
-R-
23
-E-
-S-
Effective radius
Ethylene glycol
22
19
Support
Filter 15
Flow rate 13
Fluid exchange
Full version 6
38
-T-
-F-
temperatures 14
Test start 10
Thermal conductivity 20, 33
Thermal resistance 19, 20, 32
19, 32
-U-
-H-
Units
Heat capacity 20, 33
Heating power 13
10
-V-
-Iinflow 14
Installation
15
Volumetric heat capacity
-W-
6
Well completion diagram
-LLicense number 6
Line source model 20
Logger data 15
-Ooutflow 14
outside air temperature
© 2011 GeoLogik Software GmbH
20
14
12
39


![j:j_"Xt$l"j:]:":,lg]:"r/Human Resources have been duty - e](http://vs1.manualzilla.com/store/data/005657435_1-26d97049bf04f0fd92265d73e45a9ab3-150x150.png)