1
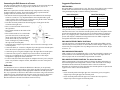
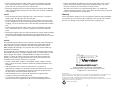
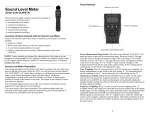
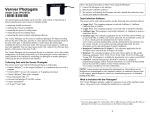
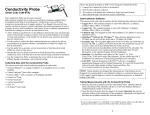
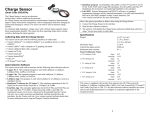
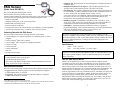
EKG Sensor (Order Code EKG-BTA) The Vernier EKG (Electrocardiogram or ECG) Sensor measures electrical potential waveforms (voltages produced during the contraction of the muscle). The following is a partial list of activities and experiments that can be performed using this sensor: Monitor resting EKG. Study the meaning of P, Q, R, S, and T waveforms. Monitor EKG after mild exercise. Determine the axis of the heart. Investigate the effect of the central nervous system influence on reflex amplitude. Associate the electrical activity of a muscle with movement of joints. Collecting Data with the EKG Sensor This sensor can be used with the following interfaces to collect data: ® ® Vernier LabQuest 2 or original LabQuest as a standalone device or with a computer ® Vernier LabQuest Mini with a computer ® Vernier LabPro with a computer or TI graphing calculator ® 1 Vernier Go! Link ® Vernier EasyLink ® Vernier SensorDAQ CBL 2™ TI-Nspire™ Lab Cradle Here is the general procedure to follow when using the EKG Sensor: 1. Connect the EKG Sensor to the interface. 2. Start the data-collection software2. 3. The software will identify the EKG Sensor and load a default data-collection setup. You are now ready to collect data. Data-Collection Software This sensor can be used with an interface and the following data-collection software. Logger Pro 3 This computer program is used with LabQuest 2, LabQuest, LabQuest Mini, LabPro, or Go!Link. Logger Lite This computer program is used with LabQuest 2, LabQuest, LabQuest Mini, LabPro, or Go!Link. 1 2 EKG-DIN sensors will not work with Go! Link. If you are using Logger Pro 2 with either a ULI or SBI, the sensor will not auto-ID. Open an experiment file for the EKG Sensor in the Probes & Sensors folder. LabQuest App This program is used when LabQuest 2 or LabQuest is used as a standalone device. DataQuest™ Software for TI-Nspire™ This calculator application for the TI-Nspire can be used with the EasyLink or TI-Nspire Lab Cradle. EasyData App This calculator application for the TI-83 Plus and TI-84 Plus can be used with CBL 2, LabPro, and Vernier EasyLink. We recommend version 2.0 or newer, which can be downloaded from the Vernier web site, www.vernier.com/easy/easydata.html, and then transferred to the calculator. See the Vernier web site, www.vernier.com/calc/software/index.html for more information on the App and Program Transfer Guidebook. DataMate program Use DataMate with LabPro or CBL 2 and TI-73, TI-83, TI-84, TI-86, TI-89, and Voyage 200 calculators. See the LabPro and CBL 2™ Guidebooks for instructions on transferring DataMate to the calculator. LabVIEW™ National Instruments LabVIEW™ software is a graphical programming language sold by National Instruments. It is used with SensorDAQ and can be used with a number of other Vernier interfaces. See www.vernier.com/labview for more information. This sensor is equipped with circuitry that supports auto-ID. When used with LabQuest 2, LabQuest, LabQuest Mini, LabPro, Go! Link, SensorDAQ, TI-Nspire™ Lab Cradle, EasyLink, or CBL 2™, the data-collection software identifies the sensor and uses pre-defined parameters to configure an experiment appropriate to the recognized sensor. Specifications Offset: ~1.00 V (±0.3 V) Gain: 1 mV body potential / 1 V sensor output NOTE: Vernier products are designed for educational use. Our products are not designed nor recommended for any industrial, medical, or commercial process such as life support, patient diagnosis, control of a manufacturing process, or industrial testing of any kind. How the EKG Sensor Works Muscle cells are polarized at rest. This means the cells have slightly unequal concentrations of ions across their cell membranes. An excess of positive sodium ions on the outside of the membrane causes the outside of the membrane to have a positive charge relative to the inside of the membrane. The inside of the cell is at a potential of about 90 millivolts (mV) less than the outside of the cell membrane. The 90 mV difference is called the resting potential. The typical cell membrane is relatively impermeable to the entry of sodium. However, stimulation of a muscle cell causes an increase in its permeability to sodium. Sodium ions migrate into the cell through the opening of voltage-gated sodium channels. This causes a change (depolarization) in the electrical field around the cell. This change in cell potential from negative to positive and back is a voltage pulse called an action potential. In muscle cells, action potential trigger muscle contractions. 2 Lipid bilayer Other ions and charged molecules are involved + in the depolarization and repolarization of cardiac muscle. These include potassium, + calcium, chlorine, and charged protein + molecules. The sum action potential generated + during the depolarization and repolarization of the cardiac muscle can be recorded by + Outside the cell Inside the cell electrodes at the surface of the skin. A + recording of the heart’s electrical activity is + called an electrocardiogram (EKG). + The cells of the heart’s conducting system will depolarize spontaneously. This spontaneous + depolarization is most apparent in a cluster of + cardiac-muscle cells embedded in the upper + wall of the right atrium. This group of cells is called the pacemaker (also known as the Layers of protein molecules sinoatrial or SA node). Depolarization of the Animal cell membrane (section view) pacemaker generates a current that leads to the depolarization of all other cardiac-muscle cells. The wave of depolarization travels from the right atrium to the left atrium quickly enough that both atria contract at essentially the same time. The atria and the ventricles are isolated from each other electrically by connective tissue that acts like the insulation on an electric wire. The depolarization of the atria does not directly affect the ventricles. There is another group of cells in the right atria, called the atrioventricular or AV node, that will conduct the depolarization of the atria down a special bundle of conducting fibers (called the Bundle of His) to the ventricles. In the muscle wall of the ventricles are Purkinje fibers, which are a special system of muscle fibers that bring depolarization to all parts of the ventricles almost simultaneously. This Sinoatrial (SA) process causes a small time delay, so Node Bundle of His (Atricoventricular there is a short pause after the atria Atrioventricular (AV) Bundle) Node contract and before the ventricles Right Atrium contract. Because the cells of the heart muscle are interconnected, this wave of Purkinje Fibers depolarization, contraction, and (Conduction Myofibe repolarization spreads across all of the Right Ventricle connected muscle of the heart. When a portion of the heart is polarized and the adjacent portion is depolarized, an electrical current is created that moves through the body. This current is greatest when one half of the connected portion of the heart is polarized and the adjacent half is not polarized. The current decreases when the ratio of polarized tissue to nonpolarized tissue is less than one to one. The changes in these currents can be measured, amplified, and plotted over time. The EKG represents the summation of all the action potentials from the heart, as detected on the surface of the body. It does not measure the mechanical contractions of the heart directly. The impulse originating at the SA node causes the atria to contract, forcing blood 3 into the ventricles. Shortly after this contraction, the ventricles contract due to the signal conducted to them from the atria. The blood leaves the ventricles through the aorta and pulmonary artery. The polarity of the cardiac-muscle cells returns to normal and the heart cycle starts again. The Electrocardiogram The electrocardiogram (EKG) is a graphic tracing of the heart’s electrical activity. A typical tracing consists of a series of waveforms occurring in a repetitive order. These waveforms arise from a flat baseline called the isoelectric line. Any deflection from the isoelectric line denotes electrical activity. The five major deflections on a normal EKG are designated by the letters P, Q, R, S, and T. One heart cycle is represented by a group of waveforms beginning with the P wave, followed by the QRS wave complex, and ending with the T wave. The P wave represents the depolarization of the atria and is associated with their contraction. The QRS wave complex consists of three waves. The first negative deflection is the Q wave and is followed by a positive deflection called the R wave. The complex ends with a negative deflection known as the S wave. The QRS wave complex denotes depolarization of the ventricles and is associated with their contraction. Atrial repolarization occurs during the depolarization of the ventricles. For this reason, the waveform associated with atrial repolarization is undetectable on an EKG. The last wave is called the T wave, and is usually represented by a positive deflection. The T wave indicates ventricular repolarization. Electrical energy is also generated by skeletal muscle, and can be seen as muscle artifacts if your arm is moved while the EKG is attached. The sequence from P wave to P wave represents one heart cycle. The number of cycles in a minute is called the heart rate and is typically 70-80 beats per minute at rest. Some typical times for portions of the EKG are: P-R interval 0.12 to 0.20 seconds QRS interval less than 0.1 seconds Q-T interval less than 0.38 seconds If your EKG does not correspond to the above numbers, DO NOT BE ALARMED! These numbers represent typical averages and many healthy hearts have data that fall outside of these parameters. To read an EKG effectively takes considerable training and skill. This sensor is NOT intended for medical diagnoses. 4 Connecting the EKG Sensor to a Person Use three electrode patches per subject. The electrodes can be reused, but they tend to absorb moisture (they are very hygroscopic) and, therefore, reuse is not recommended. Note: Once opened, the electrodes should be kept refrigerated in a clean, dry, air-tight container for storage. Even with air-tight storage, opened electrode packages cannot be stored from one year to the next. Because the electrical signal produced by the heart and detected at the body’s surface is so small, it is very important that the electrode patch makes good contact with the skin. Scrub the areas of skin where the patches will be attached with a paper towel to remove dead skin and oil. Peel three electrode patches from the backing paper. Firmly place the first electrode on the right wrist. Place a second electrode on the inside of the right elbow. Place a third electrode on the inside of the left elbow. + positive - negative Place each electrode so it is on the inside red green EKG Sensor part of the arm (closer to the body) and the tab on the edge of the electrode patch reference black to interface points down. This way, the wire of the sensor can hang freely without twisting the edge of the electrode patch. Connect the micro alligator clips from the sensor to the tabs on the edges of the electrode patches. Connect the black (or “reference”) alligator clip to the right wrist electrode patch. This is the reference point for the isoelectric line (baseline). Connect the green (or negative) alligator clip to the right elbow electrode patch. Connect the red (or positive) alligator clip to the left elbow electrode patch. There are several different ways to connect the EKG sensor. This simple arrangement is appropriate for the classroom. For best results, disconnect the computer or LabQuest from A/C power, keep the sensor away from the computer monitor, and hold the senor box in the palm of your hand. Calibration You should never have to calibrate the EKG Sensor. Because you are primarily interested in the shape and periodicity of the signal, the EKG sensor does not need to be calibrated. You can simply load the appropriate calibration file and experiment file. Any experiments we describe in this booklet can be done using a stored Vernier calibration in volts, as described in the previous section. The sensor is designed to produce a signal between 0 and 5 volts, with 1 volt being the isoelectric line. Deviation from the isoelectric line indicates electrical activity. 5 Suggested Experiments RESTING EKG Record the EKG of a person who is at rest. The person whose EKG is being recorded should remain calm and relaxed. Encourage the person to breath normally. Using the displayed graph, record the following information: Interval Analysis Interval Heart Rate Analysis Time (milliseconds) Item P-Q Minimum QRS Maximum Q-T Average Rate (per minute) EKG AFTER MILD EXERCISE Using the EKG Sensor, record an EKG of a person who is initially at rest. Disconnect the sensor wires from the electrode patches, but leave the patches on the person being monitored. Have the person exercise for three minutes by jogging in place or by “stepping in time.” Reattach the sensor wires to the electrodes on the person when they have finished exercising and record a new EKG. Compare the resting EKG to the EKG after mild exercise. EKG AND DIFFERENT BODY POSITIONS Use body position as your independent variable. Record the resting EKG as before. Then have the person sit, stand, or lie down. Make no other changes. Compare your results with your resting EKG. Note any changes in heart rate, interval times, height of R wave, etc. EKG AND MILD STIMULANTS Drink a couple of cups of caffeinated coffee or cola. Record an EKG. Compare your results with those at rest and following mild exercise. Note: This might show less effect on people who are accustomed to large amounts of caffeine. EKG AND ELECTRODE POSITION: The Axis of the Heart Different arrangements of electrode patches will change the shape and intensity of the measured signal. Each arrangement is called a “lead.” Each lead reveals unique information based on the lead’s orientation relative to the axis of the heart. Remember to scrub the areas of the skin where the electrode patches are placed with a paper towel to remove skin oil and moisture. Lead I: Put an electrode patch on the right upper arm. Connect the green (or negative) alligator clip to the right upper arm electrode patch. Put an electrode patch on the left upper arm. Connect the red (or positive) alligator clip to the left upper arm electrode patch. 6 Put an electrode patch on the inside surface of the area behind the right ankle bone. Connect the black (or “reference”) alligator clip to the ankle electrode patch. This is the reference point for the isoelectric line. Drawing an imaginary line between the red and green electrodes shows that this lead is measuring polarity changes across the chest, above the heart, and parallel to the shoulders. Lead II: Put an electrode patch on the right upper arm. Connect the green (or negative) alligator clip to the right upper arm electrode patch. Put an electrode patch on the inner surface of the left thigh. Connect the red (or positive) alligator clip to the left inner thigh electrode patch. Note: Instead of the left thigh, you can use the inner surface of the left ankle just behind the left ankle bone. Put an electrode patch on the inside surface of the area behind the right ankle bone. Connect the black (or “reference”) alligator clip to the ankle electrode patch. Drawing an imaginary line between the red and green electrodes yields an oblique line from the right shoulder towards the left leg. Lead II generally gives the greatest variation of impulse and is the EKG usually shown in movies, text books, etc. Lead III: The lead III arrangement has the green (or negative) electrode connected to the left arm and the red (or positive) electrode connected to the left inner thigh with the black (reference) electrode connected to the inside of the right ankle as before. Note: Instead of the left thigh, you can use the inner surface of the left ankle just behind the left ankle bone. This arrangement of the red and green electrodes yields an imaginary line from the left shoulder to the left leg. If the three imaginary lines were connected, they would make a triangle. This triangle is called the Einthoven triangle. The measured intensity of voltage on its three sides can be used to study heart functions and anatomy. You can make an approximation of the axis of your heart; that is, the orientation of the centerline of the mass of your heart. Conduct a Lead I EKG. Conduct a Lead II EKG. Finally, conduct a Lead III EKG. Compare the results. Determine which lead yields the maximum R-wave amplitude. If the maximum R wave is with Lead I, then the axis of your heart is approximately at 0 degrees as measured from the horizontal and your left. If the maximum R wave is with Lead II, then the axis of the heart is approximately 60 degrees down from the horizontal and to the left. If the maximum R wave is with Lead III, then the axis is approximately 120 degrees from the horizontal and your left. You can make a further refinement in your estimate by noting the relative proportion of R wave strength between the two leads with the largest R wave. If the Lead II and the Lead III R waves are about equal, then the axis is about halfway between the 60 degree angle and the 120 degree angle. You could therefore estimate the axis of the heart to be nearly vertical. The heart’s axis tends to vary with general body shape. Very slender and elongated people tend to have a more vertical heart. Short and stocky people tend to have a more horizontal axis for their heart. Warranty Vernier warrants this product to be free from defects in materials and workmanship for a period of five years from the date of shipment to the customer. This warranty does not cover damage to the product caused by abuse or improper use. Vernier Software & Technology 13979 S.W. Millikan Way Beaverton, OR 97005-2886 Toll Free (888) 837-6437 (503) 277-2299 FAX (503) 277-2440 [email protected] www.vernier.com Rev. 5/16/2012 Logger Pro, Logger Lite, Vernier LabQuest 2, Vernier LabQuest, Vernier LabQuest Mini, Vernier LabPro, Go! Link, Vernier EasyLink and other marks shown are our trademarks or registered trademarks in the United States. TI-Nspire, CBL 2 and CBL, TI-GRAPH LINK, and TI Connect are trademarks of Texas Instruments. All other marks not owned by us that appear herein are the property of their respective owners, who may or may not be affiliated with, connected to, or sponsored by us. Printed on recycled paper. 7 8