1
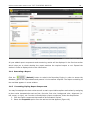
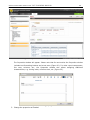
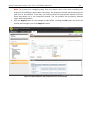
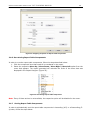
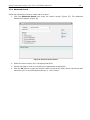
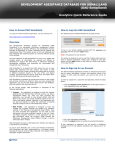
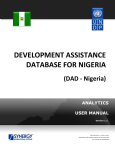
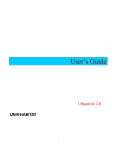
DEVELOPMENT
ASSISTANCE DATABASE
FOR SOMALILAND
(DAD - Somaliland)
ANALYTICS
TOT TRAINING MANUAL
Version 1.0
12 AUG 2013
COPYRIGHT © 2001-2013
SYNERGY INTERNATIONAL SYSTEMS INC
ALL RIGHTS RESERVED
DAD SOMALILAND ANALYTICS TOT TRAINING MANUAL
1
TABLE OF CONTENTS
1.
INTRODUCTION ......................................................................................................... 3
2.
TRAINING MANUALS .................................................................................................. 4
2.1
ANALYTICS – LESSON 1 – MY PORTFOLIO .................................................................. 5
2.1.1
Accessing the My Portfolio Module ..................................................................... 5
2.1.2
Project Submission Workflow in the My Portfolio Module ....................................... 6
2.1.3
Actions Available in the My Portfolio Module ........................................................ 6
2.2
ANALYTICS – LESSON 2 – LIST ................................................................................. 7
2.2.1
Accessing the List Module ................................................................................. 7
2.2.2
Expanding the List Item ................................................................................... 7
2.2.3
Sorting List Items ............................................................................................ 8
2.2.4
Browsing among List Items ............................................................................... 8
2.2.5
Hiding / Showing Images in the List ................................................................... 8
2.2.6
Modifying the Current View ............................................................................... 9
2.3
ANALYTICS – LESSON 3 - CHART ............................................................................ 11
2.3.1
Accessing the Chart Module ............................................................................ 11
2.3.2
Chart Options ................................................................................................ 11
2.4
ANALYTICS – LESSON 4 - REPORT .......................................................................... 16
2.4.1
Accessing the Report Module ........................................................................... 16
2.4.2
Creating a Report .......................................................................................... 16
2.4.3
Previewing a Report ....................................................................................... 18
2.4.4
Generating a Report ....................................................................................... 19
2.4.5
Formatting/Styling Report Components ............................................................ 19
2.4.6
Re-ordering Report Table Components ............................................................. 22
2.4.7
Sorting Report Table Components .................................................................... 22
2.4.8
Removing a Report Table Component ............................................................... 23
2.4.9
Switching Report Table Components ................................................................ 23
2.5
ANALYTICS – LESSON 5 - CUSTOMIZED REPORTING ................................................. 24
2.5.1
Setting Report Options ................................................................................... 24
2.5.2
Saving Reports .............................................................................................. 24
2.5.3
Re-organising Reports .................................................................................... 25
2.5.4
Viewing Pre-defined Reports ........................................................................... 27
2.5.5
Editing Pre-defined Reports ............................................................................. 27
2.5.6
Exporting Reports .......................................................................................... 27
2.5.7
Printing Reports ............................................................................................ 28
2.6
ANALYTICS – LESSON 6 - FILTERING....................................................................... 29
2.6.1
Accessing the Filtering Section ........................................................................ 29
2.6.2
Creating Filtering Criteria ................................................................................ 29
2.7
ANALYTICS – LESSON 7 - SEARCH .......................................................................... 33
2.7.1
Accessing the Search Section .......................................................................... 33
2.7.2
Simple Search ............................................................................................... 33
2.7.3
Advanced Search ........................................................................................... 34
3.
REFERENCES ............................................................................................................ 35
DAD SOMALILAND ANALYTICS TOT TRAINING MANUAL
2
TABLE OF FIGURES
FIGURE 1: MY PORTFOLIO MODULE ............................................................................................... 5
FIGURE 2: MY PORTFOLIO TAB .................................................................................................... 5
FIGURE 3: CREATE NEW PROJECT BUTTON IN MY PORTFOLIO ................................................................ 6
FIGURE 4: LIST MODULE ........................................................................................................... 7
FIGURE 5: LIST TAB................................................................................................................. 7
FIGURE 6: EXPANDING THE LIST ITEM LEVEL .................................................................................... 8
FIGURE 7: HIDING IMAGES IN THE LIST .......................................................................................... 9
FIGURE 8: MODIFYING THE CURRENT VIEW ................................................................................... 10
FIGURE 9: CHART MODULE....................................................................................................... 11
FIGURE 10: CHART TAB .......................................................................................................... 11
FIGURE 11: MAIN SCREEN OF THE CHART MODULE .......................................................................... 12
FIGURE 12: VIEW SCREEN OF THE CHART MODULE .......................................................................... 13
FIGURE 13: UPDATE BUTTON IN CHART MODULE ............................................................................. 15
FIGURE 14: REPORT MODULE.................................................................................................... 16
FIGURE 15: REPORT TAB ......................................................................................................... 16
FIGURE 16: SELECTING A GROUPING FOR A REPORT ......................................................................... 17
FIGURE 17: COMPATIBILITY MATRIX............................................................................................ 18
FIGURE 18: PREVIEWING THE REPORT ......................................................................................... 19
FIGURE 19: REPORTS WINDOW WITH PROPERTIES FOCUS ON THE TITLE FIELD.......................................... 20
FIGURE 20: FORMATTING/STYLING TEXT ENTRIES ........................................................................... 20
FIGURE 21: REPORTS WINDOW WITH PROPERTIES FOCUS ON THE COLUMN .............................................. 21
FIGURE 22: ASSIGNING PROPERTIES TO REPORT TABLE COMPONENTS.................................................... 22
FIGURE 23: REORDERING REPORT TABLE COMPONENTS ..................................................................... 22
FIGURE 24: DEFINING THE SORTING ORDER .................................................................................. 23
FIGURE 25: SWITCHING REPORT TABLE COMPONENTS ...................................................................... 23
FIGURE 26: SETTING THE CHART REPORT OPTIONS .......................................................................... 24
FIGURE 27: MEMORIZING A REPORT............................................................................................ 25
FIGURE 28: ORGANIZING THE REPORTS ....................................................................................... 26
FIGURE 29: FILTERING SECTION ................................................................................................ 29
FIGURE 30: CREATING A FILTERING CRITERIA ................................................................................ 30
FIGURE 31: SEARCHING FOR A FILTERING CATEGORY ITEM ................................................................. 31
FIGURE 32: CREATING A SAMPLE FILTERING CRITERIA ...................................................................... 32
FIGURE 33: SEARCH SECTION ................................................................................................... 33
FIGURE 34: ADVANCED SEARCH SECTION ..................................................................................... 34
DAD SOMALILAND ANALYTICS TOT TRAINING MANUAL
3
1. INTRODUCTION
This document contains lessons dedicated to the training of the Development Assistance System
for Somaliland (DAD Somaliland) application analytics.
The Development Assistance System for Somaliland (DAD Somaliland) is an automated information
management system which is designed to improve efficiency and coordination of donor activities in
Somaliland. It is also a powerful tool for tracking and analyzing aid flows. The system serves as the
main database and data collection and reporting system as it ensures effective access to the aid
data.
The main objective of DAD Somaliland is to serve as a reliable and credible source of information
on external aid offered to Somaliland to support the Government in effectively managing
development assistance and promoting the accountable and transparent use of resources.
DAD Somaliland is a powerful tool that allows the user to view project data organized into lists,
reports, and charts. In DAD Somaliland, the user is able to present the project data in the form of
different analytical reports in the List, Chart, and Report modules, memorize/save the reports,
print them, and export them into PDF, MS Word and MS Excel format files.
DAD Somaliland is designed to provide quick access to the project and aid data remotely via
Internet. Once you have accessed the application, you can view the project data stored in the
database, add new projects, edit existing ones, etc.
In the current design, DAD Somaliland is composed of the following applications:
•
Projects – this application is designed to track the ongoing projects that are financed from
external sources, e.g. donor, international NGOs, etc. Once you have accessed this
application, you are able to view project details, track aid flows to the country and create
analytical reports in the List, Chart, and Report modules. Moreover, in this application you
can add new projects or modify the information of existing projects through a built-in online
Data Entry module.
•
MDG Profile - this application is designed to track and manage the progress towards the
targets and indicators outlined in the Millennium Development Goals (MDG). Once you have
accessed this application, you are able to view information and create analytical reports in
the List, Chart, and Report modules. Moreover, in this application you can add information
about the progress made towards the Millennium Development Goals (MDGs) through a
built-in online Data Entry module.
DAD Somaliland provides a web-based user interface and requires a web browser pre-installed.
To ensure more flexibility and a more user-friendly environment, DAD Somaliland has been
implemented as a bi-lingual system allowing the users to view the data presented in the system in
two languages: English and Somali.
DAD SOMALILAND ANALYTICS TOT TRAINING MANUAL
4
2. TRAINING MANUALS
The Training Manuals will guide you on how to navigate in DAD Somaliland analytics and use the
functions available in it.
The following lessons are offered in this document:
•
•
•
•
•
•
•
ANALYTICS – LESSON 1 – MY PORTFOLIO
ANALYTICS – LESSON 2 – LIST
ANALYTICS – LESSON 3 - CHART
ANALYTICS – LESSON 4 - REPORT
ANALYTICS – LESSON 5 - CUSTOMIZED REPORTING
ANALYTICS – LESSON 6 - FILTERING
ANALYTICS – LESSON 7 - SEARCH
DAD SOMALILAND ANALYTICS TOT TRAINING MANUAL
5
2.1 ANALYTICS – LESSON 1 – MY PORTFOLIO
This lesson will guide you through the steps on how to work in the My Portfolio module (Figure
1).
Figure 1: My Portfolio Module
2.1.1 Accessing the My Portfolio Module
Click the My Portfolio tab to access the My Portfolio module (Figure 2).
Figure 2: My Portfolio Tab
When you access the My Portfolio module, you are presented with the list of draft and submitted
projects that you have permissions to manage. The information displayed in the My Portfolio
DAD SOMALILAND ANALYTICS TOT TRAINING MANUAL
6
module for each project includes the following: Project ID, Project Title, Updated By, Updated On,
Ready for Submission?, and Submitted On.
2.1.2 Project Submission Workflow in the My Portfolio Module
Each project created in DAD Somaliland either from the My Portfolio module or Projects application
should get submitted first in order to become public and official. Below is the procedure of project
submission:
• User adds a project. It is saved as a draft in the My Draft Projects section of the user’s
portfolio (Figure 1).
• When all mandatory fields are filled in the project form, the draft becomes ready for
submission.
• The draft is submitted and appears in the My Submitted Projects table.
Note: Only submitted drafts are displayed in the List table (see ANALYTICS – LESSON 2 – LIST)
and accessible to other users of the DAD Somaliland application.
2.1.3 Actions Available in the My Portfolio Module
Depending on your permissions, you can perform the following actions in the My Portfolio module:
• Add a New Project by:
- Clicking the New Project button (Figure 3).
- Providing the information requested in the project form (see DAD Somaliland Projects
Application User Manual in REFERENCES).
•
Saving the data input.
View Project Details by:
- Clicking the project that you want to view to access the project details section.
- Viewing the project information recorded.
Figure 3: Create New Project Button in My Portfolio
DAD SOMALILAND ANALYTICS TOT TRAINING MANUAL
7
2.2 ANALYTICS – LESSON 2 – LIST
This lesson will guide you through the steps on how to work in the List module (Figure 4).
Figure 4: List Module
2.2.1 Accessing the List Module
Click the List tab to access the List module (Figure 5).
Figure 5: List Tab
2.2.2 Expanding the List Item
In order to expand the list item level, click on the ‘+’ sign next to the name of the list item. This
will expand the list item group level displaying the first sub-level (Figure 6). This can further be
expanded unless there are no more sub-levels to be displayed.
Note: You can expand only one group level at a time. If you expand the group level of another list
item, the previously expanded group level will get collapsed.
DAD SOMALILAND ANALYTICS TOT TRAINING MANUAL
8
Figure 6: Expanding the List Item Level
2.2.3 Sorting List Items
You can sort the list view by column by clicking on the name of the column. This will sort the list
alphabetically or numerically depending on the type of data entered into that column. The arrow
that appears on the column can reverse the order of the list.
2.2.4 Browsing among List Items
You can browse among the list items by clicking on the number link of the page to navigate to. The
Previous and Next buttons can be used to move to the required page.
2.2.5 Hiding / Showing Images in the List
In order to make the list load quicker, you can choose to hide the images which are displayed in
the list. These images can be donor flags, sector icons, etc.
To hide the images in the list, click on the
All the images in the screen will not display (Figure 7).
button located at the top of the screen.
DAD SOMALILAND ANALYTICS TOT TRAINING MANUAL
9
Figure 7: Hiding Images in the List
Click the
button to show the images (Figure 7).
2.2.6 Modifying the Current View
It is possible to modify the list that is currently displayed in the List module. You can add new
groupings to it or remove the selected ones, (un-) select columns, re-order them, etc. The steps
described below provide for the necessary instructions for modifying the current view.
1. Click on the Modify Current View link at the top right corner of the List screen. A Modify
Current View window (Figure 8) will appear.
2. In the Groupings section, add / re-order / remove groups.
3. In the Columns section, add / re-order / remove columns.
4. In the Cross Tab Groupings section, define add / re-order / remove column groupings for
the view.
5. Set the view as default, if necessary. Please, note that the view can appear as default for a
current user or for unregistered public users.
DAD SOMALILAND ANALYTICS TOT TRAINING MANUAL
10
6. After finishing making changes in the view, click the OK button for the changes to take
effect.
Figure 8: Modifying the Current View
To add a group / column / column grouping to the list, follow the steps below:
1. In the Available Groups / Columns panel, select the group / column / column grouping to
be added to the list.
Note: It is possible to select several groups / columns by means of the Shift or Ctrl
keyboard buttons.
2. Click the
(Select) button. The selected group(s) / column(s) will appear in the
Selected Groups / Columns panel.
To re-order the selected groups / columns / column groupings, follow the steps below:
1. Select the group / column / column grouping that needs to be re-ordered in the Selected
Groups / Columns panel.
2. Click the Move Up / Move Down button.
To remove the selected groups / columns / column groupings from the list, follow the steps below:
1. In the Selected Groups / Columns panel, select the group / column / column grouping that
needs to be removed from the list.
2. Click the
(Unselect) button. The selected group(s) / column(s) / column grouping(s)
will be removed from the Selected Groups / Columns panel.
To set a view as default, follow the steps below:
1. Make the necessary changes in the current view as described in the sections above.
2. After finishing, click the Set as Default button in the Modify Current View window. Please
note that the view will be set as default only for the current user.
Note: Clicking the Set as Default for Public Users button will display the view to those who
access the application as unregistered public user.
DAD SOMALILAND ANALYTICS TOT TRAINING MANUAL
2.3 ANALYTICS – LESSON 3 - CHART
This lesson will guide you through the steps on how to work in the Chart module (Figure 9).
Figure 9: Chart Module
2.3.1 Accessing the Chart Module
Click the Chart tab to access the Chart module (Figure 10).
Figure 10: Chart Tab
2.3.2 Chart Options
You may define any set of options to generate the chapter.
The following options are available in the Main screen of Chart module (Figure 11):
11
DAD SOMALILAND ANALYTICS TOT TRAINING MANUAL
12
Figure 11: Main Screen of the Chart Module
1. Category - allows selecting one of the options provided in the Category drop-down menu
located at the top of the Chart window. The selected category will define one of the chart
axes. Selection of a category for the chart report is required.
2. Series - allows selecting one of the options provided in the Series drop-down menu located
at the top of the Chart window. The selected series will define the chart legend. Selection of
a series for the chart report is optional.
Note: Clicking the
selections.
(Swap) button allows switching places of category and series
3. Chart Types - allows defining the chart type. The following options are available:
•
Bar chart
•
Stacked 3D Bar chart
•
Column chart
•
Stacked 3D Column chart
•
3D Bar chart
•
Pie chart
•
3D Column chart
•
3D Pie chart
•
Stacked Bar chart
•
Line chart
•
Stacked Column chart
DAD SOMALILAND ANALYTICS TOT TRAINING MANUAL
13
4. Show Top <Number> - indicates the maximal number of category items to be displayed
in the chart.
5. Show Top <Number> on Secondary Axis - indicates the maximal number of series
items that should be displayed on the secondary axis in the chart. Becomes available only if
a Series is selected. This option is disabled if you have selected the pie or line chart types.
6. Char Count - limits the number of characters to be used to display the category item
names to the value set in this field.
7. Values - allows selecting a value from the list that will define the main chart criteria.
8. Update - loads the latest data from the database and displays them on the chart.
9. Reset Default - loads the default chart built according to the default chart category and
chart type.
10. Workspace - the main working area in the Chart module where the chart designer is
displayed.
The following options are available in the View section of Chart module (Figure 12):
Figure 12: View Screen of the Chart Module
1. Show - allows selecting one or several of the following options:
● Data Table - presents the information contained in the chart in a grid or matrix.
DAD SOMALILAND ANALYTICS TOT TRAINING MANUAL
●
●
●
●
●
14
Data Label - shows the actual values of each chart cell. This option is disabled if you
have selected the pie or line chart types.
Legend - explains the categories and data series displayed on the chart.
Pattern - allows choosing a pattern-filled chart for black and white printing.
Coloring Option - allows defining whether the chart should be displayed in multiple
colors or in one of the colors available.
Show in – allows defining how the numeric values will be displayed on the chart. To
avoid large number occupying too much space, you can choose to view the numbers in
thousands / millions / billions.
2. Title – a text box to enter the chart report title.
3. Note - a text box to enter additional information about the chart report.
4. Footer - a text box to insert a portion of text that will appear in the bottom area of the
chart report.
5. Subtitle - a text box to enter a subtitle for the chart report.
6. Font - allows selecting the font the chart report title/subtitle/footer/note will appear in.
7. Size - allows selecting the font size the chart report title/subtitle/footer/note will appear in.
8. Workspace - the main working area in the Chart module where the chart designed is
displayed.
When you are done with selecting chart options, press the Update button to generate the chart.
DAD SOMALILAND ANALYTICS TOT TRAINING MANUAL
Figure 13: Update Button in Chart Module
15
DAD SOMALILAND ANALYTICS TOT TRAINING MANUAL
16
2.4 ANALYTICS – LESSON 4 - REPORT
This lesson will guide you through the steps on how to work in the Report module (Figure 14).
Figure 14: Report Module
2.4.1 Accessing the Report Module
Click the Report tab to access the Report module (Figure 15).
Figure 15: Report Tab
2.4.2 Creating a Report
Define what information you would like to have displayed on the generated report:
● Text entries – title, subtitle, header, and footer. For these fields, the expected input is a
free text.
● Report grouping - allows grouping data according to a specific category. Grouped data
appear in different tables. Each table contains data that fall under one group of the category
specified.
● Rows - group data within the report table.
● Columns - show details specific to each table row.
● Sub-columns - divide the row details displayed under each column.
DAD SOMALILAND ANALYTICS TOT TRAINING MANUAL
17
In order to add report components, follow the steps below:
1. Type the text that should appear as the report title in the Title text box.
2. Enter a Subtitle, Header, and Footer if needed.
3. In the Group Report by section, specify the category, which will be used to group data into
different tables. To add a report grouping, click on the Add Grouping link in the Group
Report by section and select the appropriate category from the menu that appears (Figure
16).
Note: The report will be divided into as many tables as there are table groupings selected.
4. Select table rows by clicking on the Add Row link and selecting the appropriate item from
the menu that appears. Please note that it is possible to select one row at a time from the
list of available rows.
5. Select table columns by clicking on the Add Column link and selecting the appropriate item
from the menu that appears. Please note that it is possible to select one column at a time
from the list of available columns.
Note: Once you have selected a report column, an Add Sub-column link becomes available
under the selected column. It allows indicating how the row details displayed under each
column will be divided.
Figure 16: Selecting a Grouping for a Report
Note: At any point it is possible to remove all components selected for the report and design a new
report from scratch by clicking on the
(Reset) button.
DAD SOMALILAND ANALYTICS TOT TRAINING MANUAL
18
Note: If you have defined a report which has incompatible columns (columns over which reports
cannot be generated), they will be marked in red and an error message will occur. To make your
reports productive, use the link (as marked in red, Figure 16) to open the Compatibility Matrix
table (Figure 17). This is a table that displays the compatibility between all categories and
measures in the database to display them in the report.
Figure 17: Compatibility Matrix
2.4.3 Previewing a Report
Look in the Preview section at the bottom of the page in order to view the final structure of the
report (Figure 18). The Preview will not be ready for viewing unless you have at least one table row
defined.
DAD SOMALILAND ANALYTICS TOT TRAINING MANUAL
19
Figure 18: Previewing the Report
All your added report components and structuring results will be displayed in the Preview section
which helps you to check whether the report matches the required output or not. Expand the
section in order to display whole of the information.
2.4.4 Generating a Report
Click the
(Submit) button to submit the Reporting Engine in order to access the
database, gather the required data and present it in the manner required. The Report containing all
the real data appears in a new window.
2.4.5
Formatting/Styling Report Components
You may format/style the text entries as well as main report table captions and values by assigning
to them value characteristics such as font, font size, font color, background color, alignment (i.e.
left, center, or right), etc. In order to format/style a report component, follow the steps below:
1. Click the report component that needs to be formatted / styled.
2. Select the Properties option from the actions list that appears (Figure 19).
DAD SOMALILAND ANALYTICS TOT TRAINING MANUAL
20
Figure 19: Reports Window with Properties Focus on the Title Field
The Properties window will appear. Please note that for text entries the Properties window
includes text formatting buttons and a text area (Figure 20). For other report components,
like rows, columns, etc., the Properties window also allows assigning additional
characteristics, e.g. sorting order, reference text, etc. (Figure 22).
Figure 20: Formatting/Styling Text Entries
3. Change the properties as needed.
DAD SOMALILAND ANALYTICS TOT TRAINING MANUAL
21
Note: To prevent you navigating away from the section every time when modifying the
properties of a different report table component, the Properties window allows selecting the
next item to be modified. To do that, you need to select the appropriate instance from the
Items drop-down list in the Properties window. The list contains the previously selected
report table components.
4. Click the Apply button for the changes to take effect. Clicking the OK button will close the
window and navigate you to the Report module.
Figure 21: Reports Window with Properties Focus on the Column
DAD SOMALILAND ANALYTICS TOT TRAINING MANUAL
22
Figure 22: Assigning Properties to Report Table Components
2.4.6 Re-ordering Report Table Components
In order to re-order report table components, follow the steps described below:
1. Click the component item that needs to be reordered in the report.
2. Select the respective Move Up / Move Down / Move Right / Move Left option from the
menu that appears. The report generated will maintain the order of the items that was
displayed in the Report Designer (Figure 23).
Figure 23: Reordering Report Table Components
Note: If any of these actions is not available, the respective option will be disabled in the menu.
2.4.7
Sorting Report Table Components
In order to alphabetically sort the report table components in Ascending (A-Z) or a Descending (ZA) order, follow the steps below:
DAD SOMALILAND ANALYTICS TOT TRAINING MANUAL
23
1. Click the component item for which the sorting order needs to be changed.
2. Select the Sorting Order option from the actions list (Figure 24).
3. Define whether the report item values should be sorted in the ascending or descending
order. Please note that selecting the None option from the list removes the sorting criteria.
Figure 24: Defining the Sorting Order
2.4.8
Removing a Report Table Component
In order to remove a report table component, follow the steps below:
1. Click on the component item that needs to be removed.
2. Select the Remove option from the menu that appears. The selected grouping value will be
removed.
2.4.9
Switching Report Table Components
In order to switch report table components, follow the steps below:
1. Click the component item that needs to be switched.
2. Select the Switch Place with option from the menu that appears (Figure 25).
Figure 25: Switching Report Table Components
3. Define what component item the selected instance needs to switch place with. The selected
component item will be removed from its current position and added as an item to the
specified component.
DAD SOMALILAND ANALYTICS TOT TRAINING MANUAL
24
2.5 ANALYTICS – LESSON 5 - CUSTOMIZED REPORTING
This lesson will guide you through the steps on how to customize the already-created reports in the
List, Chart, and Report modules, i.e. to define the way the numeric values can be displayed, their
format, the number of the items to be displayed, etc. You may also re-organise the reports in the
desired way, i.e. include it into a group of reports or create a new report group for it, rename the
report, etc. The DAD Somaliland application can also export the reports to the desired format
(Word, Excel, etc.) or print them out.
2.5.1 Setting Report Options
In the List and Report modules, you can define whether the numeric values should be displayed in
thousands, millions, etc.
In order to set the report options, follow the steps below:
1. Click the
(Set Options) button in the top toolbar. An Options window (Figure 26) will
appear.
2. Define the format in which the numeric values should be displayed, i.e. whether the original
values should be displayed or they should be shown in thousands, millions, etc. This
prevents large numeric values represented by many zeros from taking a lot of space in the
report.
Figure 26: Setting the Chart Report Options
3. Click the OK button for the changes to take effect.
2.5.2 Saving Reports
There are two ways of saving a report in the DAD Somaliland application. You can save a newlycreated report, or save a copy of an existing report with a different name, in a different location, or
with a different content.
In order to save the report created, follow the steps below:
1. Click the
(Save) button on the top right side of the screen. A Memorize Report window
(Figure 27) will appear.
2. Define the report name in the Memorized Name field in English and Somali.
DAD SOMALILAND ANALYTICS TOT TRAINING MANUAL
25
Figure 27: Memorizing a Report
3. Specify the group the report will be included in by selecting the appropriate value from the
Include under the Following Group combo box.
4. Check the Include currently selected filters checkbox to save filtering defined along with the
report.
5. Click on the OK button to save the report for future reference.
In order to save a copy of an existing report, follow the steps below:
1. Click on the
button on the top right side of the screen. A Memorize Report
window (Figure 27) will appear.
2. Save the report by the steps described in the section above.
2.5.3 Re-organising Reports
From the List, Chart, and Report modules, you can design appropriate reports and organize them
in the preferred way. In order to organise the reports, click the respective
(Organise Views /
Charts / Reports) button at the top right side of the screen. An Organise Reports window (Figure
28) will appear.
DAD SOMALILAND ANALYTICS TOT TRAINING MANUAL
Figure 28: Organizing the Reports
You may perform the following actions:
• rename a report/report group:
1. Highlight the report / group to be renamed.
2. Click the Rename button.
3. Fill in the desired name for the report / group.
4. Click the Enter keyboard button to confirm renaming.
Note: Public Reports and My Reports groups cannot be renamed.
•
delete a report/report group:
1. Highlight the report / group to be deleted.
2. Click the Delete button.
3. Click the OK button to confirm deletion.
Note: Public Reports and My Reports groups cannot be deleted.
•
add a sub-group:
1. Click the Add Group button.
2. Fill in the desired name for the sub-group.
3. Click the Enter keyboard button to confirm adding.
•
re-order reports/report groups:
1. Highlight the report / group the sorting order of which needs to be changed.
2. Click the Move Up / Move Down button.
3.
26
DAD SOMALILAND ANALYTICS TOT TRAINING MANUAL
•
27
In order to set a report as default, follow the steps below:
1. Highlight the report to be displayed in the respective module when you access it.
2. Click the Set as Default button. The selected report will be marked with (default for
me) option.
Note: The Set as Default for Public Users button is only available for administrators
and will save the current view as a default for all unregistered/public users.
Note: This option is available only in the Chart and Report modules.
2.5.4 Viewing Pre-defined Reports
In the List, Chart, and Report modules, you can view the pre-defined reports stored under Public
Views/Charts/Reports or My Views/Charts/Reports section for data analysis and comparison.
For this purpose, select the report to display and click one of the following Generate Report
buttons to the left of the report name:
•
- in the List module;
•
- in the Chart module;
•
- in the Report module.
The selected report will open in the application window (List and Chart modules) or a new window
(Report module). The same results can be achieved if you click the report name.
2.5.5 Editing Pre-defined Reports
To save you the time and the effort of structuring a report from the scratch when it is necessary to
introduce some modifications in any of the pre-defined reports stored under Public Reports or My
Reports, the Edit option has been designed in the Report module.
In order to edit reports, click the
(Edit) button to the left of the report to edit. The selected
report structure will be loaded in the application window giving you the possibility of formatting and
styling it in the desired way.
The pre-defined List and Chart reports stored in Public Views/Charts or My Views/Charts can
also be edited after you have selected to view them. Once the selected report is loaded in the
application window, make the appropriate changes and save them. If you wish to keep the
modifications, do not forget to save the modified report.
2.5.6 Exporting Reports
From the Chart and Report modules, you can design appropriate reports and export them in the
PDF, MS Word and MS Excel formats.
In order to export the reports in the PDF, MS Word and MS Excel formats, follow the steps below:
1. Click on the respective
(Export in PDF Format) /
(Export in MS Word Format) /
(Export in MS Excel Format) button. A separate window will open.
2. Make changes, if necessary.
DAD SOMALILAND ANALYTICS TOT TRAINING MANUAL
28
2.5.7 Printing Reports
From the Chart and Report modules, you can design appropriate reports and print them out. In
order to print out the selected report, follow the steps below:
1. Click the
(Print) button on the top toolbar in the right side of the screen. A separate
window will open.
2. Select the Print option.
DAD SOMALILAND ANALYTICS TOT TRAINING MANUAL
29
2.6 ANALYTICS – LESSON 6 - FILTERING
This lesson will guide you through the steps on how to create Filters.
2.6.1 Accessing the Filtering Section
You can see the Filters section on the left side of the applications (Figure 29).
Figure 29: Filtering Section
2.6.2 Creating Filtering Criteria
Follow the instructions below to create filtering criteria:
1. Click on the hyperlink under the Filters section that represents the Category according to
which the filtering will be carried out. A Filters window (Figure 30) will appear having the
Category Item pull down menu set to the selected Category. The first text area holds a
list of all the available Category items that the report could display, whereas the second
DAD SOMALILAND ANALYTICS TOT TRAINING MANUAL
30
text area holds a sub-set list of the first one. You may only edit the sub-set list in the
second text area. At the end of the filtering, if the sub-set list is empty, all the Category
items will be included in the report. If, however, the sub-set is non-empty, only the items in
the sub-set list will be included in the report. At the bottom of the pop-up window the
selection criteria from all categories are presented. This view is also available from the main
screen under the hyperlink View Criteria.
Figure 30: Creating a Filtering Criteria
2. Select a Category item from the list in the first text area.
Note: To make it easier to locate the appropriate category item in the long list, the Filters
window has a search capability. To find the relevant category item, you can enter any
combination of letters in the search field. The list of all category items matching the criteria
will be displayed in the first text area (Figure 31). To remove the search criteria, use the
(Delete) button to the right of the search field.
DAD SOMALILAND ANALYTICS TOT TRAINING MANUAL
31
Figure 31: Searching for a Filtering Category Item
3. Click on the downward-pointing arrow button to add the item selected to the list in the
second text area (Figure 32).
4. Repeat steps 2 and 3 to add more than one Category item.
Note: If a Category item needs to be removed from the second text area, select it from
the list in the second text area and click on the upward-pointing arrow button.
5. Click on the OK button to apply the filtering to the ad-hoc query and to the screen that was
active prior to the filtering alterations (i.e. List or Chart). The system will regenerate and
download, to the client’s side, an updated report that applies the updated filtering criteria.
DAD SOMALILAND ANALYTICS TOT TRAINING MANUAL
32
Figure 32: Creating a Sample Filtering Criteria
Note: It is possible to exclude a Category item(s) from being included into the filtering criteria to
be created. In this case, tick the Exclude check box. All the Category items that appear in the
second text area will be excluded from the filtering criteria to be created.
DAD SOMALILAND ANALYTICS TOT TRAINING MANUAL
33
2.7 ANALYTICS – LESSON 7 - SEARCH
This lesson will guide you through the steps on how to organize Search for any relevant
information.
2.7.1 Accessing the Search Section
You can view the Search section on the left side of the applications (Figure 33).
Figure 33: Search Section
2.7.2 Simple Search
To find any relevant information quickly and easily within the integrated DAD Somaliland content
you can type search operators directly into the search box (Figure 33).
DAD SOMALILAND ANALYTICS TOT TRAINING MANUAL
34
2.7.3 Advanced Search
Follow the instructions below to create search criteria:
1. Click the Advanced Search link under the Search section (Figure 33). The Advanced
Search form appears (Figure 34).
Figure 34: Advanced Search Section
2. Define the text to search for in the appropriate field.
3. Specify the fields to look in by selecting the appropriate checkbox(es).
4. Click the OK button to apply the search criteria to the ad-hoc query and to the screen that
was active prior to the filtering alterations (i.e. List or Chart).
DAD SOMALILAND ANALYTICS TOT TRAINING MANUAL
35
3. REFERENCES
The following DAD Somaliland documents may provide you with more details on the content and
functionality of the sections described in the training lessons:
•
•
•
•
DAD Somaliland Analytics User Manual
DAD Somaliland Projects Application User Manual
DAD Somaliland MDG Profiles Application User Manual
DAD Somaliland Administration Center User Manual