1
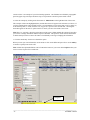
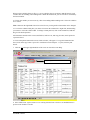
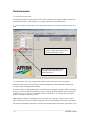
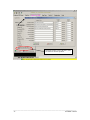
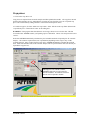
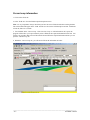
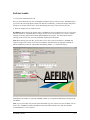
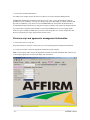
ALBERTA FARM FERTILIZER INFORMATION AND RECOMMENDATION MANAGER
VERSION 2
TUTORIAL
Table of Contents
1. Downloading the software........................................................................................................... 2
2. Entering your information.......................................................................................................... 2
Getting started ............................................................................................................................. 2
Producer/Farm contact information ............................................................................................ 3
Field information......................................................................................................................... 6
Fertilizer costs ............................................................................................................................. 7
Crop prices .................................................................................................................................. 9
Current crop information .......................................................................................................... 10
Soil test results .......................................................................................................................... 11
Previous crop and agronomic management information........................................................... 12
Saving your information ........................................................................................................... 13
3. Generating a field fertilizer recommendation ........................................................................... 14
Interpreting results .................................................................................................................... 15
Running scenarios ..................................................................................................................... 15
Printing reports.......................................................................................................................... 16
4. Running the farm optimization ................................................................................................. 17
Interpreting results .................................................................................................................... 18
Running scenarios ..................................................................................................................... 19
Printing reports.......................................................................................................................... 20
AFFIRM Tutorial
-1-
This tutorial will work through a farm example to assist you in entering your data, troubleshooting any
problems you have encountered and interpreting the output. Tips will be mentioned as we work our way
through this example.
1. Downloading the software
Unlike other software programs, AFFIRM is a self-contained, single executable file (~2.5 MB). It is
recommended that you download the software to your desktop. Simply copy the AFFIRM.EXE file to your
desktop screen.
2. Entering your information
Getting started
1. Double click the icon to open the program.
Every time you start AFFIRM, an opening screen will appear that allows you to:
• Create a new file/farm
• Open an existing file/farm
• Open an example
For this tutorial, we will open an example. When you input your own data, you will choose to create a new
file/farm.
2. Click on the ‘open an example’ option and then click OK.
______________________________________________________________________________
-2–
AFFIRM Tutorial
Producer/Farm contact information
1. Click the middle button
on the upper right hand side of the screen to maximize the screen size. (This
will maximize your screen to display all contents on the screen.)
As you can see, AFFIRM v.2 is designed in 7 main screen tabs sequentially ordered for you to enter
information. The design follows the concept of the new farm optimization model – considers the entire
farm as an operation, rather than looking at individual fields when making economic fertilizer decisions.
Setup is centered on the farm level, where farm information is required first and then we will work our way
to entering individual field information.
For this tutorial, we will use ‘KPS Farms’ as our example. There are five other example farms available,
each representing a different soil group within the province.
Farm
Soil group
Laboratory
Crops
Star Precision
Black (NE)
Norwest
CWRS Wheat
Irrigation, Brown
Sandberg
Sunflower, Field Bean, Canola, Soft Wheat, Silage Corn
Brown
Lakeside
CWRS Wheat, Feed Barley, Durum, Chickpea, Grass Legume(50%)
Dark brown (SW)
Midwest
Mustard, Durum, Canola, Malt Barley, Winter Wheat
Clover Bar Farms
Harvest Ridge
KPS Farms
Black Gold
Black (NE)
Norwest
Field Peas, Feed Barley, Grass Legume(30%), Oats, Triticale
Sunset Farms
Dark grey (Peace)
Envirotest
Grass Forage Seed, CWRS Wheat, CPS Wheat, Canola, Field Peas
Keenter Swine
Dark grey (SW)
A&L
Field peas, Legume Forage, Winter Wheat, Fababean, Grass legume (50%)
AFFIRM Tutorial
-3-
‘Star Precision’ is an example of a precision farming operation. One field has been divided by topographic
position (upper slope, mid slope and lower slope) to represent the variations present within a field.
2. Select the example by clicking on the farm name of ‘KPS Farms’ on the right hand side of the screen.
This example will become highlighted (blue) and the farm name will appear in the tab name (see below). If
you have multiple farms entered within one file, it is important that you select the farm you are working on,
as all following data (i.e. fields, fertilizer cost, crop price) is specific to the selected farm. Checking the
name that appears on the tab is a quick reference to ensure you have selected the correct farm.
TIP: There is a ‘read only’ check box at the bottom of the screen. When enabled, this option will not allow
you to enter or change information and the help bar is disabled. This option is useful when all information
is finalized and you want to remove the chance of accidentally removing or changing the information.
3. Click the ‘Read Only’ check box to disable the option.
When you enter your own information, use the mouse to click on the different input cells or use the tab key
to maneuver quickly between the cells.
TIP: Variable descriptions/definitions can be found at the bottom of your screen in the help bar when your
cursor or mouse is placed in a variable box.
Help bar
______________________________________________________________________________
-4–
AFFIRM Tutorial
When you have multiple farms per file (e.g. you are a dealer), there is an option to sort all farms by each
variable either in ascending or descending order. Within the field list tab, you are also able to sort fields by
the listed variables.
4. Click on the variable you want to sort by, either in ascending and descending order. Notice the variables
are re-sorted.
TIP: Columns on the right hand side can be resized for easy viewing and/or column order can be changed.
5. To resize the column width, place your mouse in between the column titles. Right click, hold and drag
your mouse to resize the column width. To change column positions, click on the column title, hold and
drag it to the desired position.
All information entered on this screen (and field list, fertilizer cost, and crop price tabs) can be printed or
exported to Excel.
6. Click on the printer button and a screen, similar to below, will appear. To copy this information into
Excel, click on the copy button. Open a new worksheet in Excel and paste. To print, click the print
button.
7. Click the x in the upper right hand side of the screen to close this screen dialog.
Copy displayed information into Excel.
8. Select ‘KPS Farms’ again to ensure we are working with this farm or check to see that KPS Farms is
present on the ‘Producer’ tab title.
AFFIRM Tutorial
-5-
Field information
1. Click on the ‘Field List’ tab.
Field description/name, soil group and size of the field (i.e. field area) are required variables. KPS Farms
currently has 5 fields. For this example, we are going to add another field to KPS Farms.
2. Click on ‘Add a new field’ button. Enter the field information as seen in the screen below for the new
field.
Automatically determine your soil
group, ecoregion and ecodistrict from
a legal land description (LLD).
This is one of the important variables
hyperlinked to the user manual for
further information.
3. To determine the soil group, ecoregion and ecodistrict, click on the LLD to Soil Group button.
Dark Brown (Southwest) and Cyprus Hills soil group should appear, with the Moist Mixed Grassland
ecoregion and the Lethbridge Plain ecodistrict.
If you do not know the legal land description of the field you are analyzing or disagree with the determined
soil group, you can override the calculator and select a soil group from the drop down menu. Ecoregion or
ecodistricts, however, can only be determined from the LLD calculator. To visualize the provincial soil
groups, a Soil Map of Alberta is provided.
TIP: Important variables are hyperlinked to the user manual (eg. soil group). When you click on these
titles, related sections of the user manual will appear where you can find further information on the subject.
The field area information is important to complete the farm optimization and calculate total fertilizer costs.
______________________________________________________________________________
-6–
AFFIRM Tutorial
Fertilizer costs
1. Click on the ‘Fertilizer Cost’ tab.
The fertilizer cost screen provides two important functions. First it allows the user to select the crop year.
This year selection will affect all of your subsequent fertilizer and crop information, field recommendations
and farm optimization screens. Each of the subsequent screens will display a year tag to identify the year
you are working with. This also allows the user to store historic information (fertilizer costs, crop prices,
soil test data and field history). Please note, if you want to input historic information for your own farm,
you need to identify the oldest year to input and store the historic information. AFFIRM will only add
newer years after the year you start with. Remember, if you want to switch crop years, this the screen you
must use.
The second function of the Fertilizer Cost screen is to input the initial fertilizer cost information. Fertilizer
costs are required for the economic analysis and farm optimization models. You can either directly input
nutrient costs ($/lb) or use the ‘Fertilizer Nutrient Calculator’ to automatically determine actual nutrient
cost per pound from blended nutrients. For this example, the macronutrient costs (i.e. N, P, K and S) is
already included, however, lets determine these nutrient costs from blended fertilizers.
2. Click on the ‘Fertilizer Nutrient Calculator’.
This calculator requires you to select a fertilizer for each nutrient and enter the cost (per tonne) to
automatically calculate nutrient costs.
3. Following the example below, select the fertilizers from the drop down menus and enter the
accompanying prices.
4. Click the ‘Save’ button to accept these numbers and they will appear on the main screen once saved.
When you enter fertilizer costs for your farm, AFFIRM will require you to set a starting year before
entering any costs. AFFIRM records fertilizer costs on a yearly basis. Once you have set the year, all
entered fertilizer costs, crop prices and analyses will pertain to that year. To enter data for next year, click
on the ‘Add a year’ button. You cannot, however, enter data prior to the starting year that was set.
TIP: If you do not have fertilizer costs handy, simply click on ‘Historical Fertilizer Prices’ for average
fertilizer ($/tonne) and actual nutrient ($/lb) prices for the last 6 six years. Print tables for reference.
AFFIRM Tutorial
-7-
Historical fertilizer costs of the last 6 years
for numerous fertilizer products.
______________________________________________________________________________
-8–
AFFIRM Tutorial
Crop prices
1. Click on the ‘Crop Price’ tab.
Crop prices are required for the economic analysis and farm optimization models. All crop prices entered
pertain to the operating year (eg. 2004) that was set in the previous ‘Fertilizer Cost’ tab. Expected crop
prices can be entered in any selling unit that is selected from the drop down menu.
2. To add a crop price, click the ‘Add a new crop’ button. Select Triticale as the crop. Enter $85.00 in the
‘expected sale price’ cell and select ‘tonne’ as the selling unit.
WARNING: If the program alerts that $85.00 is out of range, choose not to revise the data. This has
occurred because AFFIRM assumes you inputting a price of $85.00/bu. Choose ‘NO’ and proceed to select
‘tonnes’.
Notice that AFFIRM automatically calculates the price in bushels under the ‘Expected price for economic
analysis’. The software requires bushel, ton or pound units (depending on the crop) to carry out the
economic analysis. Once you have entered a crop price, AFFIRM automatically calculates the required
units. Please note that the results of the economic analysis will be reported in these units (not the unit you
reported the crop price in!).
Although price was entered as tonnes,
AFFIRM requires the crop price data for
triticale in bushels. All economic results for
triticale will be reported in bushels.
AFFIRM Tutorial
-9-
Current crop information
1. Click on the ‘Field’ tab.
2. Select ‘Field A15’ from the field description drop down menu.
TIP: It is very important to always check that you have the correct field selected when entering the data.
The selected field will appear in the ‘Field’ tab title as well as in the field description variable. Within the
‘Field’ tab, there are 3 sub tabs.
3. You should be in the ‘Current Crop’. If the ‘Previous Crop’ or ‘Soil Information’ tab is open, the
program will not allow you to proceed until you have filled out the required information for that tab. You
will have to proceed to that section of the tutorial first and fill in the required information before you can
open the ‘Current Crop’ tab.
4. Within the ‘Current Crop’ tab, you will need to fill out the information as below:
______________________________________________________________________________
- 10 –
AFFIRM Tutorial
Soil test results
1. Click on the ‘Soil Information’ tab.
Here you enter information on your soil sampling techniques and your soil test results. AFFIRM requires
you to select the soil sample depth, sample time and soil test laboratory you had your samples analyzed at.
Fertility levels and soil texture can be easily entered using the tab key to move between the cells.
2. Enter the example soil test results as below.
WARNING: When entering the example below, AFFIRM will warn you that the K levels are out of range.
This just indicates to you that the K level is high. Choose not to revise the data, as it is correct. Similar
warning screens may appear when entering data throughout the program. The main purpose of these
warning screens is to prevent you from accidentally entering an usual number.
TIP: When entering your own data, you may have two or more results for P and/or K. AFFIRM only
requires a single result. Please refer to the User Manual to determine the most appropriate method for
Alberta conditions (Section D: Nutrient Recommendation Model - 1.c. Soil test laboratory).
ENR (Estimated Nitrogen Release)
Although not all variables are required, AFFIRM will alert you if important information is missing for the
calculations.
TIP: If your soil test does not provide certain information (eg. CEC values), leave the cell blank. Do not
enter a zero. AFFIRM recognizes the difference between a blank cell and a zero and will calculate a
recommendation if a zero is entered.
AFFIRM Tutorial
- 11 -
3. Click on the ‘Calculate ENR’ button.
According to the example, the specific lab test of hot KCl was used to determine ENR potential.
AFFIRM has calculated an estimated nitrogen release of 81.7 lb/ac. This is the amount of N that can
potentially become available to your crop over the growing season (depending on weather conditions and
physical soil conditions). The current version of AFFIRM indirectly incorporates the ENR into the N
recommendation and yield response by using the soil group to calibrate crop response to nitrogen fertilizer.
If you do not have an organic matter estimate of your field, AFFIRM will use your soil group organic
matter average to calculate an ENR value, seen in the ‘Soil Group OM’ cell. For this example, the dark
brown soil group has an average organic matter content of 4.6%.
Previous crop and agronomic management information
1. Click on the ‘Previous Crop’ tab.
Drop down menus are used here to fill in your previous crop and agronomic management information.
2. Use the screen below to fill in the appropriate information for this example.
TIP: Use the help bar and/or click on the hyperlinked variables for further information that will assist you
in selecting the appropriate variables when filling your information.
______________________________________________________________________________
- 12 –
AFFIRM Tutorial
Saving your information
1. Click on the button with the computer disk at the top of the screen to save.
The saving location is defaulted to ‘My Documents’ folder, but it is recommended to create a new folder in
a location of your choice. AFFIRM files are stored as .fir (fertilizer information recommendation). These
files can only by read by AFFIRM, though you are able to export data to Excel.
2. Rename the file and save it in a folder for your choice.
Once you have saved a file, the file name will appear in the white box of the opening screen for quick
access next time you open AFFIRM.
AFFIRM Tutorial
- 13 -
3. Generating a field fertilizer recommendation
1. Click back to the ‘Current Crop’ tab.
2. Click the ‘RUN’ button.
Your screen should appear as below:
Estimated Growing Season Precipitation
Five main sections comprise the main analysis screen. Each screen is dynamic to allow you to expand or
minimize a particular section (similar to resizing of the column widths). The fertilizer recommendation
table is on the left and the economic analysis table is on the right. The graphs on the bottom left displays
estimated yield and marginal return from increasing nitrogen applications. The ‘alert messages’ box
displays important information regarding your field conditions or fertilizer recommendations. The ‘user
notes’ section is your place to store notes of any type regarding the field. For example, you may want to
record information regarding type of fertilizers previously used, locations/presence of previous lodging or
the amount of precipitation received last year.
TIP: For some crops, there may not be yield response data available to run an economic analysis.
AFFIRM will warn you of this before a recommendation is made. Please refer to the nutrient
recommendation model section of this user manual for a full explanation of the steps involved in generating
a recommendation and a list of crops with yield response equations.
______________________________________________________________________________
- 14 –
AFFIRM Tutorial
Interpreting results
AFFIRM generates recommendations for wet, medium and dry moisture conditions, based on the amount
of precipitation you anticipate throughout the growing season. Blue color is associated with wet
conditions, green = medium moisture and red = dry soil conditions. For the soil group of this example,
AFFIRM estimates the growing season precipitation (between May - July) between 245 mm (wet) and 81
mm (dry). For those nutrients with no soil test data, the recommendation table indicates this nutrient was
not analyzed (i.e. n/a). Only N recommendations are included in the economic analysis and therefore the N
values reported within the table are dependent upon the set investment ratio. AFFIRM has defaulted the
investment ratio (i.e. IR) at 2, but you can increase or decrease the IR to reflect your comfortable risk level.
The nitrogen economic analysis table presents the estimated yield, marginal return and investment ratio for
each 10 lbs of nitrogen applied for the three moisture conditions. For a complete display of the economic
analysis, click on the wet, med and dry moisture tabs. Calculation equations are given in the User Manual
section F: Nitrogen Economic Analysis Calculations.
The two graphs visualize the economic analysis, displaying the yield increase potential and allow you to
track marginal return from increasing nitrogen applications under the three moisture levels. The dark blue
line of $/10 lbs N indicates the marginal cost. Because the investment ratio is equal to the marginal
return/marginal cost, the point at which the two lines intersect indicate an investment ratio of 1. The stars
mark your investment ratio, identifying the estimated yield and marginal return at that risk level.
Alert messages contain important information regarding methods of fertilizer application and other
pertinent information to improve soil test results and/or your soil quality. Please consider these comments
when making your fertilizer decisions. Further information can be found on these comments in the
reference section of this user manual.
Running scenarios
AFFIRM v.2 allows you to easily run different scenarios by altering the investment ratio, crop price,
fertilizer cost or changing the current crop. Running different scenarios will allow you to understand the
effect of these changes have on the economic nitrogen fertilizer recommendations.
TIP: Any changes made on this screen (eg. N fertilizer cost) will result in changes in the respective tabs
(eg. fertilizer cost). It is recommended to change one variable at a time, making sure to restore the altered
variable before proceeding onto another variable.
The table below displays N recommendations from various scenarios. Under drier moisture conditions, all
nutrient recommendations are adjusted to anticipate decreased yield potential. When you decrease the
investment ratio or N fertilizer costs, recommendations increase. However, when crop prices decrease,
economic N recommendations decrease.
AFFIRM Tutorial
- 15 -
1. Run different scenarios, as suggested below (a-d), changing one variable at a time. Be sure to change
the variable back to the original value before looking at the effect of another variable.
a.
b.
c.
d.
Spring soil moisture changed from medium to dry.
Crop price decreased from $85/tonne to $75/tonne.
N fertilizer cost decreased from $0.42/lb to $0.38/lb.
Investment ratio decreased from 2 to 1.5.
With this type of exercise, you will begin to understand the factors that influence fertilizer
recommendations. Compare your results with the table below. They should be the same.
Nitrogen recommendations (lbs/ac) from various scenarios for field A15 of the KPS Farms example.
Moisture level
Wet
Medium
Dry
Original
Scenarios (all variables decreased)
example
45
30
20
a
Spring Soil Moisture
40
25
15
Crop Priceb
35
25
15
N Fertilizer Costc Investment Ratiod
50
65
40
50
25
35
2. Save your results as scenario ‘d’ (i.e. the original example, with an investment ratio of 1.5).
Printing reports
To print a recommendation report, click on the printer button. Similar to the previous tabs, you have the
option to print or copy the information into Excel.
______________________________________________________________________________
- 16 –
AFFIRM Tutorial
4. Running the farm optimization
Once you have entered data for all fields of the farm, you can proceed to the optimization tab, where you
can begin to consider N application for all your fields based on your fertilizer budget. Up until now,
AFFIRM has not considered your fertilizer budget and generated recommendations for individual fields.
However, when you make fertilizer decisions, you consider the total cost of all nutrients for all fields of
your operation. Based on a set fertilizer budget, the farm optimization component of AFFIRM will refine
your N recommendations to maximize your earning potential of your entire operation. To understand the
principles and calculations of the optimization models, please refer to the User Manual Section A.3.d: Farm
Optimization Model and Section G: Farm Optimization Model Calculations.
1. Click on the ‘Optimization’ tab (it may take awhile to load and the screen may go while loading – be
patient!).
Each analysis is dependent upon the moisture level. When working with your own data, ensure you select
the moisture level you feel is the most probable for the up coming growing season. For this example, we
feel that receiving approximately 150 mm of rain over the growing season is the most probable.
2. Click on the ‘Medium moisture condition’ tab.
3. Expand the alert message box to view all messages.
One of the first messages indicates that you will require
N recommendations (highlighted in
green) not optimized until you enter a
budget and run the model.
AFFIRM Tutorial
- 17 -
Before entering a fertilizer budget, AFFIRM calculates the P, K, S and micronutrient costs from the
recommendations of each field and the N recommendations for those crops without yield response data (i.e.
highlighted in dark grey).
The yellow table reports the total quantity (rate x field area) of nutrients required for the farm based on
individual field recommendations. In this example, $3,003 is needed to cover the P and S
recommendations for the farm. To cover the N cost of the mustard and winter wheat fields, $781 is
required. In total, $3,785 dollars are required before AFFIRM can start allocating N to the remaining four
crops.
The graph displays the fertilizer cost per acre for each field. You can get an idea of the proportion each
nutrient is contributing to the total cost. Before the analysis is run, N is not included in the total fertilizer
cost for those fields with yield response data (i.e. durum, canola, malt barley and triticale).
TIP: When a nutrient cost is not included (e.g. a micronutrient), AFFIRM cannot incorporate the cost of
any recommendations into the set costs.
Interpreting results
1. Enter a farm fertilizer budget of $15,000.
2. Click the ‘Run’ button.
As the optimization process runs through, you can see the program allocating N (in 10 pound increments)
to the field with the largest investment ratio until the budget is depleted or the target investment ratio is
reached. To understand the details of how AFFIRM allocates N amongst the fields, refer to Farm
Optimization Model Calculations in the User Manual.
______________________________________________________________________________
- 18 –
AFFIRM Tutorial
For this example, the budget was not enough to meet the target investment ratios of all crops. If we refer
back to each of the economic analysis for the four crops, we see the target investment ratio was only met
for Field A8. Because the budget is limiting, AFFIRM suggests cutting back 10 lbs N on each of the
remaining three fields (assuming the individual field recommendations were made with an investment ratio
of 2).
TIP: It is suggested to print out the economic analysis of each field when using the optimization model.
Referencing from these tables allows you to determine how close the optimization process approaches the
target investment ratio.
TIP: Notice the fertilizer cost per acre and total fertilizer cost in the last two columns of the bottom table.
Such information is valuable for other AAFRD programs like Money Map and Crop Choices.
Running scenarios
Like the nitrogen economic analysis, you are able to alter variables to determine their effect on the
recommendations. You may want to increase your budget, change a particular crop’s investment ratio, or
increase a crop price.
1.Increase the budget to $20,000.
Adequate resources are now available to meet the target investment ratios of all crops. In fact, only
$16,120 is required to meet the fertilizer recommendations of all fields based on the set target investment
ratios.
AFFIRM Tutorial
- 19 -
TIP: Changes made within this optimization model are linked back to all other information (i.e. changes in
crop price are also changed in the crop price tab). Saving a different file names is recommended when you
make changes, particularly if you want to refer back to your original analysis.
Printing reports
To print an optimization, click on the printer button. Similar to the previous tabs, you have the option to
print or copy the information into Excel. A separate report needs to the printed for each moisture level.
Click on another moisture level tab to display that report.
______________________________________________________________________________
- 20 –
AFFIRM Tutorial