1
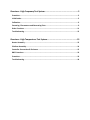
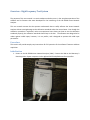
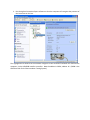
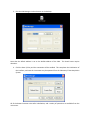
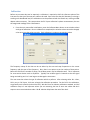
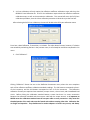
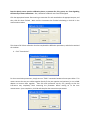
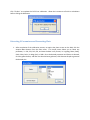
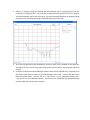
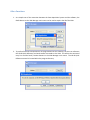
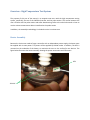
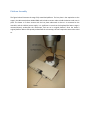
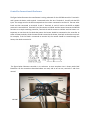
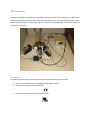
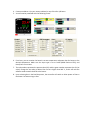
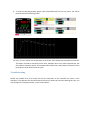
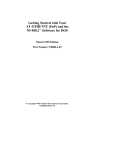
UNIVERSITY OF CENTRAL FLORIDA
DEPARTMENT OF ELECTRICAL
ENGINEERING AND COMPUTER SCIENCE
HEC 406 – NANO/MEMS LABORATORY
HIGH TEMPERATURE &
HIGH FREQUENCY TESTING SYSTEM
LABORATORY USER MANUAL
4/29/2011
Overview – High Frequency Test System ............................................................. 3
Procedure .......................................................................................................................... 3
Initialization ....................................................................................................................... 3
Calibration ......................................................................................................................... 6
Extracting S-Parameters and Generating Plots .................................................................... 9
Other Functions ............................................................................................................... 11
Troubleshooting............................................................................................................... 12
Overview – High Temperature Test System....................................................... 13
Heater Assembly .............................................................................................................. 13
Platform Assembly ........................................................................................................... 14
Controller Connections & Enclosure ................................................................................. 15
BNC Extensions ................................................................................................................ 16
Procedure ........................................................................................................................ 16
Troubleshooting............................................................................................................... 18
Overview – High Frequency Test System
The purpose of this user manual is to assist students and other users in the complete operation of the
software and its features that were developed for the interfacing of the HP 8720B Vector Network
Analyzer.
This user manual assumes that the operator understands how to safely calibrate the Vector Network
Analyzer without causing damage to the calibration standards other than normal wear. Even though the
calibration procedure is explained, unless an experienced user shows you how to use the calibration
standards properly, the calibration standards should stay in the box. The software was designed to be
robust against invalid inputs, however, it is not perfect, and is designed to operate with valid input
parameters.
Procedure
This section will provide step-by-step instructions for full operation of the software’s features and data
acquisition.
Initialization
1. Power on the HP 8720B Vector Network Analyzer (VNA). Connect the VNA to the laboratory’s
Data Acquisition System computer via the Agilent 82357B USB/GPIB Interface controller.
2. Run the Agilent Connection Expert software so that the computer will recognize the presence of
the instrument on the bus.
The highlighted area shows that the software recognizes a valid connection between the VNA and the
computer, via the USB/GPIB Interface controller. Note the address is GPIB1, address 16. (GPIB0 is the
GPIB Controller for the Semiconductor Testing System.)
3. Run the VNA Manager via the shortcut on the desktop.
Note that the default address is set to the default address of the VNA. This should never require
alteration.
4. Click the Start I/O key and the connection will be enabled. This completes the initialization of
the interface, and now the instrument may be operated from the laboratory’s Data Acquisition
System.
All of the buttons become active after initialization, and a variety of operations are available from the
main menu.
Calibration
Before any accurate data can be acquired, a calibration is required to shift the reference plane of the
instrument to the tips of the test port cables to be used. Due to the fact that this laboratory is missing a
working male broadband load, the calibration must be performed with the female set, utilizing an SMA
adapter when necessary. This compromises the full 2 port calibration’s phase measurements, but not
the magnitude readings of the S-Parameters.
1. From the main menu after initialization, press the Calibrate Menu button to set stimulus values
and type of calibration. Once a calibration is completed, the stimulus values cannot be changed,
so be sure to set the values correctly. Each calibration is unique to its stimulus values.
The frequency sweep of the VNA can be set either by the start and stop frequencies or the center
frequency and the span of the frequency. Also, there is an option to set the number of data points.
Below the field for the number of points, the incident power may be defined as well. This is important
for some active devices such as amplifiers. Typically the incident signal is lowered so that the signal
being received by port 2 isn’t too large as to damage the instrument.
The user must then select the type of calibration which to perform. After selecting either S11 1-Port,
S22 1-port, or Full 2-port, click start to begin the calibration procedure. For the Full 2-Port calibration,
we generally omit isolation (uncheck the box). We don’t have an isolation calibration standard, and this
calibration step isn’t too important unless you are measuring the loss of some test cables and don’t
expect to see transmission data under -20 dB. Isolation helps lower the noise floor level.
2. A 1-Port calibration will only require the reflection coefficient calibration steps, which use the
85052D 3.5mm Calibration kit. A Full 2-Port calibration requires both the reflection coefficient
calibration steps, as well as the transmission calibration. This manual will cover the Full 2-Port
calibration procedure, since the 1-Port calibration procedure is identical to just the first half.
After selecting the Full 2-Port calibration, the user will be led to the full 2-port calibration menu.
From here, select Reflection, Transmission, or Isolation. The order doesn’t matter; however, if isolation
was omitted by unchecking the box in the previous menu, it will already be marked as completed in this
menu.
3. Click “Reflection”.
Clicking “Reflection” directs the user to the Reflection Parameters menu, where the user completes
each of the reflection coefficient calibration standards readings. The S11 buttons correspond to Port 1
of the instrument, and the S22 buttons correspond to Port 2 of the instrument. The Reflection
calibration for each port requires three standards, an open circuit, a short circuit, and a broadband load
circuit. Before clicking the calibration standard buttons, ensure that there is a secure connection
between the calibration standard and the test port cable with the torque wrench. It is important to
NEVER rotate the calibration standard onto the test port cable or to any connection. Only rotate the
threaded portion of the male ends onto the female ends without rotating either side. Calibration kits
are fragile and expensive. They should never be used as adapters or loads in any test set, and always
keep the plastic covers onto the calibration pieces, to prevent dirt, skin, grease, etc. from degrading
the accuracy of future calibrations. Also, calibration standards must never be dropped.
Click the appropriate button after securing a connection for each standard on the appropriate port, and
then click OK when finished. Wait until the instrument has finished calculating to click OK in the
confirmation window.
This shows a Full 2-Port calibration that has completed the Reflection parameters, and also has omitted
the isolation.
4. Click “Transmission”.
For the transmission parameters, simply secure a “THRU” connection between the test port cables. This
means connect the test port cables together directly if they are opposite sex (optimum), or use a SMA
adapter to connect them together. Then click each parameter one by one, pausing so that the
instrument may completely finish measuring the parameter before moving on to the next
measurement. Upon completion, click OK and complete the transmission parameters.
Click “Finalize” to complete the Full 2-Port calibration. Allow the instrument to finish its calculations
before clicking the OK button.
Extracting S-Parameters and Generating Plots
1. After completion of the calibration process, to acquire the plots as seen on the VNA, click the
Acquire Menu button from the main menu. This simple menu allows you to select any
parameter, i.e. S11, S21, S12, S22, and view the data in any format, i.e. Log Mag, Phase, Delay,
Smith Chart, Polar, Lin Mag, Real, or SWR. Once the desired parameter and format is selected,
click the gather button, and after the data has been gathered, click Generate Graph to generate
the desired plot.
2. Below is an example of a graph acquired with this software. This is a Log Mag plot of the S11
parameter of a high pass filter. The parameter is displayed in the top left corner of the window,
and the title displays the format of the data. The start and stop frequencies are displayed along
the bottom axis, and the grid spacing is displayed to the right of the title.
3. There are five optional markers available for each plot, which can be enabled by the check box.
This allows the user to slide the marker along the trace of the data to see the specific values of
the plot.
4. An export file feature has been added for further analysis of the acquired data. Click Done from
the Acquire Data menu to return to the VNA Manager main menu. Click the File drop down
menu and select export. Save the file as a “.s1p” file for a 1-port calibration dataset, and a
“.s2p” file for a 2-port calibration dataset. This file format is compatible with Advanced Design
Systems (ADS), and can be further analyzed.
Other Functions
1. As a simple test of the connection between the Data Acquisition System and the software, the
GetID button on the VNA Manager main menu can be used to acquire the ID of the VNA.
2. To perform functions and operations not programmed into this software, the user can reference
the HP-IB Quick Reference and send custom commands to the VNA. This utilizes the command
entry line and the Send / Receive buttons in the VNA Manager main menu. The HP-IB Quick
Reference manual is located within the program directory.
Troubleshooting
Thanks to our experienced programmer Antony, this software is pretty robust and has been coded to
protect itself from user errors such as invalid parameter inputs. If the program manages to crash, press
the LOCAL hardkey on the instrument, followed by the PRES hardkey, to reset the instrument. Then,
close and restart the program. If the instrument locks up but the software remains active, click the
preset button on the VNA Manager main menu. If an error message appears on the screen of the
instrument, press the Clear Error button on the VNA Manager main menu to clear it.
Overview – High Temperature Test System
The purpose of this part of the manual is to acquaint new users with the high temperature testing
system, specifically, the use of the CN7500 Controller and the probe station. This manual assumes the
user is familiar with the probe station and wafer-based testing. Refer to the other lab manual on how to
use the various measurement devices interfaced to the probe station
In addition, the assembly methodology is included to assist in maintenance.
Heater Assembly
Because the choice was made to forgo a controller with an independent power supply, the heater must
be supplied with its own power. This power will be supplied by 120VAC outlet. In addition, The RTD is
mounted on the underside of the heater, to maximize the area on the surface for test devices. The
figure below illustrates the heater assembly showing the power connections and RTD mount.
RTD
120 VAC
Platform Assembly
The figure below illustrates the stage fully assembled platform. The hot plate is the equivalent to the
stage in the Micromanipulator Model 6000 and includes a vacuum tube to hold the device under test in
place. The heater is in direct contact with the hot plate underneath it where it is connected to the
controller and the 120VAC power supply. It is significant to note that the hotplate/disc heater stage is
mounted directly underneath the microscope, and not on its original platform. Since the heater’s
original platform did not fall squarely underneath the microscope, this was required to ensure that it did
so.
Controller Connections & Enclosure
The figure below illustrates the manufacturer’s wiring schematic for the CN7500 controller. Terminals 1
and 2 power the device, with terminal 1 connected to the live wire. Terminals 3, 4 and 5 take the RTD
input. The orange wire on the RTD corresponds to the resistor connected to terminal 3. The two other
leads are then connected to terminals 4 and 6. Terminals 11 and 12 lead to the RS232 to RS485
converter’s terminal block. Terminals 9 and 10 connect to 120VAC and the heater. Because the CN7500
functions as a simple switching controller, Terminals 9 and 10 connect to 120VAC and the heater. It is
important to note that the live lead that powers the heater should be connected to the controller at
either of these terminals, while the neutral lead is routed to the heater, than back to the other terminal.
For example, if the live lead is connected to terminal 10, the neutral should be routed through the
heater, then back to terminal 9.
The figure below illustrates controller in its enclosure. A more complete view is shown under BNC
Extensions. All the connections described above are used, and as we can see, terminals 7 and 8 are
unused.
Output
to heater
120 VAC
RTD Input
RS485
Output
BNC Extensions
Since the existing BNC connections for the probes cannot extend out of the testing box, the BNC cables
were extended. While extra BNC cables were already available in the lab, Male-male BNC adapters were
needed and purchased to connect them. Figure 23 illustrates the extended BNC connections along with
the controller enclosure.
Procedure
The following section outlines the basic operation of the High Temperature Test system
1. Power the CN7533 Controller by plugging the grey power cable in.
2. Open the CN-7 Program noted by this icon:
3. Go to the monitoring screen by selecting this icon:
4. Connect to address 1 (or your custom address) on any of the four I/O boxes.
5. You will now be presented with the following screen:
6. From here, you can monitor the heater’s current temperature and power the disc heater to the
desired temperature. Make sure the input type is set to Pt100 (100Ω Platinum RTD), and
Heat/Cool is set to Heat.
7. The red number represents the present value (PV) and the green number represents the SV (set
value). Change the set value as desired. Do not set it higher than 260° C, as this will melt the
adhesive used to attach the RTD to the heater.
8. Upon selecting Run in the Run/Stop menu, the controller will switch to allow power to flow to
the heater. Set auto tuning to start.
9. To view the time/temperature graph, select View/PV Record from the top menu. You will be
presented with the following screen:
10. Here, you can monitor the temperature of the heater. Each dashed line represents one minute.
The heater will tend to overshoot the set value, especially when set to lower temperatures, but
this stabilizes relatively quickly. The example above shows that it took about 8 minutes from the
peak value to settle down to the set value.
Troubleshooting
Should any problem arise, first ensure that all the connections to the controller are secure. If the
controller is not detected, the communication protocol may need to be reset. By selecting this icon, you
may configure the settings manually, or opt to auto-detect.