1
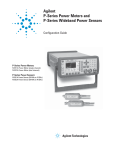
Operating and Service Guide
P-Series Wideband Power Sensor
N1921A and N1922A
Manufacturing Part Number: N1920-90007
Printed in Malaysia
Fifth Edition, October 10, 2012
© Copyright Agilent Technologies Inc, 2005–2012
Notices
No part of this manual may be reproduced in any form or by any means (including
electronic storage and retrieval or translation into a foreign language) without prior
agreement and written consent from Agilent Technologies, Inc. as governed by
United States and international copyright laws.
Agilent Technologies, Inc.
Bayan Lepas Free Industrial Zone
11900 Penang, Malaysia
ii
General Warranty
The material contained in this document is provided “as is,” and is subject to being
changed, without notice, in future editions. Further, to the maximum extent
permitted by applicable law, Agilent disclaims all warranties, either express or
implied with regard to this manual and any information contained herein, including
but not limited to the implied warranties of merchantability and fitness for a
particular purpose. Agilent shall not be liable for errors or for incidental or
consequential damages in connection with the furnishing, use, or performance of
this document or any information contained herein. Should Agilent and the user
have a separate written agreement with warranty terms covering the material in this
document that conflict with these terms, the warranty terms in the separate
agreement will control.
Certification
Agilent Technologies certifies that this product met its published specifications at
the time of shipment from the factory. Agilent Technologies further certifies that its
calibration measurements are traceable to the United States National Institute of
Standards and Technology, to the extent allowed by the Institute’s calibration
facility, and to the calibration facilities of other International Standards Organization
members.
Safety Symbols
The following symbols on the instrument and in the documentation indicate
precautions which must be taken to maintain safe operation of the instrument.
iii
The Instruction Documentation Symbol. The product is marked with
this symbol when it is necessary for the user to refer to the
instructions in the supplied documentation.
ESD
ISM GRP.1
CLASS A
This symbol indicates that a device, or part of a device, may be
susceptible to electrostatic discharges (ESD) which can result in
damage to the product. Observe ESD precautions given on the
product, or its user documentation, when handling equipment
bearing this mark.
This is the symbol of an Industrial Scientific and Medical Group 1
Class A product.
The CE mark shows that the product complies with all relevant
European Legal Directives.
ICES/NMB-001
This ISM device complies with Canadian ICES-001.
Cet appareil ISM est conforme à la norme NMB-001 du Canada.
N10149
The C-Tick mark is a registered trademark of the Australian
Communications Authority. This signifies compliance with the
Australian EMC Framework Regulations under the terms of the
Radio Communications Act of 1992.
Safety Notices
This guide uses warnings and cautions to denote hazards
WARNING
A warning calls attention to a procedure, practice or the like, which, if not
correctly performed or adhered to, could result in injury or loss of life. Do not
proceed beyond a warning until the indicated conditions are fully understood
and met.
iv
CAUTION
A caution calls attention to a procedure, practice or the like which, if not correctly
performed or adhered to, could result in damage to or the destruction of part or all of
the equipment. Do not proceed beyond a caution until the indicated conditions are
fully understood and met.
General Safety Information
The following general safety precautions must be observed during all phases of
operation, service, and repair of this instrument. Failure to comply with these
precautions or with specific warnings elsewhere in this manual violates safety
standards of design, manufacture, and intended use of the instrument. Agilent
Technologies assumes no liability for the customer’s failure to comply with these
requirements.
WARNING
BEFORE CONNECTING THE POWER SENSOR TO OTHER
INSTRUMENTS ensure that all instruments are connected to the protective
(earth) ground. Any interruption of the protective earth grounding will cause a
potential shock hazard that could result in personal injury.
Sound Emission
Herstellerbescheinigung
Diese Information steht im Zusammenhang mit den Anforderungen der
Maschinenlarminformationsverordnung vom 18 Januar 1991.
•
Sound Pressure LpA < 70 dB.
•
Am Arbeitsplatz.
•
Normaler Betrieb.
v
•
Nach DIN 45635 T. 19 (Typprufung).
Manufacturers Declaration
This statement is provided to comply with the requirements of the German Sound
DIN 45635 T. 19 (Typprufung).
•
Sound Pressure LpA < 70 dB.
•
At operator position.
•
Normal operation.
•
According to ISO 7779 (Type Test).
vi
Contents
1 Introduction
What You’ll Find In This Chapter . . . . . . . . . . . . . . . . . . . . . . . . . . . . . . . . . . . . . . . . . . . . . . . . . . . .
General Information. . . . . . . . . . . . . . . . . . . . . . . . . . . . . . . . . . . . . . . . . . . . . . . . . . . . . . . . . . . . . . .
Initial Inspection . . . . . . . . . . . . . . . . . . . . . . . . . . . . . . . . . . . . . . . . . . . . . . . . . . . . . . . . . . . . . . .
Power Meter and Sensor Cable Requirements. . . . . . . . . . . . . . . . . . . . . . . . . . . . . . . . . . . . . . . . .
Interconnections . . . . . . . . . . . . . . . . . . . . . . . . . . . . . . . . . . . . . . . . . . . . . . . . . . . . . . . . . . . . . . . .
Recommended Calibration Interval . . . . . . . . . . . . . . . . . . . . . . . . . . . . . . . . . . . . . . . . . . . . . . . . .
Calibration . . . . . . . . . . . . . . . . . . . . . . . . . . . . . . . . . . . . . . . . . . . . . . . . . . . . . . . . . . . . . . . . . . . . . .
Overview of the P-Series Wideband Power Sensors . . . . . . . . . . . . . . . . . . . . . . . . . . . . . . . . . . . . . .
The Internal Zero and Calibration . . . . . . . . . . . . . . . . . . . . . . . . . . . . . . . . . . . . . . . . . . . . . . . . . .
2
3
3
4
4
4
6
7
7
2 Performance Tests and Adjustments
Test Equipment . . . . . . . . . . . . . . . . . . . . . . . . . . . . . . . . . . . . . . . . . . . . . . . . . . . . . . . . . . . . . . . . .
Voltage Standing Wave Ratio (VSWR) Performance Test . . . . . . . . . . . . . . . . . . . . . . . . . . . . . . . .
Sensor Accuracy Performance Test . . . . . . . . . . . . . . . . . . . . . . . . . . . . . . . . . . . . . . . . . . . . . . . . . .
System-Level Rise and Fall Time Performance Test. . . . . . . . . . . . . . . . . . . . . . . . . . . . . . . . . . . . .
Zero Set Performance Test in System Level . . . . . . . . . . . . . . . . . . . . . . . . . . . . . . . . . . . . . . . . . . .
Adjustment. . . . . . . . . . . . . . . . . . . . . . . . . . . . . . . . . . . . . . . . . . . . . . . . . . . . . . . . . . . . . . . . . . . . .
12
13
14
19
22
24
3 Theory of Operation
Theory of Operation . . . . . . . . . . . . . . . . . . . . . . . . . . . . . . . . . . . . . . . . . . . . . . . . . . . . . . . . . . . . . 26
4 Specifications and Characteristics
Introduction . . . . . . . . . . . . . . . . . . . . . . . . . . . . . . . . . . . . . . . . . . . . . . . . . . . . . . . . . . . . . . . . . . . .
Specification Definitions . . . . . . . . . . . . . . . . . . . . . . . . . . . . . . . . . . . . . . . . . . . . . . . . . . . . . . . .
Specifications. . . . . . . . . . . . . . . . . . . . . . . . . . . . . . . . . . . . . . . . . . . . . . . . . . . . . . . . . . . . . . . . . . .
Frequency and Dynamic Power Range . . . . . . . . . . . . . . . . . . . . . . . . . . . . . . . . . . . . . . . . . . . . .
Damage Level and RF Connector Type . . . . . . . . . . . . . . . . . . . . . . . . . . . . . . . . . . . . . . . . . . . . .
Power Sensor Maximum SWR . . . . . . . . . . . . . . . . . . . . . . . . . . . . . . . . . . . . . . . . . . . . . . . . . . .
Power Sensor Calibration Uncertainty. . . . . . . . . . . . . . . . . . . . . . . . . . . . . . . . . . . . . . . . . . . . . .
Physical Characteristics . . . . . . . . . . . . . . . . . . . . . . . . . . . . . . . . . . . . . . . . . . . . . . . . . . . . . . . . .
Declaration of Conformity. . . . . . . . . . . . . . . . . . . . . . . . . . . . . . . . . . . . . . . . . . . . . . . . . . . . . . . . .
30
30
32
32
32
33
34
35
36
5 Service
What You’ll Find In This Chapter . . . . . . . . . . . . . . . . . . . . . . . . . . . . . . . . . . . . . . . . . . . . . . . . . . .
General Information. . . . . . . . . . . . . . . . . . . . . . . . . . . . . . . . . . . . . . . . . . . . . . . . . . . . . . . . . . . . . .
Cleaning . . . . . . . . . . . . . . . . . . . . . . . . . . . . . . . . . . . . . . . . . . . . . . . . . . . . . . . . . . . . . . . . . . . . .
Connector Cleaning . . . . . . . . . . . . . . . . . . . . . . . . . . . . . . . . . . . . . . . . . . . . . . . . . . . . . . . . . . . .
38
39
39
39
vii
Contents
Performance Test . . . . . . . . . . . . . . . . . . . . . . . . . . . . . . . . . . . . . . . . . . . . . . . . . . . . . . . . . . . . . . 39
Agilent Sales and Service Offices . . . . . . . . . . . . . . . . . . . . . . . . . . . . . . . . . . . . . . . . . . . . . . . . . . . 40
viii
1
Introduction
1
What You’ll Find In This Chapter
This Chapter introduces you to the P-Series Wideband Power Sensors. It contains
the following sections:
•
“General Information” on page 3.
•
“Initial Inspection” on page 3.
•
“Power Meter and Sensor Cable Requirements” on page 4.
•
“Interconnections” on page 4.
•
“Calibration” on page 6.
•
“Overview of the P-Series Wideband Power Sensors” on page 7.
2
General Information
Welcome to the P-Series Wideband Power Sensors Operating and Service Guide.
This guide contains information about the initial inspection, connection, and
specifications of the P-Series Wideband Power Sensors. You can also find a copy of
this guide on the Documentation CD-ROM supplied with the P-series power meters.
Figure 1-1
P-Series Wideband Power Sensors
To make best use of your sensor refer to the chapter “Using P-Series Power
Sensors” in the P-Series Power Meter User’s Guide.
Initial Inspection
Inspect the shipping container for damage. If the shipping container or packaging
material is damaged, it should be kept until the contents of the shipment have been
checked mechanically and electrically. If there is mechanical damage, notify the
nearest Agilent office. Keep the damaged shipping materials (if any) for inspection
by the carrier and an Agilent representative. See “Agilent Sales and Service Offices”
on page 40.
3
Power Meter and Sensor Cable Requirements
The P-Series Wideband Power Sensors are ONLY compatible with the P-Series
Power Meters.
Table 1-1 lists the length of cable option, these have no interconnecting cable
requirements, as the cable is permanently connected (hard-wired) to the P-Series
Wideband power sensor.
Table 1-1
Cable Length Options
Option
Description
N1921A-105
N1922A-105
1.5m (5-ft) cable length
N1921A-106
N1922A-106
3m (10-ft) cable length
N1921A-107
N1922A-107
10m (31-ft) cable length
Interconnections
Connect the cable to the P-Series power meter’s channel input. Figure 1-2 shows
that you must align the red dot on the sensor’s cable and the meter’s connector.
WARNING
BEFORE CONNECTING THE POWER SENSOR TO OTHER
INSTRUMENTS ensure that all instruments are connected to the protective
(earth) ground. Any interruption of the protective earth grounding will cause a
potential shock hazard that could result in personal injury.
Recommended Calibration Interval
Agilent Technologies recommends a one-year calibration cycle for the P-Series
power sensors.
4
Figure 1-2
Connecting a Sensor Cable to a Power Meter
Ensure you line up the red dots on the
sensor cable and power meter’s connector
Allow a few seconds for the power meter to read the data contained in the power
sensor’s EEPROM.
NOTE
Ensure power sensor cables are attached and removed in an indoor environment.
Torque
Table 1-2 shows the connector type (for connection to DUT) for the power sensor
models. A torque wrench must be used to tighten these connectors. Only use a
wrench set to the correct torque value.
Table 1-2
Wrench Size and Torque Values
Model
Connector
Wrench Size
Torque Value
N1921A
Type-N (male)
3/4-inch open-end
12 in-lb (135 Ncm)
N1922A
2.4 mm (male)
5/16-inch open-end
8 in-lb (90 Ncm)
5
Calibration
When calibrating a P-Series Wideband Power Sensor, there is no need to disconnect
it from the power source.
The power meter performs Internal Zero and Calibration routines. The process used
for this Internal Zero and Calibration is explained in “Overview of the P-Series
Wideband Power Sensors” on page 7.
The chapter “Using P-Series Power Sensors” in the P-Series Power Meter User’s
Guide explains in more detail the methods used the perform the zero and calibration
of the power sensor.
6
Overview of the P-Series Wideband Power Sensors
The P-Series Wideband Power Sensors has two different models.
•
The N1921A has a frequency range of 50 MHz to 18 GHz.
•
The N1922A has a frequency range of 50 MHz to 40 GHz.
The Internal Zero and Calibration
The P-Series Wideband Power Sensor’s Internal Zero and Calibration process is
used to combine the power sensor and power meter to make accurate power
measurements.
Referring to Figure1-3, Simplified Sensor Block Diagram, the process for the
Internal Zero and Calibration explains how three objectives in this process are
achieved.
Figure 1-3
Simplified Sensor Block Diagram
1. To account for the environment that the system is working in - the temperature
and the presence of electromagnetic signals.
This is achieved during the Internal Zero process, where the Diode Detectors are
isolated from the active amplifier circuitry. The process allows the zero
measurement to be made, regardless of the RF input signal, thus allowing the
sensor to remain connected to the DUT. The isolation is achieved by a network
of transistor switches in the zero and calibration path switching.
2. To account for the combining of the sensor and meter, as these may never have
been used together as a system.
7
This is achieved during the Internal Calibration, the Amplifier Circuitry is
isolated from the Diode Detectors by a network of transistor switches and the
sensor’s voltage reference is routed to the Amplifier Circuitry.
3. To verify traceability to National Standards, hence, verifying your
measurements are going to perform to specification.
To achieve traceable and accurate RF power measurements, each sensor is
individually characterized during its production procedure. To achieve optimal
accuracy, a 3-dimensional correction is generated across power, frequency and
temperature. This uses advanced modeling techniques, and is superior in
accuracy and speed of evaluation to the overlaying of linearity, temperature
corrections and calibration factors.
As a confidence check of the connector integrity, the P-Series Wideband Power
Sensor can be connected to any known good signal source (for example, the
50 MHz, 0 dBm reference) and a comparison made.
The calibration factors are stored in the EEPROM during the manufacturing
process. All the compensation data is downloaded to the P-series power meter at
power-on or when the power sensor is connected.
NOTE
Between 50 MHz and 500 MHz, the sensor is sensitive to the RF signal propagating
through onto the Detector Amplifier Circuitry and resulting in distorted power
measurements. To reduce this effect, additional filtering is switched into the
measurement path, which results in a 15 MHz video bandwidth limitation for
signals below 500 MHz.
The P-Series Wideband Power Sensor performs internal zero and calibration
automatically upon AC power up. However, to perform a manual confidence check
with an external reference power source (1 mW, 50 Mhz), a 2.4 mm (f) to
N-type (m) adapter is needed as the P-Series Wideband Power Sensor is fitted with
a 2.4 mm (m) connector. This adapter is not shipped together with the P-Series
Wideband Power Sensor.
8
Table 1-3
NOTE
Adapter
Part number
Description
08487-60001
Adapter 50 MHz, 2.4 mm
Item
The 2.4 mm (f) to N-type (m) adapter is intended for use only on the 1 mW,
50 MHz power reference of the power meter. Its function as a calibration reference
may be compromised if used for other purposes.
9
10
2
Performance Tests and Adjustments
11
Test Equipment
The following equipment are required for the performance tests:
Instrument
Critical specification
Signal generator
(Rise/fall time)
Power range: –50 dBm to +22 dBm at 1 GHz N5182A/E8257D/E8267D
Output resistance = 50 Ω
Signal Generator
(Zero set)
Power range: –50 dBm to +20 dBm at 1 GHz E4438C/E8257D/E8267D
Output resistance = 50 Ω
Oscilloscope
Analog Bandwidth: 1 GHz and above
Infiniium MSO 9104A
Network analyzer
Frequency Range: 10 MHz to 40 GHz or
above 94 dB of dynamic range
<0.006 dB trace noise
E8361A/E8361C/E8363B/
E8363C
Calibration kit
Frequency Range: DC to 18 GHz or above
85054A/85054D/85056A/
85056D
Diode detector
(Negative)
SMB connector
33334EZ
Power splitter
Two- Resistor type Power Splitter, N-type (f) 11667A
Max Frequency: 18 GHz
Power meter
Dual Channel Peak Power Meter
Compatible with P Series and N8480 Series
Power Sensor
Absolute Accuracy: ±0.8%
N1912A
Power sensor
Frequency: 50 MHz or above
Power range: –30 dBm to +20 dBm
SWR: ≤1.15 at 50 MHz
N8481A/N8487A
Wideband power sensor
Power range: –30 dBm to +20 dBm
SWR: ≤1.20 at 1 GHz
N1921A/N1922A
Cable adapter
11730A sensor cable adapter
N1911A-200
12
Recommended Agilent model
number/part number
Instrument
Critical specification
Recommended Agilent model
number/part number
N-type to SMA adapter
N-type (m) to 2.4 mm (f) SMA
50 Ω characteristic impedance
11903D
Trigger cable
50 Ω characteristic impedance
BNC (m) to SMB (f)
U2032A
Voltage Standing Wave Ratio (VSWR) Performance Test
VSWR (Voltage Standing Wave Ratio) is a measure of how efficiently RF power is
transmitted from an RF power source. In real systems, mismatched impedances
between the RF source and load can cause some of the power to be reflected back
towards the source and vary the VSWR.
Test equipment
•
•
Network analyzer (E8361A/3B/4B)
Agilent calibration kit (85054A/D or 85056A/D)
Test procedure
1 Turn on the network analyzer and allow it to warm up for approximately an hour.
2 Set the start frequency of the network analyzer to 50 MHz and the stop frequency
to 18 GHz (for the N1921A) and 40 GHz (for the N1922A).
3 Calibrate the network analyzer using the appropriate calibration kit (85054A/D
for the N1921A and 85056A/D for the N1922A). Perform calibration for the
open, short, and load circuits of the network analyzer.
4 After calibration, connect the N1923/4A to the test port of the network analyzer.
Turn on Correction on the network analyzer to perform the VSWR
measurement.
5 Compare the measured results to the specifications in Table 2-1.
6 If the test fails, refer to “Adjustment” on page 24.
13
Table 2-1
Voltage Standing Wave Ratio (VSWR) Performance Test
Sensor model
Frequency band
Maximum SWR
N1921A
50 MHz to 10 GHz
1.2
10 GHz to 18 GHz
1.26
50 MHz to 10 GHz
1.2
10 GHz to 18 GHz
1.26
18 GHz to 26.5 GHz
1.3
26.5 GHz to 40 GHz
1.3
N1922A
Sensor Accuracy Performance Test
The purpose of this test is to verify the accuracy of the N1921/2A after a period of
usage to ensure that the N1921/2A is still within its published specifications.
Test equipment
•
•
•
•
•
•
Signal generator (N5182A)
Power meter (N1912A)
Wideband power sensor (N1921/2A)
Power sensors (N8481A/N8487A)
Cable adapter (N1911A-200)
Power splitter (11667A)
Test procedure
1 Turn on the N5182A and N1912A. Allow them to warm up for approximately
an hour.
2 Connect the standard sensor (N8481A/7A) to the N1912A channel A and the
incident sensor (N1921/2A) to the N1912A channel B.
3 The test equipment setup is as shown in Figure 2-1.
14
Figure 2-1
Sensor accuracy performance test setup
Signal source
Power meter
Power splitter
A
B
Incident sensor
Standard sensor
4 Zero and calibrate the standard and incident sensors on channels A and B
respectively.
5 Set the frequency of the signal source to 50 MHz and power level to 0 dBm. Turn
on the RF output.
6 Set the frequency of the N1912A channels A and B to the same frequency as the
signal source.
7 Measure the standard power (PSTD) of channel A and incident power (PINC1) of
channel B. Compute and record the power ratio (Pratio) of these channels for the
current frequency and power level, based on the following equation:
Pratio(dB) = PSTD – PINC1
8 Repeat steps 5 to 7 for other frequencies with the same power level.
9 Turn off the RF output of the signal source.
10 Remove the standard sensor from the N1912A channel A.
11 Connect the device-under-test (DUT, N1921/2A) to the N1912A channel A.
12 The test equipment setup is as shown in Figure 2-2.
15
Figure 2-2
Sensor accuracy performance test setup
Signal source
Power meter
Power splitter
A
B
Incident sensor
DUT
13 Zero and calibrate the DUT on the N1912A channel A.
14 Repeat steps 5 and 6.
15 Measure and record the power readings of channels A and B for the current
frequency and power level, as PDUT (for channel A) and PINC2 (for channel B).
16 Repeat steps 14 and 15 for other frequencies with the same power level.
17 Turn off the RF output of the signal source.
18 Compute the accuracy error of the DUT for each frequency being measured at
the same power level, using the following equations:
Accuracy error (dB) = PDUT – (PINC2 + (PSTD – PINC1))
P DUT – ( P INC2 + ( P STD – P INC1 ) )
Accuracy error (%) = Anti log ---------------------------------------------------------------- – 1 × 100
10
19 Compare the computed accuracy errors to the calibration uncertainty values in
Table 2-2 and record the accuracy error in Table 2-3. If the test fails, refer to
“Adjustment” on page 24.
20 Repeat steps 5 to 19 by sweeping through the power level from –25 dBm to
10 dBm with a frequency of 50 MHz.
16
Table 2-2
Power Sensor Calibration Uncertainty
Sensor model
Frequency band
Calibration uncertaintya
N1921A
50 MHz to 500 MHz
4.5%
500 MHz to 1 GHz
4.0%
1 GHz to 10 GHz
4.0%
10 GHz to 18 GHz
5.0%
50 MHz to 500 MHz
4.3%
500 MHz to 1 GHz
4.2%
1 GHz to 10 GHz
4.4%
10 GHz to 18 GHz
4.7%
18 GHz to 26.5 GHz
5.9%
26.5 GHz to 40 GHz
6.0%
N1922A
a. In humidity >70%, additional 0.6% should be added into the uncertainty.
Table 2-3
Recommended Frequency Points
Frequency points for N1921A
Frequency points for N1922A
50 MHz
50 MHz
200 MHz
300 MHz
300 MHz
500 MHz
499 MHz
1 GHz
500 MHz
7 GHz
800 MHz
12 GHz
1.5 GHz
14 GHz
Calculated sensor accuracy
error at 0 dBma
17
Table 2-3
Recommended Frequency Points
Frequency points for N1921A
Frequency points for N1922A
3 GHz
16 GHz
6 GHz
17 GHz
7 GHz
18 GHz
9 GHz
19.5 GHz
10 GHz
22 GHz
12 GHz
23 GHz
12.4 GHz
24 GHz
13 GHz
26 GHz
14 GHz
26.5 GHz
15 GHz
28 GHz
16 GHz
30 GHz
17 GHz
32 GHz
18 GHz
33 GHz
Calculated sensor accuracy
error at 0 dBma
34 GHz
35 GHz
36 GHz
37 GHz
38 GHz
39 GHz
40 GHz
a. The accuracy error measured in this test includes the combination of errors for linearity,
calibration factor, and temperature compensation.
18
System-Level Rise and Fall Time Performance Test
The rise and fall time performance of the instrument path must be quantified
accurately. This test however, is more of a system-level verification, validating the
rise and fall time with the N1911/2A using an actual RF pulse.
Test equipment
•
•
•
•
•
•
Signal generator (N5182A)
Power meter (N1911/2A)
Diode detector
Oscilloscope with bandwidth >1 GHz
Trigger cable (U2032A)
Wideband power sensor (N1921/2A)
System specification
•
•
Figure 2-3
Rise/fall time: ≤13 ns ±% error
Overshoot: ≤5%
Measured rise time percentage error versus signal under test rise time
Test procedure
1 Turn on the N5182A, oscilloscope, and N1911/2A.
2 Allow the system to warm up for approximately an hour before starting the
measurement.
19
3 Generate an RF pulse signal (with the following recommended signal profile)
from the N5182A.
•
•
•
•
Frequency: 50 MHz
Power level: 10 dBm
Pulse period: 10 μs
Duty cycle: 50%
The pulse signal is characterized using a diode detector which feeds to the
oscilloscope. This is to verify that the rise/fall time of the RF pulse measured by
the oscilloscope is <10 ns and its overshoot is <0.5%.
4 Connect the N1921/2A to the N5182A and N1911/2A as shown in Figure 2-4.
Figure 2-4
System-level rise and fall time performance test setup
Power meter
N5182A
DUT
5 Generate the same pulse signal as previous.
6 Zero the DUT on the N1911/2A.
7 Set the channel frequency of the N1911/2A to 1 GHz and the trigger mode to
Continuous Trigger Mode.
8 Set the N1911/2A video bandwidth to LOW and the video average to 64.
9 Set the N1911/2A display to Trace Display mode from Numerical mode.
Disp > Disp Type > Trace
10 Expand the N1911/2A display window and select Trace Control to view the
rise/fall time readings.
11 Turn on the N5182A RF output.
12 Select Auto Scale to capture the N1911/2A pulse signal.
20
13 Measure and record the rise/fall time of the pulse signal from the N1911/2A in
Table 2-3.
14 Repeat the above steps for the pulse signal with different pulse periods and
different video bandwidth settings. Record all the readings in Table 2-3.
15 Compare the recorded readings to the specifications in the table. If the test fails,
refer to “Adjustment” on page 24.
Table 2-4
System-level rise and fall time performance test
Measured points
Specification
Bandwidth: LOW, Power level: 10 dBm,
Pulse period: 2 μs, Duty cycle: 50%
56 ns
Bandwidth: LOW, Power level: 10 dBm,
Pulse period: 10 μs, Duty cycle: 50%
56 ns
Bandwidth: MED, Power level: 10 dBm,
Pulse period: 2 μs, Duty cycle: 50%
25 ns
Bandwidth: MED, Power level: 10 dBm,
Pulse period: 10 μs, Duty cycle: 50%
25 ns
Bandwidth: HIGH, Power level: 10 dBm,
Pulse period: 2 μs, Duty cycle: 50%
13 ns
Bandwidth: HIGH, Power level: 10 dBm,
Pulse period: 10 μs, Duty cycle: 50%
13 ns
Bandwidth: OFF, Power level: 10 dBm,
Pulse period: 2 μs, Duty cycle: 50%
13 ns
Bandwidth: OFF, Power level: 10 dBm,
Pulse period: 10 μs, Duty cycle: 50%
13 ns
Measure rise
time/s
Pass/Fail
21
Zero Set Performance Test in System Level
Zero set is defined as the amount of residual offset error that is present following a
zeroing operation. This offset error is caused by contamination from several sources,
including circuit noise. This test is a system-level verification which requires
N1911/2A.
Test equipment
•
•
•
•
•
•
Signal generator (E4438C)
Power meter (N1911/2A)
Agilent USB/GPIB interface (82357B)
GPIB cable
Wideband power sensor (N1921/2A)
PC
System specification
•
•
No RF presence: <200 nW
RF presence: <200 nW (frequency > 500 MHz), <550 nW (frequency
<500 MHz)
Test procedure
1 Connect the N1921/2A to the N1911/2A.
2 Turn on N1911/2A and E4438C.
3 Set the GPIB address of the power meter (N1911/2A) and the signal generator
(E4438C) to 13 and 19 respectively.
4 Connect the N1921/2A to the signal generator as shown in Figure 2-5. Allow the
system to warm up for approximately an hour.
Figure 2-5
Zero set performance test in system level setup
Power meter
E4438C
DUT
22
5 Download the Wideband Power Sensor Zero Set Verification Utility from the
link below.
http://www.home.agilent.com/agilent/redirector.jspx?action=ref&cname=AGIL
ENT_EDITORIAL&ckey=1956605&lc=eng&cc=MY&nfr=-536902922.53689
4476
6 Go through the readme file.
7 Establish a GPIB connection between the signal generator, power meter, and the
PC by using the USB/GPIB interface and a GPIB cable.
8 Download and install Agilent VEE Pro Runtime 9.0 or above.
9 The power meter (N1911/2A) and the signal generator (E4438C) must be added
to the Instrument Manager.
Go to Start > Program > Agilent VEE Pro 9.0 or above Runtime Config > IO
Configuration. Select Find to find the connected instrument and Save to save the
configuration.
10 Run the Wideband Power Sensor Zero Set Verification Utility.
23
Adjustment
Adjustments are usually required on a yearly basis. They are normally performed
only after a performance test has indicated that some parameters are out of
specification. Performance tests must be completed after any repairs that may have
altered the characteristics of the N1921/2A.
The N1921/2A is required to be returned to Agilent for adjustments. To arrange this,
contact the Agilent Service Center. Refer to the last page of this guide for
information.
24
3
Theory of Operation
25
Theory of Operation
The N1921/2A is integrated with the internal zeroing and calibration capability,
which eliminates the need for sensor calibration using an external reference source.
Agilent's patented technology integrates a DC reference source and switching
circuits into each N1921/2A, so you can zero and calibrate the N1921/2A while it is
connected to a device-under-test. This feature removes the need for connection and
disconnection from the calibration source, thereby reducing test times, measurement
uncertainty, and wear and tear on connectors. It is especially useful in
manufacturing and automated test environments where every second and every
connection counts. The N1921/2A can be embedded within test fixtures without the
need to switch in reference signals.
Figure 3-1
Simplified Sensor Block Diagram
To ensure the accuracy of power measurements and improve measurement speed,
the N1921/2A uses a four- dimensional (4-D) modeling technique that measures
input power, frequency, temperature, and output voltage across the N1921/2A
specified measurement ranges. Data from this 4-D model is generated during
Agilent's initial factory calibration of the N1921/2A and stored in EEPROM.
All the compensation data is downloaded to the power meter/peak power analyzer at
power- on or when the N1921/2A is connected. Advanced algorithms are used to
quickly and accurately evaluate the N1921/2A against this model, without requiring
the power meter/peak power analyzer to interpolate the calibration factors and
linearity curves. If you run tests in which the frequency changes often, such as
testing multi-carrier amplifiers on different bands, you will notice a marked
improvement in measurement speed.
26
Figure 3-2
Measured rise time percentage error versus signal-under-test rise time
Although the rise time specification is ≤13 ns, this does not mean that the
combination of P-Series power meter and power sensor can accurately measure a
signal with a known rise time of 13 ns. The measured rise time is the root sum of the
squares (RSS) of the signal-under-test rise time and the system rise time (13 ns):
Measured rise time =
2
2
( ( SignalUnderTestRiseTime ) + ( SystemRiseTime ) )
The % error is:
( MeasuredRiseTime – SignalUnderTestRiseTime )
%Error = -----------------------------------------------------------------------------------------------------------( SignalUnderTestRiseTime )
× 100
27
28
4
Specifications and Characteristics
29
Introduction
The P-Series Wideband Power Sensors are designed for use with the P-Series power
meters.
Specification Definitions
There are two types of product specifications:
•
Warranted specifications
•
Characteristic specifications
Warranted specifications
Warranted specifications are covered by the product warranty and apply over 0oC to
55oC, unless otherwise noted. Warranted specifications include Measurement
Uncertainty calculated with 95% confidence.
Characteristic specifications
Characteristic specifications are not warranted. They describe product performance
that is useful in the application of the power sensors by giving typical, but
non-warranted performance parameters. These characteristics are shown in italics or
denoted as “typical”, “nominal” or “approximate”.
Characteristic information is representative of the product. In many cases, it may
also be supplemental to a warranted specification. Characteristic specifications are
not verified on all power sensors. The types of characteristic specifications can be
placed in two groups:
•
The first group of characteristic types describes 'attributes' common to all
products of a given model or option.
Examples of characteristics that describe 'attributes' are product weight, and 50
Ω input Type-N connector. In these examples product weight is an approximate
value and a 50 Ω input is nominal. These two terms are most widely used when
describing a product's 'attributes'.
30
•
The second group of characteristic types describes 'statistically' the aggregate
performance of the population of products.
These characteristics describe the expected behavior of the population of
products. They do not guarantee the performance of any individual product. No
measurement uncertainty value is accounted for in the specification. These
specifications are referred to as typical.
Conditions
The power meter and sensor meet its specifications when:
•
Stored for a minimum of two hours at a stable temperature within the operating
temperature range, and turned on for at least 30 minutes.
•
The power meter and power sensor are within their recommended calibration
periods.
•
Used in accordance to the information provided in the Power Meter’s User's
Guide.
31
Specifications
Frequency and Dynamic Power Range
Table 4-1
Frequency and Dynamic Power Range
Sensor
Model
Frequency Range
Dynamic Power Range
N1921A
50 MHz to 18 GHz
-35 dBm to +20 dBm (>500 MHz)
-30 dBm to +20 dBm (50 MHz - 500 MHz)
N1922A
50 MHz to 40 GHz
-35 dBm to +20 dBm (>500 MHz)
-30 dBm to +20 dBm (50 MHz - 500 MHz)
Damage Level and RF Connector Type
Table 4-2
Damage Level and RF Connector Type
Sensor
Model
Damage Level
(Average Power)
Damage Level
(Peak Power)
RF Connector
Type
N1921A
+23 dBm
+30 dBm, <1μs duration
Type-N (m)
N1922A
+23 dBm
+30 dBm, <1μs duration
2.4 mm (m)
32
Power Sensor Maximum SWR
Table 4-3
Power Sensor Maximum SWR
Sensor
Model
Frequency Band
Maximum SWR
N1921A
50.0 MHz to 10.0 GHz:
1.2
10.0 GHz to 18.0 GHz:
1.26
50.0 MHz to 10.0 GHz:
1.2
10.0 GHz to 18.0 GHz:
1.26
18.0 GHz to 26.5 GHz:
1.3
26.5 GHz to 40.0 GHz:
1.5
N1922A
33
Power Sensor Calibration Uncertainty
Definition: Uncertainty resulting from non-linearity in the sensor detection and
correction process. This can be considered as a combination of traditional linearity,
calibration factor, temperature specifications and the uncertainty associated with the
internal calibration process.
Table 4-4
Power Sensor Calibration Uncertainty
Sensor
Model
Frequency Band
Calibration
Uncertaintya
N1921A
50.0 MHz to 500.0 MHz
4.5%
500.0 MHz to 1.0 GHz:
4.0%
1.0 GHz to 10.0 GHz
4.0%
10.0 GHz to 18.0 GHz
5.0%
50.0 MHz to 500.0 MHz
4.3%
500.0 MHz to 1.0 GHz:
4.2%
1.0 GHz to 10.0 GHz
4.4%
10.0 GHz to 18.0 GHz
4.7%
18.0 GHz to 26.5 GHz:
5.9%
26.5 GHz to 40.0 GHz:
6.0%
N1922A
a. In humidity greater than 70%, an additional 0.6% should be
added to these values.
34
Physical Characteristics
Table 4-5
Physical Dimensions
Sensor
Model
Dimensions
N1921A
Length: 137 mm (5.4 in)
Width: 42 mm (1.65 in)
Height: 28 mm (1.1 in)
N1922A
Length: 129 mm (5.1 in)
Width: 42 mm (1.65 in)
Height: 28 mm (1.1 in)
Table 4-6
Sensor Cable Lengths and Weights
Option
Length
Weight with cable
Option 105 (standard)
1.5 m (5-feet)
0.4 kg (0.88 lb)
Option 106
3.0 m (10-feet)
0.6 kg (1.32 lb)
Option 107
10 m (31-feet)
1.4 kg (3.01 lb)
35
Declaration of Conformity
The Declaration of Conformity (DoC) for this instrument is available on the Agilent
Web site. You can search the DoC by its product model or description at the Web
address below.
http://regulations.corporate.agilent.com/DoC/search.htm
NOTE
If you are unable to search for the respective DoC, please contact your local Agilent
representative.
36
5
Service
37
What You’ll Find In This Chapter
This Chapter introduces you to the P-Series Wideband Power Sensors. It contains
the following sections:
•
“General Information” on page 39.
•
“Agilent Sales and Service Offices” on page 40.
38
General Information
This chapter contains information about general maintenance, performance tests,
troubleshooting and repair of the P-Series Wideband Power Sensors.
Cleaning
Use a clean, damp cloth to clean the body of the P-Series Wideband Power Sensor.
Connector Cleaning
The RF connector beads deteriorate when contacted by hydrocarbon compounds
such as acetone, trichloroethylene, carbon tetrachloride, and benzene.
Clean the connector only at a static free workstation. Electrostatic discharge to the
center pin of the connector will render the power sensor inoperative.
Keeping in mind its flammable nature; a solution of pure isopropyl or ethyl alcohol
can be used to clean the connector.
Clean the connector face using a cotton swab dipped in isopropyl alcohol. If the
swab is too big use a round wooden toothpick wrapped in a lint free cotton cloth
dipped in isopropyl alcohol.
Performance Test
The Performance and Calibration Tests require the sensor to be returned to the
factory.
To arrange this contact the service centre. See “Agilent Sales and Service Offices”
on page 40 for this information.
Repair of Defective Sensor
There are no serviceable parts inside the P-Series Wideband Power Sensors. If the
sensor is defective, it needs to be returned to an Agilent service center.
39
Agilent Sales and Service Offices
In any correspondence or telephone conversations, refer to the power meter by its
model number and full serial number. With this information, the Agilent
representative can quickly determine whether your unit is still within its warranty
period.
UNITED STATES
Agilent Technologies
(tel) 1 800 829 4444
CANADA
Agilent Technologies Canada Inc.
Test & Measurement
(tel) 1 877 894 4414
EUROPE
Agilent Technologies
Test & Measurement
European Marketing Organization
(tel) (31 20) 547 2000
JAPAN
Agilent Technologies Japan Ltd.
(tel) (81) 426 56 7832
(fax) (81) 426 56 7840
LATIN AMERICA
Agilent Technologies
Latin America Region Headquarters, USA
(tel) (305) 267 4245
(fax) (305) 267 4286
AUSTRALIA and
NEW ZEALAND
Agilent Technologies Australia Pty Ltd.
(tel) 1-800 629 4852 (Australia)
(fax) (61 3) 9272 0749 (Australia)
(tel) 0-800 738 378 (New Zealand)
(fax) (64 4) 802 6881 (New Zealand)
ASIA PACIFIC
Agilent Technologies, Hong Kong
(tel) (852) 3197 7777
(fax) (852) 2506 9284
You can visit our Web site: - http://www.agilent.com/find/assist.
40