1
660
decrements the counter.
collected automatically.
Rohrer
Statistics for counters are
3.5 TRAFFIC LIMITS AND BLOCKS
AutoMod has a powerful means of controlling the
number of entities that can be either in processes or
occupying physical space. Process traffic limits control
the number of loads that are either on their way to or are
in a process. Blocks control the number of entities
occupying a physical space, which is very useful for
preventing transporter vehicle collisions.
Blocks may have any capacity, but the capacity is
generally set to one. Transporter vehicles (AGVs, fork
trucks, etc.) and loads increment blocks automatically
when moving through the physical space defined by the
block. Loads can also claim blocks in process logic, as
directed by the user. Blocks can have any 3-D shape,
including combinations of cylinders, cubes, cones, or
frustrums.
3.6 TEXT LABELS
AutoMod provides the ability to use text labels to
enhance model communication. Labels may be added to
any location in the model’s physical space, and they can
either be static or dynamic during the simulation. Labels
can rotate when the animation view changes or can be
attached to a fixed position on the screen.
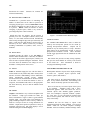
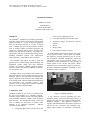
Figure 3. AutoMod Timeline Business Graph
3.9 RUN CONTROL
The AutoMod run control allows users to define the
warm-up and steady-state periods for the model by
resetting time-persistent statistics. Reports can be
printed for any run control period, or “snap.” Business
graph output can be automatically created, as well as
post-processed animation records. These animation
records can be played back after the simulation run with
AutoViewTM.
Run control also provides an entity tracing capability
that gives the model builder an event-by-event account
of the model run. Trace information is useful in
verifying and validating a model.
3.7 TABLES
4 PICTURE CONSTRUCTION IN 3-D
Tables in AutoMod supply the user with the means to
collect statistics on any model entity and to classify those
statistics for better understanding of their distribution.
Tables automatically provide average, standard
deviation, maximum, and minimum for all values entered
in the table. Users can define the number of “bins” or
categories, and AutoMod adds values to the appropriate
bin when directed by the user with the tabulate action
statement.
Both dynamic and static objects can be displayed during
a model run.
Dynamic objects represent loads,
resources, queues, and statistics.
3.8 GRAPHS
Graphs in AutoMod are easy to define and update with
the animation. Graph types include bar charts, pie
charts, and timelines. Figure 3 shows a typical timeline
business graph. Any model entity can be attached to a
graph, including transporter vehicle velocity, number of
loads on a conveyor section, or average utilization of a
machine. Graphs can be printed or plotted to a variety of
supported output devices, and graph displays can be
controlled using the AutoMod language.
The static layout is the background graphics of the
plant. It may contain column lines, aisle markings, and
walls. Labels can identify specific areas in the facility.
There are several ways to create a layout of the system
to be modeled.
AutoMod comes with a threedimensional graphics editor that allows the user to
construct objects from standard graphic primitives.
Cone, box, hemisphere, trapezoid, frustrum, cylinder,
arc, vector (list), set, text, and triad are primitives that
can be selected, placed, and scaled to create any static
entity in the facility.
AutoMod also has the ability to import CAD
information through the IGES standard. The acronym
“IGES” stands for the Initial Graphics Exchange
Standard. IGES is an industry standard exchange format