1
User Manual
Histolab
Analysis of histological tissue
edition 8
Histolab 8
July 2003
Table of contents
1. Overview of Histolab
Starting up Histolab
The Histolab work sheet
The menus
The toolbar
The tabs, pages and documents
The status bar
The structure of a work session
Preparing the equipment
Preparing the study
The slide analysis
Using the results
Protecting the settings
2. Preparing the equipment
Image acquisition
Access to the stage controller
System calibration
Setting the autofocus
3. Preparing the study
Defining the study
Setting the detection of structures
Setting fixed thresholding
Setting adaptative thresholding
Setting smoothing
Defining a macro
Choice of separation
Setting the criteria
Definition of scanning
Saving a study
Saved templates and files
4. The slide analysis
Pre-viewing the slide with a motorized stage
Plotting a reference area
Repositioning a sample
Selecting the structure
Histolab - manuel d’utilisation
4
4
5
6
7
8
8
9
9
9
10
10
10
11
11
12
12
12
14
14
16
17
18
18
19
20
20
20
21
22
23
23
23
24
25
page 2 / 43
Table of contents
Using the measurement tools
Measuring the intensity
Checking the measurements
Correcting the errors
Validating a measured field
Automatic sample measuring with a motorized stage
5. Overview of the section
Exportation
6. Measurements table
Exportation
7. Statistics and Graphs
The statistics
The counting table
The histogram of a measurement
Exportation
25
27
27
28
28
29
30
32
33
35
36
37
37
37
39
8. Page layout and Report print-out
40
9. Secure operating modes
43
Histolab - manuel d’utilisation
page 3 / 43
1. Overview of Histolab
Histolab has been devised in order to take several kinds of measurements on various types of
histological tissue. It thus provides rich functionalities for processing images, printing images and
numerous interactive and powerful measurement tools. We have taken particular care with
regards to simplicity and comfort of use and we wanted the documents produced to be usable
straight away: annotation of the images, print-out of the images and the results, storage in files
that can be manipulated with other applications.
Histolab provides for the accumulation of measurements in an unlimited number of fields. It
allows the simultaneous analysis of several types of structures. Statistics concerning each type
of structure are provided at all times.
The measurements provided are as follows: X-axis and Y-axis of the centre, length, width,
perimeter, surface and light intensity. The results are all expressed in real units, either in a
comprehensive table or summed up with statistical values.
Histolab provides the user with a whole range of measurement tools, thus adapting to many
kinds of histological sections. Certain tools are automatic, i.e. once they have been set, they
measure a structure on all (or part) of the field displayed in the video window. Other tools are
pure plotting tools, particularly for counting, measuring thicknesses or even for when the
colorations of the section are not sufficiently homogeneous to be detected with shade criteria.
Finally, everything is done so that the user can use the results provided by Histolab as smoothly
as possible: a work sheet can be saved and resumed later. The results, statistics and counts can
be exported to common calculation applications, either in compatible files or simply by using
Copy / Paste. Finally, images, lists of values and statistics can be edited on a printer.
Histolab - manuel d’utilisation
page 4 / 43
Starting up Histolab
A Histolab shortcut is normally accessible in the "Microvision" program group, situated in the
"Programs" menu within the Windows "Start" menu.
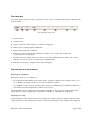
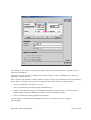
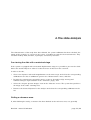
The Histolab work sheet
The work sheet is the window displayed when Histolab starts up. It contains the standard
elements of the Windows environment: the title bar (1) which includes the system menu box (on
the left), and the window enlargement / reduction boxed (on the right), the menu bar (2)
provides access to all of the software's functions. When the sheet does not occupy the entire
screen, it can be moved (by clicking on the title bar) or deformed (by clicking within the frame).
The toolbar (3) contains some buttons for quickly accessing the software's most used functions.
On the left of the sheet, some tabs (4) allow you to display either the video image or various
documents that are representative of the work in hand: a mapping or a histogram of the fields
measured, the measurements table, a graph and statistical tables, the printed report.
The video image or the document occupies most of the sheet (5). They are bordered by rules (6),
graduated in real units, and by scroll bars (7) that are active when the document or image is
larger than the window itself.
In the lower part of the work sheet, the status bar (8) contains information relating to the work
in progress.
Histolab - manuel d’utilisation
page 5 / 43
1
2
3
4
5
6
7
8
The Histolab work sheet
The menus
They provide access to all Histolab functions. Here is a quick overview of them:
•
the "File" menu is dedicated to the studies: start of a study, and definition of its main
properties; saving the study, exporting and printing the results. It also enables you to archive,
load and print images.
•
the "Edit" menu provides classic "Copy/Paste" functions that allow you to exchange images
or documents between several different software applications. You can also cancel an action
and access the image annotation module.
•
the "Image" menu is dedicated to video management: acquisition, storage and improvement
of images.
•
the "Measure" menu contains the functions used during a study: system calibration,
properties of the study, choice of structures and measurement tools.
•
the "Results" menu concerns the documents presented on the "Table", "Results" and
"Report" pages. It also provides access to dialog boxes for defining the contents of these
Histolab - manuel d’utilisation
page 6 / 43
documents and items allowing you to display certain of them in windows that remain visible
at all times.
•
the "Layout" menu contains various more general options: personalising the environment and
options for plotting measurements.
•
the "?" menu: information about the Histolab software and secure operating modes.
The functionalities provided in these menus are described in detail in the "Reference Manual".
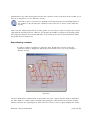
The toolbar
The toolbar provides quick access to certain frequently used functions and information:
1
2
3
4
5
6
7
8
The Histolab toolbar
1. Commonly used video functions (from left to right): "Acquisition", "Freeze image",
"Automatic contrast", "Image integration".
2. Activation / Deactivation of position tracking, when the system is equipped with an indexed
or motorized displacement stage.
3. Name of the structure being measured. This is a local menu: click on it to display the list of
the defined structures and it allows you to change the structure.
4. Setting the detection of the selected structure.
5. Switching from field to field:
With a motorized stage, all of the buttons are active. The displacement buttons pilot the
stage; the button on the left allows you to define an initial position.
With an indexed displacement stage, the buttons are inactive: moving the stage changes the
field.
With a manual system, the field displacement buttons are active and allow you to display the
measurements already taken.
6. Measurement of a structure / Measurement of all of the structures / Measurement of the
sample (motorized systems).
7. Interactive measurement tools (from left to right): selection of objects, measurement in a
manually plotted area, counting, plotting a contour, plotting a segment, measurement of the
reference light intensity. The tools are validated according to the type of structure selected.
Histolab - manuel d’utilisation
page 7 / 43
8. Setting the properties for the displayed documents: measurements displayed in the tables,
definition of the graph, report page layout.
The tabs, pages and documents
The tabs located on the left of the window allow you to display five pages that are
representative of the current study:
•
The real time video image is of course the most important page as it allows you to observe
the sample and to take the measurements.
The video image and the possibly superimposed profiles can be saved or printed using the
corresponding options in the "File" menu. A part of the image can be boxed and then
transferred to another software, using the "Copy" option in the "Edit" menu.
•
The "Overview" page presents a background history of the fields measured: all of the objects
plotted are shown, superimposed on the image that is under the camera while the
measurement is being taken.
When the system is equipped with an indexed or motorized displacement stage, the
background history is replaced by a mapping of the sample, in which the images and
measurements are plotted in their real positions.
The overview (background history or mapping) can also be displayed in a separate window
and included in the printed report. A part of the overview can be boxed, copied, and then
transferred to another software application.
•
The "Table" shows all of the objects plotted during the study (one object per line) and a
certain number of measurements chosen by the operator for each one.
The measurements table can be inserted into the report. A part of the table can be selected,
copied, and transferred to a spreadsheet program.
•
The "Results" page allows you to display four separate documents: the statistical values
calculated for each structure, the counting table, a distribution histogram as a graph and as a
table.
These four documents can be displayed individually in separate windows, included in the
report, or copied to an external software application.
•
The "Report" is a true copy of the document that is likely to be printed. It always follows the
progress of the work in hand.
The report page layout can be personalised: size and contents of the header and footer, title
and order of the printed documents.
Histolab - manuel d’utilisation
page 8 / 43
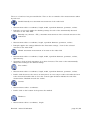
The status bar
The status bar is situated at the very bottom of the sheet. It contains information relating to the
work in hand:
1
2
3
4
5
6
7
8
The Histolab status bar
1. System date.
2. System time.
3. Scale in which the video image or overview is displayed.
4. Name of the currently applied calibration.
5. Name of the image file, if loaded.
6. Reference of the sample being analysed (or name of the "study" file in which the
measurements are recorded)
7. Position of the crosshairs when you click on one of the graduated rules. When you use the
framing tool, the size of the selected area is displayed here.
8. Indicator of memory occupied on the microcomputer.
The structure of a work session
Preparing the equipment
During this stage, you essentially set:
•
the acquisition and framing of the video image: using the options in the "Image" menu, you
try to display the image on the screen with a sufficient contrast.
•
the calibration of the system, operation that consist in establishing the equivalence between a
real distance and the length that is visible on the screen.
The preparation of the equipment is presented in Chapter 2. The reference manual deals with
many aspects of this in detail (video acquisition in Chapter 4, calibration in Chapter 5).
Preparing the study
The preparation of the study consists in providing the software with the number and the names
of the structures to be measured as well as some of the properties of the sample to be analysed
Histolab - manuel d’utilisation
page 9 / 43
and, if the system is equipped with a motorized stage, the form and the size of the area to be
scanned.
Then, the "detection" of each structure is set, i.e. all of the image processes that will lead the
equipment to detect the structure in the video image. The programmed processes are
summarised in a palette that can be displayed via the "Measure" menu.
These operations are described in Chapter 3.
The slide analysis
The analysis can be completely automatic if the system is equipped with a motorized stage and
if the slide preparation is sufficiently homogeneous so that the settings made may apply to the
entire sample, from one end to the other. Otherwise, the analysis is semi-automatic: after having
positioned the microscope stage so that the area of interest is displayed in the video image, the
operator must select the structure then he wants to analyse and then a measurement tool.
Chapter 4 is dedicated to taking measurements with both manual plotting tools and automatic
measurement tools.
Chapter 5 presents the "Overview" page which displays the mapping of the section or the
background history of the measurements taken.
Using the results
This final stage consists in defining the presentation for the tables and graphs provided as well as
the page layout for the measurement report.
These functions are described in Chapters 6 to 8.
Protecting the settings
The settings made during the first two stages are fundamental and determine the validity of the
measurement results. It is possible to restrict access to these settings by setting the software to
a secure operating mode.
The secure operating modes are described in Chapter 9.
Histolab - manuel d’utilisation
page 10 / 43
2. Preparing the equipment
Image acquisition
The first stage consists in acquiring the image of the field to be measured. It is stored in the
image memory, and a part of it is displayed on the work sheet.
Real-time acquisition is activated using this button or the "New image" option.
This button automatically improves the image contrast.
It may be useful to freeze the image using this button or the "Freeze image" option.
Acquisition by integration is used when the light intensity is very weak: the image is
acquired with a special camera, called "an integration camera". The image integration
is set via the corresponding item in the "Image" menu.
During a study, image acquisition is repeated for each analysed field. The techniques mentioned
here are described in detail in Chapter 4 of the Reference Manual.
Histolab - manuel d’utilisation
page 11 / 43
Access to the stage controller
If an indexed or motorized displacement stage is installed, it is controlled by an independent
software application. The necessary settings are set at the factory or during commissioning of
the equipment.
This software can be displayed via the "Show stage driver" item in the "?" menu: the streaked
button on the bottom right of the display provides access to the menu and to the material
settings; the red button, on the bottom left, closes the display, as it is of no use during normal
use of Histolab.
System calibration
This stage is fundamental as it conditions the validity of the measurements that will be taken. It
is used more or less frequently depending on the optical system used:
•
If you often modify the optical system (magnification of an objective, modification of the
position of the camera on the bracket), you have to recalibrate the system after each
modification using the "Define..." option in the "Calibration" sub-menu of the "Measure"
menu.
•
If you have an optical system with a few pre-defined positions (objectives of the microscope,
for example), you just have to activate the correct distance scale from those provided by the
"Calibration" sub-menu in the "Measurement" menu.
•
Finally, if you use a fixed optical system, you could make do with a routine inspection: place a
ruler or a micrometer under the camera and check that the graduations match those
displayed by Histolab.
For more precisions, refer to Chapter 5 of the Reference Manual.
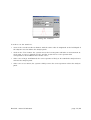
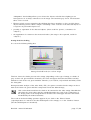
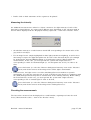
Setting the autofocus
If the observations are made with a microscope equipped with a motorized focusing axis (threeaxis motorized system), it is possible to carry out automatic focusing during the analyses.
This operation requires a setting that depends on the objective chosen. The "set autofocus..."
item is available in the "Measure" menu. It displays the following dialog box:
Histolab - manuel d’utilisation
page 12 / 43
Setting the autofocus
In order to set the autofocus:
•
enter in the second text box a distance with the same order of magnitude as the field depth of
the objective used: it defines the analysis pitch.
•
click on the "Test" button: the system moves the focusing axis and takes a measurement at
each stage. A curve is plotted (in red), and the system moves to the position that
corresponds to the maximum level of this curve.
•
if the curve is large and flattened, the correct position is likely to be outwith the analysed zone:
increase the analysis pitch.
•
if the curve is too narrow, the system is likely to miss the correct position: reduce the analysis
pitch.
Histolab - manuel d’utilisation
page 13 / 43
3. Preparing the study
Defining the study
During this first stage, the user defines the structures that he wishes to analyse and documents
the study that is starting (reference of the section, name of the operator, comment(s)). This is
done using the "New study..." item in the "File" menu.
Histolab - manuel d’utilisation
page 14 / 43
The structures are used for coherently grouping together the measurements, especially for the
statistical calculations.
The name of each structure is indicated in the left column. It can be modified once it has been
partially or totally selected.
Each structure will contain a certain number of figures whose type determines the measurements
taken. This is selected in the local menu situated in the centre of the list, which features:
•
"points" intended for carrying out counts,
•
"lines" intended for measuring lengths and thicknesses,
•
"objects" intended for carrying out individual geometric measurements on closed contours:
length, width, equivalent diameter, perimeter, surface and light intensity.
•
"areas" intended for taking global measurements.
All of the figures can be plotted manually. All of them, except lines, can be acquired
automatically.
Histolab - manuel d’utilisation
page 15 / 43
The structures taken can be restricted inside a "reference area" by using the local menu situated
to the right to the list: unless otherwise stated, measurements are taken for the entire video field.
The local menu features the structures that can be considered as the reference area (they are
defined by a closed contour).
Setting the detection of structures
Setting the detection of structures with automatic tools is presented in a palette that is
displayed by pressing this button or via the "Detection settings..." item in the
"Measure" menu.
You first choose whether to apply automatic detection or not (depending on whether the
structure to be measured is in a homogeneous shade or not).
The detection setting palette
Structures in an image are detected in four stages:
•
Thresholding, which extracts the phase to be measured from the image. There are two
methods:
"Fixed" thresholding consists in manually setting the values of shades characterising the
objects. This method allows greater precision of detection but requires stable lighting and
uniform preparation of the samples. There are two versions that take account of either the
grey levels in the image or the levels of each of the red, green and blue components.
Histolab - manuel d’utilisation
page 16 / 43
"Adaptative" thresholding allows you to detect the objects in fields where lighting is not
homogeneous. It is always carried out on an image converted into grey levels. The detection
takes a few seconds.
•
Filtering, which corrects imperfect thresholding that leaves artefacts or does not fully detect
objects. Filtering can be either a simple "smoothing" of the contours of the detected objects or
a sequence of personalised processes.
•
possibly, a separation of the detected objects (often useful for "points", sometimes for
"objects"),
•
the application of a criteria to the measured values (this stage is also optional, useful for
"objects").
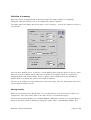
Setting fixed thresholding
It is set in the following dialog box:
Setting threshold levels for a colour image
This box shows the shades present in the image (depending on the type of image, in shades of
grey or three red, green and blue channels), the lower and upper detection thresholds currently
defined for each of the red, green and blue channels (or, if need be, only in black and white) under
the histogram.
During automatic analysis of the video field (<F5>), the points considered in the image are those
with each of their red, green and blue components inside the defined range,
click on this button and box the shade to be extracted in the video image. Histolab then
calculates the mean value and the standard deviation for each of the components of
the image points in the designated area and the lower and upper detection thresholds
modulated by the defined tolerance.
The result of the thresholding operation appears if you click on the "Phase" button
(superimposition of a mask on the thresholded parts of the image) or on the "Outlines" button
(the thresholded parts are bordered).
Histolab - manuel d’utilisation
page 17 / 43
If the detection carried out is not satisfactory, there are several ways of adjusting it:
•
If the field measurement has "missed" elements in the structure being analysed: increase the
tolerance if elements have been unduly allocated to the structure: reduce the tolerance.
•
If the setting is still not satisfactory, it is possible to individually modify the upper and lower
levels for each of the red, green and blue channels by clicking on one of the coloured bars until
the threshold reaches the desired value.
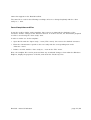
Setting adaptative thresholding
This method is set with the following dialog box:
Setting adaptative thresholding
This dialog box indicates:
•
the general shade of the objects,
•
a size parameter that corresponds to the radius (in pixels) of the largest objects to be
detected,
•
the minimum shade variation to be taken into account between the objects and the image
background.
As in the previous case, the result of the thresholding operation appears if you click on the
"Phase" button (superimposition of a mask on the thresholded parts of the image) or on the
"Outlines" button (the thresholded parts are bordered).
Setting smoothing
The smoothing dialog box is presented as follows:
Setting smoothing
Histolab - manuel d’utilisation
page 18 / 43
If small insignificant objects interfere with the measurement: increase the smoothing; if various
elements of a structure are assimilated, reduce the smoothing.
The result of the thresholding operation appears if you click on the "Phase" button
(superimposition of a mask on the thresholded parts of the image) or on the "Contours" button
(the thresholded parts are bordered).
Defining a macro
A "macro" is a series of cleverly arranged image transformations: it is defined in the following
window:
Definition of a sequence
The dialog box that appears shows on the left a list of the transformations that can be applied
to the image. Here is a brief description of the possible transformations:
•
closing: gap filling with contour smoothing.
•
opening: removal of the minor artefacts with contour smoothing.
•
geodesic closing: gap filling while preserving the contours.
•
geodesic opening: removal of the minor artefacts while preserving the contours.
•
filling: filling all of the holes, whatever their size, while preserving the contours.
•
objects on the edge: removal of the objects entirely contained in the field.
•
removal of 2 edges: removal of the objects intersecting the upper edge or the left edge of the
field.
•
removal of 4 edges: removal of all of the objects intersecting one of the field edges.
•
maximum size: removal of the objects that are larger than the indicated parameter while
preserving the contours.
The list on the right is the sequence formed by some of these transformations. Proceed in the
following way to include a transformation:
•
click in the left-hand area on the desired transformation and then click on the "+" button (or
simply double-click in the left-hand area on the desired transformation): the transformation is
Histolab - manuel d’utilisation
page 19 / 43
then placed at the end of the list.
•
click on the button marked with an arrow in order to move the transformation to the desired
location.
•
if required by the transformation, indicate the size then validate with the <Enter> key.
The effects of the sequence on the image can be visualized by placing the switch on the right in
the "Phase" or "Outlines" position.
Choice of separation
Separation is useful for structures for which an object count has been carried out (object count or
measurement). It allows you to consider to a certain extent objects that appear to be
agglomerated as separate objects.
Three automatic separation methods are available:
•
rapid for only separating large objects;
•
standard for separating medium-sized objects;
•
fine for separating small objects.
Setting the criteria
It is possible to terminate detection with classification according to one of the measurements
taken, using the following dialog box:
You should indicate a min. and/or max. size for the detected objects.
The effects of the sequence on the image can be visualized by placing the switch on the right in
the "Phase" or "Outlines" position.
Histolab - manuel d’utilisation
page 20 / 43
Definition of scanning
When the system is equipped with a motorized stage, the sample analysis is completely
automatic. The form and the size of the sample must then be defined.
The upper part of the dialog box shown above ("Set scanning..." item in the "Measure" menu) is
used for this:
The zone thus defined can be scanned in several different ways with the options in the two other
parts. You can for example define exhaustive scanning of the sample (check the "Include the
peripheral fields" and "Joining fields" boxes) or prefer a more rapid analysis (by defining the
disjoint fields or by letting the system chose fields at random).
The zone to be analysed is represented in the "Overview" page. The size and position of the zone
can be adjusted with the mouse.
Saving a study
While the measurements are being taken, it is recommended to save the measured values on a
regular basis. The "Save study" item in the "File" menu is used for that purpose.
The first time this item displays the standard Windows dialog box in which you should indicate a
directory and a file name to identify the study (the suffix ".hlb" is automatically added). This
Histolab - manuel d’utilisation
page 21 / 43
name then appears in the Histolab toolbar.
The same file is used for the following recordings unless it is changed explicitly with the "Save
study as..." item.
Saved templates and files
It may be useful to define study templates that conserve in particular the definition of the
structures and the settings for the detection thereof. In order to do this, the information prepared
in a file is saved using the "Save study" item.
In order to make use of this template:
•
Open the file with the "Open study..." item ("File" menu): this restores the defined structures.
•
Enter the characteristics specific to the new study with the corresponding item in the
"Measure" menu.
•
Define a new file with the "Save study as..." item in the "File" menu.
Note: the template files can be protected from any accidental changes: from within the Windows
Explorer, display the properties of the file, and check the "Read only" box.
Histolab - manuel d’utilisation
page 22 / 43
4. The slide analysis
The characteristics of the study have been defined, the system calibration has been checked, the
image of the section(s) is correct on the screen: everything is ready for the measurements. They
are taken field by field, and then, in principle, structure by structure.
Pre-viewing the slide with a motorized stage
If the system is equipped with a motorized displacement stage, it is possible to pre-view the slide
before the actual analysis in order to locate the areas of interest in the overview.
In order to do this,
•
Choose an objective with weak magnification on the microscope and select the corresponding
calibration in the list of calibrations given in the "Measurement" menu, and then
•
Position the scanning area around the tissue section to be analysed (by moving and
redimensioning its representation in the "Overview" page), and
•
Select the "Acquire preview images" item in the "Measure" menu. The system then produces
an image of the entire scanning area.
•
Return to the desired objective for the analysis and select the corresponding calibration in the
list.
Plotting a reference area
If, when defining the study, a structure has been defined as the reference area, it is generally
Histolab - manuel d’utilisation
page 23 / 43
plotted before any other measurement. Select this structure in the local menu in the toolbar (or in
the list of "Structures" in the "Measure" menu).
Once this is done, select the free plotting tool by pressing the corresponding button in
the toolbar (or by selecting the "Outlines" item in the list of "Tools" in the "Measure"
menu).
Then scan the sample and point at as many points as necessary in order to describe the section
edge with the desired precision. However, the greater the number of points in the plotted profile,
the longer the analysis of each field will take, as an inclusion test for each measurement within
the profile must be carried out.
Repositioning a sample
In order to replace a sample in a reference area, display the overview (select the
"Overview" page or display the palette by pressing the <F12> key or by using the
"Results" menu).
Overview
Locate a detail that is characteristic of the profile, move the section until the detail is situated in
the video field (i.e. until the white rectangle representing the video field in the overview and the
detail in question are superimposed), then close the overview (<F12>) again, display the "Video"
Histolab - manuel d’utilisation
page 24 / 43
page and
press this button or select the "Disengage stage" item in the "Measure" menu) in order
to stop controlling the profiles at the position of the microscope stage; then move the
stage until the located detail is superimposed on the corresponding tissue. Press this
button again to return to automatic position control.
Selecting the structure
There are three methods for selecting the structure:
•
In the "Measure" menu, the "Structures" item opens a sub-menu containing the names of
the defined structures: you just have to select the required structure which is then checked.
•
The name of the structure currently selected is displayed in the toolbar. This is a pull-down
menu: clicking on it displays the other structures.
•
During the measurements, there is a quick means of switching from one structure to the
next: the "Next structure" item in the "Measure" menu, and in particular the corresponding
keyboard shortcut, the <F4> key.
A colour, used for plotting the readings, is associated to each structure. The colour appears in
particular in the toolbar and in the pull-down menu. In order to change the colour of a structure,
you should use the "Drawings colors" item in the "Layout" menu.
Using the measurement tools
Manual or automatic measurement tools are provided depending on the type of structures
chosen. The manual tools can be used directly whereas the automatic tools must be at least set
at the start of a section analysis:
•
The "Tools" item in the "Measure" menu opens a sub-menu that contains the tools list. The
selected tool is checked.
•
If the toolbar is displayed, each tool is represented by a button. The button corresponding to
the selected tool appears depressed (sometimes, none of the buttons may be depressed at the
start of a study). Most of the tools are used with the mouse by carried out a sequence of
actions of the type <press>, <move>, <release>; each action is used for reading a particular
point either in the selected area in the video image or in the plotted figure. The mouse buttons
can be used indifferently.
No special keys on the keyboard are used, with one exception: the <Shift> + <F5> keys for
automatic analysis of the entire video field and the <F5> key for automatically detecting a
structure in the entire video field.
Histolab - manuel d’utilisation
page 25 / 43
The uses of each tool are presented below. There is also a reminder of the measurements taken
by each tool.
Double butterfly net: automatic measurement of the video field
•
Measurements taken: coordinates, length, width, equivalent diameter, perimeter, surface.
•
Principle: successively applies the defining settings for each of the automatically detected
structures to the video field.
Butterfly net (shortcut: <F5>), automatic measurement of the selected structure in the
video field
•
Measurements taken: coordinates, length, equivalent diameter, perimeter, surface.
•
Principle: applies the settings defined in the "Detection settings..." box for the selected
structure to the video field.
Wizard: automatic measurement of an area in the video field
•
Measurements taken: coordinates, length, width, equivalent diameter, perimeter, surface,
light intensity.
•
Operation: click on both extremities of an area of interest. This area is then automatically
analysed according to the defined settings.
Free outlines
•
Measurements taken: coordinates, length, width, equivalent diameter, perimeter, surface.
•
Profile: click then move the mouse as many times as necessary in order to describe the form
to be measured. Double-click to close the contour again and thus indicate the end of the
measurement. Histolab smooths the outline.
Counter
•
Measurements taken: coordinates.
•
Profile: click on the location of the point to be marked.
Thickness
•
Measurements taken: coordinates, length.
Histolab - manuel d’utilisation
page 26 / 43
•
Profile: click on both extremities of the segment to be plotted.
Measuring the intensity
An additional measurement is taken for "object" structures: the light intensity of each of the
detected or plotted objects. It is expressed in different ways depending on the selection made in
the box that is displayed via the "Displayed intensity expressed..." item in the "Results" menu:
•
the absolute intensity is a value between 0 and 255 corresponding to the mean value of the
grey levels in an object.
•
For an image from a sample highlighted in white light (transmission lighting), it can be more
interesting to express the light absorption rate for each of the detected objects (for example
for analysing the intensity BRDU marking on a histological section). Before taking the
measurements, in this case, you must provide the system with a light reference
corresponding to 100% of transmitted light (i.e. an absorption rate of 0%). In order to do
that,
press this button (or select the "Measure background intensity" item in the "Measure"
menu) and click in an area of the image where all the light is transmitted.
•
In fluorescence, the light source is used for stimulating fluorescent markers in specific
wavelengths. It is then the emission rate of each of the fluorescent objects in comparison with
the (dark) background intensity that is characteristic of the marking intensity. Before taking
the measurements, in this case, you must provide the system with a light reference
corresponding to 0% of emitted light. In order to do that,
press this button (or select the "Measure background intensity" item in the "Measure"
menu) and click in an area of the image where nothing fluoresces.
Checking the measurements
The last values measured can be displayed in a small window, superimposed onto the work
sheet ("Measurement results..." item in the "Results" menu).
Histolab - manuel d’utilisation
page 27 / 43
Results expressed
Correcting the errors
In the case of an error during plotting or automatic measuring, there are several solutions:
•
The last profile (or the last measurement) can be cancelled with the corresponding function in
the "Edit" menu.
This tool allows you to select a profile... The "Delete" item in the "Edit" menu deletes
the selected profile. If the profile contains handles, it is possible to correct it by clicking
on one of the handles and, with the mouse button depressed, bringing it to the desired
location.
•
A measurement of the section that is being analysed can be deleted by removing the
corresponding line from the results table.
It is recommended to save the current study on a regular basis. In the event of any wrong
manipulations that are not seen at once and that can not be cancelled afterwards, re-opening the
file with the corresponding item in the "File" menu still remains possible.
Validating a measured field
Press this button (or select the "Next field" item in the "Measure" menu) to validate the
measurements already taken and to analyse a new field. Then move the section on its
base until the field to be analysed is fully displayed in the video image.
This button allows you to return to a previously measured field.
Note: these buttons are invalidated when the microscope is equipped with an indexed
displacement stage connected to the computer: you just have to move the stage to measure a
new field or to return to a field already measured. When it is equipped with a motorized
displacement stage, these buttons allow you to move from one field to another.
Histolab - manuel d’utilisation
page 28 / 43
Automatic sample measuring with a motorized stage
Move the sample to the upper left corner of the rectangle to be analysed (or the
summit of the circle) and press this button: it defines the position of the first scanning
field.
Click on this button: automatic scanning will begin.
Histolab - manuel d’utilisation
page 29 / 43
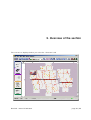
5. Overview of the section
The overview is displayed when you select the "Overview" tab.
Histolab - manuel d’utilisation
page 30 / 43
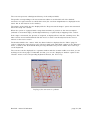
The overview presents a background history of the analysed fields.
The profiles corresponding to the measurements taken in each field for all of the defined
structures are represented in a scaled-down view (the overview magnification is displayed in the
status bar at the bottom of the window).
The images of the fields are also displayed if the "Keep measured images" option was activated
when the study was started.
When the system is equipped with a stage that transmits its position to the microcomputer
(indexed or motorized stage), the background history is replaced by a mapping of the section.
If the stage is motorized, the preview, if acquired, is displayed here with the scanning area. The
latter can be moved and deformed with the mouse so that it can be adjusted to the area of
interest on the tissue section.
The bordered field is the "active" field, the data of which is displayed in the "Video" page. In
order to change the active field, use the "Previous field" and "Next field" options in the "Measure"
menu, or click on the desired field while pressing simultaneously on the <Shift> and <Ctrl> keys
on the keyboard.
The overview can be displayed in a separate window and thus remain visible even when you are
working on the other pages of Histolab: for that, you use the "Display in window" option in the
"Results" menu or the corresponding keyboard shortcut, the <F12> key.
Display of the overview in a palette
Histolab - manuel d’utilisation
page 31 / 43
Exportation
•
Transformation of the overview into a single image: activate the "Frame" tool in the "Edit"
menu, and then frame the required zone. The "Copy" option allows you to transfer the
framed part to another software application.
•
Saving the measured images individually: in the "File" menu, use the "Export results" option
then the "Measured images" sub-menu.
Histolab - manuel d’utilisation
page 32 / 43
6. Measurements table
While the fields are being analysed, Histolab creates a table that groups together the values
measured. Each object occupies a line and is described by the analysis field number, the name of
the structure to which it belongs and by the result of the measurements taken.
The table is displayed by selecting the corresponding tab.
Histolab - manuel d’utilisation
page 33 / 43
The displayed measurements can be selected by pressing this button or by using the
corresponding item in the "Results "menu.
Selection of the displayed measurements
It is also in this window that you can choose the precision of a measurement by clicking on the
corresponding pull-down menu.
In order to choose the intensity expressed, display the following window via the "Measure"
menu:
Choose:
•
"Absolute intensity" to display the mean value of the grey levels in an object.
•
"Absorption rate" to analyse the intensity of marking on a histological section with
transmission lighting (white light).
•
"Emission rate" to analyse the intensity of marking on a fluorescent histological section.
Histolab - manuel d’utilisation
page 34 / 43
Exportation
Exporting the results consists in formatting the results obtained by Histolab so that they can be
used by external software applications (in general, spreadsheet programs). Two techniques are
available:
•
via the clipboard: select the block of cells. When it is highlighted, select the "Copy" option in
the "Edit" menu. Activate the destination software application and paste in the desired
position.
To select entire lines, click and drag in the legend columns. To select entire columns, click and
move in the heading lines. To select the entire table, click in the top left corner of the table.
•
via a "text" format file: in the "File" menu, use the "Export results" sub-menu then the
"Measurements..." item.
IMPORTANT NOTE: Exportation must not be confused with saving a study. A study file
contains the measurements and their environment but can only be read by Histolab. An
exported file only contains the value but can be read by other software applications. It is
always preferable to save the study, as you can then extract the values in order to export
them, whereas the reverse is not possible.
Histolab - manuel d’utilisation
page 35 / 43
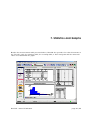
7. Statistics and Graphs
Besides the measurements table presented above, Histolab also provides four other documents in
the "Results" page: the statistics table, the counting table, a "bar" histogram and the numerical
values associated with the graph.
Histolab - manuel d’utilisation
page 36 / 43
The statistics
The statistics table contains the measurements taken for each structure. It may remain visible at
all times if the "Statistics" item of the "Display in window" sub-menu in the "Results" menu is
checked.
The counting table
The counting table displays field by field the results of the counts for each structure during a
study. Statistics for these counts are displayed at the end of the table. This table is updated
during the analysis of a tissue section.
It may also be displayed at all times if the "Statistics" item of the "Display in window" sub-menu
in the "Results" menu is checked:
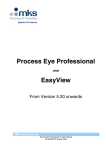
The histogram of a measurement
A particular measurement (length, width, diameter, perimeter, surface or intensity) can be
Histolab - manuel d’utilisation
page 37 / 43
analysed individually with a histogram; you must define size classes for the considered
measurement and choose which structure falls within the scope of the histogram. The histogram
is presented in the form of a "bar" graph; the number of objects in each class can also be
displayed.
Histogram of the lengths of all structures combined, and the corresponding values
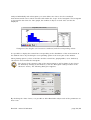
It is possible to display the normal law corresponding to the distribution of the measurement in
the defined classes by checking the corresponding option in the lower part of this window.
Other plotting options (colour of the bars and the normal law, graph gridline, curve thickness)
can also be chosen under the histogram.
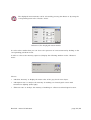
The choice of the structure, that of the measurement as well as limits of size classes
are defined by clicking on this button (or via the "Histogram settings" button in the
"Measure" menu). The following dialog box appears:
By checking the "Auto" boxes, it is possible to allow Histolab to adjust each of the parameters as
best it can.
Histolab - manuel d’utilisation
page 38 / 43
Exportation
•
to presentation software via the clipboard: click on the statistics title bar on the work sheet.
When the frame is highlighted, select the "Copy" option from the "Edit" menu. Activate the
destination software application and paste in the desired position.
•
to a spreadsheet program via a "text" format file: in the "File" menu, use the "Export results"
sub-menu, then the "counting..." or "statistics..." item.
Histolab - manuel d’utilisation
page 39 / 43
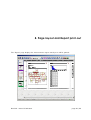
8. Page layout and Report print-out
The "Report" page displays the measurements report exactly as it will be printed:
Histolab - manuel d’utilisation
page 40 / 43
The page layout of this document is entirely customisable: the size and contents of the header
and footer, the order and title of the printed documents. You access it by
pressing this button or via the "Report settings..." item in the "Results" menu.
The first tab proposes you three types of headers:
•
a standard header not requiring to be set, which automatically includes the name of the
software, followed by the study reference.
•
a customisable header, for which you can define the height, the title and a logo that you will
have already placed in the clipboard.
•
a blank header for printing the report onto pre-printed paper. You then only set the height of
the space to be left blank.
The footer may include the software reference and page numbering or a given height may be left
blank for use with pre-printed paper.
Definition of the header and footer
The second tab is used for defining the contents of the report:
Histolab - manuel d’utilisation
page 41 / 43
The list shown allows you to choose the documents to be included in the report and to determine
the order and title.
The actual print-out is launched via the "Print report" item in the "File" menu.
Histolab - manuel d’utilisation
page 42 / 43
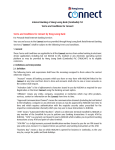
9. Secure operating modes
For the use of Histolab on slides with very constant shades, it may be interesting to freeze the
settings to prevent any accidental changes. Histolab provides the following three operating
modes:
•
The "Administration" mode is the normal working mode in which all software functions can
be accessed.
•
The "Operations" mode is a secure mode in which all routine operations are possible.
However, the settings are no longer accessible: they remain identical to those made in the
"Administration" mode.
•
the "Supervision" is a secure mode for which the conditions of access to the software's
functions are defined by a distinct software component, specifically developed for certain
companies.
The operating modes shown in the "?" menu
The "Security settings..." item allows the administrator to define the software operating mode
and to protect access to the "Administration" mode with a password.
Histolab - manuel d’utilisation
page 43 / 43